
Abstract
Ludhiana, the industrial hub of Punjab, North India, attracts a large number of migrants, many of whom face a range of exclusions. This study was undertaken to gather information on the availability of civic amenities relevant to Millennium Development Goal 7, including water supply, sanitation, drainage, electrical connections, and the condition of migrants’ housing. Thirty slum settlements, 15 notified and 15 non-notified, were randomly selected for the study, and 3,947 newer migrant households were purposively sampled and surveyed. More than a third of the surveyed households had no in-house piped water supply, over half still relied on open defecation, 40 per cent lacked metered electricity connections, and only 43 per cent had closed drains. The situation was much better for those in notified as compared to non-notified slums or open spaces. A relatively high proportion resided in higher-quality pucca houses, but this appears to have been due to their status as tenants, renting rooms from more established home owners.
I. Introduction
Millennium Development Goal (MDG) 7 targeted the reduction by half of the world’s population without sustainable access to safe drinking water and basic sanitation by 2015 and significant improvement in the lives of at least 100 million slum dwellers by 2020.(1) According to a report of the World Health Organization/United Nations Children’s Fund (WHO/UNICEF),(2) the world was on track to meet the MDG target for water but was seriously off-track for sanitation. Worldwide, in 2012, 768 million people were without access to improved drinking water, and approximately 2.5 billion people (one-third of the world’s population) are expected to remain without access to safe sanitation by 2015.(3) The impacts for health are significant. Globally, around 2.4 million deaths, or 4.2 per cent of all deaths, are related to the lack of sanitation and potable drinking water.(4) Every day 1,600 children continue to die from diarrhoeal disease, 90 per cent of which is related to water, sanitation and hygiene (WASH). Moreover, 50 per cent of child malnutrition and stunting is WASH related.(5) There has been greater success in meeting the target of improving the lives of 100 million slum dwellers. However, this target did not take into account the continued rapid increase in the numbers of slum dwellers worldwide.
India continues to face considerable challenges with regard to both sanitation and the prevalence of slum dwellers. Forty per cent of those who lack access to an improved sanitation facility, one billion people, live in South Asia, most of them in India. India notoriously has the world’s highest number of open defecators (597 million people or 48 per cent of the population). In contrast, India’s neighbouring country Bangladesh has only 3 per cent open defecators.(6)
About 50 million of India’s open defecators live in urban slums. In 2011, according to the census of that year, almost one-third of India’s population, or 377 million people, resided in urban areas, up from 286 million 20 years earlier. One in every six of these urban residents was estimated to live in a slum in 2011.(7) The growth in the urban population is inevitably associated with an increase in the proportion of the urban poor residing in slums, which outpaces the development of essential infrastructure. Slums are almost always initially informal settlements with no land tenure rights for residents, many of them migrants. Rapid and unplanned urbanization means a lack of basic amenities for many of these residents, including potable water, a proper sanitary environment and drainage, adequate housing and garbage disposal, which pose a series of threats to the health of slum dwellers.
Research in a number of cities has pointed to the extent of the challenges experienced. A recent survey by the Municipal Corporation of Mumbai, for instance, reveals that there is not a single on-premises toilet in nearly 200 Mumbai slums, compelling a million residents to defecate into overflowing drains, filthy dump yards and railway tracks.(8) Similar issues across urban India cause over 50 million men, women and children to defecate in the open every day. The Planning Commission has estimated that, although 49 per cent of the country’s urban population has access to a sanitary excreta disposal facility, only 28 per cent are connected to a sewerage system (partial, without a treatment facility in many cases), and 21 per cent have only a low-cost sanitary latrine facility. About 60 per cent of the generated solid waste is collected and disposed of, but only half of it in a sanitary manner. The study of the “Economic Impact of Inadequate Sanitation in India”, conducted by the World Bank’s South Asia Water and Sanitation Unit, claims that the lack of toilets and decent sanitation costs India nearly US$ 54 billion a year, or 6.4 per cent of its GDP. This is mainly through premature deaths, especially of children, treatment for hygiene-related illnesses, and lost productivity.(9) An article in the Journal of Water and Health suggests that the time lost in collecting water and seeking somewhere to defecate could be valued at US$ 63 billion annually.(10) Health impacts are, as noted, considerable. Zaheer et al.(11) showed that the introduction of treated and piped water in 14 towns of Uttar Pradesh was associated with a 43 per cent reduction in the diarrhoea mortality rate for all age groups in the five years following intervention.
II. Aims and Objectives
Reliable information regarding conditions in slum settlements in India is seriously lacking, especially information on particular groups such as migrants. The aim of the present paper is simply to add to the existing knowledge base regarding slum conditions relevant to the achievement of MDG 7.
The study on which this paper draws was carried out in Ludhiana, Punjab’s most populated and rapidly growing metropolitan city. Ludhiana had a population in 2011 of 1,618,879, approximately 15 per cent of which lived in slums.(12) This study is part of a national task force project entitled “Migration, poverty and access to healthcare: a study on people’s access and health system’s responsiveness in fast growing smaller cities”,(13) and it explores the provision of basic civic amenities like water supply and sanitation to migrant slum dwellers in Ludhiana, North India.
The present study is cross-sectional in nature and hence provides only a snapshot of the availability of the basic civic amenities to the migrant slum dwellers of Ludhiana at one point in time. Hence it cannot measure the progress here towards the MDG 7-related targets. Yet it adds valuable information about a vulnerable population, which can assist in guiding policy decisions.
a. Background
An important industrial town, Ludhiana is the textile and light engineering centre of India. Woolen garments, machine tools, dyes, cycle parts, mopeds, sewing machines and motor parts produced here are exported all over the world. Ludhiana accounts for 90 per cent of the country’s woolen hosiery industry and is nicknamed “The Manchester of India”. The world’s largest bicycle manufacturer, Hero Cycles, which produces nearly three million bicycles annually, is based here. And the rich agricultural area around the city supports a large grain market.(14)
The employment opportunities related to Ludhiana’s numerous industries have drawn people from neighbouring states, mostly Bihar, Madhya Pradesh, Rajasthan and Uttar Pradesh, resulting in massive population growth.(15) Ludhiana City had a population of only 30,000 in 1947.(16) Since 1951, it has witnessed a virtual explosion in population, with a decadal growth rate between 1981 and 1991 of 71.77 per cent, the third highest among metropolitan towns and cities in India.(17) In 1991, Ludhiana became the first metropolitan city of Punjab, defined as a city with at least a million people. Although the growth rate had slowed to 34.8 per cent between 1991 and 2001,(18) by 2001, Ludhiana City had a high density of 8,755 persons per square kilometre.
Ludhiana’s rapid growth, for the large part haphazard and unplanned, resulted in the mushrooming of unauthorized slums throughout the city, as well as poor urban infrastructure.(19) As in other Indian cities, civic amenities failed to keep pace with the rate of growth and the increasing demand for provision. The process of “notifying” slums, or formalizing their existence, was undertaken in Ludhiana in 1986 – and not again since then. Meanwhile, slum settlements have continued to spring up, and these newer settlements are all non-notified. The Municipal Corporation of Ludhiana (MCL) in theory provides basic civic amenities like water supply, electricity and sanitation to the notified slums, although as our data show, they do not reach all households. In recognition of the considerable needs, the Corporation has also decided to provide services to “non-notified” slums in a phased manner, and these non-notified slums identified for provision are considered to be “recognized”.
Information regarding the slum population in Ludhiana is unreliable and inconsistent. The only “authentic” source of information is the MCL. Its 2007 City Development Plan, which relies on data from a survey carried out by the MCL in 1998, notes 209 slum pockets or colonies, with a total population of 233,400 individuals and 63,046 households in 33,343 dwelling units. Of these 209 slums, 57 slums (71,400 people in 10,200 households) were reported to have been “upgraded” – that is, “provided with all basic infrastructure facilities like water supply, sewerage, roads and street lights”; 68 slums (a population of 72,898 with 10,414 households) were “partially upgraded” – that is, provided with facilities like water supply, roads and street lights but not with sewerage/toilets; and 84 slums had no infrastructure facilities. All the houses in upgraded slums and 65 per cent of those in partially upgraded slums were classified as pucca houses (i.e. composed of permanent materials, see below).(20)
Then two years later, in 2009, in preparation for the Census 2011, the MCL reported a total of just 91 slum settlements, 50 of them “notified” slums (population of 198,895 in 41,101 households) and 41 “non-notified” (population of 59,223 in 12,953 households). The total slum population was 258,118 in 54,054 households. The population, then, remained roughly consistent, but the number of slum settlements reported had dropped radically. For the purposes of the study reported on in this paper, the 2009 MCL figures have been used as a benchmark. None of the available data is disaggregated in terms of migrant and non-migrant population, so we have no information regarding the proportion of the migrant population in Ludhiana slums.
III. Materials and Methods
This study, cross-sectional in design, was carried out over a three-year period (1 August 2011–31 July 2014) to assess the status of newer migrant households in the slums with regard to the provision of basic civic amenities. A simple random sample of 15 notified and 15 non-notified slum settlements was taken from a list of 50 notified and 41 non-notified slums obtained from the MCL.
The population of the 15 notified slum settlements was 55,046 in 9,294 households (average family size 5.9), and that of the 15 non-notified slums was 36,440 in 8,048 households (average family size 4.5). Residents were a mix of local residents, older migrants, newer migrants and recent migrants. For the purpose of this study, the “older migrants” were considered to be those who migrated to the city 10 or more years ago, the “newer migrants” were those who have migrated to the city not less than 30 days and not more than 10 years ago, and “recent migrants” were those who migrated to the city within the last 30 days. The study included only “newer” migrant households.
a. Sample size estimation
The required sample size for the umbrella national task force study on healthcare services in the migrant slum population was calculated according to the relative precision formula
For the present paper, the minimum sample size required was calculated on the basis of the WHO/UNICEF 2010 report, which states(22) that 31 per cent of people in India had access to improved sanitation and 88 per cent to improved water supply. The lower figure of 31 per cent was considered for calculating the minimum sample size required at a 95 per cent confidence limit and 5 per cent allowable error, which was 3,399, using EpiInfo v6, Statcalc. A sample of 3,947 newer migrant families was studied.
b. Inclusion criteria
The study, as noted, included willing individuals who had migrated to Ludhiana less than 10 years ago, but more than 30 days ago. Newly arrived migrants and older migrants were excluded because the former have yet to settle down while the latter are by this time integrated into the local community. Households of eligible migrants were identified from various slum clusters in the city, using purposive sampling and the “snowball” technique – in other words, having identified an eligible household, information was obtained from that household to identify other newer migrant families in its locality/neighbourhood. The population in notified slums, which has been in existence for more than 25 years, is relatively stable, with fewer more recent migrants. Attempts were therefore made to identify clusters particularly from newer slums, non-notified slums and camps, where newcomers usually reside.
c. The sample
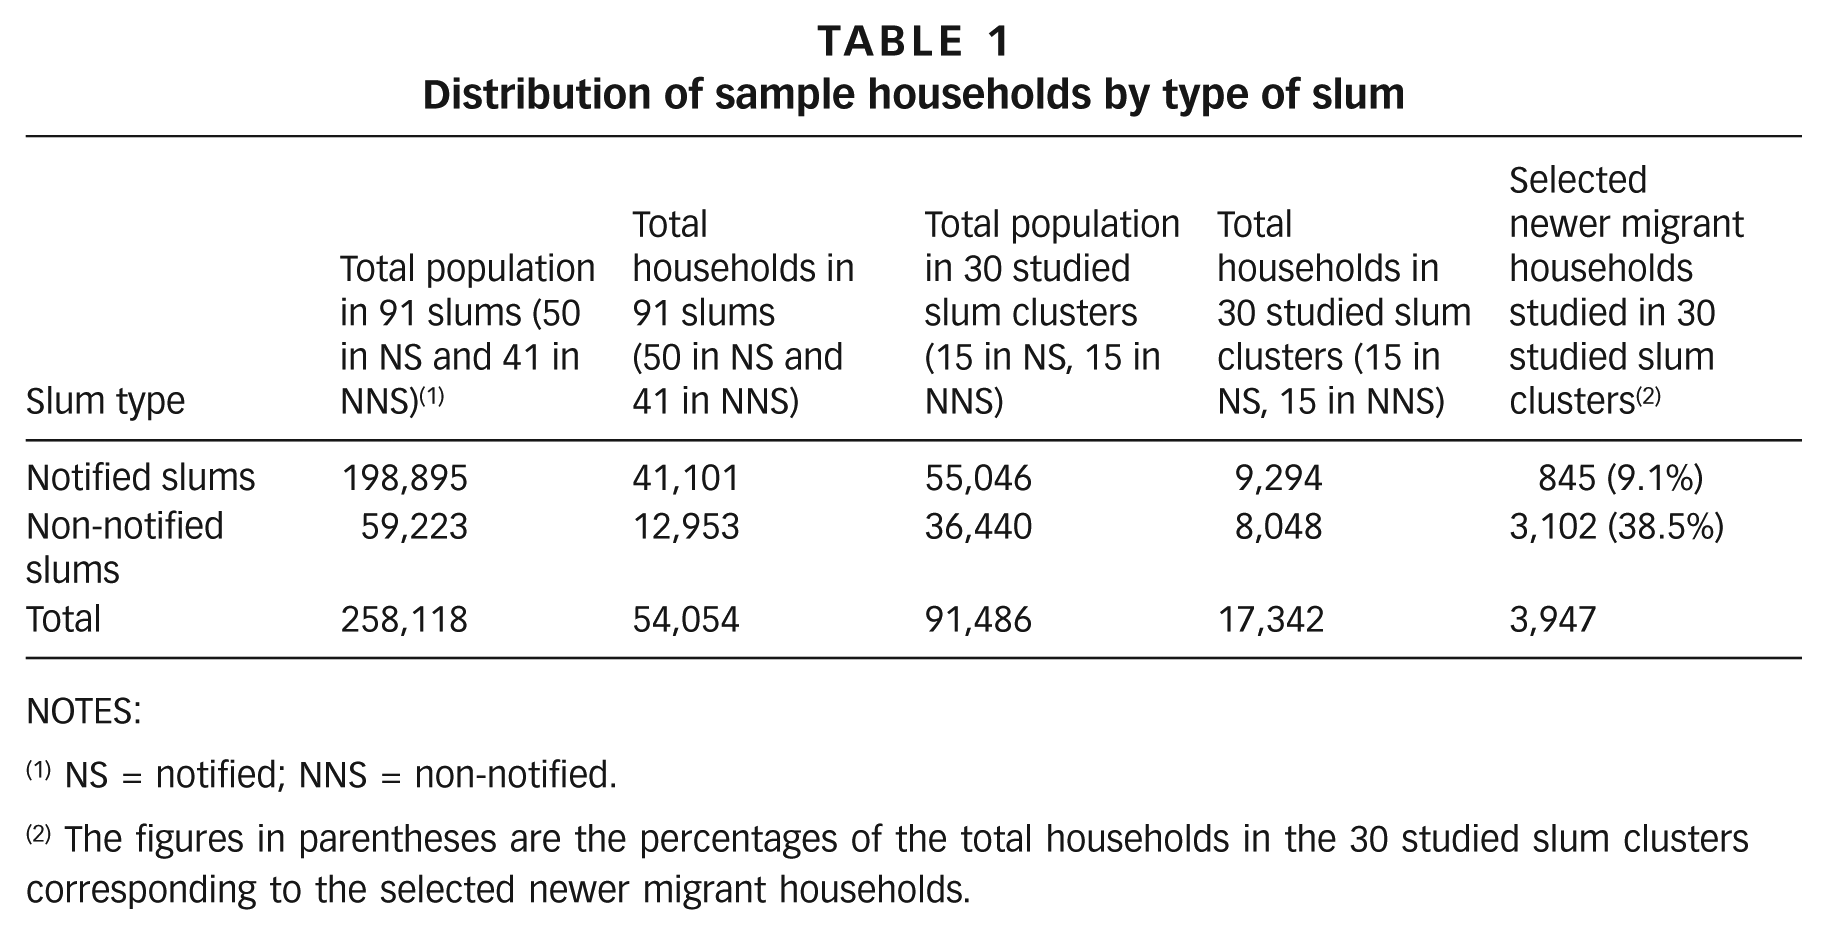
Within the notified slums, only 845 “newer migrant” households were found, or 21.4 per cent of our sample. These “newer migrant” households made up 9.1 per cent of all the households in the 30 notified slum clusters we studied. In non-notified slums, 3,102 “newer migrant” households were found, and here they made up 38.5 per cent of all the households in the non-notified slum clusters studied (Table 1). Only 0.8 per cent of the respondents were residents of “open spaces”. These are included in Table 1 among the non-notified slum residents.
Distribution of sample households by type of slum
NOTES:
NS = notified; NNS = non-notified.
The figures in parentheses are the percentages of the total households in the 30 studied slum clusters corresponding to the selected newer migrant households.
d. Ethical approval and consent
The study was approved by the Institutional Ethics Committee of Christian Medical College, Ludhiana. Informed consent was obtained from the respondents.
e. Data collection and instruments
Information was collected from the heads of the families, using a survey that covered civic amenities like housing, electricity, water supply and sanitation.
f. Operational definitions
The 2011 Census categorizes slums as follows:
“(i) All notified areas in a town or city notified as ‘Slum’ by State, Union territories Administration or Local Government under any Act including a ‘Slum Act’ are considered as Notified slums
(ii) All areas recognised as ‘Slum’ by State, Union territories Administration or Local Government, Housing and Slum Boards, which have not been formally notified as slum under any act are considered as Recognized slums
(iii) A compact area of at least 300 population or about 60-70 households of poorly built congested tenements, in unhygienic environment usually with inadequate infrastructure and lacking in proper sanitary and drinking water facilities. Such areas are considered as Identified slums”(23)
In our study we considered both “recognized” and “identified” slums to be “non-notified”.
Houses made with high-quality materials throughout, including the floor, roof, and exterior walls, are referred to as pucca houses.(24) Houses made from mud, thatch, or other low-quality materials are called katcha houses (Photo 1).(25) We used the term semi-pucca to refer to a structure that had either the walls or the roof, but not both, made of pucca materials.(26)
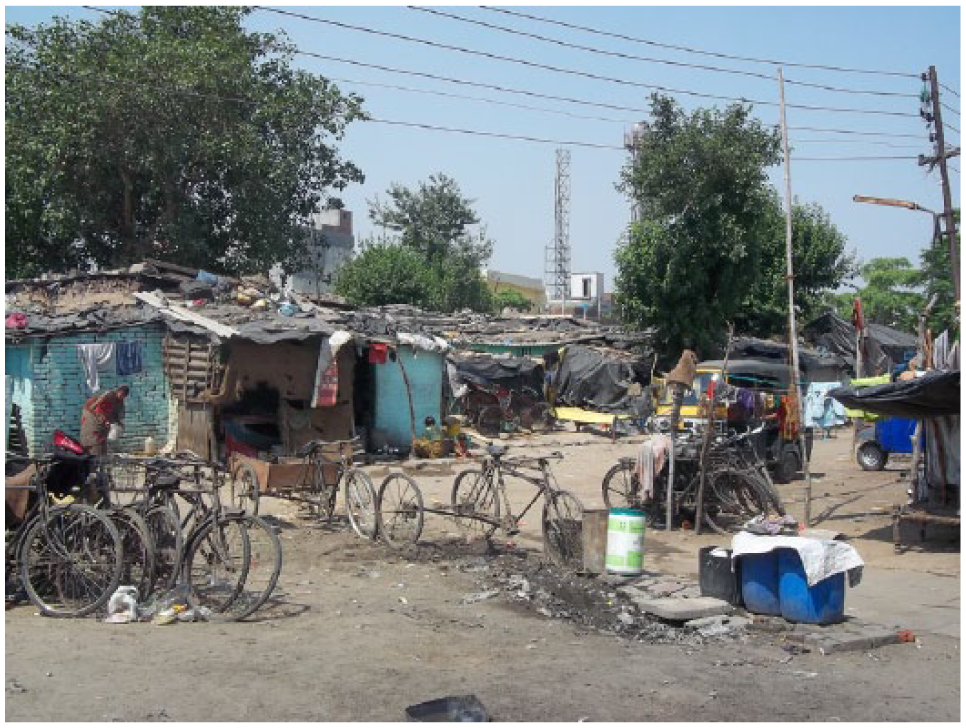
Katcha houses in a study slum
g. Data analysis
Quantitative data were analysed in SPSS software. The chi-square test was applied to determine statistical significance, and odds ratios along with their 95 per cent confidence intervals were calculated, where appropriate.
IV. Observations and Results
Findings from the survey are presented in full in Tables 2, 3 and 4.
Distribution of households by type of house ownership and type of slum
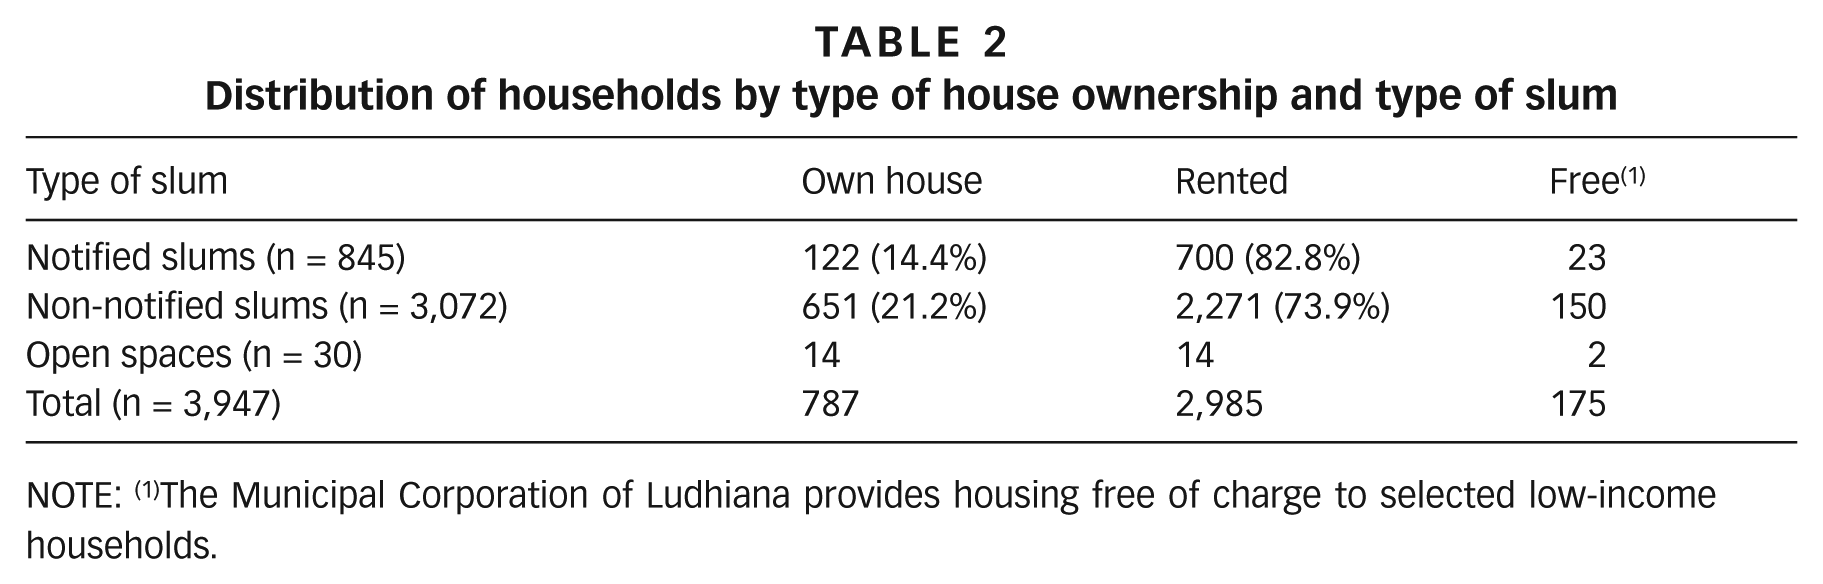
NOTE: (1)The Municipal Corporation of Ludhiana provides housing free of charge to selected low-income households.
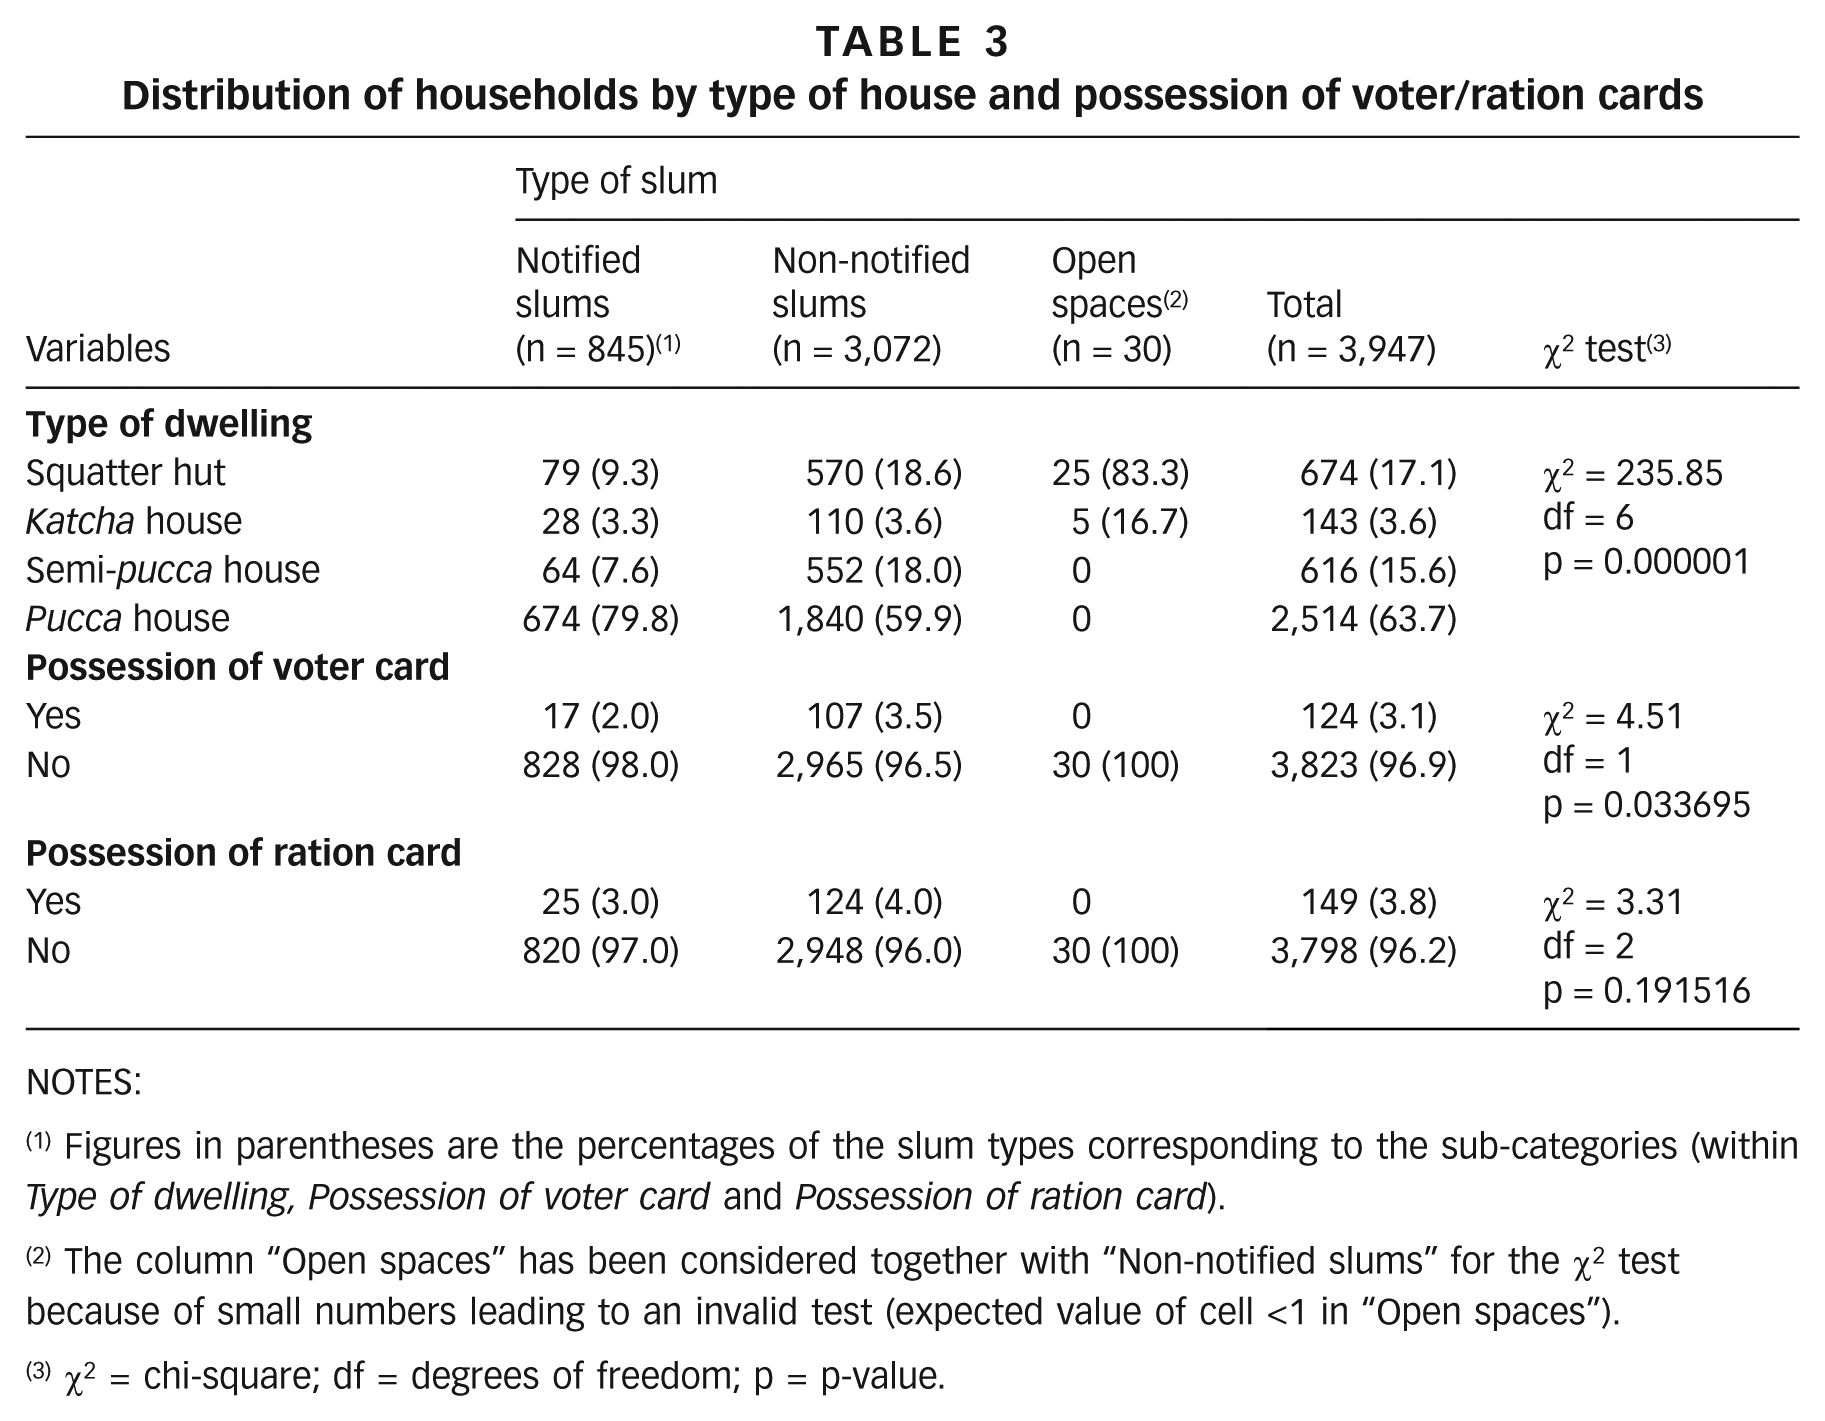
Distribution of households by type of house and possession of voter/ration cards
NOTES:
Figures in parentheses are the percentages of the slum types corresponding to the sub-categories (within Type of dwelling, Possession of voter card and Possession of ration card).
The column “Open spaces” has been considered together with “Non-notified slums” for the χ2 test because of small numbers leading to an invalid test (expected value of cell <1 in “Open spaces”).
χ2 = chi-square; df = degrees of freedom; p = p-value.
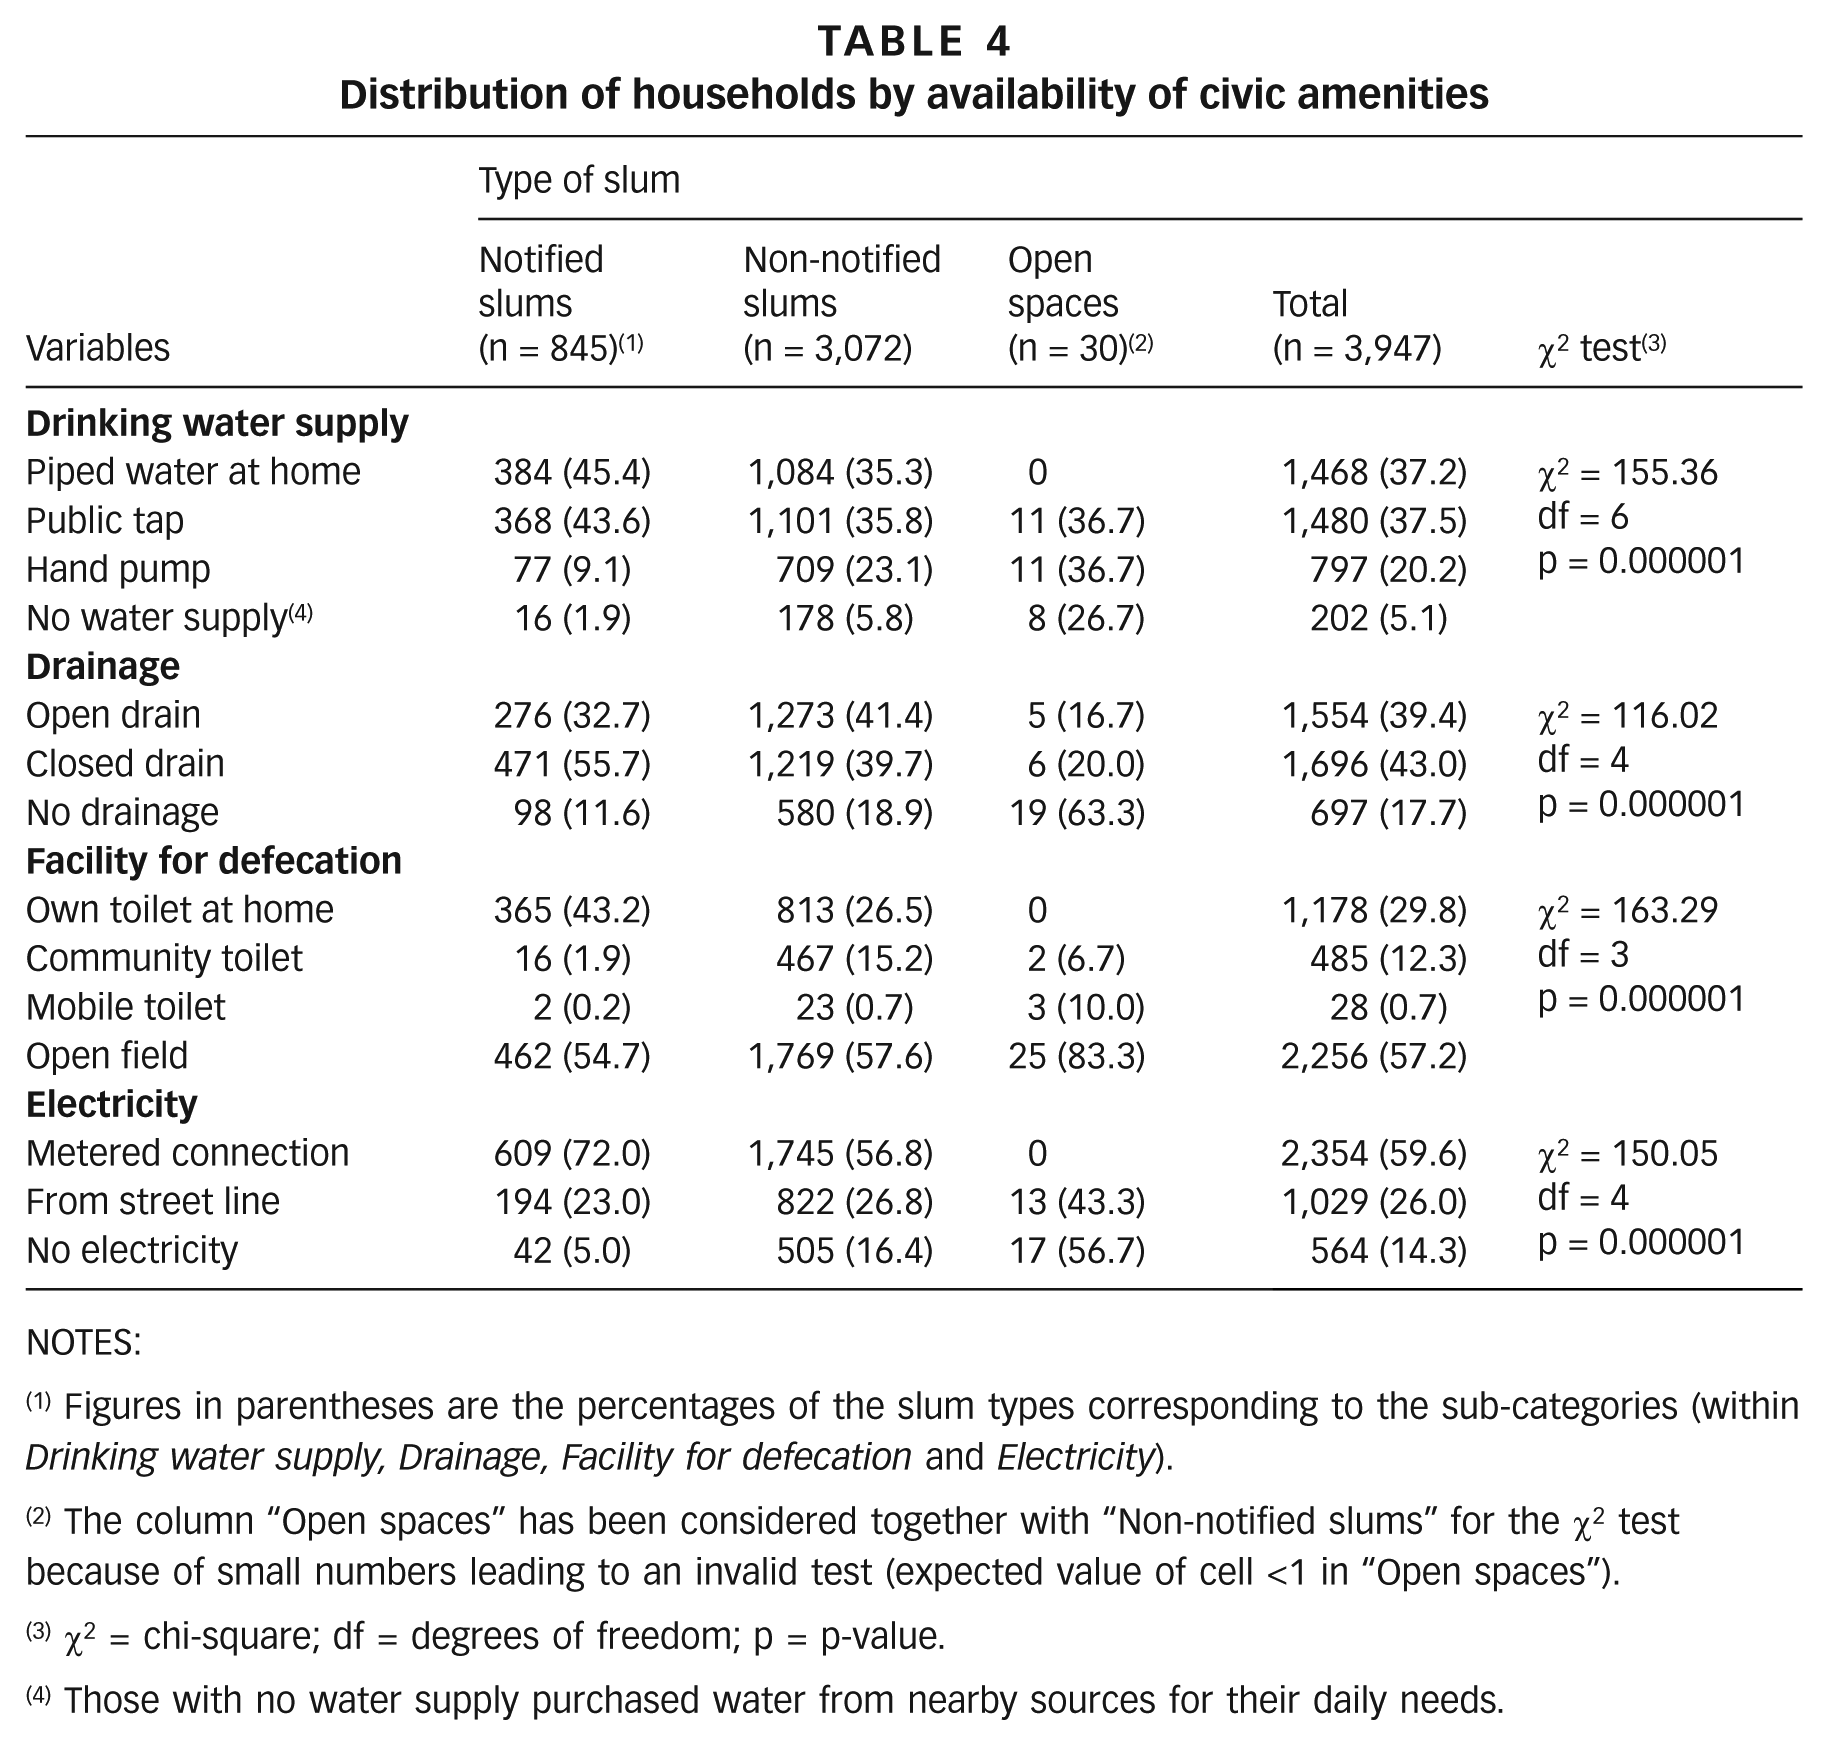
Distribution of households by availability of civic amenities
NOTES:
Figures in parentheses are the percentages of the slum types corresponding to the sub-categories (within Drinking water supply, Drainage, Facility for defecation and Electricity).
The column “Open spaces” has been considered together with “Non-notified slums” for the χ2 test because of small numbers leading to an invalid test (expected value of cell <1 in “Open spaces”).
χ2 = chi-square; df = degrees of freedom; p = p-value.
Those with no water supply purchased water from nearby sources for their daily needs.
The great majority of the sample households lived in rented quarters (Table 2).
This is reflected in housing quality. The selected newer migrant households in notified slums were found to live mostly in pucca houses (79.8 per cent), as compared to 59.9 per cent of those in non-notified slums. Those dwelling in open spaces mostly had squatter huts (83.3 per cent) (Table 3).
Only 37.2 per cent of the households had piped water in their premises (45.4 per cent in notified and 35.3 per cent in non-notified slums). More than a quarter (26.7 per cent) of families living in open spaces had no water supply and purchased water from nearby sources (Photo 2).
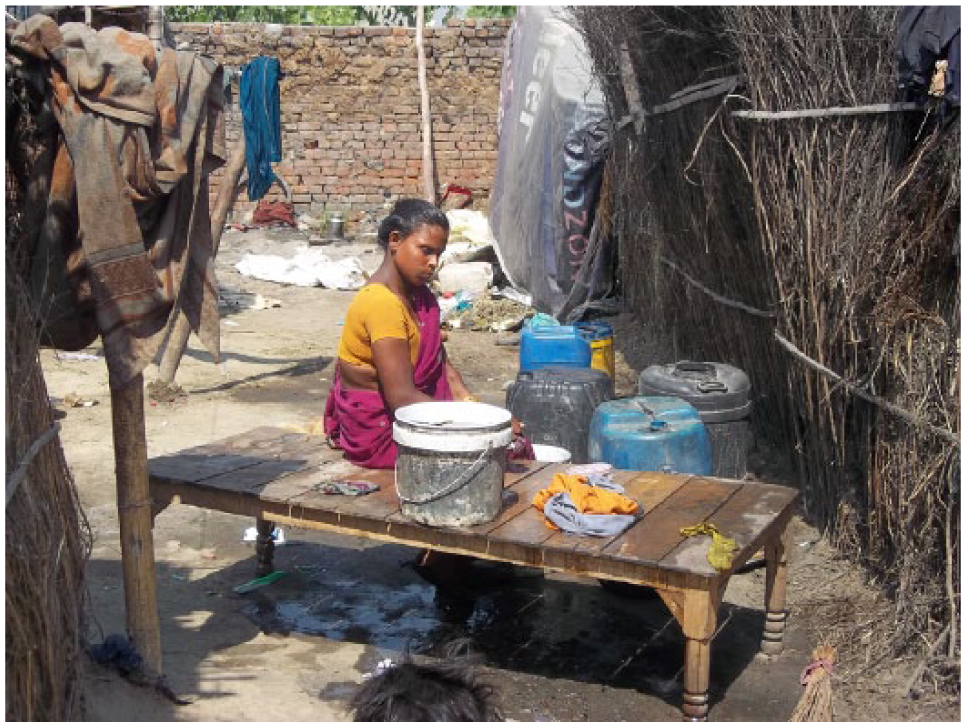
Water is bought by the residents @ Rs. 30 per 20-litre container for daily chores (picture taken in a non-notified slum, Jassian)
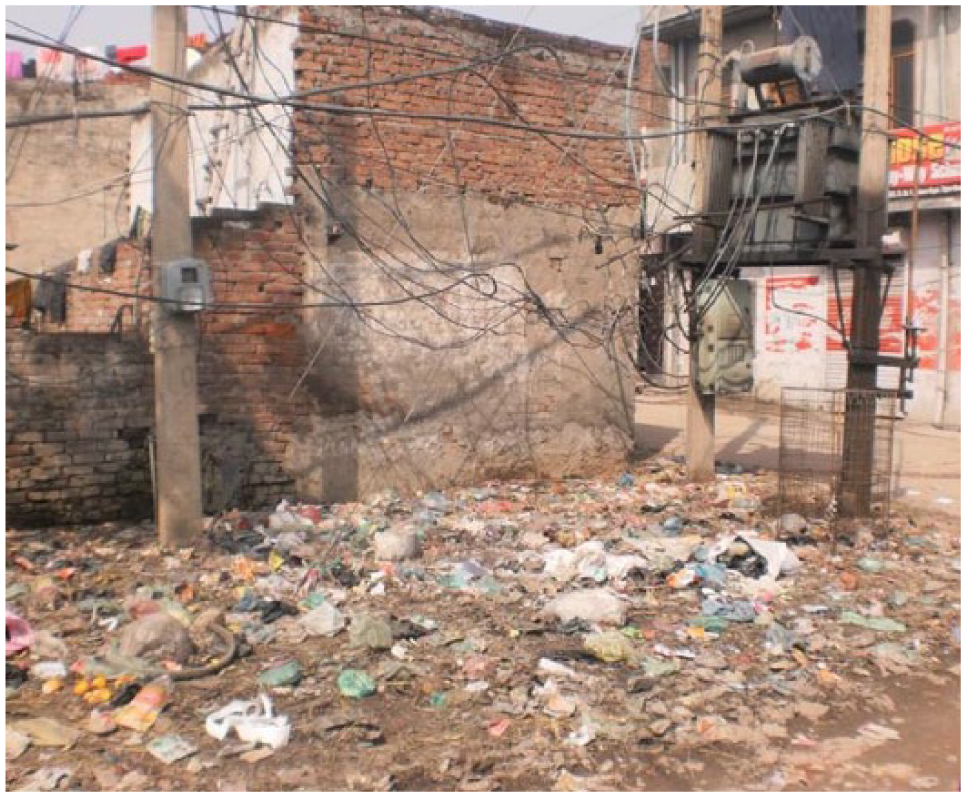
Only 43 per cent of sample households had closed drainage (55.7 per cent for notified slums, 39.7 per cent for non-notified and 20 per cent for open spaces). Over 17 per cent of families had no drainage at all, and the situation was again worst for those living in open spaces (63.3 per cent) (Photo 3). More than half (57.2 per cent) of the slum dwellers had no toilet facilities and resorted to open defecation; of those living in open spaces 83.3 per cent were open defecators (Table 4).
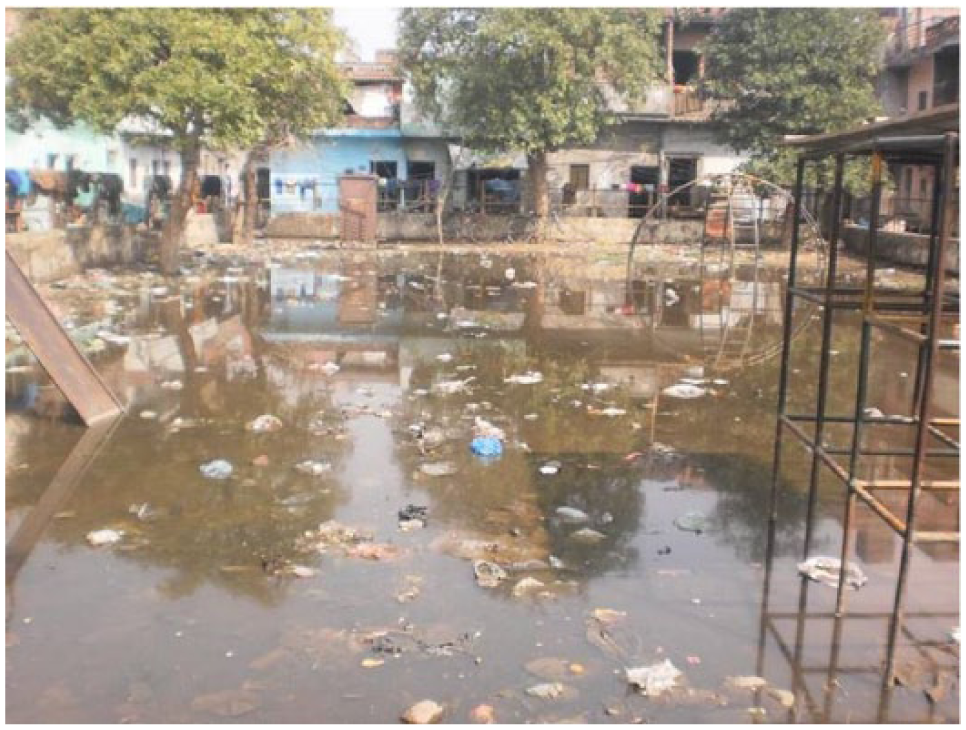
Lack of adequate sanitation and drainage, even in a notified study slum (Economically Weaker Section (EWS) colony), with semi-pucca houses in the background
Although well over half (59.6 per cent) of households in both notified and non-notified slums had metered electric connections, a quarter tapped electricity illegally from street lines. More than half (56.7 per cent) of the dwellings in open spaces had no electric supply and the rest obtained electricity in an unauthorized manner from street lines (Photo 4).
Unauthorized tapping of electricity from street connections (Rajiv Gandhi Colony)
More than 96 per cent of the households possessed neither a ration card nor a voter card, and consequently had neither proof of identity nor means to access social benefits (Table 3).
V. Discussion
There were clearly significant differences in the availability of basic amenities among those living in “notified” and “non-notified” slums or open spaces. The “notified” slums are those that are recognized by the municipal authorities, who are then obliged to provide basic civic amenities like water and sanitation to the residents. Yet even in these notified slums, large numbers of the sampled households were not receiving some critical services.
Although less than 2 per cent surveyed in notified slums lacked access to water supplied in some form, even those with piped water to their homes received it only in the morning and evening, for one to two hours each time. Almost 12 per cent had no drainage at all, 23 per cent were using unauthorized electric connections, and more than half had to make do with open defecation. Conditions were markedly worse in the non-notified slums. Since the MCL decided to provide civic amenities to the non-notified slums as well, some of them now had the facilities of water supply, sanitation and electricity, so conditions varied from settlement to settlement. In the open spaces, occupied by the poorest of the poor, the great majority had no drainage or sanitation facilities, and over a quarter had no access to water supplies. The only electricity connections for people in open spaces were illegal (43.3 per cent), tapped unofficially from street lines. Living conditions in almost all the slums under study were generally poor, with problems of drainage overflows, waterlogging and open garbage disposal, with the associated stench, flies and mosquitoes. Questions about garbage were not included in the survey, but conditions were easy to observe.
The inability to access basic services results from a series of institutional bottlenecks. These include not only the legal status of non-notified settlements or the scattered poor/street (homeless) people, but also ambiguity over land ownership and the permissible uses of specific pieces of land.(27)
It is important to acknowledge how much of the provision of amenities reported through this survey is in fact unauthorized or illegal in nature. With regard to electric connections, this is evident in the figures presented. It is less obvious with regard to water supplies. There are about 400,000 households in the city of Ludhiana, but only 230,000 formal water supply connections. Out of the remaining 170,000 households, 100,000 are estimated to be illegal connection holders. Of the water piped to slums in Ludhiana, almost 74 per cent is classified as “wasted”. This classification includes illegal connections as well as leakage, and indeed most of it is estimated to be accounted for by illegal connections.(28)
The surprisingly large number of pucca houses, even in the non-notified slums, reflects the large number of migrants who rent accommodation from longer-term residents who have over time improved their dwellings. Also, in recent years, some economically weaker households have been provided with pucca houses by the Rajiv Awas Yojana programme.
Regarding the lack of ration cards: to obtain these documents a person requires a valid “proof of identity” and a “proof of residence” issued by a government agency. Home births are common in India, and birth registration rates are poor. Uttar Pradesh and Bihar, the home states of many migrants, have birth registration rates of 6.5 per cent and 1.6 per cent respectively, as a result of which many migrants lack valid documents when they arrive in their new settlements.(29) While a ration card is acceptable as a proof of residence, and the voter card is proof of both identity and residence, those with neither find themselves in a “catch-22” situation.
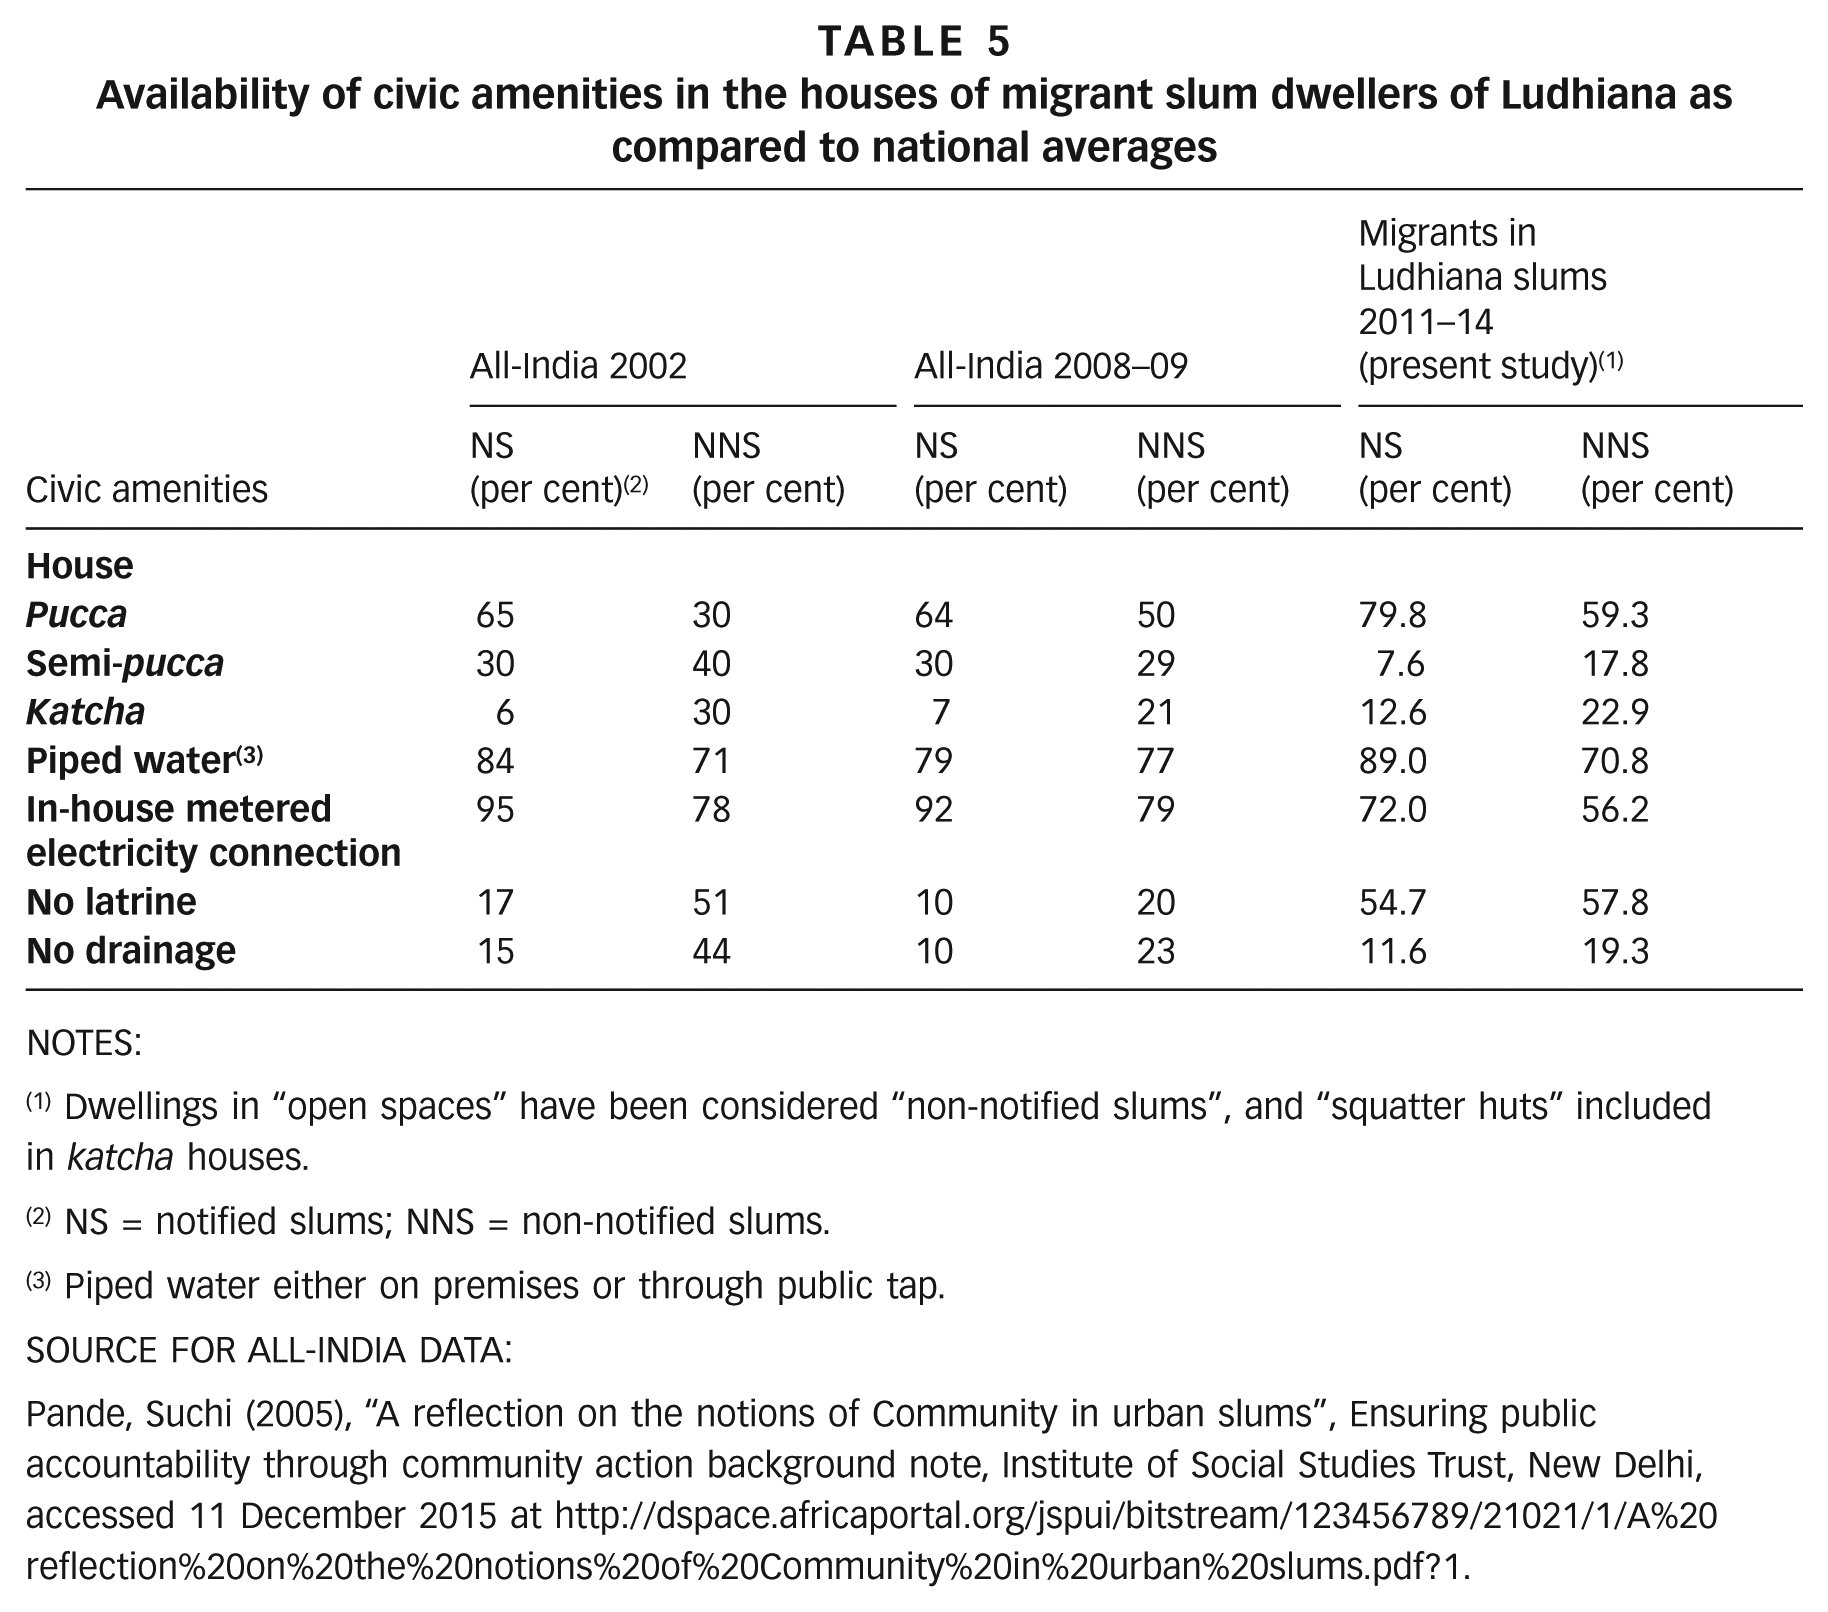
While this study allowed for neither comparisons over time, nor comparisons with other groups, it is possible to compare the conditions of these migrant households to those of slum dwellers nationally, drawing on national statistics. Table 5 shows the civic amenities available in the households of the migrant slum dwellers of Ludhiana City as found in the present study, in comparison with the national figures as reported in National Sample Survey Report No 534.(30)
Availability of civic amenities in the houses of migrant slum dwellers of Ludhiana as compared to national averages
NOTES:
Dwellings in “open spaces” have been considered “non-notified slums”, and “squatter huts” included in katcha houses.
NS = notified slums; NNS = non-notified slums.
Piped water either on premises or through public tap.
SOURCE FOR ALL-INDIA DATA:
Pande, Suchi (2005), “A reflection on the notions of Community in urban slums”, Ensuring public accountability through community action background note, Institute of Social Studies Trust, New Delhi, accessed 11 December 2015 at http://dspace.africaportal.org/jspui/bitstream/123456789/21021/1/A%20reflection%20on%20the%20notions%20of%20Community%20in%20urban%20slums.pdf?1.
The proportion of Ludhiana migrant households in pucca housing is considerably higher than that nationally (79.8 per cent vs. 64 per cent in notified slums). This is probably accounted for, as noted above, by the very high proportion here of rented households. At the same time, the proportion living in katcha houses (12.6 per cent in notified slums) is also higher than the national average of 7 per cent. The proportion of those with piped water supply is higher in Ludhiana for notified slums (89 per cent in Ludhiana vs. 79 per cent nationally in 2008–2009). For non-notified slums, Ludhiana’s migrant households fall behind the national average (70.8 per cent vs. 77 per cent). The proportion with an in-house metered electricity connection is much lower among Ludhiana migrant slum dwellers than the national average (72 per cent vs. 92 per cent in notified slums), as is their access to sanitation. More than half of Ludhiana’s migrant households lack latrines, compared to 10–20 per cent nationwide.
Although the Ludhiana figures do not allow for comparison over time, the national figures point to improvements on most fronts, specifically concentrated in non-notified slums. Most notable are the improvements in these non-notified slums in housing conditions, sanitation and drainage, as is evident in Table 5.
VI. Conclusions
The present study was carried out in 3,947 migrant slum households of a fast-growing small city, Ludhiana in the state of Punjab, to assess the situation of migrant households with regard to MDG 7 related to basic civic amenities. More than a third (37.2 per cent) of the surveyed migrant households were found to have no in-house piped water supply, only 29.8 per cent had a toilet at home, and only 59.6 per cent had metered electricity connections. Those living in non-notified slums were especially lacking in these facilities. Most newer migrant households also lacked voter cards and rations cards that would have given them access to a range of benefits. The proportion of migrant households residing in pucca houses was found to be high, but this reflected more than anything the very large proportion renting rooms from more established households.
The study adds valuable information about the vulnerable migrant population staying in the urban slums of the city, which can help in guiding policy decisions, with a view to sustainable development. Further research, however, comparing the situations of migrant and non-migrant slum dwellers in Ludhiana would be helpful to guide migrant-sensitive policies. Such research might also make it possible to note progress among these households with regard to MDG 7 targets. Further research would ideally also focus on hygiene practices, the morbidity load from waterborne diseases, and the related absenteeism and loss of working days among migrant slum dwellers, which might help to encourage policies on adequate potable water supply and proper sanitation in the context of the new Sustainable Development Goals.
Footnotes
Acknowledgements
The project team, with Dr Meena Sagar (MD Community Medicine) as Research Associate, Mr Nishant Raut (Medical Social Worker) as Research Assistant and Mr Benhur as Data Entry Operator, is also gratefully acknowledged.
Funding
The authors wish to acknowledge the Indian Council of Medical Research (ICMR), New Delhi for supporting this study with a research grant under IRIS ID 2010-1259E. Special thanks are due to Dr B V Babu (Scientist-F), Division of Health Systems Research, ICMR, who was the Programme Officer for this national task force study.
1.
The term “slum” usually has derogatory connotations and can suggest that a settlement needs replacement or can legitimate the eviction of its residents. However, it is a difficult term to avoid for at least three reasons. First, some networks of neighbourhood organizations choose to identify themselves with a positive use of the term, partly to neutralize these negative connotations; one of the most successful is the National Slum Dwellers Federation in India. Second, the only global estimates for housing deficiencies, collected by the United Nations, are for what they term “slums”. And third, in some nations, there are advantages for residents of informal settlements if their settlement is recognized officially as a “slum”; indeed, the residents may lobby to get their settlement classified as a “notified slum”. Where the term is used in this journal, it refers to settlements characterized by at least some of the following features: a lack of formal recognition on the part of local government of the settlement and its residents; the absence of secure tenure for residents; inadequacies in provision for infrastructure and services; overcrowded and sub-standard dwellings; and location on land less than suitable for occupation. For a discussion of more precise ways to classify the range of housing sub-markets through which those with limited incomes buy, rent or build accommodation, see Environment and Urbanization Vol 1, No 2 (1989), available at ![]() .
.
4.
Prüss-Üstün, A, R Bos, F Gore and J Bartram (2008), Safer Water, Better Health: costs, benefits and sustainability of interventions to protect and promote health, WHO, Geneva, available at ![]() .
.
5.
See reference 4.
7.
9.
Hindustan Times (2010), “Lack of toilets costs India 54 billion dollars a day”, 21 December, accessed 22 February 2016 at ![]() .
.
10.
Hutton, G, L Haller and J Bartram (2007), “Global Cost-Benefit Analysis of Water Supply and Sanitation Interventions”, Journal of Water and Health Vol 5, No 4, pages 481–502.
11.
Zaheer, M, B G Prasad, K K Govil and T Bhadury (1962), “A note on urban water supplies in Uttar Pradesh”, Indian Medical Association Vol 38, pages 177–182.
12.
Ludhiana City Census 2011 data, accessed 28 November 2015 at ![]() .
.
13.
“Migration, poverty and access to healthcare: a multi-centric study on people’s access and health system’s responsiveness in fast-growing smaller cities: Ludhiana center” (IRIS ID: 2010-1259E). An Indian Council of Medical Research (ICMR) National Task Force study (1 August 2011 to 31 July 2014).
14.
Ludhiana OnlineTM (2015), “About City”, accessed 6 January 2015 at ![]() .
.
15.
Jawaharlal Nehru National Urban Renewal Mission (2001), “Urban poor – basic infrastructure and services”, in Vision 2021: Ludhiana City Development Plan, accessed 25 October 2015 at ![]() .
.
16.
National Urban Information System, Municipal Corporation Ludhiana (n.d.), Ludhiana Data, accessed 29 November 2015 at ![]() .
.
17.
See reference 16; also Planning Commission (2014), “Urban Development”, in Punjab Development Report, Government of India, page 287, accessed 25 October 2015 at ![]() .
.
18.
See reference 16.
19.
See reference 15.
20.
See reference 16.
21.
Lwanga, S K and S Lemeshow (1991), Sample size determination in health studies: A practical manual World Health Organization, 30 pages.
22.
See reference 2.
23.
Census of India (2011), Primary Census Abstract for Slum, Office of the Registrar General & Census Commissioner, India, New Delhi, accessed 25 November 2015 at ![]() .
.
24.
Open Government Data (OGD) Platform India (n.d.), “House”, accessed 1 February 2016 at ![]() .
.
25.
See reference 24; also Ministry of Statistics and Programme Implementation, National Statistical Organization, National Sample Survey Office (2010), Some Characteristics of Urban Slums 2008-09, NSS Report No 534, Government of India, May.
26.
See reference 24.
27.
Pande, Suchi (2005), “A reflection on the notions of Community in urban slums”, Ensuring public accountability through community action background note, Institute of Social Studies Trust, New Delhi, accessed 11 December 2015 at ![]() .
.
28.
Bedi, J K (2015), “Evaluation of Domestic Water Supply in Ludhiana on the Basis of Water Demand Management and Dublin Principles”, in Domestic water consumption pattern in urban Punjab: a case study of Ludhiana City, PhD thesis, Punjabi University, Patiala, accessed 25 November 2015 at ![]() .
.
29.
Abbas, R and D Varma (2014), “Internal Labor Migration in India Raises Integration Challenges for Migrants”, Migration Information Source, Migration Policy Institute, accessed 1 December 2015 at ![]() .
.
30.
31.
Bihar Prabha (2013), “A comprehensive guide to Rajiv Awas Yojana”, 10 September, accessed 3 December 2015 at ![]() .
.
32.
See reference 15.