
Abstract
Urban populations living in informal settlements are inherently vulnerable to climate change, as informal settlements are characterized by overcrowding, poor-quality housing, lack of basic infrastructure, and poverty. Nevertheless, evidence of the associations among weather or climate and health in these populations is lacking, which severely constrains the design of climate change and disaster risk reduction adaptation strategies. To help fill this gap, this paper is a guide for researchers working on climate and health in informal settlements that summarizes key epidemiological methods and study designs commonly used in environmental health research. We focus on designs that have modest data requirements and that have been used successfully in resource-poor settings. The final section of the paper gives an overview of the current state of evidence about climate change and weather hazards in urban areas, as this is one of the main concerns for policymakers.
Keywords
I. Introduction
The most recent Intergovernmental Panel on Climate Change (IPCC) report provides strong evidence of human interference with the climate(1) system.(2) Observed changes since 1750 include warming of the ocean and atmosphere, reduced coverage of snow and ice, and sea level rise.(3) The IPCC report also documented the continued global increase in emissions of greenhouse gases and other climate forcers, thereby further raising the prospect of dangerous climate change in the future.(4) The potential consequences from future climate change are varied, but many are projected to be adverse overall, including impacts on human health.(5) Increased health burdens are expected from a range of causes including malnutrition, certain infectious diseases (e.g. malaria), exposure to temperature extremes, and a higher frequency and/or intensity of natural hazards.(6)
The populations most vulnerable to the health impacts of climate change include those situated in locations that are exposed to extreme weather and those populations with the least resilience. In many cases, the two will overlap.
Urban populations living in informal settlements – estimated at about 860 million people and increasing(7) – are widely recognized as inherently vulnerable to climate change.(8) Informal settlements are characterized by overcrowding, poor housing, lack of basic infrastructure, and poverty, factors known to increase vulnerability to many climate-sensitive health risks.(9) Informal settlements are also often located in high-risk locations such as along coasts, in floodplains or on hillsides. As a result, there is a substantial need to guide adaptation policies in these areas in order to minimize the negative impacts of climate change.
However, despite the vulnerability to climate change of people living in urban areas, which is generally heightened for those in informal settlements (Table 1), our understanding of the associations among weather or climate and health in these populations is lacking. To help fill this gap, this paper has been prepared as a guide for researchers working on climate change and health in informal settlements that summarizes key methods and study designs commonly used in environmental health research. We focus on designs that have only modest data requirements and that have been used successfully in resource-poor settings. We also direct readers to commonly used data sources, including some available in the public domain.
Some potential impacts of climate change on urban areas and populations
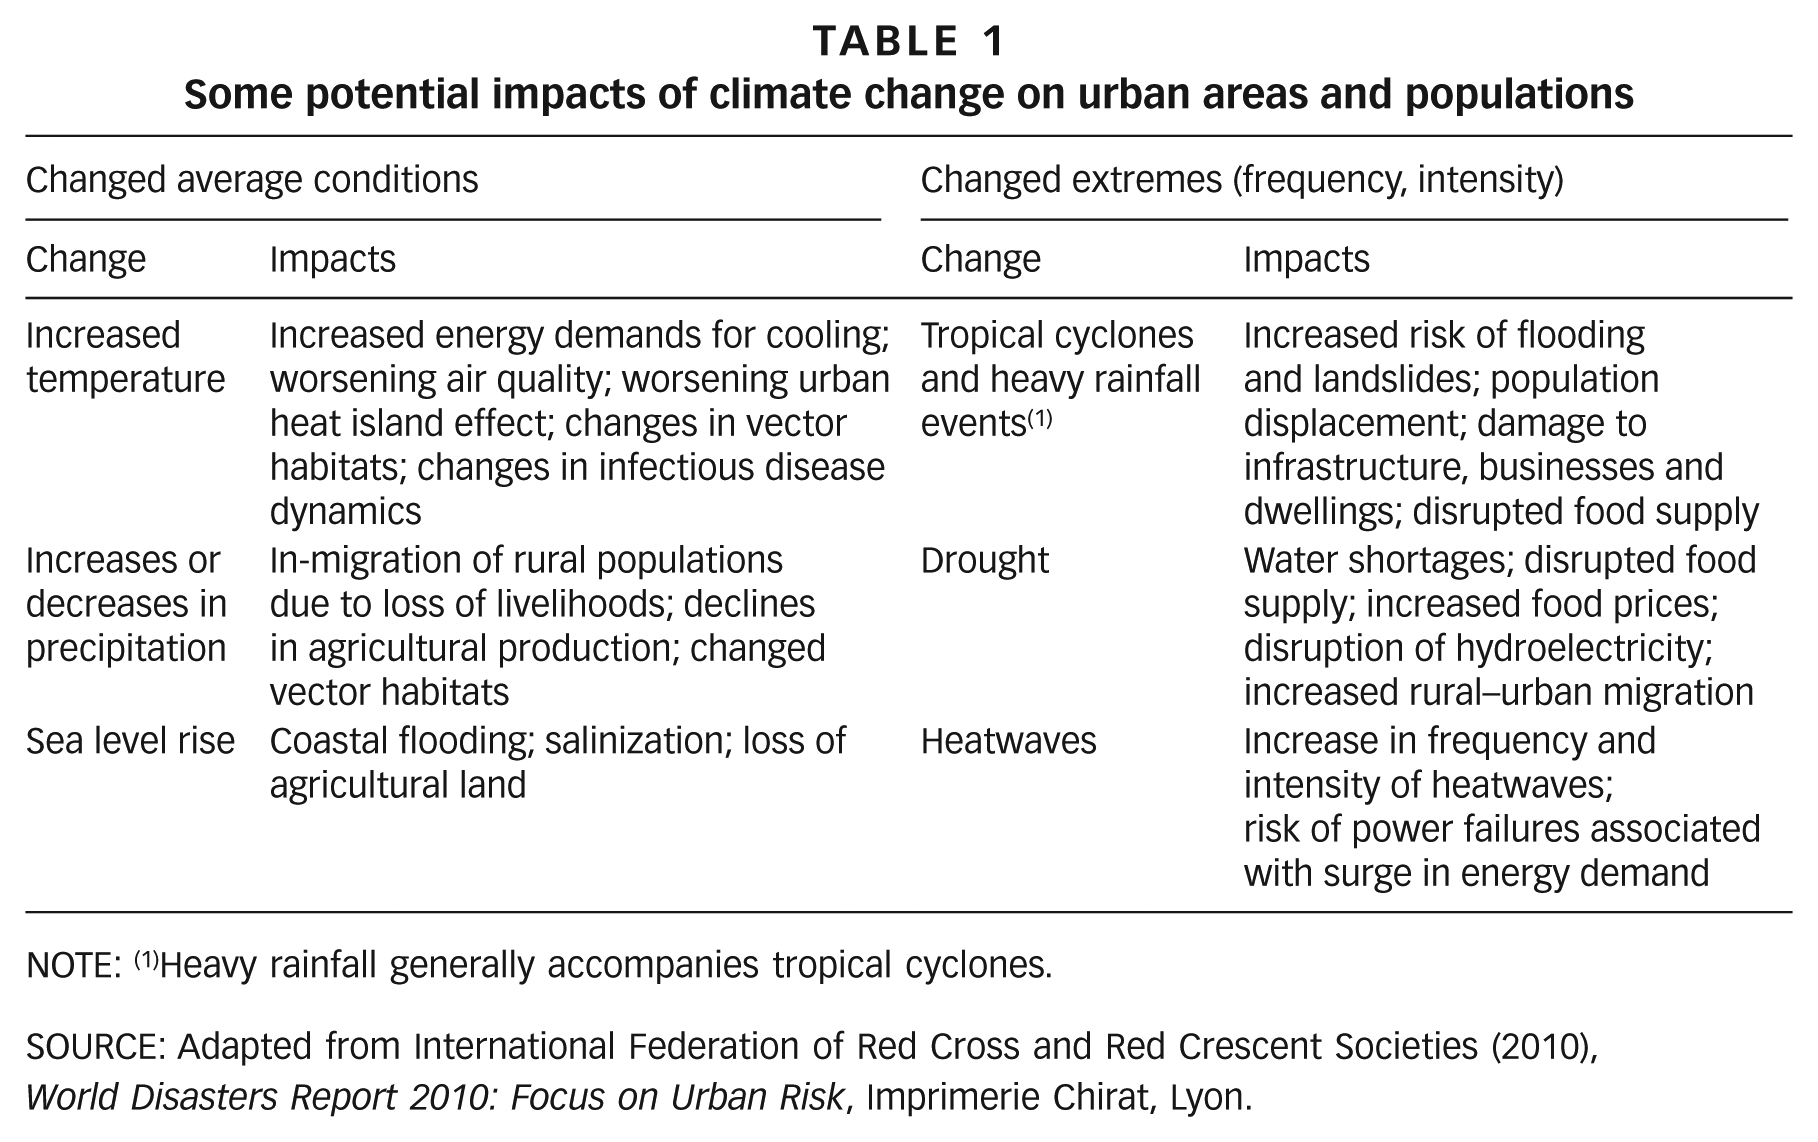
NOTE: (1)Heavy rainfall generally accompanies tropical cyclones.
SOURCE: Adapted from International Federation of Red Cross and Red Crescent Societies (2010), World Disasters Report 2010: Focus on Urban Risk, Imprimerie Chirat, Lyon.
The paper is structured as follows. Section II explains what are referred to as “burden of disease” studies that can be used to identify the main causes of ill health in a population. Section III describes key study designs for exploring associations among weather or climate and health and also the risk factors that may modify those relationships. Section IV briefly summarizes data sources commonly available to researchers working in informal settlements. And the final section provides an overview of natural hazards and disasters in urban areas, as this is a primary concern for decision makers planning climate change adaptation policies.
II. The Burden of Disease: Concepts and Methods
“Burden of disease” estimates, also called “disease burdens”, refer to the amount of death and disability in a given population. Disease burdens can be estimated for a specific disease (e.g. lung cancer) or for a single cause for ill health (e.g. particulate air pollution or smoking). Burden of disease estimates have an important role to play in the design of public health strategies. Murray(10) describes four key benefits to measuring disease burdens:
To help set health service priorities
To help set research priorities
To help identify disadvantaged groups and target interventions accordingly
To provide a comparable measure for planning and evaluating interventions and programmes
There are a number of different measures that can be used to estimate the burden of disease in a population. Mortality burdens, which quantify the number of deaths attributable to a specific cause or risk factor, are the most basic and require relatively few data. Mortality burdens can often be collated directly from vital registration data (death certificates) or demographic surveys, providing the data are of sufficient quality. A more complex measure of health impact is the quantification of the years of life lost (YLL) that result from a given disease or risk factor. YLL combines the age of death with an estimate of life expectancy at the time of death to calculate the amount of life that was lost prematurely.(11) The advantage of YLL compared to mortality is that YLL accounts for the difference in loss of health that occurs when a younger person dies compared to someone in old age.
It is also possible to integrate information on both death and disability into composite measures of health burdens, sometimes referred to as summary measures of population health.(12) These measures include the disability-adjusted life year (DALY), which combines YLL and estimates of years lived with disability into a single measure that estimates the amount of healthy life lost from a given disease or risk factor. The extent of disease-specific disability associated with a given disease is normally determined by expert opinion or survey methods and is based on specified criteria such as loss of mobility or pain.(13)
The above discussion provides only a brief summary of some of the methods used to quantify disease burdens. There are many other technical issues, for example whether to discount expected future disease burdens and whether to weight disease burdens differently depending on the age of the individual. These issues have been discussed in detail elsewhere.(14) There are also alternatives to using the DALY, but we do not discuss these here as they are generally conceptually similar but are not as widely used.
a. Estimating the burden of disease from environmental risk factors
In a population, a given disease may be caused by exposure to various factors (for example, lung cancer may be caused by exposure to cigarette smoke, outdoor air pollution, radon, etc). We are interested in estimating how exposure to a particular environmental risk factor, which may be related to weather and climate, affects the risk for a given disease. A key concept here is “attributable risk”, which is the additional risk of disease amongst those exposed to the environmental risk factor of interest.(15) It can be calculated as the difference between risk amongst those exposed to the risk factor of interest and the risk amongst those not exposed to that risk factor (Figure 1). A related measure, “population attributable risk fraction”, provides an indication of what fraction of the population disease burden could be prevented by eliminating exposure to that risk factor.
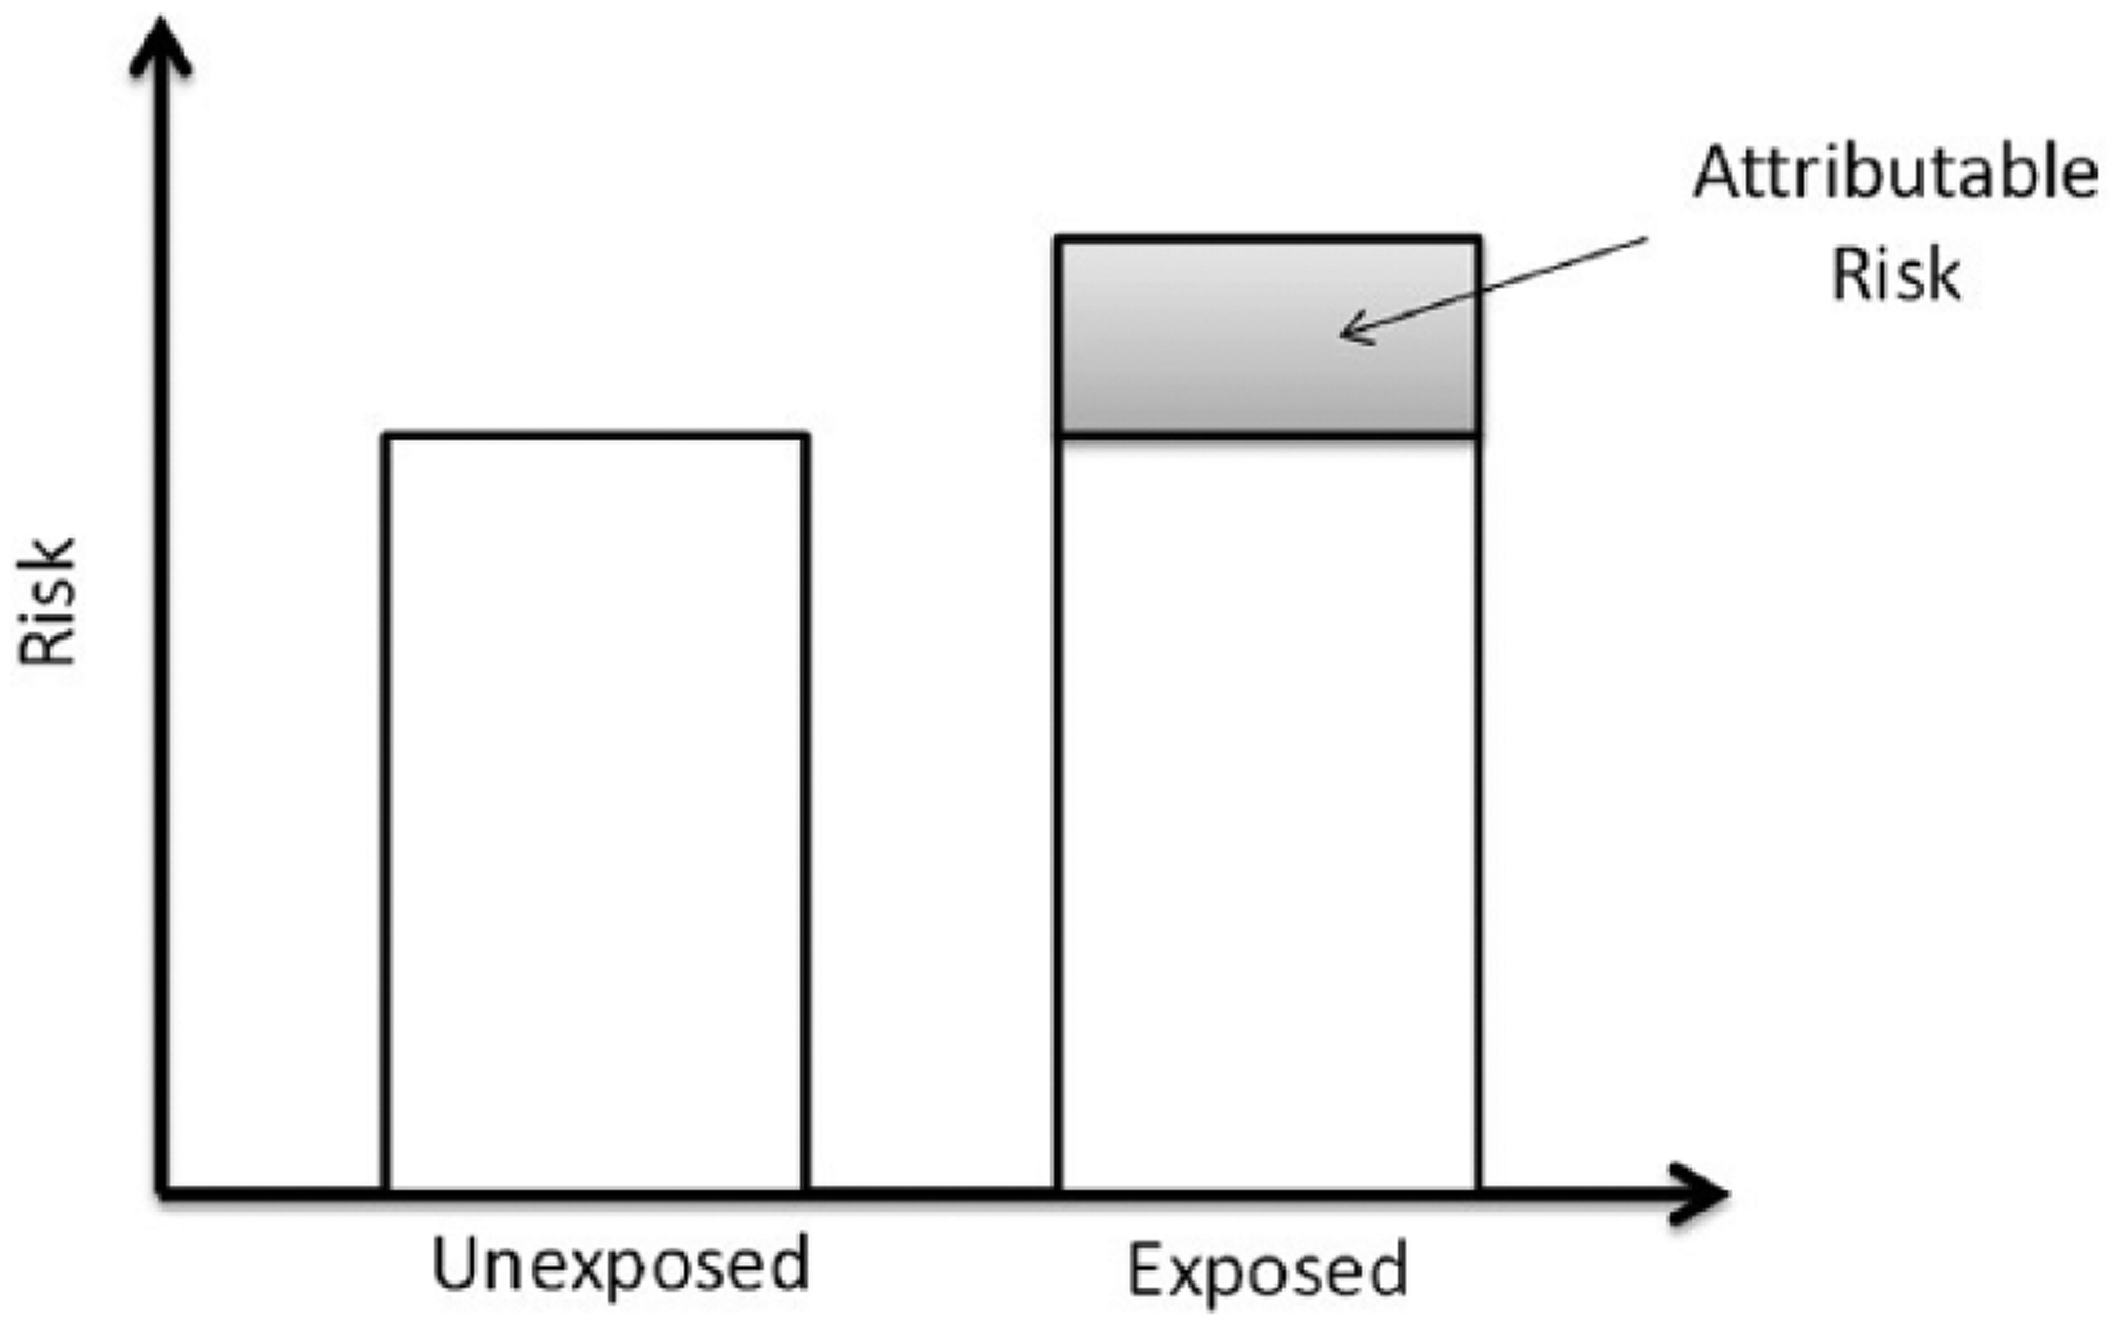
The attributable risk is the excess risk in an exposed population compared to an unexposed population
Estimating disease burdens from environmental risk factors requires only three types of data(16):
The distribution of exposure in the study population
An exposure–response relationship
The total disease burden (of the disease of interest) in the population
Determining the distribution of exposure is often the most difficult aspect of a burden of disease study. For some environmental risks, exposure will be a categorical variable, for example whether or not a household has access to adequate sanitation. With other risk factors, such as outdoor air pollution, everyone will be exposed at some level, but levels will vary widely across the population. How to determine exposure will therefore depend on the risk factor of interest and may be estimated from routine monitoring data or more complex methods such as time–activity budgets. Some environmental exposures can be mapped and modelled – such as air pollution and meteorological variables – to give sufficiently robust exposure assessments for a given population.
Exposure–response functions estimate the excess risk of death, disease or disability (the “response”) that is associated with exposure over a specified period of time. Exposure–response functions are normally derived from the epidemiological literature and ideally from a meta-analysis of several published studies. Estimates of the total burden of disease in a population may come from various sources, as described below.
Once the three types of data are acquired, the disease burden can be calculated. For brevity, we do not present the equations here, but they can be found in Section 1 of the supplementary material available online. A more detailed explanation with worked examples can also be found in Pruss-Ustun et al.(17)
b. Data on the environmental burden of disease
Disease burden estimates quoted in the literature are derived from the Global Burden of Disease (GBD) project, which was first established by the World Health Organization (WHO), but the most recent assessment was undertaken by the Institute for Health Metrics and Evaluation (IHME).(18) These assessments periodically estimate health burdens for a range of diseases and risk factors for nearly 200 countries (and regionally and globally), and enable the tracking of trends over time. Table 2 provides the estimates of the disease burdens due to selected environmental risk factors by world region. The GBD does not report disease burdens below country level.
Number of deaths attributable to select environmental risk factors, 2010
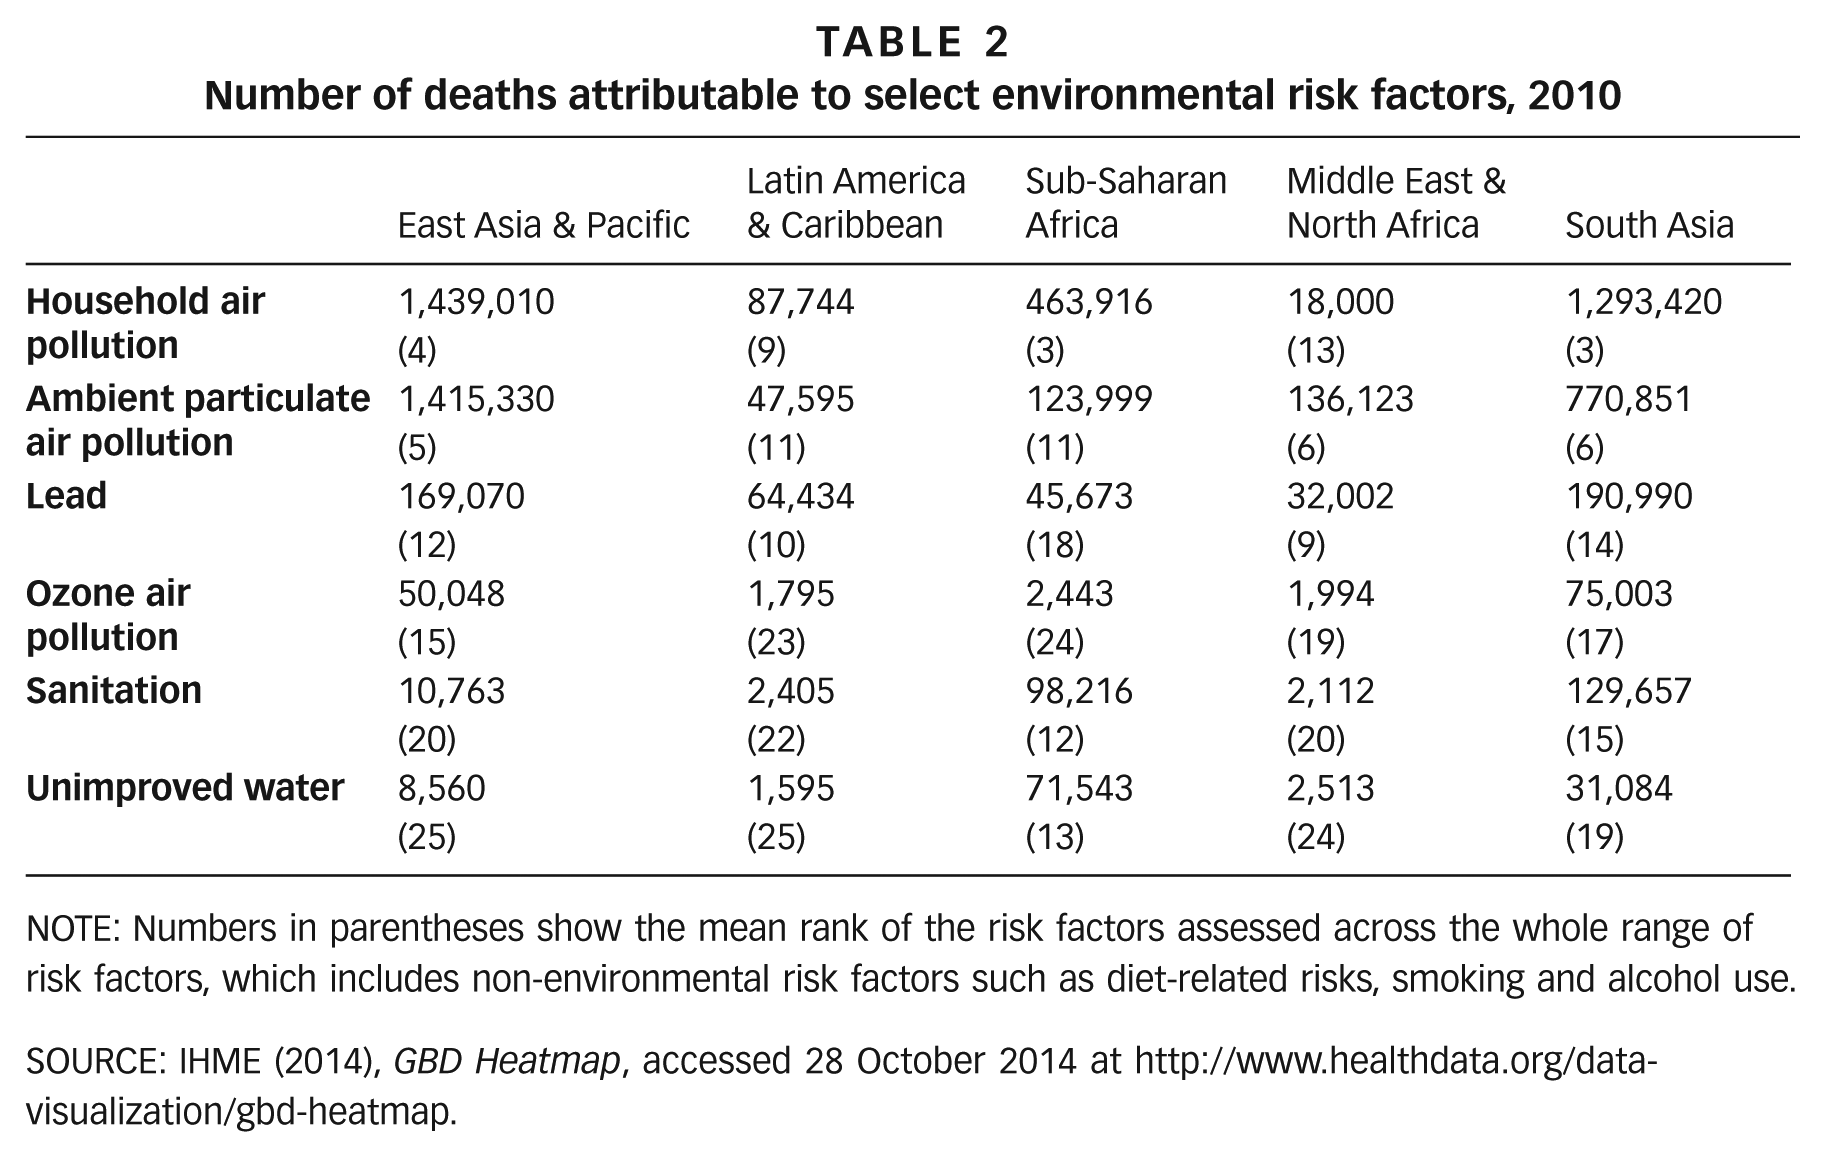
NOTE: Numbers in parentheses show the mean rank of the risk factors assessed across the whole range of risk factors, which includes non-environmental risk factors such as diet-related risks, smoking and alcohol use.
SOURCE: IHME (2014), GBD Heatmap, accessed 28 October 2014 at http://www.healthdata.org/data-visualization/gbd-heatmap.
The methods for conducting burden of disease studies for sub-national or within-city populations, such as those living in informal settlements, are the same as for studies at the country and regional levels. There are several large studies available on health burdens in informal settlements, which generally rely on data from demographic surveillance systems rather than routinely collected data. Studies from Dar es Salaam and Nairobi are two examples.(19) These report high disease burdens from diarrhoeal diseases and communicable diseases such as pneumonia, as well as high disease burdens in children under 5.(20) Similarly, studies that have compared specific outcomes in slum(21) populations or low-income urban populations with non-slum or higher-income residents have reported higher risks of some infectious diseases and lower rates of immunization and healthcare coverage.(22) So far, the evidence for slum populations relates mainly to recent disease burdens from specific causes of death, and few studies have estimated burdens attributable to environmental risk factors.
GBD methods have also been used to estimate future disease burdens attributable to climate change, for selected outcomes at the regional level.(23)
III. Epidemiological Studies of Climate/Weather and Health
Assessing the potential health impacts of climate change needs to be informed by evidence on the observed effects of weather and climate on current human disease outcomes, primarily using epidemiological methods.(24)
There are three main approaches for observational studies relevant to climate and health:
Health impacts of individual extreme events (such as heatwaves, floods, storms, droughts)
Temporal studies of changes in weather-related health outcomes using time-series data Short-term (daily, weekly) changes in meteorological parameters Inter-annual climate variability
Spatial studies, where climate is an explanatory variable in the distribution of the health outcome (or related outcome such as disease vector)
Three key study designs commonly used to explore associations between weather or weather events (e.g. floods and heatwaves) and health are briefly summarized below and illustrated with examples of studies undertaken with populations in informal settlements. Table 3 provides an overview of studies that have quantified health risks from weather and climate on populations in urban areas, including informal settlements.
Examples of studies on the potential impacts of weather on human health in urban environments
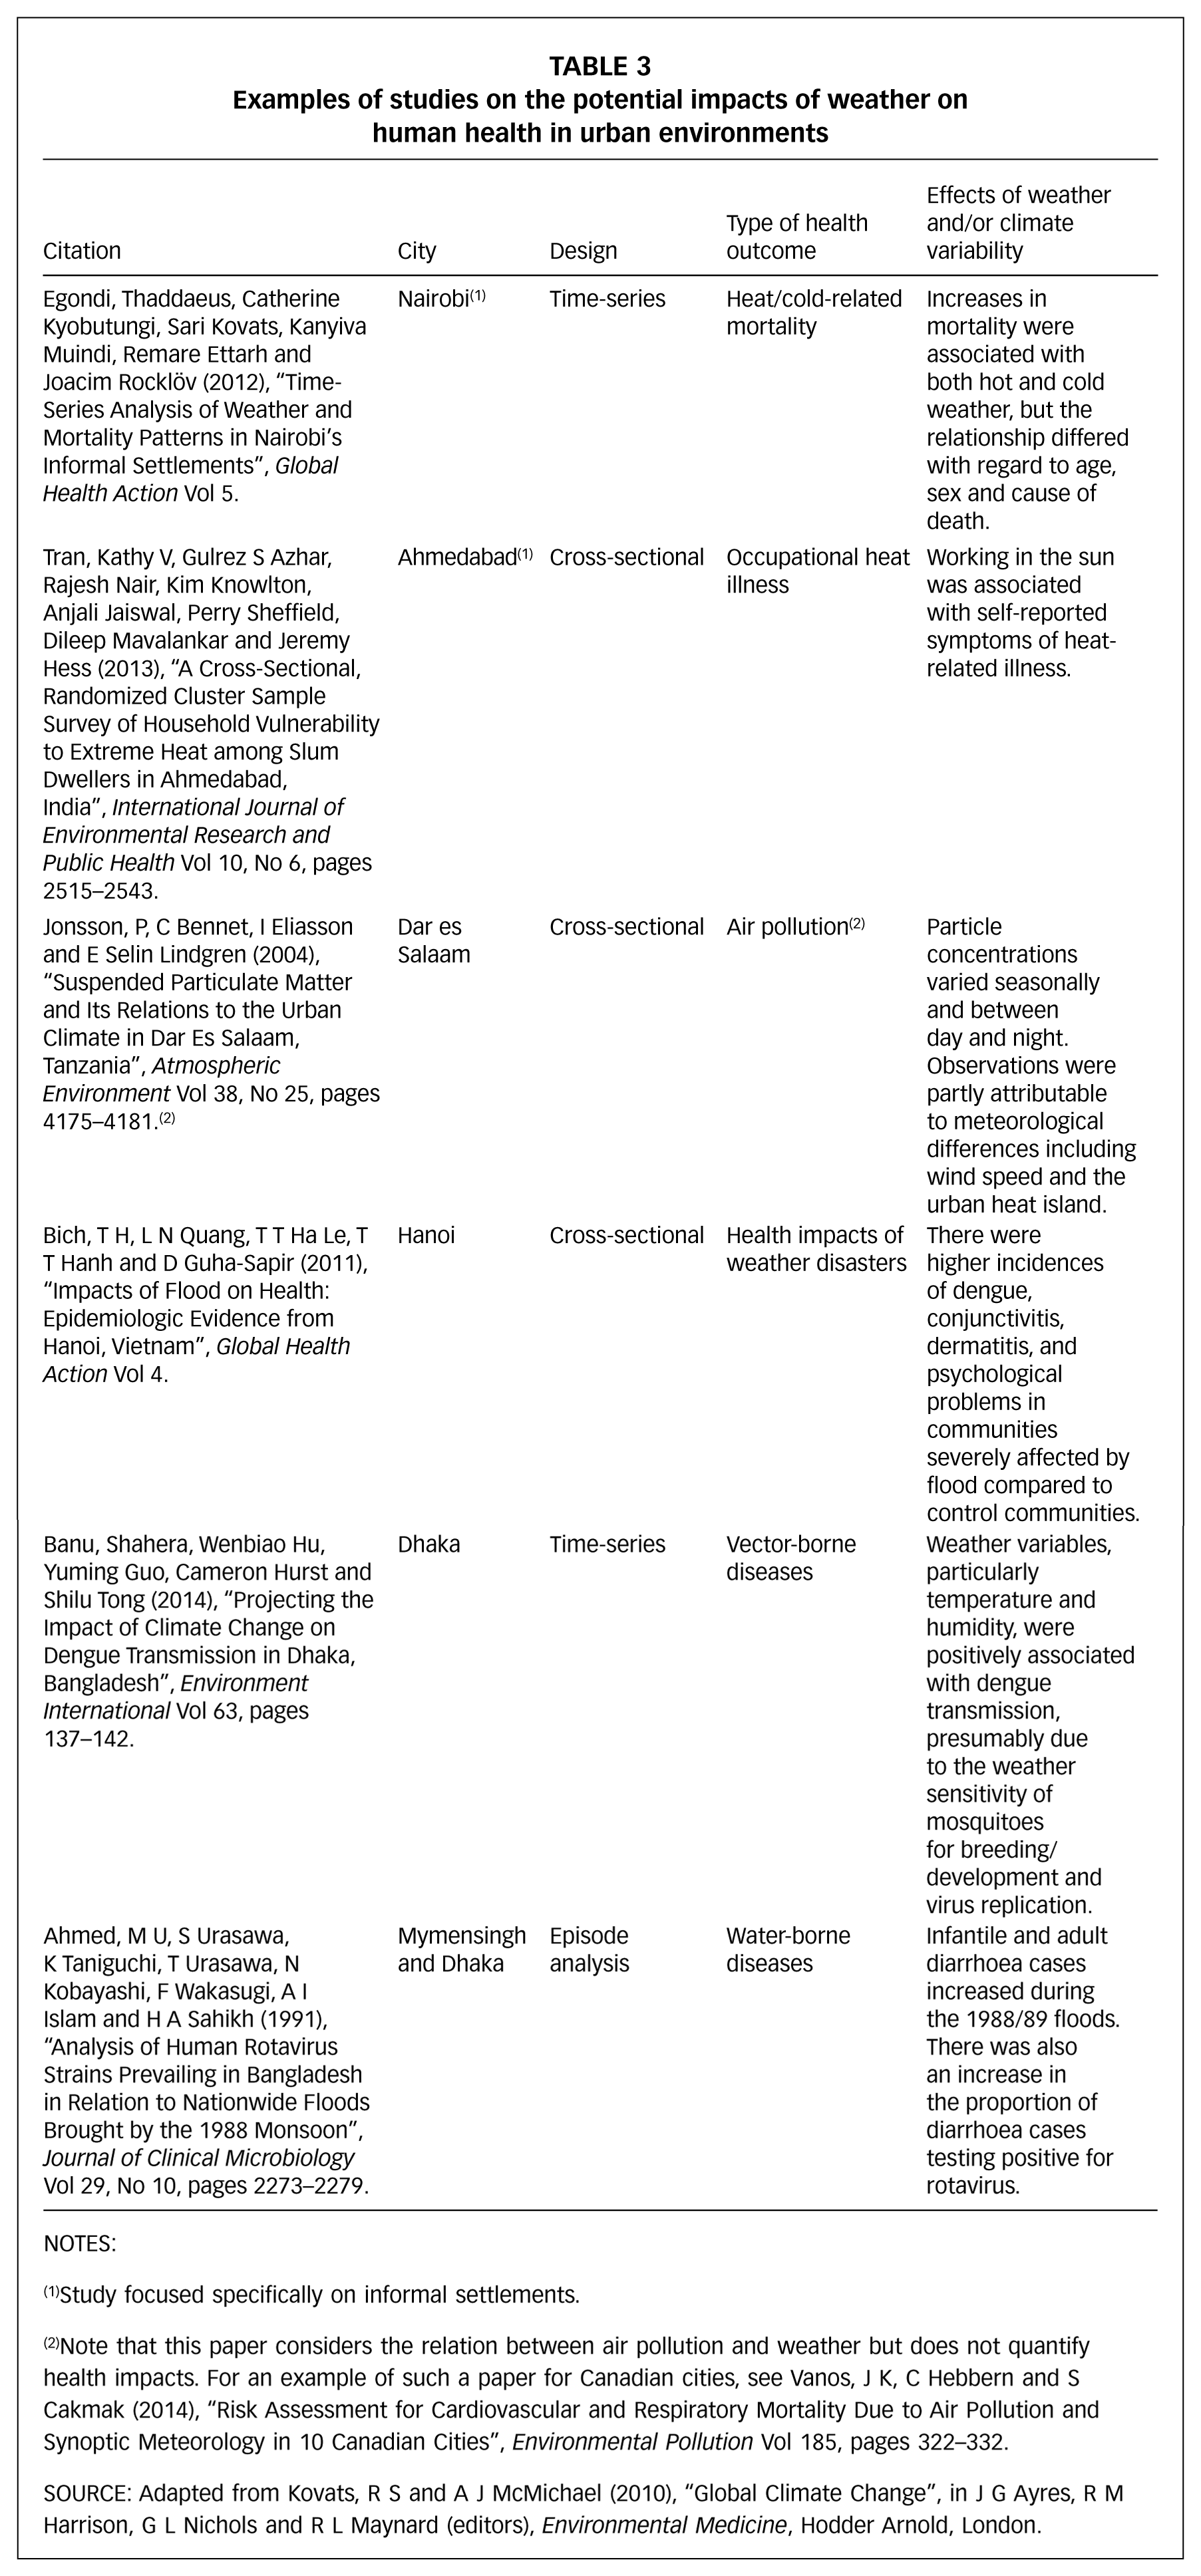
NOTES:
Study focused specifically on informal settlements.
Note that this paper considers the relation between air pollution and weather but does not quantify health impacts. For an example of such a paper for Canadian cities, see Vanos, J K, C Hebbern and S Cakmak (2014), “Risk Assessment for Cardiovascular and Respiratory Mortality Due to Air Pollution and Synoptic Meteorology in 10 Canadian Cities”, Environmental Pollution Vol 185, pages 322–332.
Source: Adapted from Kovats, R S and A J McMichael (2010), “Global Climate Change”, in J G Ayres, R M Harrison, G L Nichols and R L Maynard (editors), Environmental Medicine, Hodder Arnold, London.
a. Episode analysis
Generally considered to be one of the simpler epidemiological study designs, an episode analysis refers to the investigation of how a single event, such as a flood or heatwave, impacts on health.
Investigating the effects of an extreme event, for example, is possible when deaths are clearly attributable to the event, for instance from drowning during a flood. However, this relies on some form of data collection, which does not always occur in the immediate aftermath of a disaster. Even where reasonable data do exist, it is always a challenge to estimate impacts on morbidity, in particular those on mental health, which may be indirect and/or delayed.
The investigation of heatwaves (or cold spells) requires estimates of daily counts of mortality (or morbidity, e.g. hospital admissions). The health impact is explored by comparing the number of deaths during the event (observed) with an “expected” number of deaths. The expected number of deaths can be calculated based on data from previous years. An episode analysis requires an a priori definition of the timing of the episode, which should be based on the observed temperatures and not the mortality response. In an episode analysis, one does not control for potential confounders because the population is considered the same before, during and after the episode. Although air pollution is often high during a heatwave, it is considered as part of the exposure (the episode).
Figure 2 is a typical graphical representation of an episode analysis. In this case, the study analysed daily mortality in London during the summer of 2003. Daily deaths were compared against expected values and, as the figure shows, a period of substantially elevated mortality closely corresponded to the August heatwave.
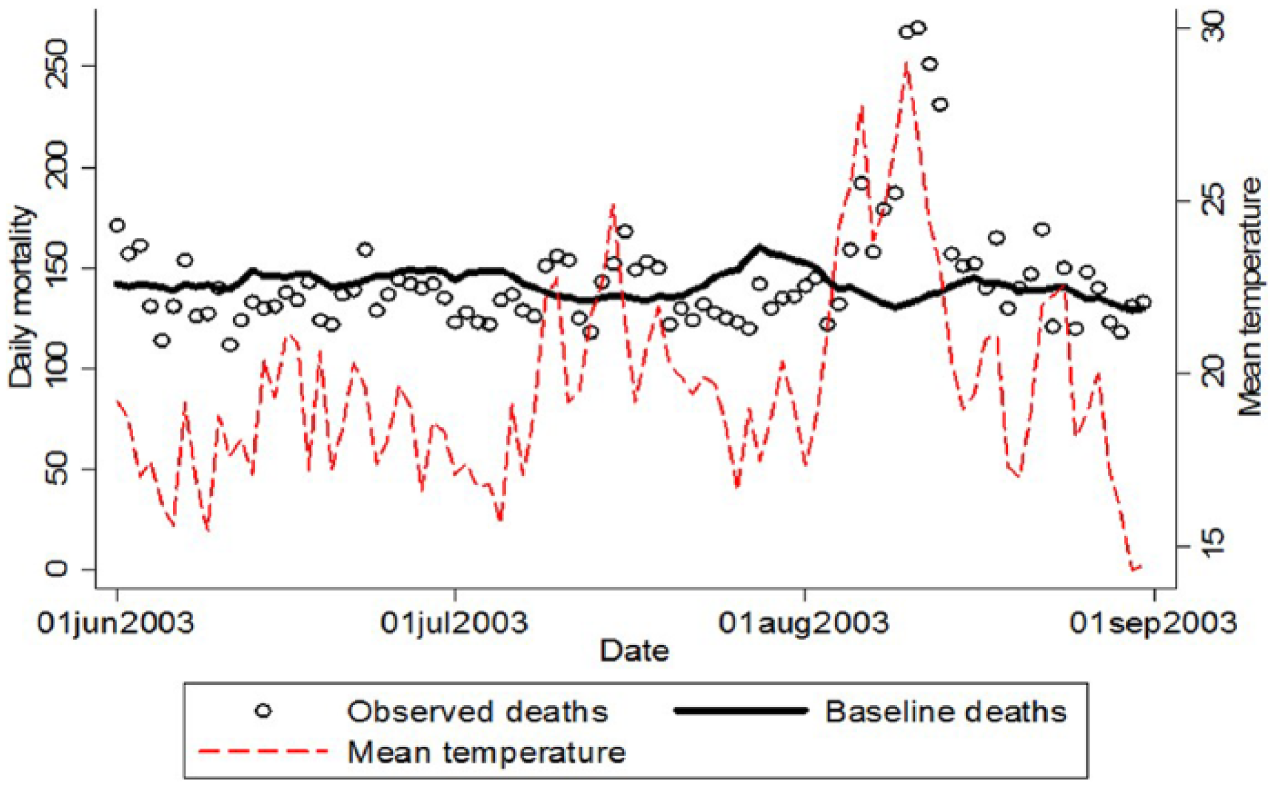
Daily mortality and mean temperature (°C) in London during the summer of 2003
b. Time-series regression
While an episode analysis quantifies the impact of a discrete event, time-series regression explores the relationship between outcome and exposure across the whole exposure range. More specifically, the method is commonly used in environmental epidemiology to study associations between short-term (e.g. daily) environmental exposures (particularly weather variables and air pollution) and health (often mortality or hospital admissions). Compared to many study designs, the data needs are modest: high-quality daily meteorological observations are available from national weather services, and daily or weekly totals of health outcomes may be obtained from routine data sources (vital registration or hospitals), provided the date of the death/event is accurately recorded. Nevertheless, these data are still not available for all populations.
Most often, time-series studies explore how day-to-day variations in exposure affect day-to-day changes in health. Studies may use longer (e.g. weekly or monthly) time periods, but in all time-series analyses, the main unit of analysis is time. Therefore, over these relatively short time scales, it is not necessary to control for typical confounders such as age, sex, etc. because the population under study will not change meaningfully from day to day.
It is however important to control for potential time-varying confounders. Time-series data of mortality counts or hospital admissions typically show strong temporal trends such as seasonality or a long-term trend. These patterns need to be removed in order to then assess if remaining short-term variations are associated with the exposure of interest. It is also necessary to control for potential confounders that change day to day and that are associated with both the exposure and the outcome. In studies of temperature, certain outdoor air pollutants are an important example.
In most populations, the relationship between daily temperature and mortality is roughly U-shaped, where there is a minimum mortality temperature range beyond which mortality risks increase as temperatures get lower (cold) and higher (heat) (Figure 3). The exact shape of the relationship (particularly the minimum mortality point, as well as the slopes) is known to differ by location, indicating that populations are adapted to their local climates to some extent.(25) Time-series studies have been used to explore a range of weather–health relationships in urban populations in developing countries, including those living in informal settlements (Table 3).
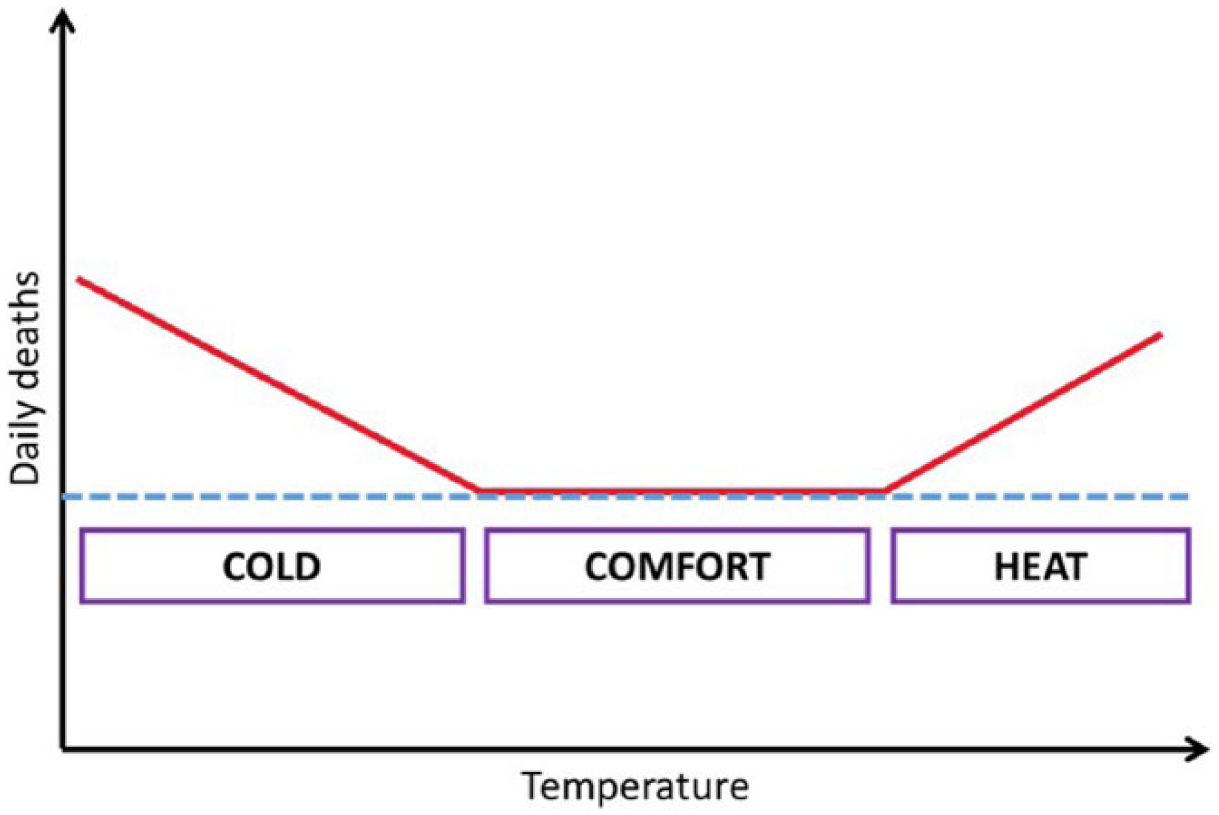
Schematic example of the results of a time-series study, including the minimum mortality temperature range (the “comfort” range), thresholds and slope of the heat/cold effects
There are many specific methodological issues with time-series studies that have been discussed in more detail elsewhere.(26) One issue worth mentioning is the importance of the “time-lag” between the exposure and the outcome. Exposure to a very hot day on day 1, for example, may affect mortality the following day (day 2) or the day after (day 3). Similarly, it may be that a period of sustained exposure over a few days is the most important predictor of adverse health effects.
There are a few other important points to bear in mind. First, the excess risks estimated by time-series studies are often relatively small, but because the whole population is typically exposed (to ambient temperature or outdoor air pollution), the total impact (burden of disease) at the population level can still be large. Second, time-series studies only look at the effect of short-term (daily or weekly) changes in a weather variable and should not be equated to the effects of a changing climate. Climate is a longer-term measure (decadal or longer), and if climate changes over time, so might the population’s response to weather, for example through adaptation. However, some time-series studies use long-term datasets to explore how the temperature responses have changed over time or compare responses in different cities to try and better understand the impacts of climate change.(27)
And third, time-series studies sometimes report that the initial increase in deaths after exposure is followed by a period of lower than expected daily counts. This pattern suggests some level of mortality displacement (or “harvesting”), whereby a proportion of the deaths attributed to the exposure occurred in people who might have died anyway soon afterwards.(28) If mortality displacement comprises a large proportion of the excess deaths, total disease burdens (in terms of years of life lost) will be much lower than if the deaths were of otherwise healthy individuals.
c. Cross-sectional studies
A cross-sectional study is an observational study that involves collecting data on a population or representative sample of a population during a period of time and comparing outcomes across exposures that vary in space rather than time. Cross-sectional studies may be used to estimate the prevalence of a disease in relation to an environmental exposure, but their relatively high susceptibility to bias and confounding makes them less ideal to investigate causality. Furthermore, as information on both exposure and outcome variables (and confounders) is collected simultaneously, it can be difficult to ascertain the direction of causality (i.e. whether the exposure preceded or followed the disease). Nevertheless, cross-sectional studies may be used to generate hypotheses and/or to support inferences of cause and effect. The main strengths of cross-sectional studies are that they are relatively quick and easy to conduct. Like time-series studies, cross-sectional surveys are frequently used in studies of urban populations in developing countries, including those living in informal settlements (Table 3).
IV. Health Data
Health data drawn from various sources are used to generate information that answers specific questions about population health. This means the potential utility of health data is not just a property of the data themselves; it also depends on the question of interest, the source of the data, and the technical method by which the raw data will be transformed into information about population health (e.g. cross-sectional versus time-series studies). In this section we focus on general types and sources of health data and means for evaluating their quality.
a. Types of data and questions of interest
Health data may be split into two general types: determinants of health and measures of health (health status). Other types of data, such as control (e.g. demographic) variables, are commonly used, but we do not discuss these in detail here.
There is a wide range of determinants of health (Table 4) and they tend to interact to shape population health. For example, a population living in improvised structures in an informal settlement (i.e. physical environment) without formal waste collection (i.e. a service) may be more likely to be flooded (i.e. physical environment) if waterways are blocked by rubbish, and are thus more likely to be disabled through injury (i.e. health outcome), which may in turn reduce employment opportunities (i.e. personal and family environment) and compromise the future health of dependents. Thus when the potential health impacts of climate change on a population are being assessed, wider determinants of health should also be considered.
Determinants and measures of health
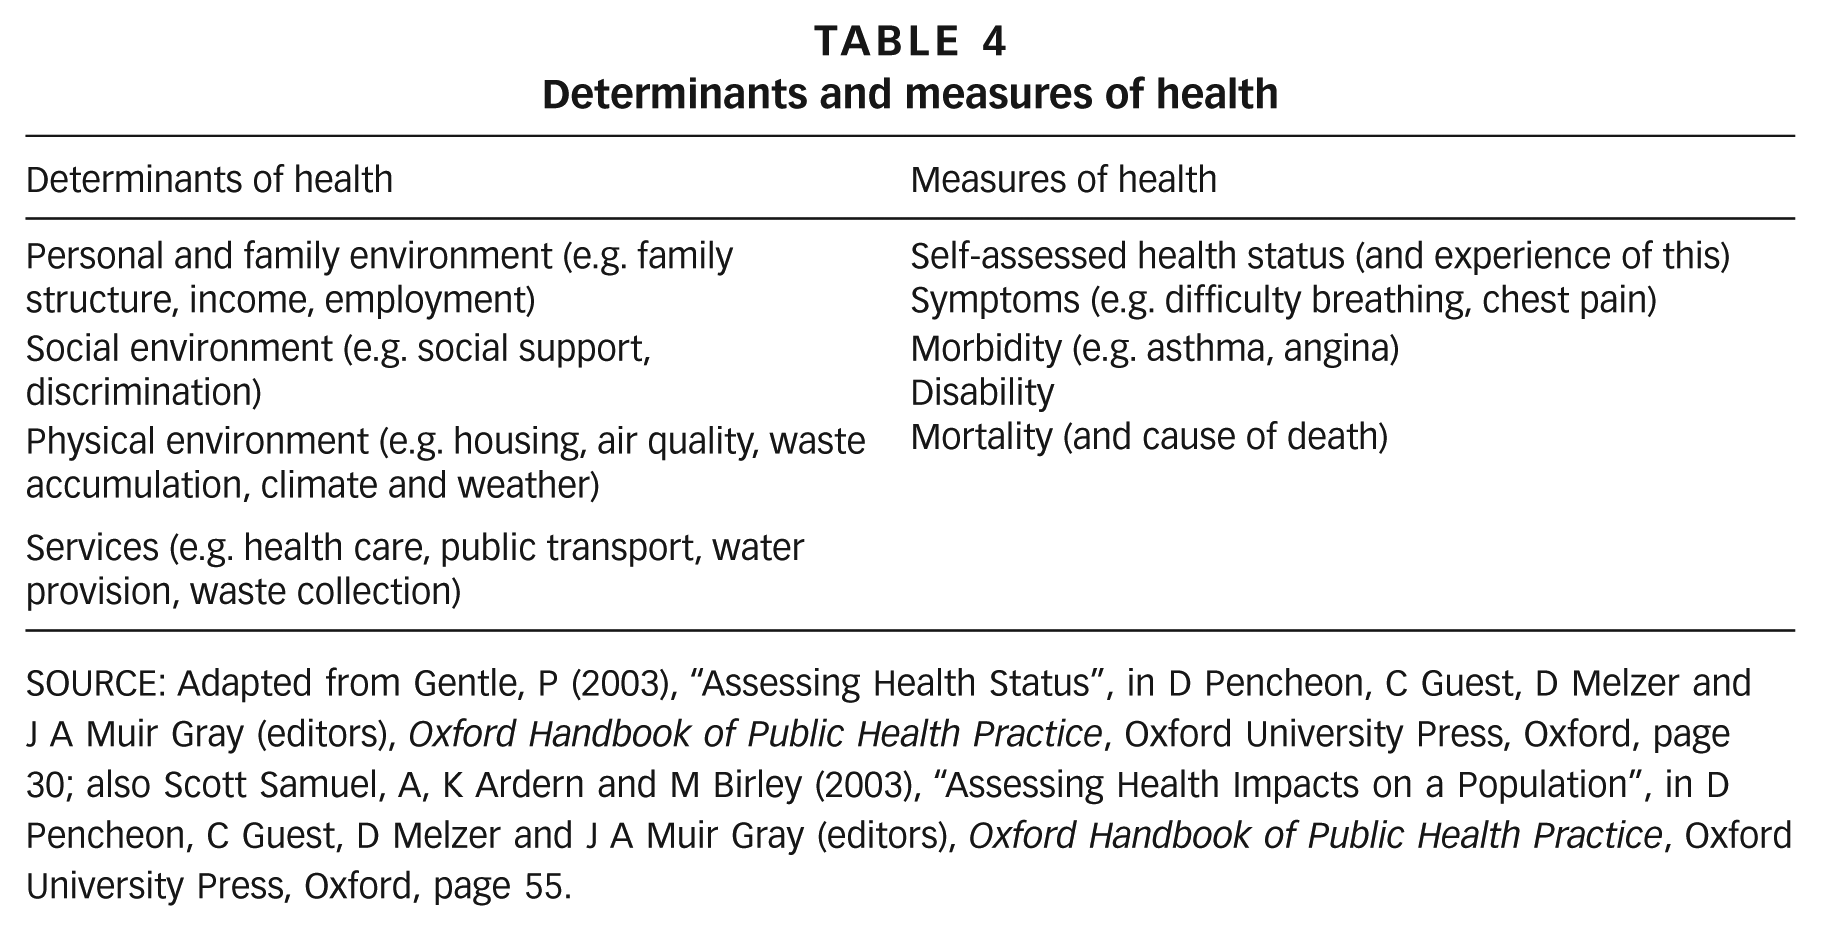
SOURCE: Adapted from Gentle, P (2003), “Assessing Health Status”, in D Pencheon, C Guest, D Melzer and J A Muir Gray (editors), Oxford Handbook of Public Health Practice, Oxford University Press, Oxford, page 30; also Scott Samuel, A, K Ardern and M Birley (2003), “Assessing Health Impacts on a Population”, in D Pencheon, C Guest, D Melzer and J A Muir Gray (editors), Oxford Handbook of Public Health Practice, Oxford University Press, Oxford, page 55.
Health data may capture a range of measures of health (Table 4), and are often considered “harder” or “softer”. Hard data may be characterized as precise, numerical (or coded by protocol), and reproducible, whereas soft data tend to be qualitative and subjective.(29) Mortality data are the “hardest” data, but recording may be incomplete and the recorded cause of death may be incorrect or missing. Measures of disability are less clear and need to be defined in advance of data collection. Data on symptoms can be particularly difficult to quantify as they are partly subjective and may arise from a range of underlying pathologies.
The suitability of available data depends on the question of interest and how the data will be used: for instance, hard data may be preferable when assessing cause-specific mortality rates, but soft data may be preferred when personal health experiences are of interest. This means that before health data are selected, the question and use must be clearly defined. This involves specifying the purpose of the assessment, the focal population(s), the health impact(s) of interest, and the analysis plan. Three main considerations are outlined in the upper half of Table 5. It is also necessary to consider the quality of the data themselves (lower half of Table 5).
Assessing the available health data relative to the intended purpose and in terms of data quality
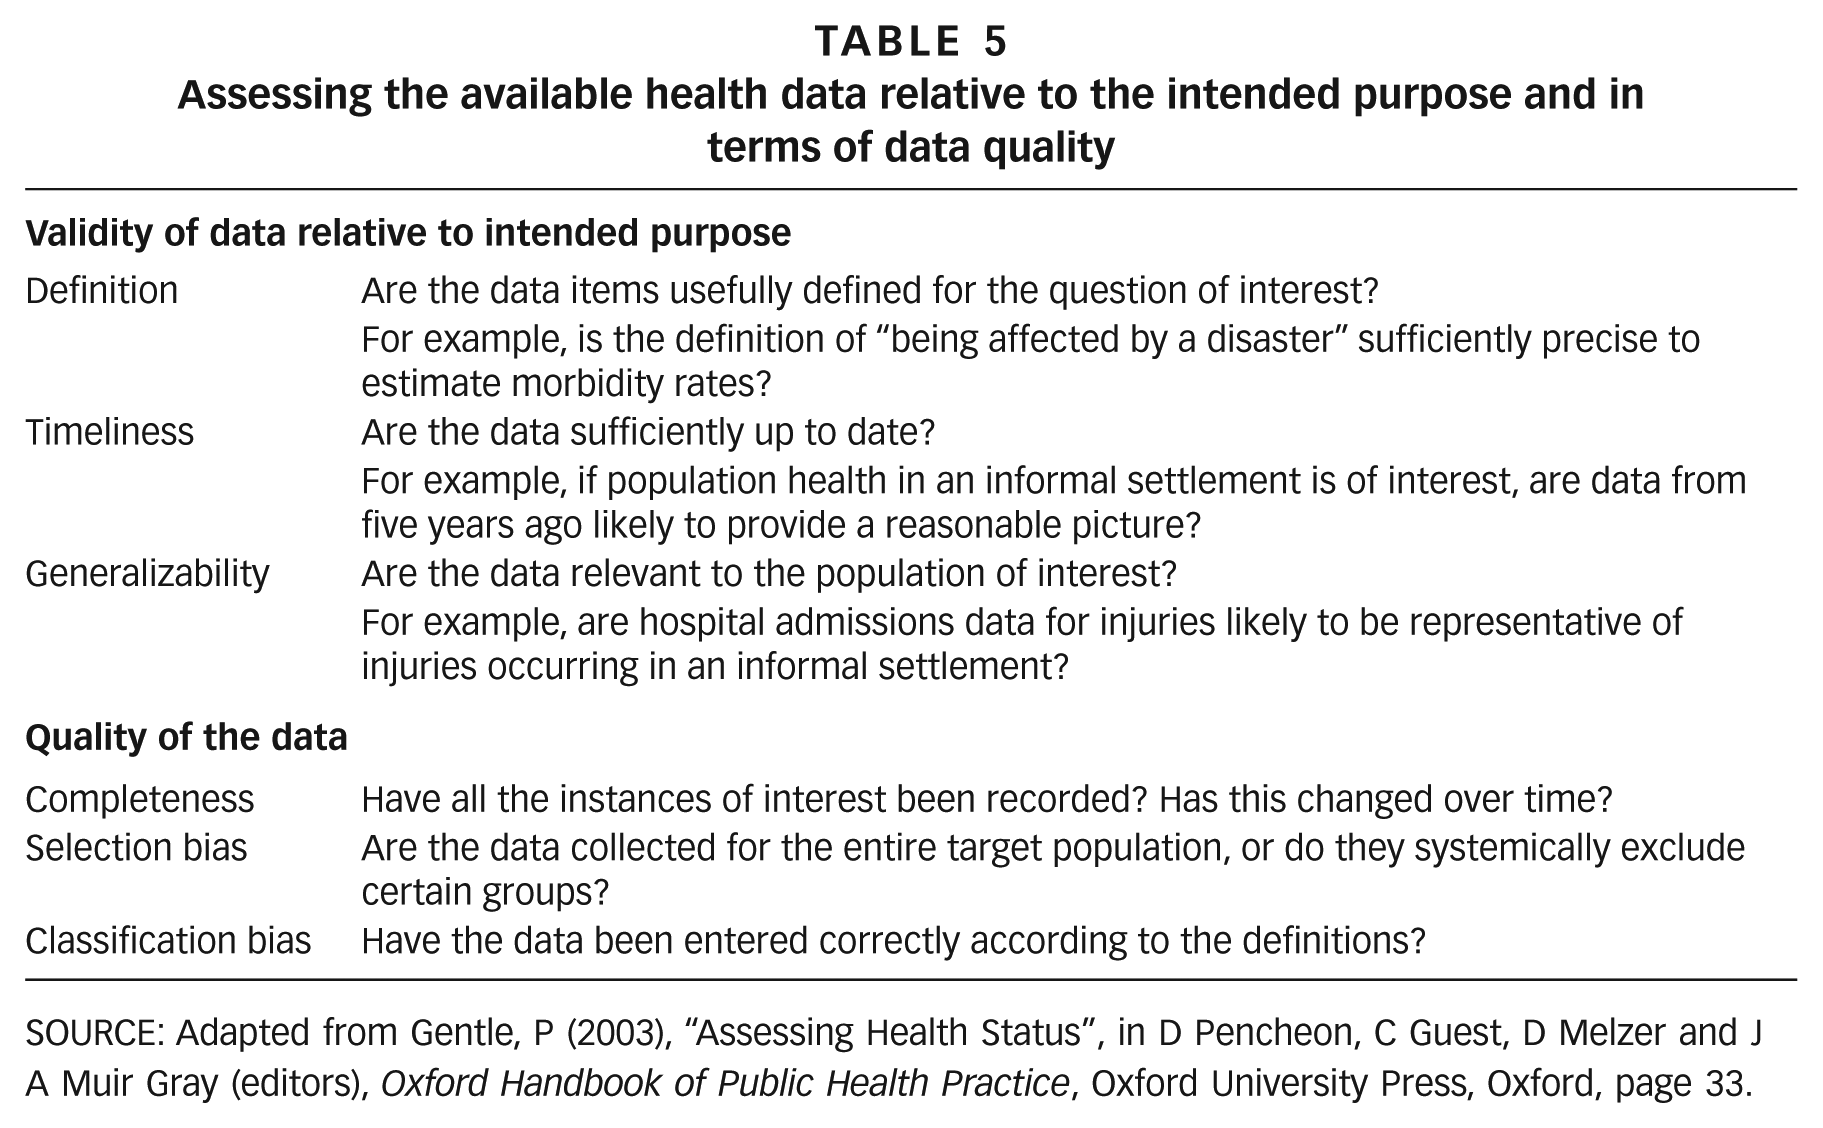
SOURCE: Adapted from Gentle, P (2003), “Assessing Health Status”, in D Pencheon, C Guest, D Melzer and J A Muir Gray (editors), Oxford Handbook of Public Health Practice, Oxford University Press, Oxford, page 33.
b. Sources of data
Sources of health data may be classified as routine or specially collected. Routine data are collected for a variety of purposes through vital registration (e.g. birth/death certificates) or the health system (e.g. hospital admissions data). They are available at regular intervals, are intended to allow tracking over time, and are coded using an agreed standard (e.g. International Classification of Diseases).(30)
Specially collected (or non-routine) data are usually collected on a one-off basis for a particular study or task, and coded according to the specific requirements of the study.(31) A third type of data is collected through demographic and health surveillance sites that are set up in areas where routine data are of poor quality or not available. These are intended to provide long-term data of high quality, and the cause of death is reported using a verbal autopsy rather than a death certificate.
Below we elaborate on and provide a broad typology of health data sources useful for researchers working in environmental health. When initiating a study in a given location we recommend that researchers liaise with a local partner with detailed knowledge of the site, population and available data.
V. Health Impacts of Natural (Weather) Disasters
The majority of deaths from disasters are associated with a small number of high-intensity events. Between 1975 and 2008, 23 “big” events caused 1.8 million deaths.(35) Over the same time period, however, almost 9,000 disaster events were reported. These events predominantly affected people living in poverty, caused 500,000 deaths, and produced low-intensity but frequent damage to local economies, housing, infrastructure and livelihoods.(36)
This suggests that although the poor may also be disproportionately affected by “big” events, for people living in urban slums, “small” events are likely to be of particular importance. Further, rather than being abnormal disruptions, these events and their impacts may be considered part of everyday existence.(37) This is so in two senses. First, small events occur extensively and frequently. Second, it is everyday existence itself that conditions vulnerability to weather hazards (as well as modifying hazards), and this interaction generates risk and disasters.
a. Hazard, vulnerability and exposure
The United Nations Office for Disaster Risk Reduction (UNISDR) defines a disaster as: “A serious disruption of the functioning of a community or a society involving widespread human, material, economic or environmental losses and impacts, which exceeds the ability of the affected community or society to cope using its own resources”.(38) UNISDR adds: “Disasters are often described as a result of the combination of: the exposure to a hazard; the conditions of vulnerability that are present; and insufficient capacity or measures to reduce or cope with the potential negative consequences.”
That is, three key factors that condition disaster risk are:
Hazard: something that is potentially dangerous, e.g. climate and weather extremes
Vulnerability: characteristics of a community that make it susceptible to a hazard, e.g. livelihood patterns
Exposure: people and property present in hazard zones
(For more details and examples of the types of data that may be used to operationalize these, see Section 2 of the supplementary material.)
This conceptualization raises a few general issues. First, it has been argued that there are no natural disasters – only natural hazards. A disaster is always a combination of natural and social factors.(39) Second, it may be argued that the “natural hazard” component is increasingly shaped by social influences – for instance, via the impacts of climate change on, say, tropical cyclone patterns, or via loss of soil permeability in urban areas, which reduces the intensity of rainfall required to generate a flood. Third, while disasters are events at particular moments that are temporally bounded, vulnerability is ever present and (usually) changes gradually over time.(40) Given the rapidity of growth and change in urban slums, it is plausible – perhaps likely – that vulnerability to disasters is changing at a faster rate than climate change is changing hazards, or will in the future. That is, to assess future disaster-associated health risks, at least as much attention should be given to vulnerability as to changes in climate-related hazards.
b. Health data sources for disaster research
The only open access global disaster dataset that includes health impact data is EM-DAT (the Emergency Events Database).(41) Disasters are reported at country level, although new entries include more detailed information on location. For each disaster, the total number of people killed is reported, but this is not disaggregated by age or cause. Estimates of numbers of people injured, “affected” and made homeless are also available but are not considered very reliable. At best, it is unlikely that EM-DAT can provide more than a very general and incomplete picture of disasters in slums.
UNISDR also holds a range of disaster statistics in different formats.(42) In general the data relate to hazard, exposure, and event type; health data, when available, are limited to deaths, and generally draw on EM-DAT or are modelled. As with EM-DAT, the global focus limits the utility of the data for local-level assessments.
While the above data sources contain information on disaster deaths, they do not include reliable information on morbidity. Disasters, however, may have major and long-lasting impacts on survivors. Given that disasters are always a combination of a hazard and social factors, the morbidity impacts of a given hazard of a given magnitude can vary enormously across space and time.
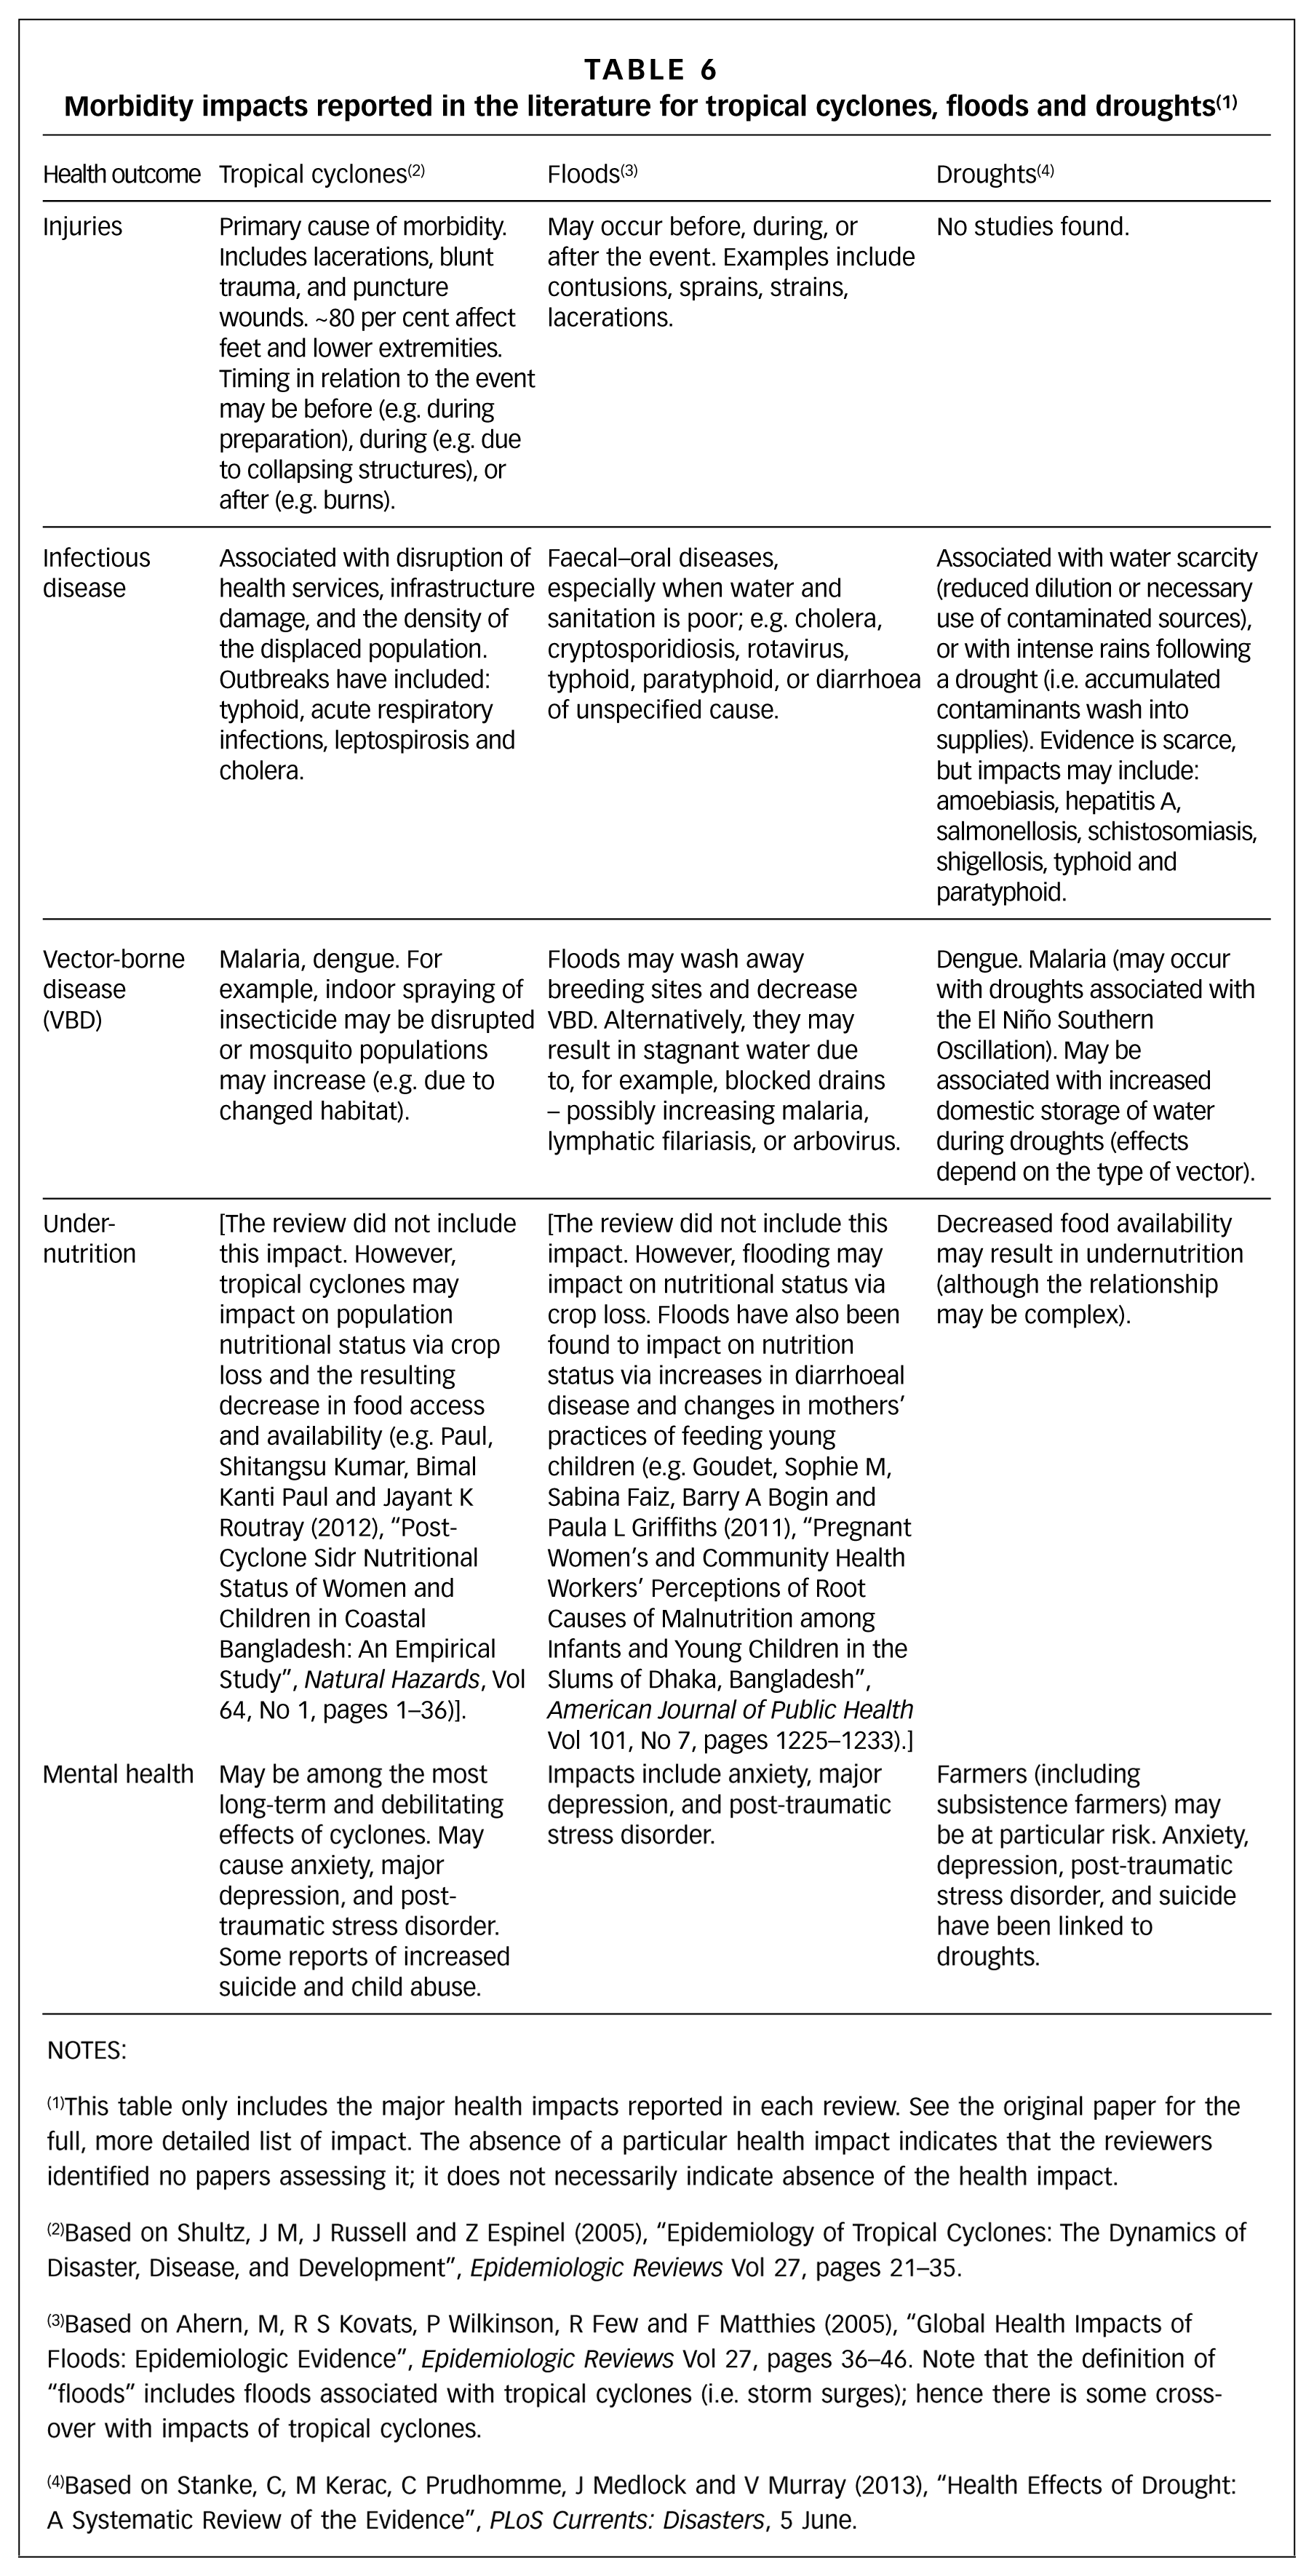
Reviews have assessed the types of morbidity impacts that may be expected. Table 6 draws on previous systematic reviews(43) and outlines the general morbidity impacts that have been associated with tropical cyclones, floods and droughts. (Please note that while some of the papers included in the reviews were based on surveillance data, most drew on data collected as part of specific epidemiological studies.) While the majority of disaster mortality occurs during the event phase, disaster-associated morbidity may occur in the pre-disaster phase (for example, while reinforcing structures) and after the event (for example, while living in crowded shelters).
Morbidity impacts reported in the literature for tropical cyclones, floods and droughts (1)
NOTES:
This table only includes the major health impacts reported in each review. See the original paper for the full, more detailed list of impact. The absence of a particular health impact indicates that the reviewers identified no papers assessing it; it does not necessarily indicate absence of the health impact.
Based on Shultz, J M, J Russell and Z Espinel (2005), “Epidemiology of Tropical Cyclones: The Dynamics of Disaster, Disease, and Development”, Epidemiologic Reviews Vol 27, pages 21–35.
Based on Ahern, M, R S Kovats, P Wilkinson, R Few and F Matthies (2005), “Global Health Impacts of Floods: Epidemiologic Evidence”, Epidemiologic Reviews Vol 27, pages 36–46. Note that the definition of “floods” includes floods associated with tropical cyclones (i.e. storm surges); hence there is some cross-over with impacts of tropical cyclones.
Based on Stanke, C, M Kerac, C Prudhomme, J Medlock and V Murray (2013), “Health Effects of Drought: A Systematic Review of the Evidence”, PLoS Currents: Disasters, 5 June.
c. Disasters in urban areas
As stated above, slum populations are growing, many people are settling in risky areas such as flood plains and unstable hillsides,(44) and slums are potentially vulnerable to disasters by definition. That is, the living conditions that define a slum – for example, lack of basic services such as water and sanitation, inadequate building structures, and overcrowding – also shape disaster vulnerability.
Climate-related hazards that affect urban areas include floods, tropical cyclones, drought, wildfires and heatwaves,(45) and these are expected to increase in frequency and/or intensity with climate change and sea level rise(46) (also see Table 1). Further, evidence from cities in Africa, Asia and Latin America suggests that the expansion of informal settlements is associated with increases in reports of weather-related disasters.(47) Thus, it may be anticipated that both urban hazards and urban vulnerability to disasters will increase in future years.
Comprehensively reviewing all the evidence of natural disasters in informal settlements is beyond the scope of this paper. However, to help inform the discussion, we systematically searched the literature for studies from four cities with large informal settlements: Dar es Salaam, Ibadan, Nairobi and Dhaka. These cities were chosen because they represent a useful cross-section in terms of climate, geography/location and research capacity.
Detailed tables listing the retrieved citations and describing the studies can be found in Section 3 of the supplementary material, but Table 7 summarizes the results. It shows that for three of the four cities, there are very few studies exploring natural disasters, including for Nairobi, which is generally considered to have relatively good health and demographic data. Dhaka has the most studies, due to the existence of a surveillance site and research capacity. In total, 13 of the 15 studies investigated floods and/or heavy rainfall events.
Number of studies retrieved from the literature search
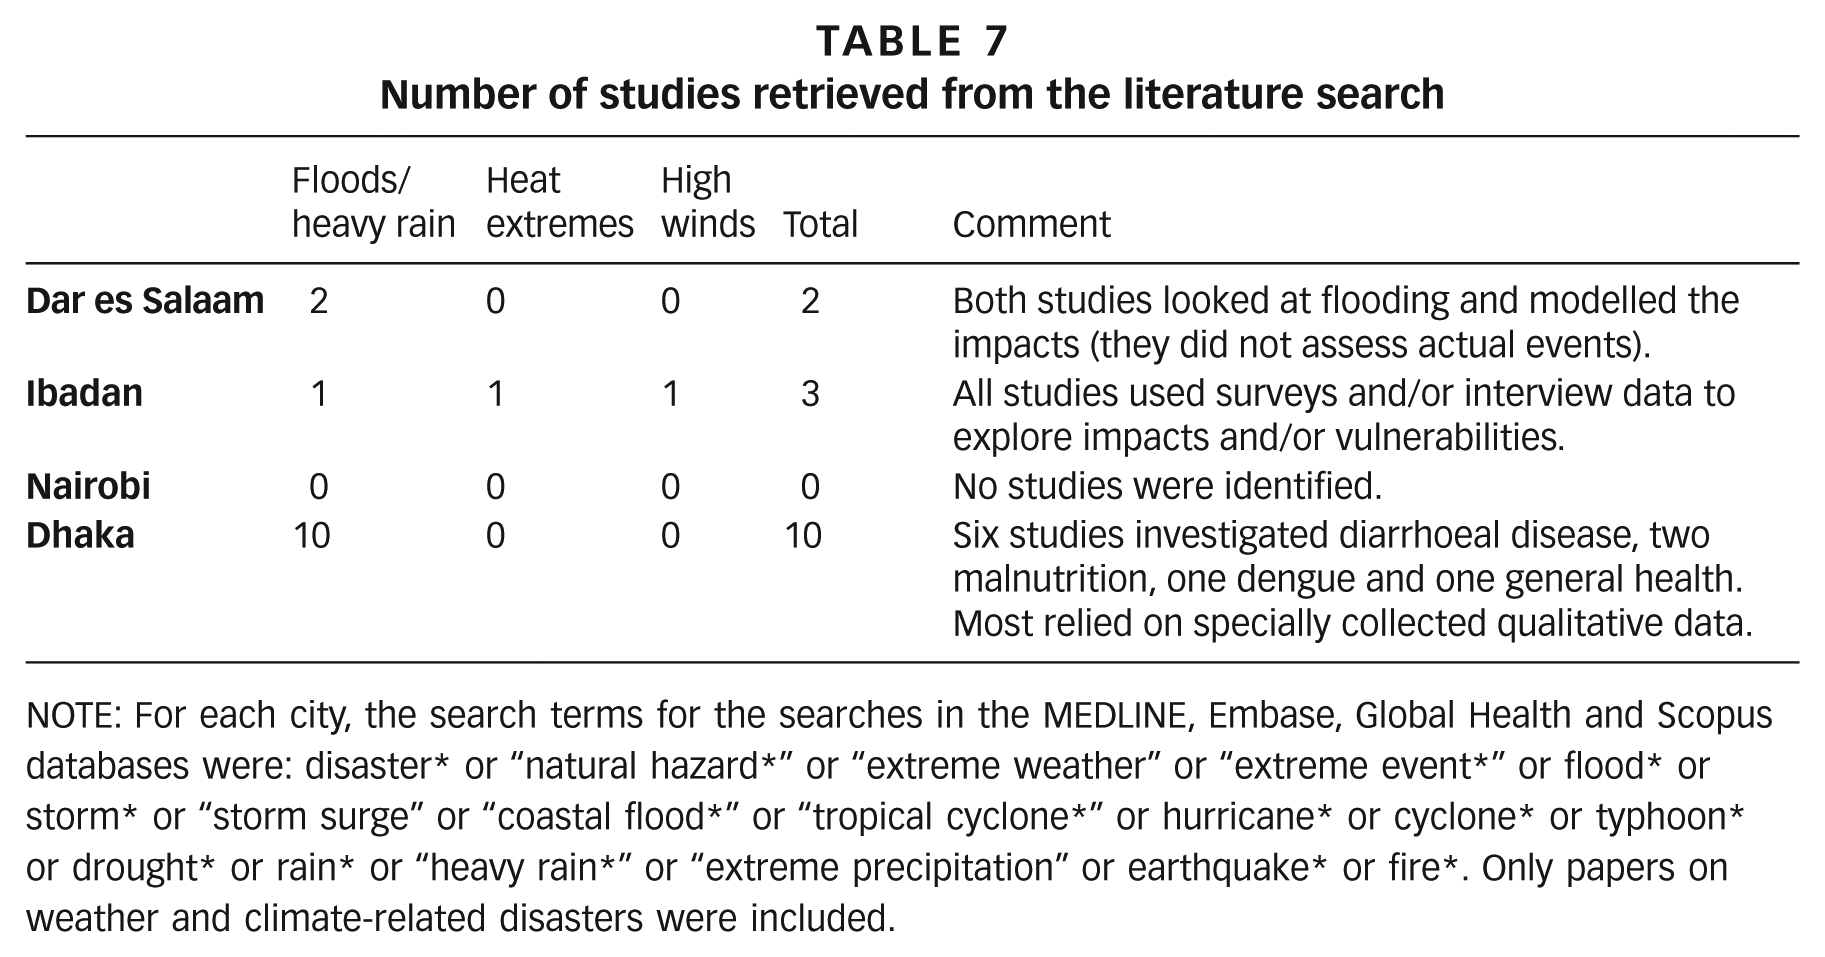
NOTE: For each city, the search terms for the searches in the MEDLINE, Embase, Global Health and Scopus databases were: disaster* or “natural hazard*” or “extreme weather” or “extreme event*” or flood* or storm* or “storm surge” or “coastal flood*” or “tropical cyclone*” or hurricane* or cyclone* or typhoon* or drought* or rain* or “heavy rain*” or “extreme precipitation” or earthquake* or fire*. Only papers on weather and climate-related disasters were included.
d. Reducing the health impacts of disasters
In order to reduce disaster health impacts, it is necessary to understand the interacting natural and social processes that shape risk. UNISDR has identified the following factors as drivers of urban disaster risk:
Weak governance (limiting institutions, infrastructure, services, and regulation)
Unplanned urban development (rapid growth, lack of land for low-income citizens, inappropriate construction)
Concentration of economic assets (growth fastest in coastal regions and near large navigable rivers)
Ecosystem decline (squatter encroachment on waterways; deforestation)
Additionally, processes that generate urban poverty may be of particular importance in shaping vulnerability to disasters.(48) For instance, low and unstable incomes may limit access to food, water and safe housing, each of which may increase risk (respectively via, for example, pre-existing malnutrition, increased susceptibility to infectious disease, and risk of injury). We provide a more detailed outline of urban poverty and disaster risk in Section 4 of the supplementary material.
While far from simple, it has been shown that the processes driving disaster risk can be addressed. Settlement upgrading, land access, provision of infrastructure, strengthened livelihoods, ecosystem protection, and micro-finance and insurance have all been shown to be effective in informal settlements.(49)
VI. Conclusions
Increasing concerns about climate change have spurred a broad and urgent research agenda that includes developing an evidence base to help prevent future health burdens through informed adaptation. Urban populations living in informal settlements are considered inherently vulnerable to the health impacts of climate change, but our understanding is insufficient to facilitate a quantification of the risks or the evaluation of responses. To help fill this research gap and thereby guide adaptation policies, this paper has described some key study designs that require only modest data inputs and that have previously been used in research about informal settlements. Nevertheless, lack of data is still a challenge in many populations and is likely to hinder future research.
Footnotes
1.
Note that climate is distinct from weather. Climate refers to the average weather over an extended period of time, with 30 years the classical averaging period. Climate change is therefore defined as a persistent and statistically discernible change in the mean and/or variability of the climate.
2.
IPCC (2014), “Climate Change 2014: Impacts, Adaptation, and Vulnerability: Summary for Policymakers”, in C B Field, V R Barros, D J Dokken, K J Mach, M D Mastrandrea, T E Bilir, M Chatterjee, K L Ebi, Y O Estrada, R C Genova, B Girma, E S Kissel, A N Levy, S MacCracken, P R Mastrandrea and L L White (editors), Climate Change 2014: Impacts, Adaptation, and Vulnerability. Part A: Global and Sectoral Aspects. Contribution of Working Group II to the Fifth Assessment Report of the Intergovernmental Panel on Climate Change, Cambridge University Press, Cambridge, United Kingdom and New York, NY, USA, pages 1–32; also IPCC (2012), “Summary for Policymakers”, in C B Field, V Barros, T F Stocker, D Qin, D J Dokken, K L Ebi, M D Mastrandrea, K J Mach, G K Plattner, S K Allen, M Tignor and P M Midgley (editors), A Special Report of Working Groups I and II of the Intergovernmental Panel on Climate Change, Cambridge University Press, Cambridge, UK and New York, NY, USA.
3.
See reference 2, IPCC (2012).
4.
See reference 2, IPCC (2012); also Blanco, G, R Gerlagh, S Suh, J Barrett, H C de Coninck, C F Diaz Morejon, R Mathur, N Nakicenovic, A Ofosu Ahenkora, J Pan, H Pathak, J Rice, R Richels, S J Smith, D I Stern, F L Toth and P Zhou (2014), “Chapter 5: Drivers, Trends and Mitigation”, in O Edenhofer, R Pichs-Madruga, Y Sokona, E Farahani, S Kadner, K Seyboth, A Adler, I Baum, S Brunner, P Eickemeier, B Kriemann, J Savolainen, S Schlömer, C von Stechow, T Zwickel and J C Minx (editors), Climate Change 2014: Mitigation of Climate Change. Contribution of Working Group III to the Fifth Assessment Report of the Intergovernmental Panel on Climate Change, Cambridge University Press, Cambridge, UK and New York, NY, USA.
5.
See reference 2, IPCC (2012); also Smith, K R, A Woodward, D Campbell-Lendrum, D D Chadee, Y Honda, Q Liu, J M Olwoch, B Revich and R Sauerborn (2014), “Human Health: Impacts, Adaptation, and Co-Benefits”, in C B Field, V R Barros, D J Dokken, K J Mach, M D Mastrandrea, T E Bilir, M Chatterjee, K L Ebi, Y O Estrada, R C Genova, B Girma, E S Kissel, A N Levy, S MacCracken, P R Mastrandrea and L L White (editors), Climate Change 2014: Impacts, Adaptation, and Vulnerability. Part A: Global and Sectoral Aspects. Contribution of Working Group II to the Fifth Assessment Report of the Intergovernmental Panel on Climate Change, Cambridge University Press, Cambridge, UK and New York, NY, USA.
6.
See reference 5, Smith et al. (2014); also Hales, S, S Kovats, S Lloyd and D Campbell-Lendrum (2014), Quantitative Risk Assessment of the Effects of Climate Change on Selected Causes of Death, 2030s and 2050s, World Health Organization, Geneva.
8.
Revi, A, D E Satterthwaite, F Aragón-Durand, J Corfee-Morlot, R B R Kiunsi, M Pelling, D C Roberts and W Solecki (2014), “Urban Areas”, in C B Field, V R Barros, D J Dokken, K J Mach, M D Mastrandrea, T E Bilir, M Chatterjee, K L Ebi, Y O Estrada, R C Genova, B Girma, E S Kissel, A N Levy, S MacCracken, P R Mastrandrea and L L White (editors), Climate Change 2014: Impacts, Adaptation, and Vulnerability. Part A: Global and Sectoral Aspects. Contribution of Working Group II to the Fifth Assessment Report of the Intergovernmental Panel on Climate Change, Cambridge University Press, Cambridge, UK and New York, NY, USA.
9.
See reference 8; also Alirol, Emilie, Laurent Getaz, Beat Stoll, François Chappuis and Louis Loutan (2011), “Urbanisation and Infectious Diseases in a Globalised World”, The Lancet Infectious Diseases Vol 11, No 2, pages 131–141; Douglas, Ian, Kurshid Alam, Maryanne Maghenda, Yasmin McDonnell, Louise McLean and Jack Campbell (2008), “Unjust Waters: Climate Change, Flooding and the Urban Poor in Africa”, Environment and Urbanization Vol 20, No 1, pages 187–205; and Hajat, Shakoor and Tom Kosatky (2010), “Heat-Related Mortality: A Review and Exploration of Heterogeneity”, Journal of Epidemiology and Community Health Vol 64, No 9, pages 753–760.
10.
Murray, Christopher J (1994), “Quantifying the Burden of Disease: The Technical Basis for Disability-Adjusted Life Years”, Bulletin of the World Health Organization Vol 72, No 3, pages 429–445.
11.
Romeder, J M and J R McWhinnie (1977), “Potential Years of Life Lost between Ages 1 and 70: An Indicator of Premature Mortality for Health Planning”, International Journal of Epidemiology Vol 6, No 2, pages 143–151; also Stanke, C, M Kerac, C Prudhomme, J Medlock and V Murray (2013), “Health Effects of Drought: A Systematic Review of the Evidence”, PLoS Currents: Disasters, 5 June.
12.
Gold, Marthe R, David Stevenson and Dennis G Fryback (2002), “HALYs and QALYs and DALYs, Oh My: Similarities and Differences in Summary Measures of Population Health”, Annual Review of Public Health Vol 23, No 1, pages 115–134.
13.
See reference 12.
14.
See reference 10; also Anand, Sudhir and Kara Hanson (1997), “Disability-Adjusted Life Years: A Critical Review”, Journal of Health Economics Vol 16, No 6, pages 685–702; and Murray, C J L, M Ezzati, A D Lopez, A Rodgers and S Vander Hoorn (2003), “Comparative Quantification of Health Risks: Conceptual Framework and Methodological Issues”, Population Health Metrics Vol 1, No 1, pages 1–20.
15.
Pruss-Ustun, A, D Campbell-Lendrum, C Corvalan and A Woodward (2003), Assessing the Environmental Burden of Disease at National and Local Levels, Environmental Burden of Disease Series, WHO, Geneva.
16.
See reference 15.
17.
See reference 15.
18.
IHME (2013), About the Global Burden of Disease, accessed 3 February 2014 at ![]() .
.
19.
Adult Morbidity and Mortality Project (2004), Policy Implications of Tanzania’s Mortality Burden: Mortality Burden Profiles from Sentinal Sites, 1994-2002; also Kyobutungi, C, A S Ziraba, A Ezeh and Y Yé (2008), “The Burden of Disease Profile of Residents of Nairobi’s Slums: Results from a Demographic Surveillance System”, Population Health Metrics Vol 6, No 1, page 1.
21.
The term “slum” usually has derogatory connotations and can suggest that a settlement needs replacement or can legitimate the eviction of its residents. However, it is a difficult term to avoid for at least three reasons. First, some networks of neighbourhood organizations choose to identify themselves with a positive use of the term, partly to neutralize these negative connotations; one of the most successful is the National Slum Dwellers Federation in India. Second, the only global estimates for housing deficiencies, collected by the United Nations, are for what they term “slums”. And third, in some nations, there are advantages for residents of informal settlements if their settlement is recognized officially as a “slum”; indeed, the residents may lobby to get their settlement classified as a “notified slum”. Where the term is used in this journal, it refers to settlements characterized by at least some of the following features: a lack of formal recognition on the part of local government of the settlement and its residents; the absence of secure tenure for residents; inadequacies in provision for infrastructure and services; overcrowded and sub-standard dwellings; and location on land less than suitable for occupation. For a discussion of more precise ways to classify the range of housing sub-markets through which those with limited incomes buy, rent or build accommodation, see Environment and Urbanization Vol 1, No 2 (1989), available at ![]() .
.
24.
Kovats, R S and A J McMichael (2010), “Global Climate Change”, in J G Ayres, R M Harrison, G L Nichols and R L Maynard (editors), Environmental Medicine, Hodder Arnold, London.
25.
See reference 9, Hajat and Kosatky (2010); also Basu, Rupa (2009), “High Ambient Temperature and Mortality: A Review of Epidemiologic Studies from 2001 to 2008”, Environmental Health Vol 8, article 40; and McMichael, Anthony J, Paul Wilkinson, R Sari Kovats, Sam Pattenden, Shakoor Hajat, Ben Armstrong, Nitaya Vajanapoom, Emilia M Niciu, Hassan Mahomed and Chamnong Kingkeow (2008), “International Study of Temperature, Heat and Urban Mortality: The ‘Isothurm’ project”, International Journal of Epidemiology Vol 37, No 5, pages 1121–1131.
26.
Bhaskaran, Krishnan, Antonio Gasparrini, Shakoor Hajat, Liam Smeeth and Ben Armstrong (2013), “Time Series Regression Studies in Environmental Epidemiology”, International Journal of Epidemiology Vol 42, No 4, pages 1187–1195; also Gasparrini, Antonio and Ben Armstrong (2010), “Time Series Analysis on the Health Effects of Temperature: Advancements and Limitations”, Environmental Research Vol 110, No 6, pages 633–638.
27.
See reference 25, McMichael et al. (2008); also Carson, Claire, Shakoor Hajat, Ben Armstrong and Paul Wilkinson (2006), “Declining Vulnerability to Temperature-Related Mortality in London over the 20th Century”, American Journal of Epidemiology Vol 164, No 1, pages 77–84.
29.
Tennison, B (2003), “Assessing Information”, in D Pencheon, C Guest, D Melzer and J A Muir Gray (editors), Oxford Handbook of Public Health Practice, Oxford University Press, Oxford.
30.
See reference 29.
31.
See reference 29.
32.
WHO (2015), Public health surveillance, accessed 29 June 2015 at ![]() .
.
35.
36.
See reference 35.
37.
Wisner, B, P Blaikie, T Cannon and I Davis (2004), At Risk, 2nd edition, Routledge, Oxon.
38.
UNISDR (2007), Terminology, accessed 11 March 2014 at ![]() .
.
39.
See reference 37.
40.
See reference 37.
41.
Centre for Research on the Epidemiology of Disasters (2014), Em-Dat: The International Disaster Database, accessed 25 February 2014 at ![]() .
.
42.
UNISDR (2014), Disaster Statistics, accessed 11 March 2014 at ![]() .
.
43.
See reference 11, Stanke et al. (2013); also Ahern, M, R S Kovats, P Wilkinson, R Few and F Matthies (2005), “Global Health Impacts of Floods: Epidemiologic Evidence”, Epidemiologic Reviews Vol 27, pages 36–46; and Shultz, J M, J Russell and Z Espinel (2005), “Epidemiology of Tropical Cyclones: The Dynamics of Disaster, Disease, and Development”, Epidemiologic Reviews Vol 27, pages 21–35.
45.
See reference 44.
46.
See reference 2, IPCC (2012).
47.
See reference 35.
49.
See reference 44.
References
Supplementary Material
Please find the following supplemental material available below.
For Open Access articles published under a Creative Commons License, all supplemental material carries the same license as the article it is associated with.
For non-Open Access articles published, all supplemental material carries a non-exclusive license, and permission requests for re-use of supplemental material or any part of supplemental material shall be sent directly to the copyright owner as specified in the copyright notice associated with the article.