
Abstract
Sanitation-related health risks in low-income urban areas are concentrated in localities in which sanitation facilities and infrastructure are poorly developed and maintained. A simple and systematic approach to quantify these risks can be used to identify vulnerable communities and to support decisions about the types of interventions to mitigate these risks. The methodology described in this paper utilizes local stakeholder knowledge in a participatory process to score sanitation risks, using a framework of indicators that provides a quantitative assessment of the intensity and distribution of risk. The approach considers the extent of hazardous events related to faecal contamination of the environment, the level of local community exposure to this hazard, and vulnerability factors that exacerbate the impacts of infection. The paper describes the development of the methodology and its application in Maputo and outlines how this approach might be used to support the preparation of city sanitation plans. The approach is validated through the use of a conventional household survey, the results of which are compared with those from the community workshops.
I. Introduction
Health risks related to inadequate sanitation are prevalent in urban areas throughout the developing world, particularly in low-income, informal settlements where infrastructure provision and related services are poor. These risks arise from a lack of efficient arrangements for excreta management along the sanitation chain (i.e. from capture/collection to final disposal/reuse) and poor sanitation practices and behaviours, resulting in exposure to pathogens contained in human excreta. The health burden falls most heavily on those living in poor communities, who are more frequently exposed to infection; among them, children are disproportionately susceptible to the risks.(1)
In this context, the objective of the research was to develop a methodology to support sanitation planning in situations where information about existing systems is scarce. The Rapid Participatory Sanitation System Risk Assessment (RPSSRA) methodology was developed by the International Water Association (IWA) and University College London, and applied by a local partner (CLASS-A) as part of a research project entitled Sustainable and resilient sanitation service chains in Maputo province – action research and piloting for the benefit of the urban poor. CLASS-A is an NGO based in Maputo, which aims to act as an interface among government agencies, private sector actors and poor communities that currently lack adequate sanitation services. The research was funded by the European Water Initiative (ERA-NET) research programme (SPLASH), which set out to address urban sanitation challenges at scale in sub-Saharan Africa by developing solutions focusing on the entire sanitation service delivery chain.
a. Disease transmission routes in the urban environment
Eisenberg et al.(2) observe that there is a tendency to distinguish between environmental and social conditions affecting health but note that, in reality, these are inextricably linked and any process affecting human health is a combination of the two. Therefore, a contextual understanding of the determinants of sanitation risks relating to both sets of factors is necessary to develop strategies that prioritize sanitation interventions for communities that are at most risk.
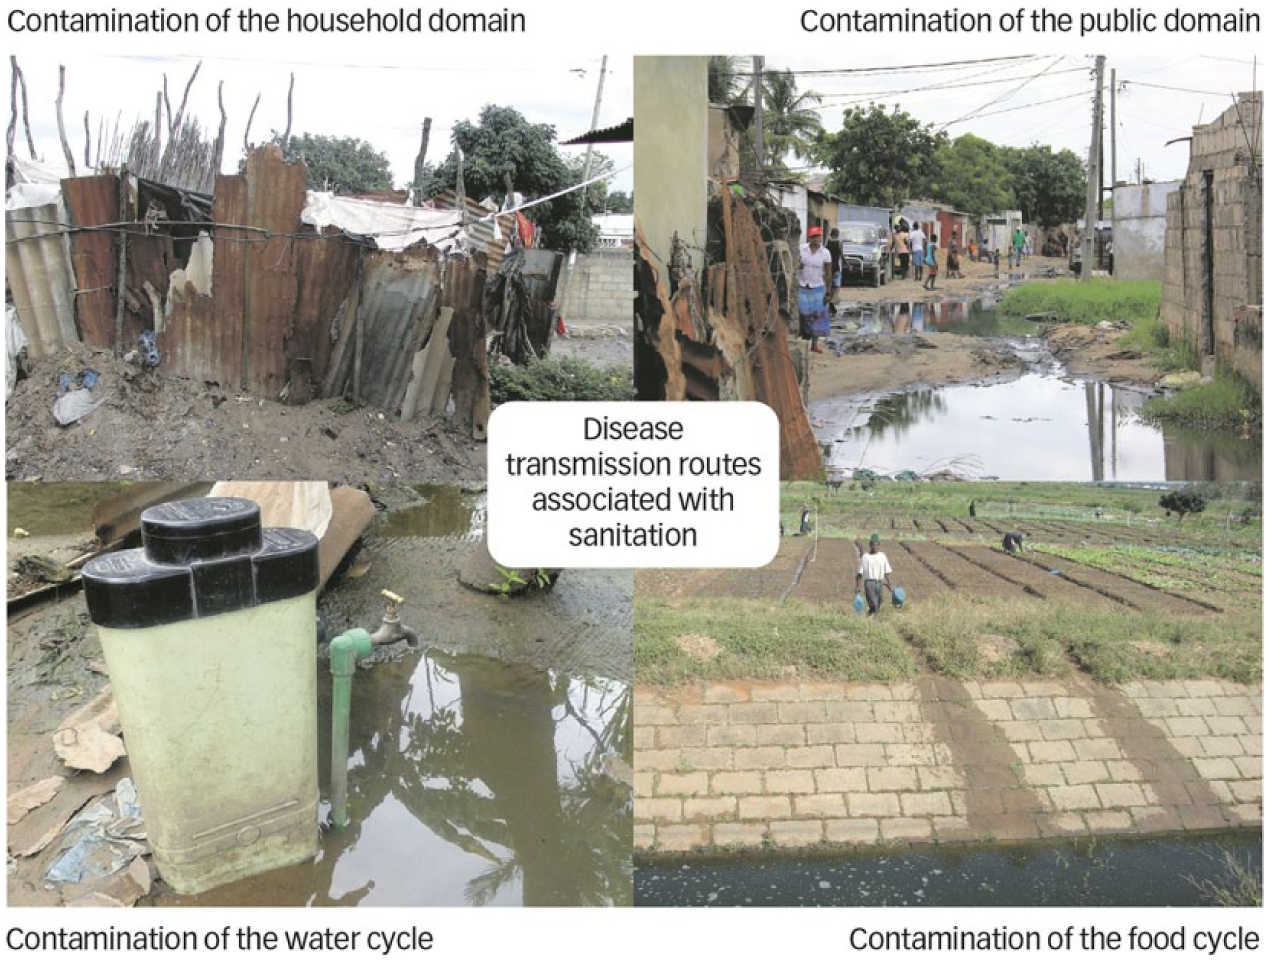
Cairncross et al.(3) also make the important distinction between transmission routes of infectious diseases within the domestic (household) domain and those in the public domain (e.g. streets, workplaces, schools, etc.). An extension of this concept is used to define four domains in the urban environment, each of which is typified by a predominant disease transmission pathway (Figure 1). These relate to contamination of the household and public domains (indirect transmission), as well as direct transmission via contamination of water supplies or the food cycle. In each domain, we observe specific conditions and practices or behaviours that exacerbate disease transmission, as well as other environmental factors not directly related to excreta management that exacerbate health risks.
Exposure to sanitation-related health hazards is determined by contamination pathways
The F-diagram, originally proposed by Wagner and Lanoix(4) and further developed by Carr,(5) highlights the pathways of disease transmission related to fluids, fingers, flies and fields (Figure 2). Although polluted water is commonly perceived to be the mechanism for transmission of microbial pathogens, the direct person-to-person pathway generally predominates, especially where faecal contamination of the domestic environment is high.(6) The F-diagram may be used to help people understand how different interventions reduce disease transmission by interrupting the different pathways. An understanding of these relationships is essential for the design and implementation of excreta management schemes, or modification of existing schemes, so that they lead to a decreased risk of disease.(7)
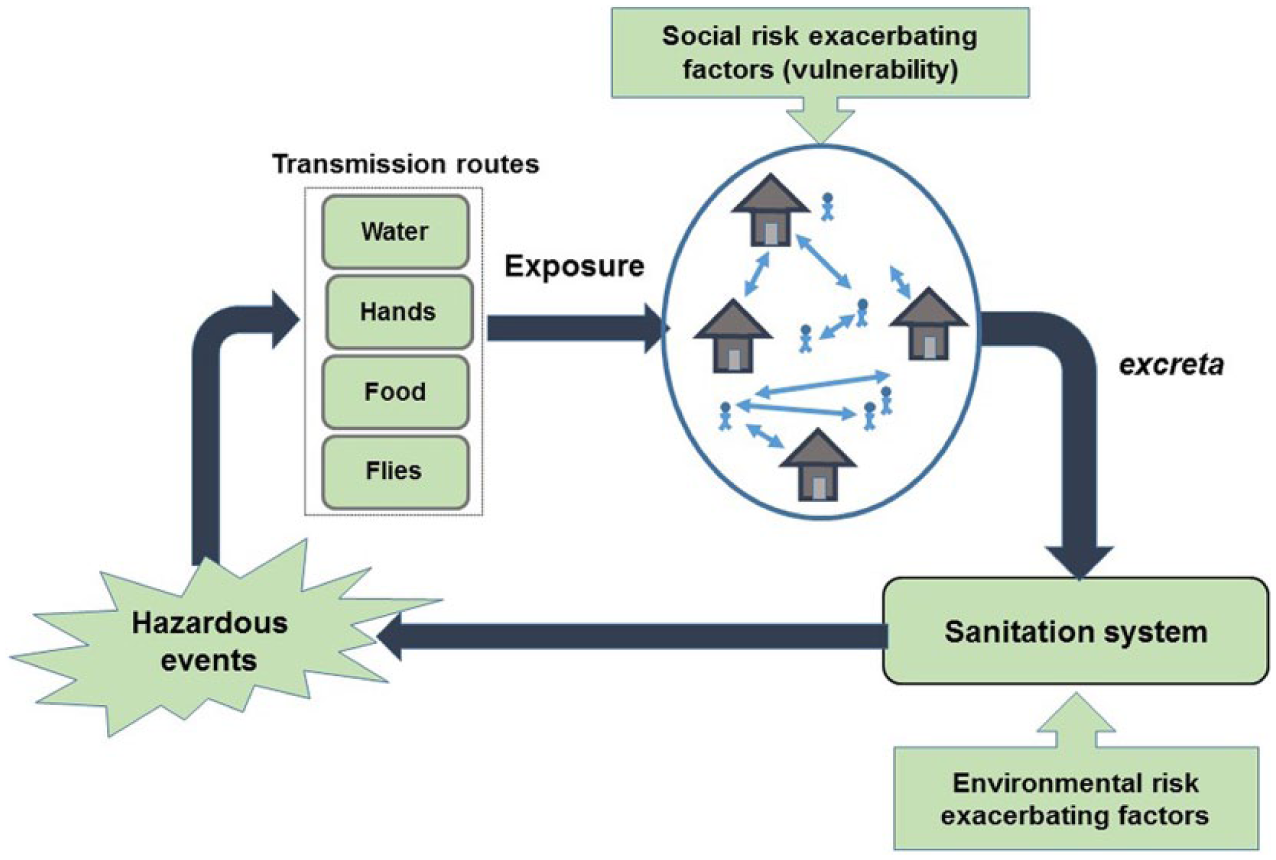
Disease transmission routes related to sanitation, highlighting components of risk related to a) hazardous events, b) exposure, and c) vulnerability
b. Assessing health risks related to sanitation for sanitation safety planning
Risk assessment is based on the assumption that in situations in which excreta are not safely contained, local residents are at risk of exposure to faecal matter containing pathogens, which may lead to illness and further propagation of disease. The concentration of the pathogens ingested and the individual’s vulnerability (and therefore susceptibility to disease) will determine the likelihood of symptoms of illness. Recognizing the need for tools to prioritize interventions based on health risks, there have been various efforts to identify systematically communities living in situations in which a combination of factors perpetuate the transmission of disease. These approaches are different but have a similar goal – to assess conditions in the urban environment in order to assess health risk to communities.
Some approaches are based on the Quantitative Microbial Risk Assessment (QMRA),(8) which combines in-situ enumeration of indicator pathogens with dose–response relationships in order to estimate risks to human populations at critical points for disease transmission within a network, which are commonly referred to as “hotspots”. But widespread application of this approach is limited by the need for accurate and representative data on local disease prevalence, pathogen exposure and appropriate dose–response relationships.
Results from QMRA can also be a basis on which to standardize exposure–dose–response relationships for other, less intensive, methodologies. For example, QMRA provides the evidence base for the World Health Organization (WHO) Water Safety Planning methodology,(9) which is widely used to identify health risks related to malfunctioning water supply systems. More recently, the WHO has developed a methodology for assessing health risks related to use of residual liquid waste streams from sanitation systems, which is referred to as sanitation safety planning.(10) These methodologies focus primarily on the disease transmission routes within the domains in the two bottom quadrants illustrated in Figure 1.
One approach to assessing health risks associated with household sanitation and community facilities and associated hygiene behaviours is the SaniPath methodology. This methodology quantifies the risk of exposure to faecal contamination in the public and private domains using a combination of data obtained by QMRA, rapid assessment tools to assess the level of contamination, and participatory stakeholder consultation to assess the frequency of exposure.(11)
A more qualitative approach developed and applied in Indonesia for mapping sanitary conditions to support city sanitation planning uses a rapid Environmental Health Risk Assessment (EHRA). In this assessment, priority areas are identified according to: i) context (poverty levels, population density, size of population, and urban/rural characteristics), and ii) exposure, which takes into account behavioural issues (e.g. hand washing), water supply, wastewater and solid waste services, and drainage. This approach is fairly simplistic but nevertheless is relatively easily understood by all stakeholders. A mapped Sanitation Risk Index (SRI) is the final result of a EHRA study, and for each city the results are documented in a “white book” (buku putih) with the aim of ensuring that funds for upgrading are allocated to priority areas.(12)
II. Conceptual Framework for Risk Assessment
The approach described in this paper draws from various elements of the methodologies described above and therefore some comparisons can be made. It provides a more theoretically robust framework than the EHRA approach adopted in Indonesia, but is less sophisticated than the SaniPath approach as it does not require the use of microbial analysis. In place of the microbial indices used in detailed QMRA-based studies, a set of proxy indicators is used as the basis for the quantification of risk. In the methodology, factors that define the physical, environmental and social conditions along with individual susceptibility to disease are all treated as important predictors of illness in a community.
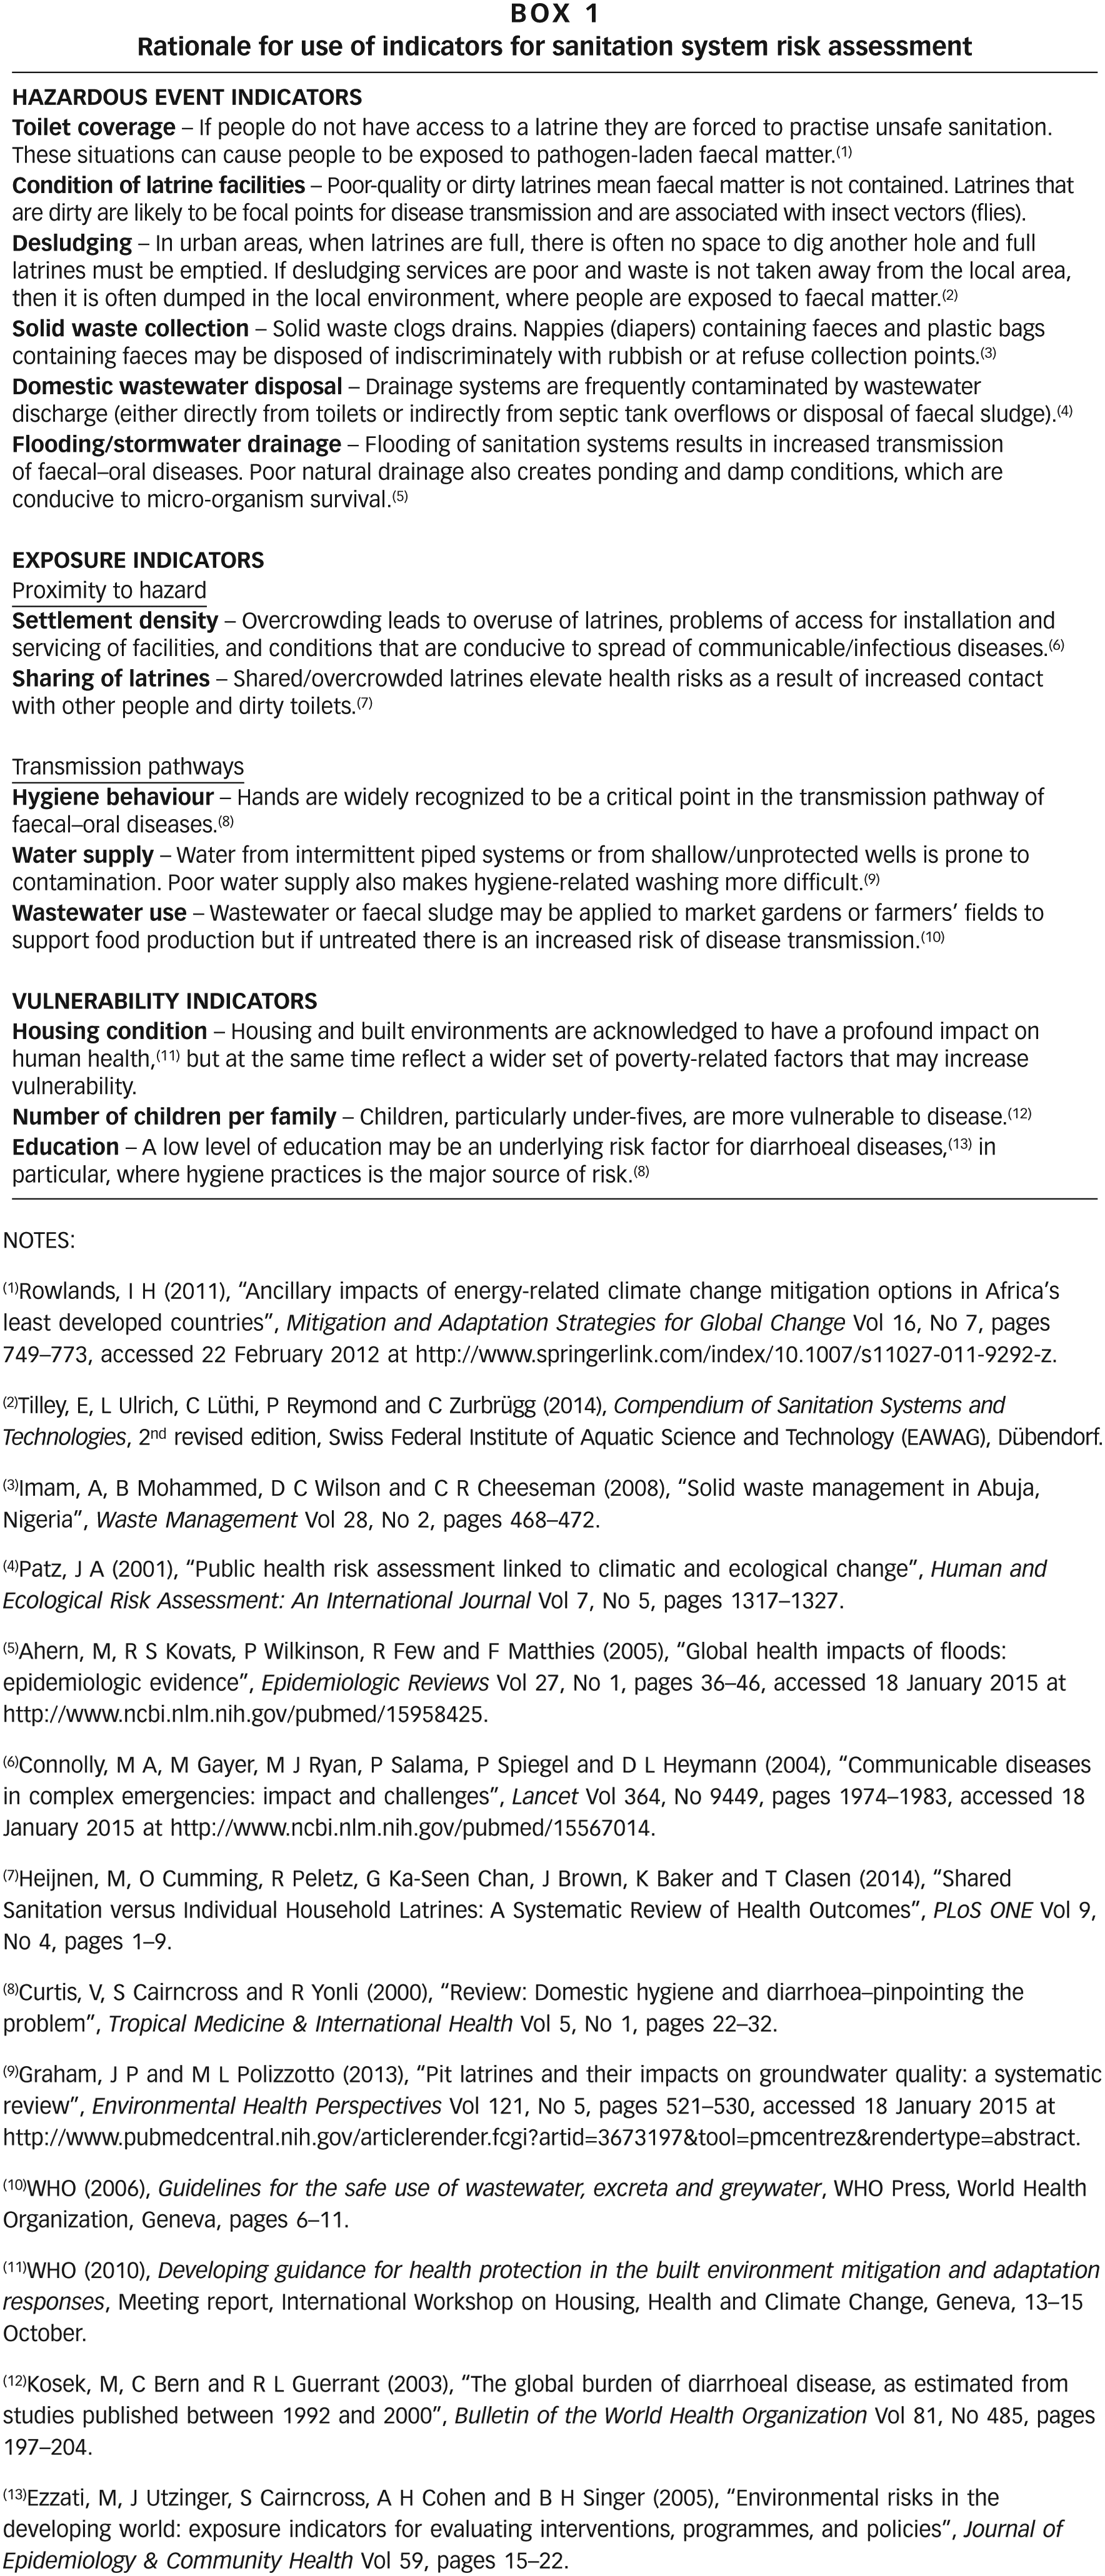
Figure 2, which is based on the F-diagram (referred to above), highlights the main components of risk that determine the transmission of disease and the resulting morbidity rate in a community. This was used as the basis for the risk assessment in the methodology reported in this paper. As described below, these components are a) hazardous events; b) exposure; and c) vulnerability as defined by Crichton.(13) Box 1 describes the indicators of each component used in the RPSSRA methodology and the rationale for selecting them. The concept of exacerbating factors (sometimes referred to as aggravating factors) in environmental health has been used in various applications, e.g. Correia et al.(14) and the European Union’s EuropeAid – International Cooperation and Development,(15) but to date this important concept has not been widely adopted by the water and sanitation sector.
a. Hazardous events
Toilet facilities and infrastructure in the sanitation service delivery chain are designed for containment, transportation and treatment of human waste. If a system is complete and in good working order, then there is very little risk because faeces containing pathogens are kept isolated from residents. On the other hand, if the system is incomplete or not functioning, then there is an increased probability of a hazardous event, caused by the emission into the environment of pathogens. The frequency and extent of hazardous events are primarily determined by the coverage and quality of the sanitation system – the lower the coverage and the quality, the higher the frequency and extent of these hazardous events. However, there are other factors that are recognized to increase the probability or the severity of hazardous events in terms of their intensity or duration. For example, the performance of drainage and solid waste systems is widely recognized to have direct implications for the performance of excreta management systems, and therefore in many municipalities drainage and solid waste systems are considered to be part of sanitation.
b. Exposure
Exposure is determined by the type and intensity of contact between the hazard (in this case, faeces) and individuals in the local community. The intensity of exposure depends on the pathogen concentration within the waste (faeces, faecal sludge or wastewater), the type of contact and the duration of exposure. Depending on the type of activity and related behaviours, different groups of people will be more prone to different types of exposure than others. For instance, communities living in densely populated areas will be at a higher risk than those in sparsely populated areas.(16) Oversharing of latrines is another important factor that exacerbates the potential for transmission of pathogens.(17)
c. Vulnerability
Vulnerability relates to an individual’s susceptibility to contracting disease, the effect that the disease has upon the individual’s health, and the consequent impact that has upon their livelihood. The selected vulnerability indicators are factors exacerbating social risk and are closely related to a complex range of socioeconomic factors that define poverty. Poverty is widely recognized to have widespread implications for human health where water and sanitation provisions are poor. However, in relation to vulnerability, poverty also exacerbates the symptoms of diseases and undermines an individual’s resilience.(18)
An accurate assessment of poverty based upon a participatory process is particularly challenging and prone to bias as it is based on perception. Therefore the three indicators that were chosen as factors exacerbating social risk were:
Age: because of their immature immune systems, children are more likely to be susceptible to diarrhoeal diseases and therefore suffer higher mortality;(19)
Education: the average highest level of education of the families in the community; and
Housing conditions, which are recognized to have a direct bearing on disease transmission but also reflect a wider set of poverty factors that exacerbate vulnerability.
III. Rapid Participatory Assessment of Sanitation System Risks
The research involved the translation of the theoretical framework for risk assessment into a practical methodology that could be applied without the need for extensive resources, staff or equipment. The resulting RPSSRA methodology draws on the knowledge of the local community and their perception of their environment to derive risk scores based on a set of predefined indicators (Box 1).
The initial stage in the risk assessment involved the identification of those areas that are poorly served by municipal sanitation services. The areas for the community-level assessment were identified from the city sanitation strategy prepared for Maputo Municipal Council by Water & Sanitation for the Urban Poor (WSUP).(20) The methodology was developed and applied in various neighbourhoods and subsequently modified before the final methodology was applied in two neighbourhoods in the district of Nlhamankulu: Chamanculo C (38,696 habitants) and Chamanculo D (20,236 inhabitants). These are both typical high-density, low-income settlements with traditional pit latrines, poor stormwater drainage systems and narrow access roads. For the risk assessment, each neighbourhood was divided into four smaller areas and the risk in each area was assessed separately and subsequently aggregated. The boundaries of these areas were defined with representatives from the local administration, taking into account physical features of the area that constitute a boundary and potentially indicate a change in settlement type (e.g. a large road).
a. Assessing the level of risk in each area
Half-day workshops were conducted in each neighbourhood with a total of between 20 and 25 participants from different sub-areas within the neighbourhood. The workshop participants were selected through discussions with the neighbourhood administration and the local partner NGO, CLASS-A, and were held in the neighbourhood administration building. There was a mix of male and female participants of different ages.
For the risk scoring, participants formed groups according to the area in which they live in order to assess the average conditions in their local area as a whole. For those indicators specific to the household domain as opposed to communal conditions, participants were asked to consider scoring that reflected the condition across the community as a whole, as opposed to only considering their own dwelling. Once each group had assessed all indicators, all groups presented and discussed the individual area assessments to confirm that the scores allocated by the different groups were considered reasonable to their peers. During this discussion process, groups could change their score if they agreed with the other views that their assessment was under or overestimated.
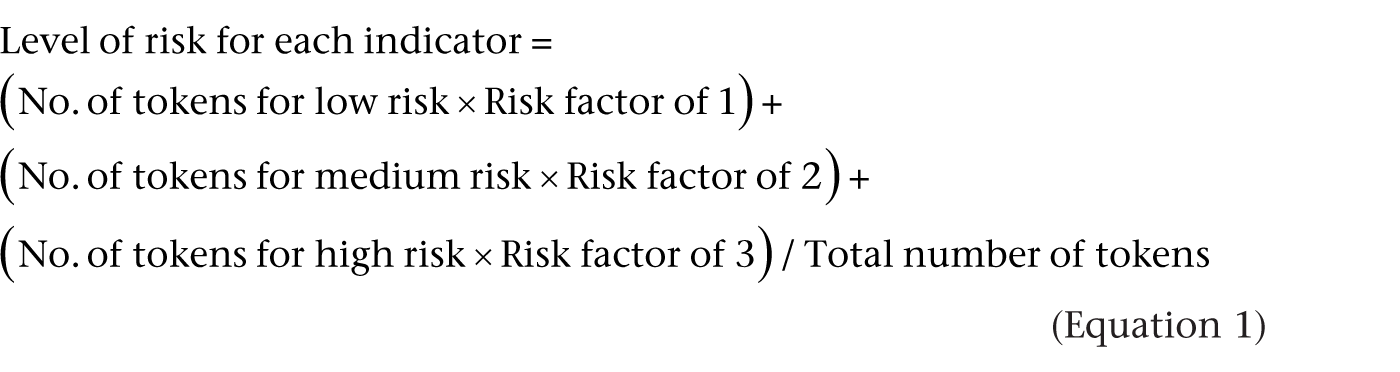
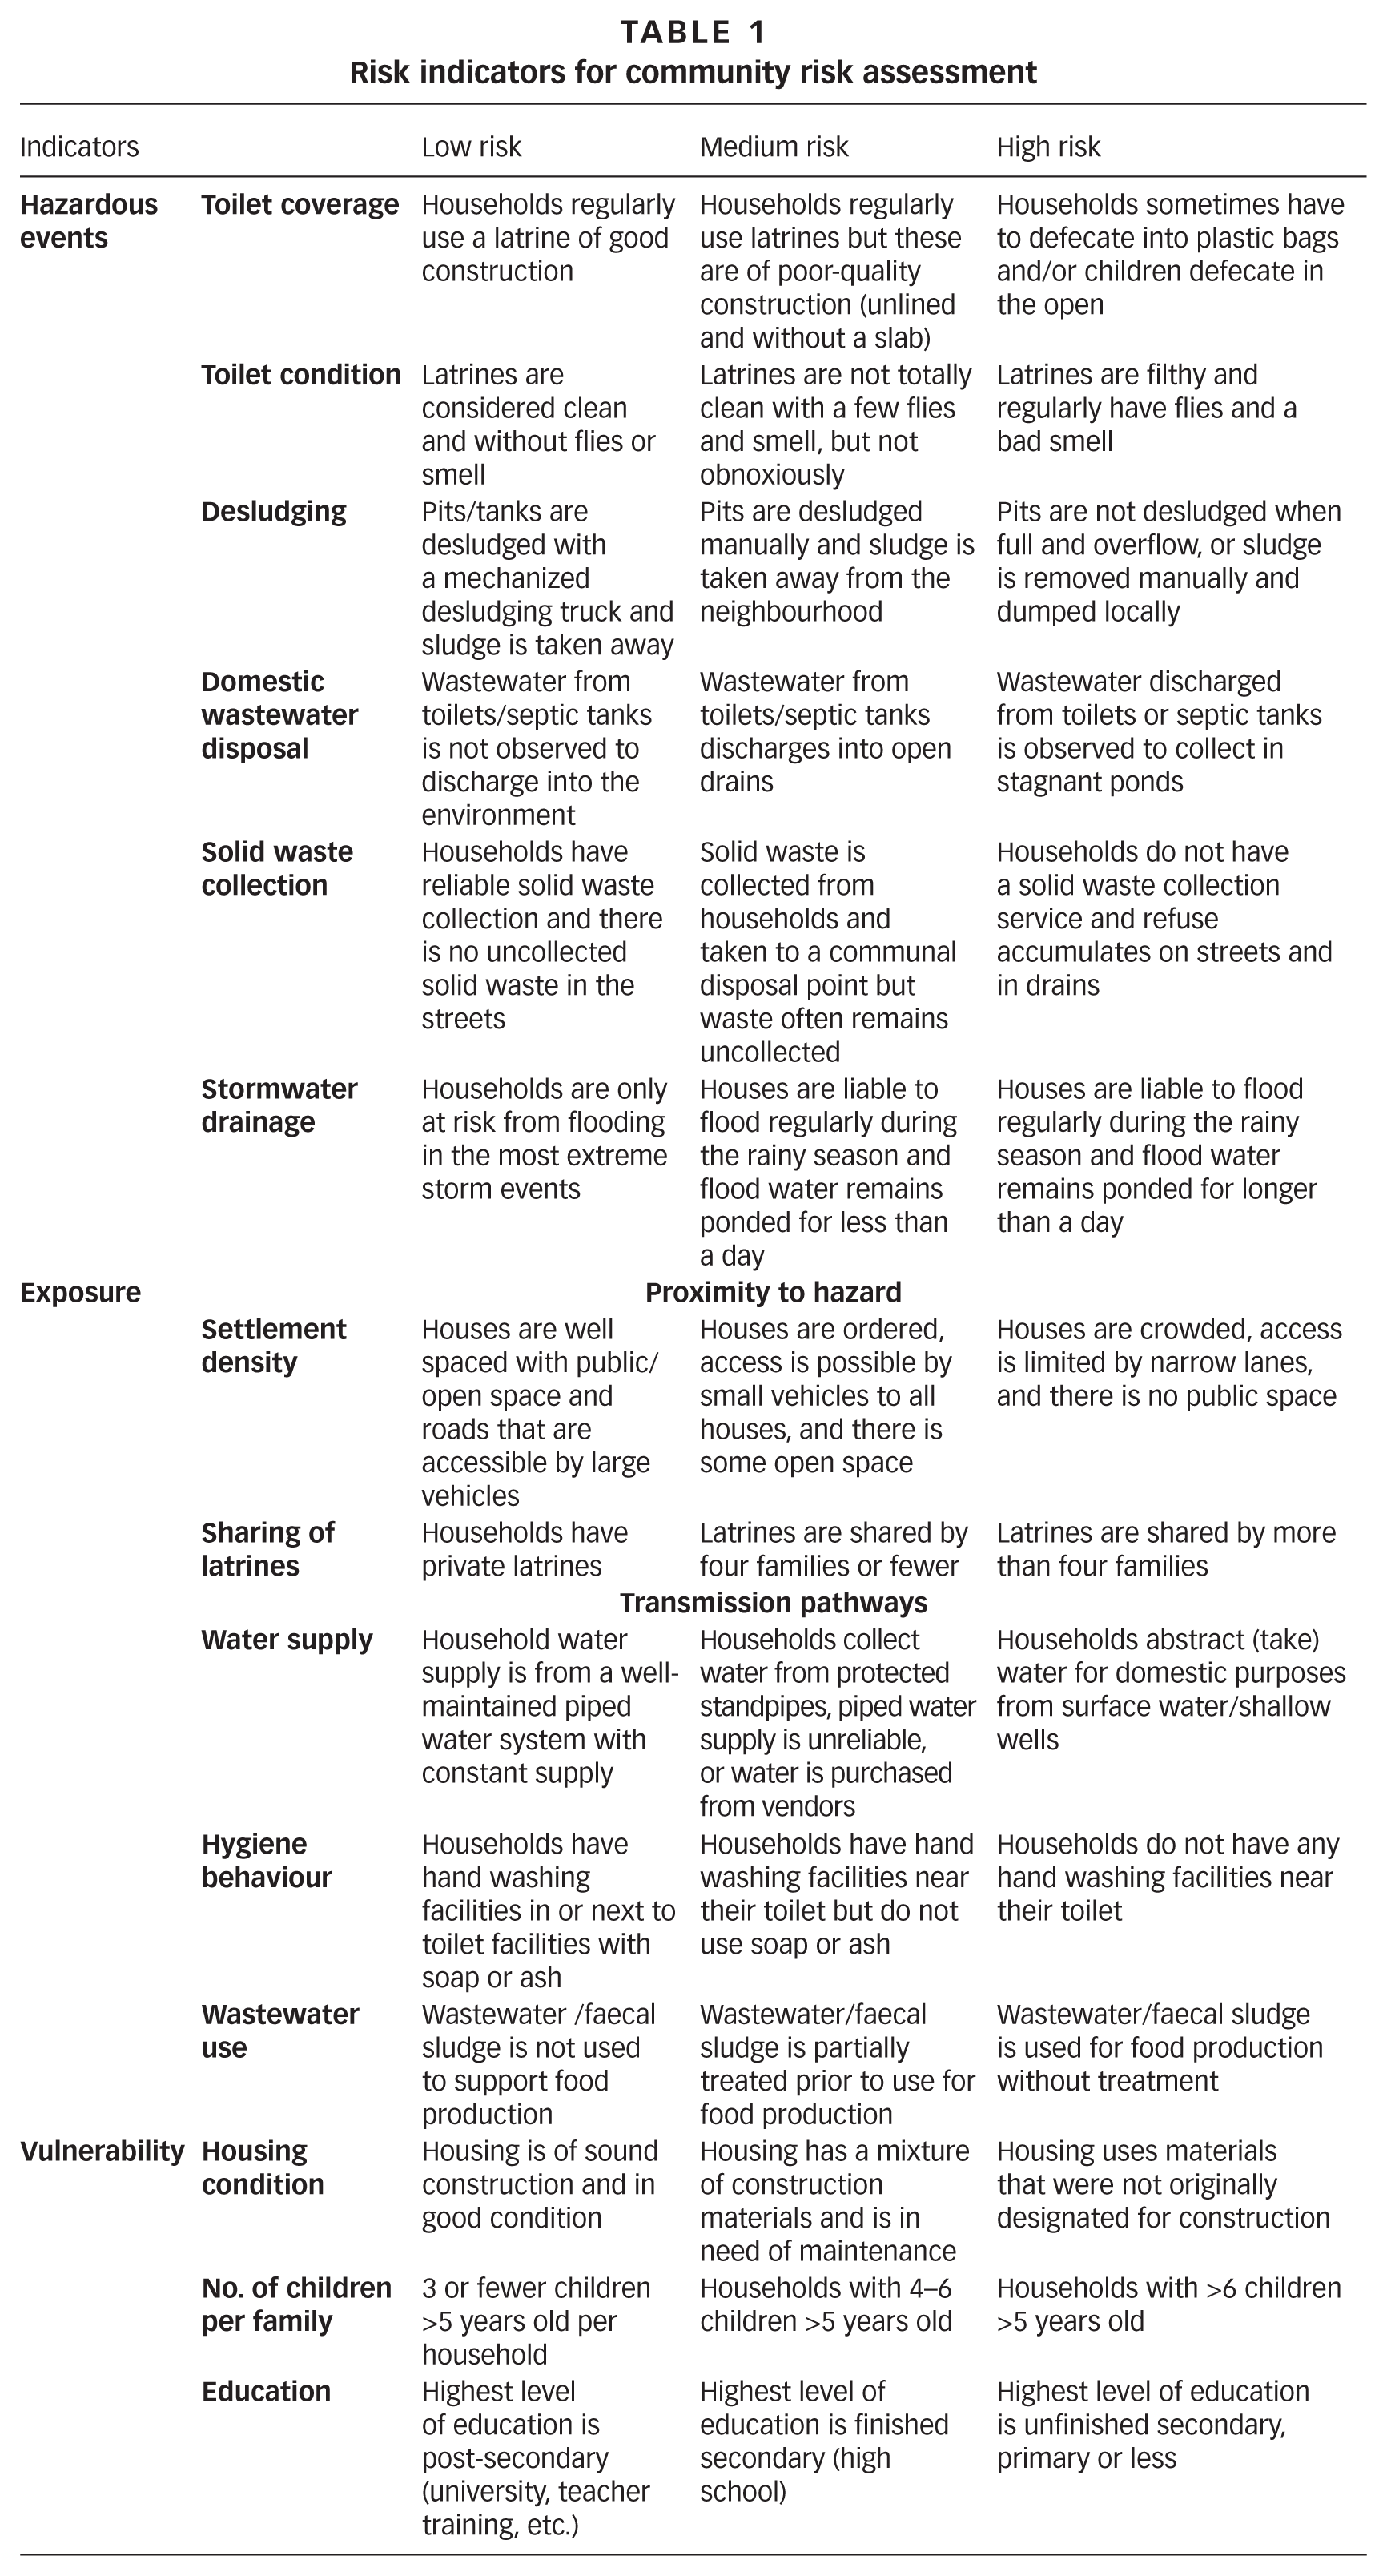
Each indicator was scored based on a simple traffic light system: Green indicated a low level of risk, Amber indicated a medium level of risk, and Red indicated a high level of risk. Table 1 describes the same set of indicators used to derive the risk scores 1, 2 and 3, indicating low-, medium- and high-risk conditions respectively. For example, in assessing desludging services, households that manually empty pits and dump wastes in the area, or have pits that are never emptied, are considered to be high risk. Ten tokens were used by the participants to indicate the proportional breakdown among low, medium and high risks in each area. Equation 1 was then used to score the risk for each indicator.
Risk indicators for community risk assessment
For example, if the group allocated five tokens for low risk, two for medium risk and two for high risk, then the score was calculated at (5 × 1) + (2 × 2) + (2 × 3) = 15/10 = 1.5. The highest score for each indicator is therefore ((0 × 1) + (0 × 2) + (10 × 3)) = 3 whereas the lowest possible score = ((10 × 1) + (0 × 2) + (0 × 3)) / 10 = 1. Based on OECD(21) and Carvalho et al.,(22) the aggregate risk for each area is then calculated for each area according to Equation 2 (which is based upon Equations 3, 4 and 5). For the sake of simplicity, an equal weighting of 1 was applied to all components and indicators, but as described below this is recognized to be an area for future methodological development.


where
Tf = Toilet coverage
Cl = Condition of latrine facilities
De = Desludging
Ww = Domestic wastewater disposal
Sw = Solid waste collection
Fl = Flooding/stormwater drainage

where
Sd = Settlement density
Sl = Sharing of latrines
Hb = Hygiene behaviour
Ws = Water supply
Re = Wastewater reuse

where
Hc = Housing condition
Cc = Number of under-5 children per family
Ed = Level of education
Once each area group has assessed all indicators, all participants in the workshop commented on and discussed the individual area assessments to confirm that the scores allocated by the different groups were considered reasonable to their peers. Finally, the results were transformed to a scale of 0–100 per cent with 0 per cent representing a completely safe condition and 100 per cent representing a high-risk condition. In this way low risk was ≤33 per cent (score 1), medium risk was >33 and ≤67 per cent (score 2) and high was >67 and ≤100 per cent (score 3).
b. Validation of the RPSSRA methodology
To verify the reliability of the answers obtained at the workshop, a validation exercise was carried out in four areas of Chamanculo C, which involved the use of a sanitary survey form.(23) It consisted of a detailed questionnaire that expanded upon the indicators used for the RPSSRA in the community workshop. Each household survey took approximately 20 minutes to complete. A total of 160 surveys were undertaken using a random sampling method that started at a selected point in the area. The risk obtained for each indicator by the survey was calculated in the same way as for the RPSSRA and compared with the workshop results.
c. Mapping of risks
Decision makers require tools to distinguish areas of the city to prioritize for intervention. Spatial planning tools to map risks can be effective communication tools, making it possible to visualize the existing situation and target attention towards those parts of the city where deficiencies in the sanitation chain are most concentrated. These diagrams and maps can be used to promote discussions amongst stakeholders about the priority areas and potential solutions to recognized problems. The results from the risk assessment can be used as the basis for discussion about the roles and responsibilities within the community and different institutions for managing risk in different parts of the sanitation service delivery chain.
After calculating the risk scores for the area as a whole using the population figures from the census, these were mapped using a modified version of WaterAid’s Sanitation Mapper(24) tool, which allows the selected indicators to be mapped either individually or as aggregate scores. The maps can be viewed and shared through Google Earth to highlight priority areas and used to support the planning of interventions to improve sanitation.
IV. Presentation and Analysis of Results to Support Sanitation Safety Planning
a. Findings from Chamanculo C and Chamanculo D risk assessment
Table 2 shows the average risks for the areas in Chamanculo C and Chamanculo D. Figure 3, which is the output from the mapping tool, illustrates the intensity and spatial distribution of the sanitation risk based upon these scores according to the size and colour of the dot on the map. In these neighbourhoods, overall risk was assessed as being high (>70 per cent) by both communities. Chamanculo C scored higher average risk (76 per cent) than Chamanculo D (72 per cent) for hazardous events, while average risk for exposure (75 per cent) and vulnerability (74 per cent) was a little lower than in Chamanculo D (79 per cent and 75 per cent respectively). The similarity in the results is expected as the two neighbourhoods are similar in terms of infrastructure coverage, service provision and population density.
Average risks for areas in Chamanculo C and Chamanculo D obtained through the community risk assessment in Maputo, Mozambique
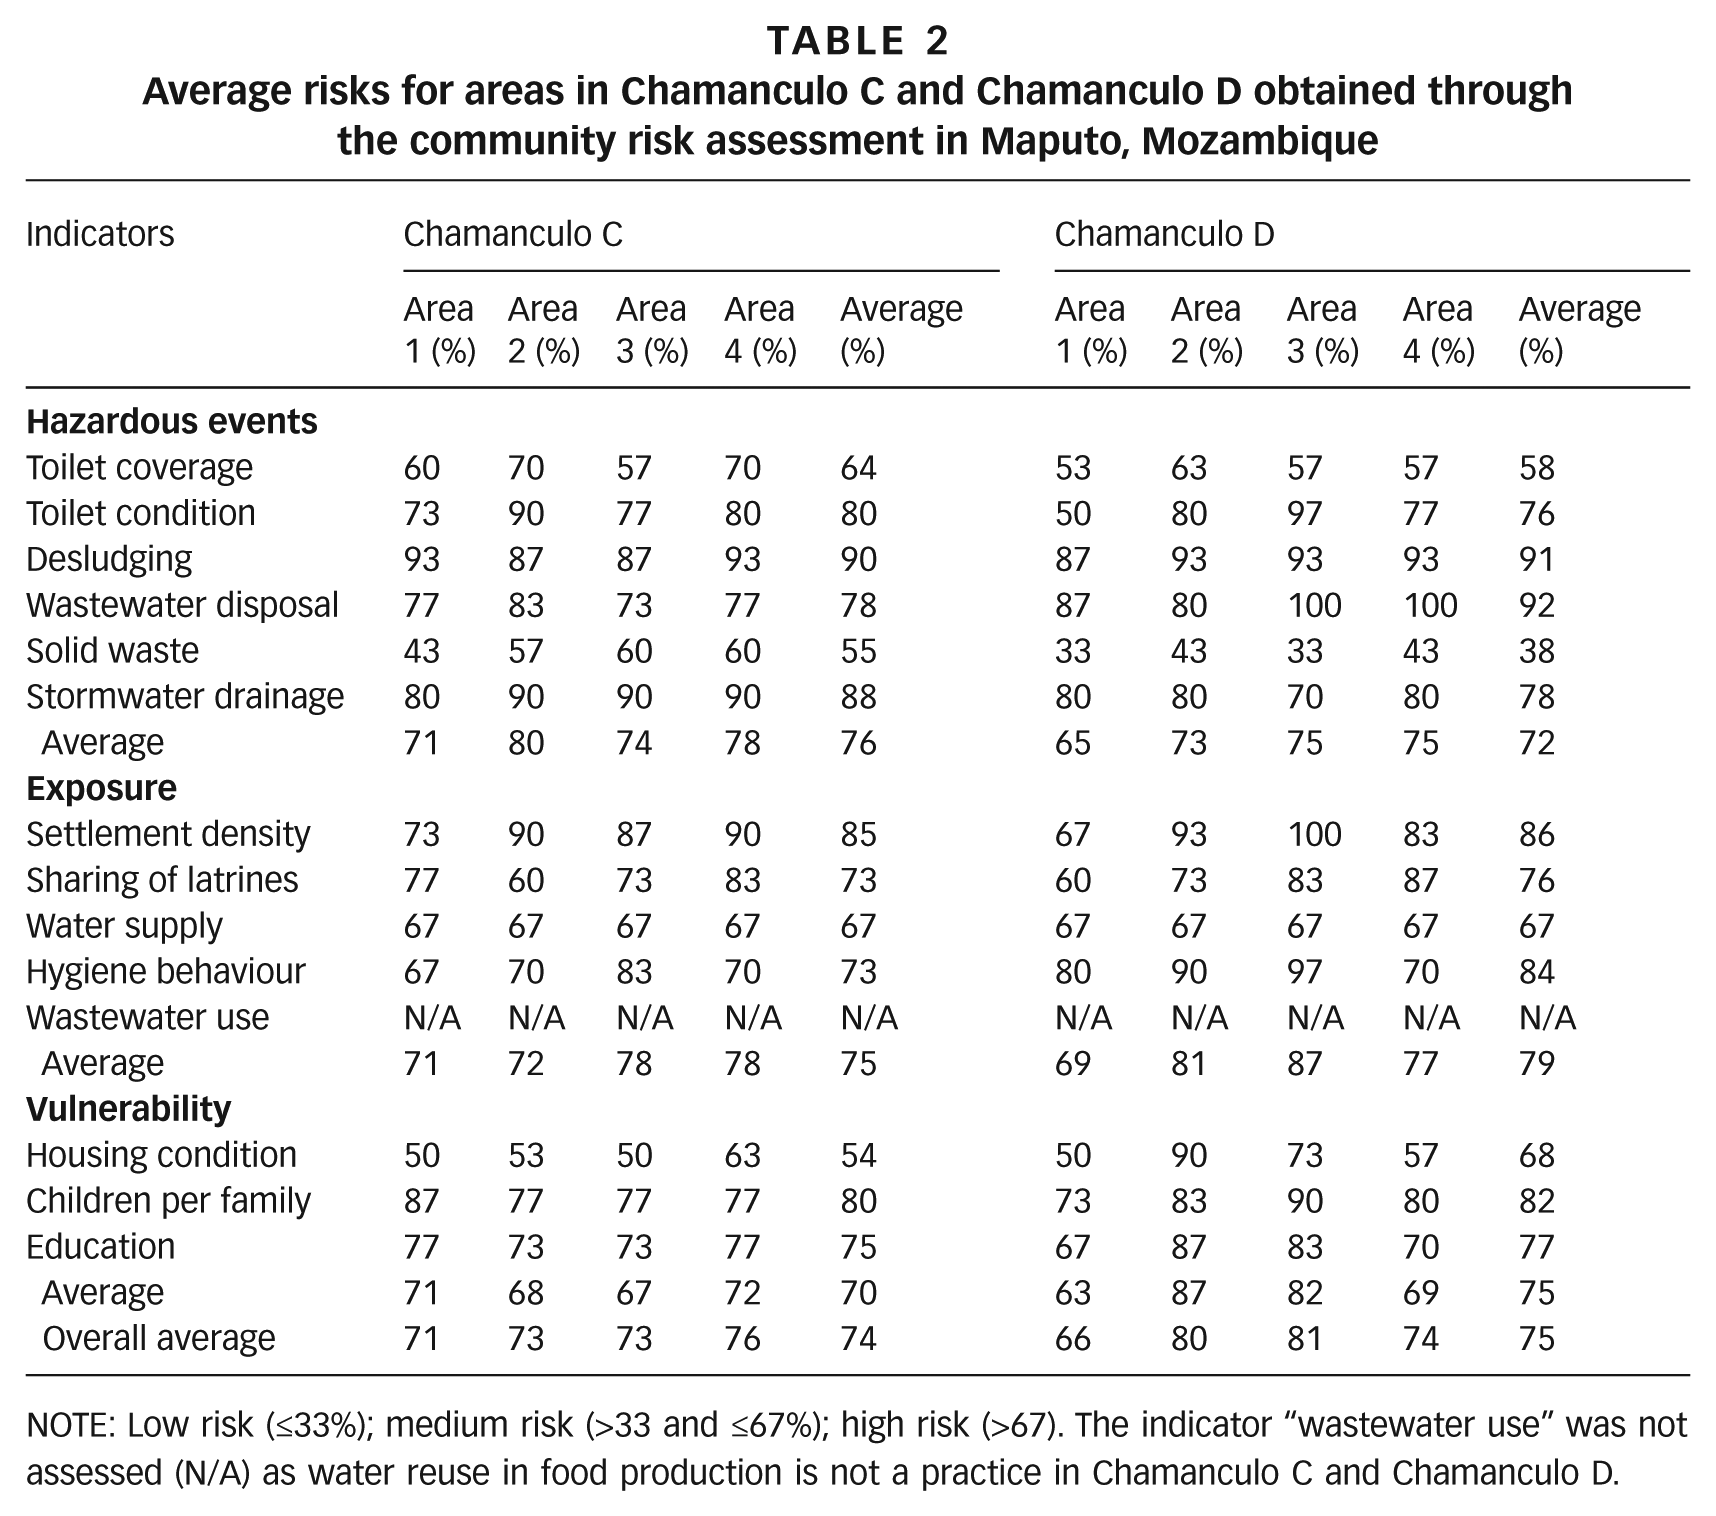
NOTE: Low risk (≤33%); medium risk (>33 and ≤67%); high risk (>67). The indicator “wastewater use” was not assessed (N/A) as water reuse in food production is not a practice in Chamanculo C and Chamanculo D.
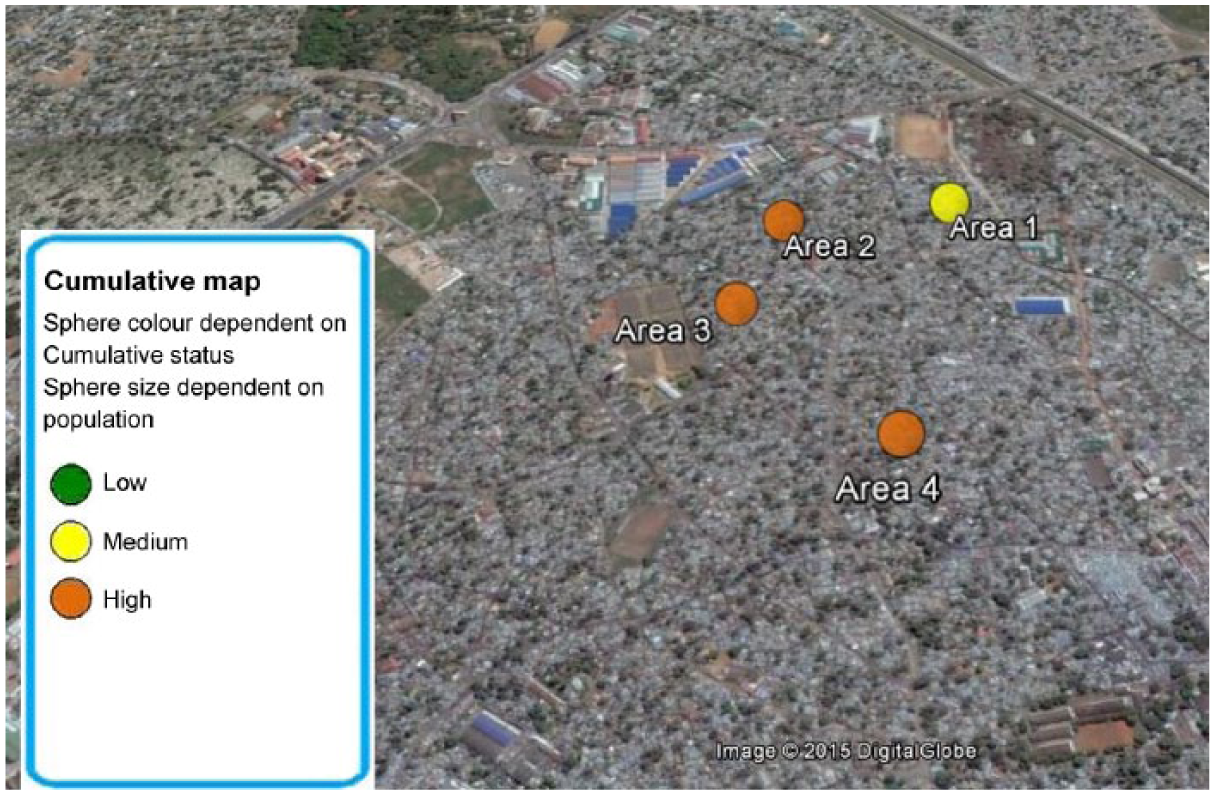
Sanitation Mapper image illustrating the average risks for the areas in Chamanculo D obtained through the community risk assessment in Maputo
In Chamanculo C desludging had the highest average score at 90 per cent, followed by stormwater drainage at 88 per cent, while in Chamanculo D wastewater disposal came first with 92 per cent and desludging second with 91 per cent. The fact that desludging was scored high in both neighbourhoods is not surprising as both neighbourhoods are known for their high population density and desludging is widely recognized to be inadequate in low-income settlements in Maputo. Although the average risk associated with desludging was scored the same across the two neighbourhoods, there was some variation between the areas within these neighbourhoods. Desludging risk in Chamanculo C was scored as 93 per cent for areas 1 and 4, and 87 per cent for areas 2 and 3, while in Chamaculo D, scores were 87 per cent for area 1 and 93 per cent for the rest. None of the groups in the workshops identified any manual desludging in which the sludge is taken out of the neighbourhood. Systems are either desludged with a mechanized desludging truck and sludge taken away or desludged manually and dumped locally.
Water supply received a risk score of 67 per cent for all areas in both neighbourhoods. The lack of variation in the results can be explained by the fact that, on the one hand, none of the households in these areas use surface water or shallow wells (high risk). On the other hand, although households receive water from a piped water supply system, it is not considered to be well maintained or to provide a constant supply (low risk) in accordance with the indicators as defined above in Table 1. Average solid waste risk in Chamanculo C was higher (55 per cent) than in Chamanculo D (38 per cent), indicating medium risk in both neighbourhoods due to the fact that twice a week the waste is collected in both neighbourhoods. Even if this service fails sometimes, as reported by workshop attendees, it is a system that normally works reasonably well.
Wastewater disposal presented very high risk in both neighbourhoods, in particular in areas 3 and 4 of Chamanculo D (100 per cent). It is important to note that the workshops took place during the rainy season and the score could have been influenced by this, although both neighbourhoods’ sanitation infrastructure is very poor. The same is noted for the stormwater drainage indicator, whose risk was higher in Chamanculo C (88 per cent) than in Chamanculo D (78 per cent). These results suggest the need for taking seasonality aspects into consideration, as during the rainy season these two indicators are major contributors to the fragility of the context and the risk level of the sanitation chain in Chamanculo C and Chamanculo D. Wastewater use was not assessed in Chamanculo C and Chamanculo D as water reuse in food production is not a practice there. As discussed below, these results highlight the fact that the choice of appropriate indicators and the way in which these are defined (high, medium, low) in Table 1 is critical to the validity and success of the assessments.
Finally Figure 3, which is the output from the mapping tool, illustrates the intensity and spatial distribution of the sanitation risk based upon the scores obtained in Chamanculo D (Table 2), according to the size and colour of the dot on the map.
b. The reliability of the RPSSRA tool
Table 3 shows the percentage difference between the detailed household survey and the workshop results. The results shows the average score for the four areas in the Chamanculo C neighbourhood. The comparison of results for the indicators “Toilet condition” and “Sharing of latrines” is not seen in Table 3 because after the household survey was undertaken and prior to the community workshops, the RPSSRA indicators were modified from the initial version of the methodology.
Average risks scored by the RPSSRA workshop and household survey for all the areas in Chamanculo C
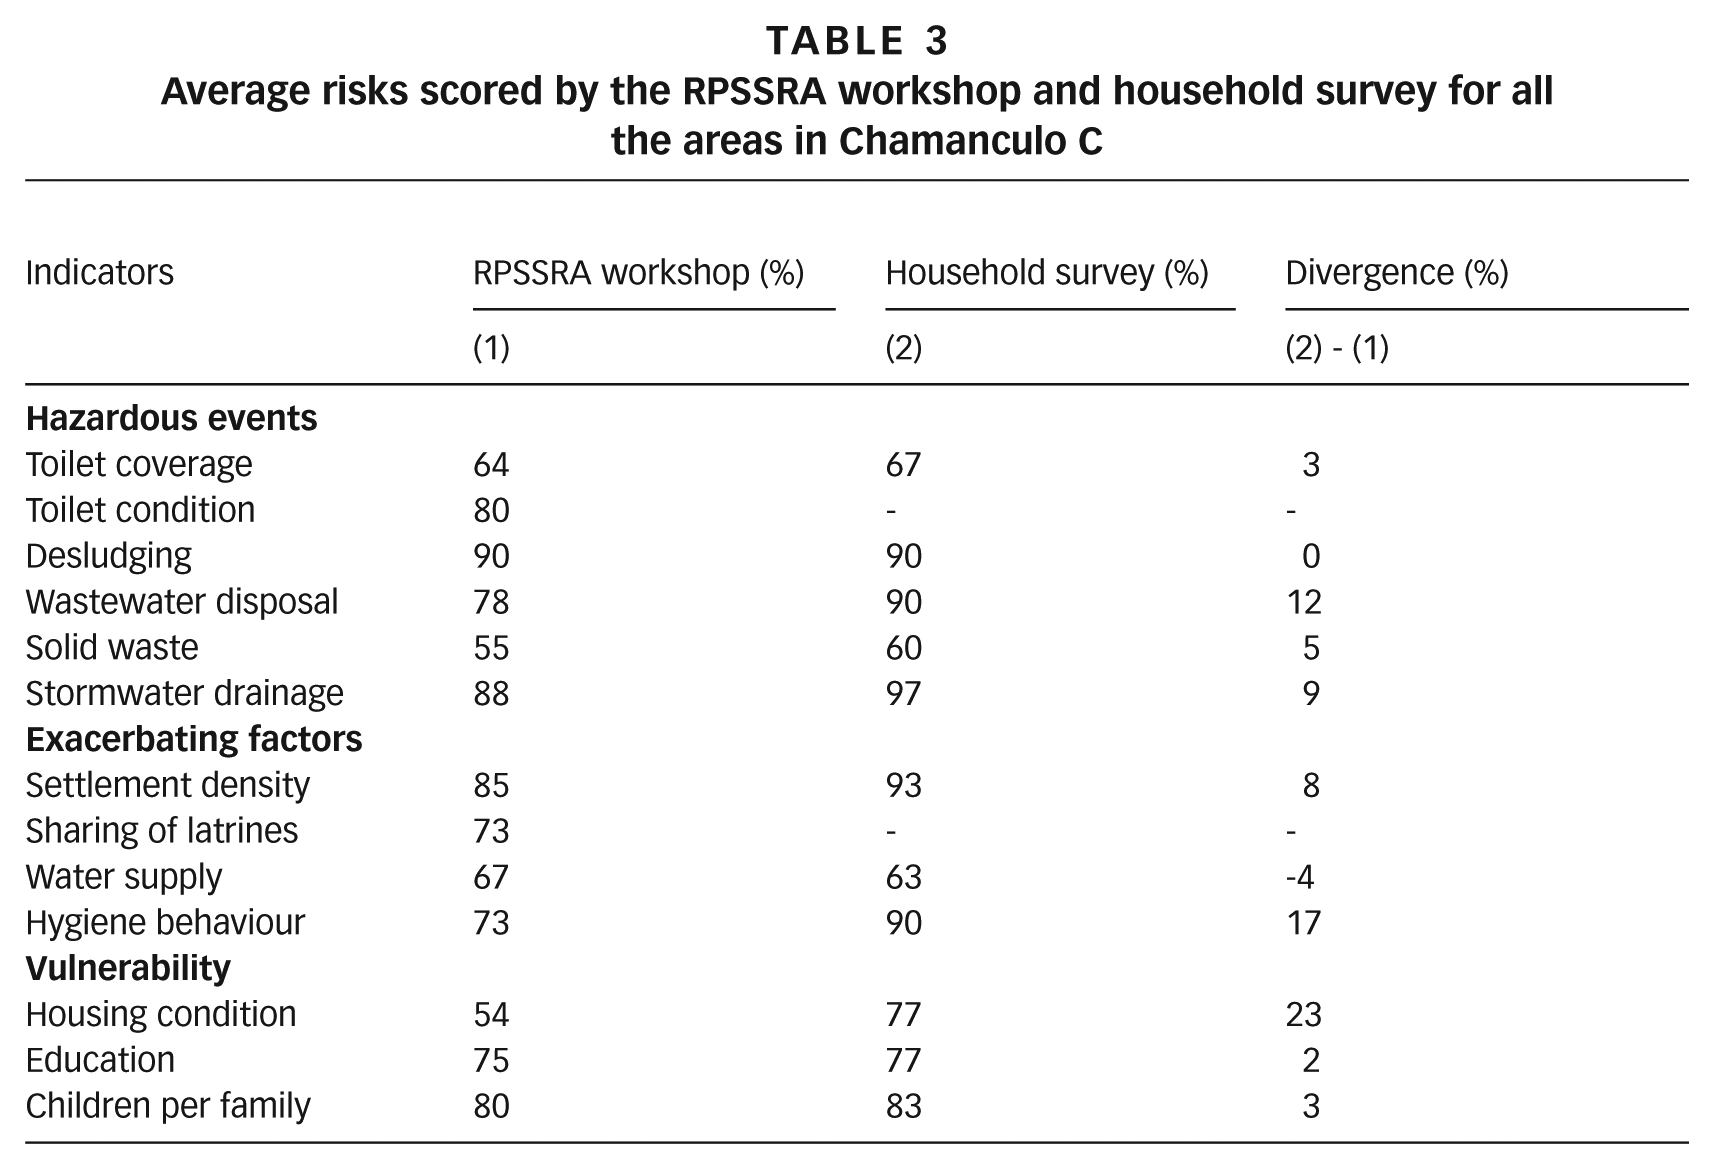
Overall the difference between the risk scores obtained by the household survey and the RPSSRA was very small (average of 8 per cent), although for some indicators the difference was higher than 15 per cent. This indicates that the workshop participants were able to accurately score the level of risk existing in their area for most indicators, while underestimating the risks related to hygiene behaviour (17 per cent) and housing condition (23 per cent). On the other hand, desludging was scored high by both the workshop and household survey (90 per cent). This result confirms the reality of Chamanculo C, where desludging services are practically non-existent and the work is usually undertaken by very poor people without the necessary equipment or knowledge. Many families even do it by themselves because of their poor financial situation.
The relative discrepancy in the housing condition and hygiene behaviour results might indicate that the definitions of these two indicators are too superficial to encompass their more complex aspects (Table 1). This is particularly the case for hygiene behaviour. The RPSSRA workshop scoring for this was based only upon the provision of hand washing facilities next to the toilet, whilst the survey asked additionally if the householder used soap to wash hands after using the toilet. For the assessment of housing condition, the RPSSRA scoring only considered the material the house was made from and did not consider specific characteristics such as the quality and type of the indoor floor, which is known to be a key factor related to the transmission of parasitic infestations and diarrhoeal disease.(25)
In conclusion, the validation exercises prove that the people’s perceptions of risk in their communities gathered during the workshop by the RPSSRA tool are accurate and valid and reflect the reality in Chamanculo C.
V. Discussion and Recommendations for Further Improvement to the Tool
There are a number of recommendations for further refinement and improvement of the tool. The results highlight that the choice of appropriate indicators and the way in which these are defined in the indicator table (high, medium, low) are critical to the validity and success of the assessments. These were improved in a succession of methodology developments and piloting of the indicators prior to the workshops that form the basis of this paper. There may be a need for further modification of these indicators. For example, it was recognized from the outset that the indicators related to vulnerability would prove to be complicated. The team responsible for the development of the tool would have been strengthened by the inclusion of an expert in this area who could provide strong guidance and direction in the definition of these indicators.
Application of the methodology across a wider number of neighbourhoods in a city of varying socioeconomic status would enable the robustness of the methodology and appropriateness of the indicators to be tested across a range of different settings. At the same time, it would also be interesting to compare risk results obtained by the RPSSRA tool with those obtained by a quantitative approach, e.g. SaniPath,(26) for the same study case. The way in which high and low risk was described for water supply turned out to be too limited to give a wider spectrum of risk. However, if the methodology were to be applied across the city as a whole, then the definition of the high and low risk indicators would become more apparent. The modification could, for example, take into consideration water storage and aspects affecting quality, which are known to be critical for disease transmission. It would be interesting to apply the methodology in an area where some households purchase water from vendors and others collect from wells to see the variability of risk.
We also recognized that the indicators for the condition of latrine facilities and desludging do not apply for households that have no latrine facilities. It is therefore proposed that a future development of the methodology should take this into consideration by applying weighting coefficients to the indicators. This would also help to compensate for the fact that, in the current formulation of methodology, the indicators contribute to the overall level of risk in varying amounts, and hence have different weights in practical terms. For example, education and number of children per family influence the final score in the current methodology more than the coverage of toilets, since they are in a category with only three indicators, while toilet coverage is averaged using six indicators. Therefore there remains the question of whether the availability of a toilet is a more critical indicator of risk than other indicators. The authors suggest the use of the analytic hierarchy process (AHP)(27) to determine an appropriate weighting for each indicator in calculating the risk.
VI. Conclusions and Future Perspectives
The methodology described in this paper provides a rapid and resource-efficient way of collecting data about sanitation systems and other contextual factors that influence disease transmission. The validation exercise demonstrated that the RPSSRA tool, using very simple questions, was capable of coming up with a very good approximation of the risk determined by a detailed questionnaire and observations. The methodology identifies areas in which sanitation hazards are most pronounced, highlighting those communities that are most vulnerable to sanitation risks. Once the risk assessment is concluded, the results should be discussed with the community and stakeholders to identify and prioritize the interventions needed to reduce the risk in the area assessed. In doing so, the results can be used to support a wider awareness among different stakeholders that may enable them to make a more objective assessment of which to base the sanitation planning process. The approach is intended for local authorities, environmental health officers, and utility/service providers to better understand the existing risks in the sanitation chain. Thus, the methodology can be an effective way to translate the theory of disease transmission into a practical framework that could be used to assist sanitation planning at community and city levels.
Footnotes
Acknowledgements
The authors would like to thank Moises Mabote (CLASS-A), Orlando Matendjua (independent consultant, Maputo), Amaka Godfrey (WEDC), Joana da Cunha Forte (independent consultant), Will Acker (previously MSc student, UCL) and Professor Charles Niwagaba (Makerere University, Kampala) for their contributions in the development of the methodology.
1.
Rheingans, R, O Cumming, J Anderson and J Showalter (2012), Estimating Inequities in Sanitation-Related Disease Burden and Estimating the Potential Impacts of Pro-Poor Targeting, SHARE: Sanitation and Hygiene Applied Research for Equity, London, accessed 18 January 2015 at ![]() .
.
2.
Eisenberg, J N, J C Scott and T Porco (2007), “Integrating disease control strategies: balancing water sanitation and hygiene interventions to reduce diarrheal disease burden”, American Journal of Public Health Vol 97, pages 846–852.
3.
Cairncross, S, U Blumenthal, P Kolsky, L Moraes and A Tayeh (1996), “The public and domestic domains in the transmission of disease”, Tropical Medicine & International Health Vol 1, No 1, pages 27–34.
4.
Wagner, E G and J N Lanoix (1958), Excreta disposal for rural areas and small communities, Monograph series, World Health Organization, Geneva.
5.
Carr, R (2001), “Excreta-related infections and the role of sanitation in the control of transmission”, in Lorna Fewtrell and Jamie Bartram (editors), Water Quality: Guidelines, Standards and Health, IWA Publishing, London, pages 89–133.
6.
Curtis, V, S Cairncross and R Yonli (2000), “Review: Domestic hygiene and diarrhoea–pinpointing the problem”, Tropical Medicine & International Health Vol 5, No 1, pages 22–32.
7.
Stenström, T A, R Seidu, N Ekane and C Zurbrügg (2011), Microbial Exposure and Health Assessments in Sanitation Technologies and Systems, Stockholm Environment Institute.
8.
Medema, G and N Ashbolt (2006), QMRA: its value for risk management, MICRORISK, available at ![]() .
.
9
10.
11.
Moe, C (2014), “The SaniPath Study: The Consequences of a Broken Sanitation Chain in Four Low-Income Urban Settings in Accra, Ghana”, WASH 2014 Conference, Brisbane, 24–28 March, available at ![]() .
.
12.
Utomo, N T and L Listyasari Maraita (editors) (2010), Marching Together with a Citywide Sanitation Strategy, Technical Team for Sanitation Development (Tim Teknis Pembangunan Sanitasi – TTPS) and Indonesia Sanitation Sector Development Program (ISSDP).
13.
Crichton, D (1999), “The Risk Triangle”, in Jon Ingleton (editor), Natural Disaster Management, Tudor Rose, Leicester, pages 120–103.
14.
Correia, J C, R M R Barbosa, C M F Oliveira and C M R Albuquerque (2012), “Residential characteristics aggravating infestation by Culex quinquefasciatus in a region of Northeastern Brazil”, Revista de Saúde Pública Vol 46, No 6, pages 935–941.
16.
Yang, K, J LeJeune, D Alsdorf, B Lu, C K Shum and S Liang (2012), “Global Distribution of Outbreaks of Water-Associated Infectious Diseases”, PLOS Neglected Tropical Diseases, accessed 22 March 2015 at ![]() .
.
17.
Heijnen, M, O Cumming, R Peletz, G Ka-Seen Chan, J Brown, K Baker and T Clasen (2014), “Shared Sanitation versus Individual Household Latrines: A Systematic Review of Health Outcomes”, PLoS ONE Vol 9, No 4, pages 1–9.
18.
Philip, D and I Rayhan (2004), “Vulnerability and Poverty: What are the causes and how they are related?”, Term paper for interdisciplinary course, International Doctoral Studies Program at ZEF, Bonn, accessed 10 April 2015 at ![]() .
.
19.
See reference 1.
20.
21.
OECD (2008), Handbook on Constructing Composite Indicators: Methodology and User Guide, accessed 21 November 2014 at ![]() .
.
22.
Carvalho, S C P, K J Carden and N P Armitage (2009), “Application of a sustainability index for integrated urban water management in Southern African cities: Case study comparison – Maputo and Hermanus”, Water SA Vol 35, No 2, pages 144–151.
23.
Smith, M D and R J Shaw (1996), “Technical Brief No.50: Sanitary Surveying”, Waterlines Vol 15, No 2, pages 15–18.
25.
Cattaneo, M D, S Galiani, P J Gertler, S Martinez and R Titiunik (2007), “Housing, health and happiness”, Policy Research Working Paper WPS4214, World Bank, Washington, DC.
26.
See reference 11.
27.
Saaty, T L (2000), Fundamentals of Decision Making and Priority Theory with the Analytic Hierarchy Process (Analytic Hierarchy Process Series, Vol 6), RWS Publications, 477 pages.