
Abstract
Urban India is struggling to provide adequate water and sanitation services to its citizens. Open defecation, insufficient wastewater treatment, and mixing of untreated wastewater with stormwater and drinking water supplies are contributing to a severe health and economic crisis. Recent government measures such as the Jawaharlal Nehru National Urban Renewal Mission and National Urban Sanitation Policy (NUSP) are steps in the right direction. We draw on sanitation scores awarded to 421 cities under NUSP to identify factors that explain the heterogeneity in city-level scores. Our estimates suggest the higher scores are partly a result of city location. Population is non-linearly associated with sanitation score. Consistent with recent literature, we show that increased presence of household toilets does not impact city-level sanitation outcomes. Further, smaller cities perform differently than medium and large cities, pointing to a need for customized policy prescriptions for different classes of cities, preferably designed by municipal governments.
I. Introduction
“Whilst I realized the grandeur of the holy Ganga and the holier Himalayas, I saw little to inspire me in what man was doing in this holy place. To my great grief I discovered insanitation both moral and physical. … Thoughtless ignorant men and women use for natural functions the sacred banks of the rivers where they are supposed to sit in quiet contemplation and find God. They violate religion, science and laws of sanitation.”
Achieving the water and sanitation target (Target 7C) of the Millennium Development Goals (MDGs) by 2015 rests significantly on India, as it contributes a significant proportion of the population still without “sustainable access to safe water and sanitation”. Ever since the adoption of the MDGs by the United Nations General Assembly in 2000,(1) the terms “sustainable”, “access” and “safe water [or] sanitation” have been contested. The revision of the target to measure access to improved water and sanitation did not help the matter, but has provided the most tangible way of measuring progress on this extremely challenging goal. In 1990, 70 per cent of Indians had access to improved sources of water, but only 18 per cent had access to improved sources of sanitation. By 2011, these numbers had risen; an impressive 92 per cent had access to water, but only 35 per cent had access to improved sanitation.(2) Urban areas do better than rural areas, but continued population growth and increasing urbanization are offsetting urban India’s advantage over its rural counterpart in the provision of water and sanitation services. There are claims that the revised MDGs over-estimate the availability of safe water and sanitation.(3) The focus on counting pipes, faucets and toilets has placed the emphasis more on construction of hard infrastructure than on the quality of water and sanitation made available.
Only 30 per cent of the urban wastewater generated nationally is treated in a centralized facility.(4) The rest flows untreated into nearby lakes, rivers or wetlands, or is absorbed below ground, affecting the quality of nearby drinking water sources. Though centralized treatment is not the only solution for wastewater, dense settlements as well as lack of control over construction quality and maintenance of decentralized systems such as septic tanks render alternative options functionally non-viable. Intermittent water supply, often of questionable quality, along with a critical lack of primary and secondary treatment of the wastewater effluent, leaves large sections of the urban population exposed to contaminated water. Even though city administrators are cognizant of infrastructure challenges, they choose to focus their attention and resources on water supply and distribution, while neglecting wastewater treatment and drainage. A case in point is Chennai, Tamil Nadu. Even as the city ramped up its water treatment capacity from 285 million litres per day (MLD) in 1995 to 1,509 MLD in 2012, the wastewater capacity only increased from 272 MLD to 536 MLD during the same period.(5) The lack of toilets (both public and household) forces people to defecate in the open, increasing the probability of infectious diseases and other health risks. Over time, the lack of a robust sanitation infrastructure has added up to a severe health and ecological crisis.(6)
Poor access to water and sanitation is partly responsible for as many as 535,000 lives lost annually to preventable diseases such as diarrhoea,(7) and a productivity loss to the Indian economy of 73 million working days.(8) The World Bank estimates that inadequate sanitation results in an economic impact of Indian rupees (Rs.) 2.44 trillion (US $54 billion) annually, equivalent to 6.4 per cent of India’s GDP in 2006.(9) Almost half of this economic cost is due to premature mortality. Access time, healthcare costs, healthcare-related productivity loss and cost of household treatment of drinking water are some of the other factors that make up this cost.
Globally, the rate of return on improved sanitation is 5:1, and in South Asia, it is almost 7:1.(10) The introduction of comprehensive interventions could result in a potential gain of Rs. 1.48 trillion (US$ 32.6 billion), roughly equivalent to 4 per cent of the GDP in 2006.(11) As part of the National Urban Sanitation Policy implemented in 2008,(12) the Ministry of Urban Development (MoUD) conducted a sanitation rating of all cities with populations greater than 100,000.(13) The rating covered water supply, wastewater treatment, stormwater and solid waste management. In this article, we make use of the sanitation scores awarded to cities by MoUD to identify heterogeneity in city-level scores, and isolate factors associated with the scores. The scores are a baseline to measure progress on sanitation in cities, and MoUD anticipates that the rating process will encourage cities to improve upon their scores through changes in their policies, infrastructure and behaviour. Analysis of the city-level scores allows us to assess water and sanitation infrastructure in urban India and the impact of current policy and programmes, and make inferences on future directions.
II. Water, Sanitation and Health
The value of clean water and sanitation in improving public health and extending lifespans is well-documented. For example, the introduction of filtration and disinfection of municipal water supply in the United States brought down mortality rates in the late 19th and early 20th centuries. On average, filtration and chlorination jointly reduced total mortality by 13 per cent, typhoid mortality by 25 per cent, infant mortality by 46 per cent, and child mortality by 50 per cent.(14) During the same time period, African-Americans in urban areas registered absolute and relative improvements in life expectancies over whites, largely due to improved access to water and sewers and a resultant decline in typhoid rates.(15) A meta-analysis of recent water, sanitation and hygiene interventions across low- and middle-income countries found that diarrhoeal morbidity declined due to these interventions.(16) Poor sanitary conditions within households also increase the odds of maternal mortality (odds ratio, OR = 3.05, 95 per cent confidence interval, CI = 1.72–5.49).(17)
a. Impact on children
Unsafe water and poor sanitation have a pronounced impact on the health and well-being of infants and children. Connections to public sewers in the US city of Baltimore, Maryland in 1915 resulted in a 55–75 per cent reduction in infant diarrhoeal deaths.(18) Watson examined data on American Indian reservations during the 1970s and found that a 10 per cent increase in piped water and sewer access to homes caused a 4 per cent reduction in the infant mortality rate.(19) Lack of toilets (OR = 1.46, 95 per cent CI = 1.30–1.64) and the use of unprotected sources for drinking water (OR = 1.23, 95 per cent CI = 1.10–1.38) increased the odds of low birth weight among children in India.(20) A review of data from 14 studies conducted in low- and middle-income countries that included nearly 10,000 children found that those under the age of five living in households with good sanitation practices were significantly taller than their peers.(21) The review study also stated that the prevalence of stunting among children below 5 years could be reduced by up to 15 per cent by providing clean drinking water and effective handwashing with soap. Recent evidence suggests that open defecation explains much of the stunting observed in Indian children compared to global averages, a phenomenon often referred to as the “Asian enigma”.(22)
Clean water and sanitation effects are not limited to physical health. School attendance rates and scholastic abilities improve as well. Studies across several Asian and African countries have reported increases in enrolment rates for both boys and girls following improvements in water and sanitation facilities. Pearson and McPhedran provide a compilation of recent studies on this topic.(23) The effect on increased enrolment (and reduced absenteeism, in some cases) is more pronounced among girls. For example, water treatment and hygiene interventions led to a drop in absenteeism among girls, but had no impact on boys in a randomized trial in Kenyan schools.(24) Among those enrolled, the availability of drinking water and a toilet at home is associated with an 8–9 per cent increase in writing ability at school.(25) Even in high-income countries, schools with well-maintained buildings and facilities such as toilets have higher student attendance and higher scores on standardized English and Mathematics tests.(26)
III. Sanitation as a Social Issue
Clean water and sanitation not only contribute to healthy growth and development, but also are social and economic gateways to the rest of the society. For Mahatma Gandhi, the Indian independence and social reform movements were so intertwined that he remarked in 1925, “Sanitation is more important than independence.”(27) Access to water and sanitation is strongly tied to the commonly accepted metric of human development – the Human Development Index (HDI) – measured by the United Nations Development Programme. A cross-country analysis of HDI scores shows that it is highly correlated with access to improved sources of water (R2 = 0.65) and sanitation (R2 = 0.75).(28) Access to water and sanitation in India is influenced by income, caste and gender. The very little sanitation infrastructure provided by the state is monopolized by the middle class, and the poor are denied their fair share of the services.(29) The poorest 40 per cent in India have hardly benefitted from improvements in sanitation over the past two decades. The poorest quintile is 47 times more likely than the richest one practise open defecation, a disparity three times more severe than that observed in Africa.(30) Lower castes have been traditionally entrusted with occupations such as collecting human waste, and numerous legal interventions have failed to eliminate the practice of manual scavenging.(31) Among households that do not have water on premises, adult females fetch water in 81 per cent. Even among children below 15 years of age, girls are four times more likely than boys to be responsible for collecting water.(32)
IV. Policy Measures
Infrastructure development in rural areas, although not exclusively sanitation, has been a traditional focus of the Indian government. Nirmal Bharat Abhiyan and its precursor, the Total Sanitation Campaign launched in 1999, are the most notable initiatives that address the rural sanitation crisis.(33) However, the last decade has seen an increasing focus on improving urban services, including water and sanitation. Many of these programmes have been initiated and/or funded by the Ministry of Urban Development. In 2005, MoUD launched the Jawaharlal Nehru National Urban Renewal Mission (JNNURM) to improve infrastructure and civic services in urban India.(34) Depending on project type, city size and region, the central government provided between 35 per cent and 90 per cent of the project funding, with the rest coming from state and municipal governments. Initially, 63 cities were part of the programme; subsequently, two other cities were added to the programme. Other census towns not covered in the primary programme were included in the Urban Infrastructure Development Scheme for Small and Medium Towns (UIDSSMT), which is a component of JNNURM.
In 2008, MoUD launched the National Urban Sanitation Policy, which called for the creation of state-level sanitation policies, provided funding to prepare city sanitation plans, and created a rating scale to rank cities on sanitation to improve public health and environmental standards.(35) In addition, MoUD created service-level benchmarks for water supply, wastewater, stormwater and solid waste management to evaluate the performance of urban utilities.(36) The last decade has also seen an increased involvement of the private sector in financing several water and wastewater projects through public–private partnerships (PPPs). More than 150 PPP contracts were initiated in the water and wastewater sector alone (PPPs have been most popular in the road sector, where more than 1,000 contracts are in operation currently).(37) In 2011, the Ministry of Finance issued a draft PPP policy to be used at the national and state levels to streamline the process of inviting and managing these contracts.
The National Urban Sanitation Policy describes its vision for urban sanitation in India: “All Indian cities and towns become totally sanitized, healthy and livable and ensure and sustain good public health and environmental outcomes for all their citizens with a special focus on hygienic and affordable sanitation facilities for the urban poor and women.” The policy’s goal is transforming urban India into “community-driven, totally sanitized, healthy and livable cities and towns”. Further, the policy lists three specific goals – awareness generation and behaviour change, open defecation-free cities, and integrated city-wide sanitation. Apart from outcome-oriented objectives, the policy places emphasis on strengthening state, city and local institutions to provide, or facilitate provision of, sustainable sanitation services, including planning, implementation and management.
V. Sanitation Score
Progress in water and sanitation access at the household level has been measured through the water and sanitation ladders developed by the Joint Monitoring Programme of the United Nations Children’s Fund (UNICEF) and the World Health Organization (WHO). The ladders go from surface water to piped water on premises in the case of drinking water, and from open defecation to improved sanitation facilities in the case of sanitation, with a few intermediary rungs between the two ends.(38) The ladders are so called since each category represents an improvement over the lower category. The ladders only measure water and sanitation access at the household level, and are imperfect measures to scale up to a neighbourhood or city. Gunawardana and Galagedara incorporate environmental and public health risks associated with the various sanitation techniques to present a Sanitation Index for Monitoring (SIM) based on data gathered from three communities in Sri Lanka.(39) Mehta and Mehta describe the limitations of the sanitation ladder and state the need to assess sanitation through its full value chain.(40)
As part of the National Urban Sanitation Policy, MoUD conducted a sanitation rating of all cities(41) with a population greater than 100,000, covering 72 per cent of the country’s total urban population.(42) This rating, which scored cities on a scale that ranged from 0 to 100 points, goes beyond a household-level assessment, and covers the full value chain through metrics that focus on the process, outcomes and outputs. The rating process was carried out by a consortium of three agencies that were selected through an open bidding process. The data were collected during the period December 2009–March 2010. The rating was meant to create a baseline to measure progress on sanitation in cities. MoUD anticipates that the rating process will encourage cities to perform better through a variety of means, one of which is the national award on sanitation, Nirmal Shahar Puraskar (Clean City Award in Hindi). Since the rating is an absolute score and not just a rank, cities can work collaboratively to share and exchange ideas on sanitation. Details about the methodology and selection criteria of the cities are available in the MoUD FAQ document.(43)
Because the sanitation scores scale up to the city level, they lose the granularity seen in household-level sanitation measurements. The reliance on a sample of field observations also introduces subjectivity to the overall scores. For instance, survey agencies were asked to count the instances of open defecation observed as a proportion of total field visits to arrive at a score for open defecation.(44) Any metric that assigns a single numeric score to an entire city is likely to miss a few details here and there. Yet, we believe that the use of a city-level sanitation score to assess the state of current infrastructure and to monitor progress is novel and worthy of analysis. We exploit city-level sanitation scores to explain the drivers of sanitation score. A better understanding of the factors associated with high scoring cities might shed light on successful strategies for the rest of the cities.
VI. Methods
This section describes the variables and model used to analyze the nationwide sanitation scores given to individual cities.
a. Data
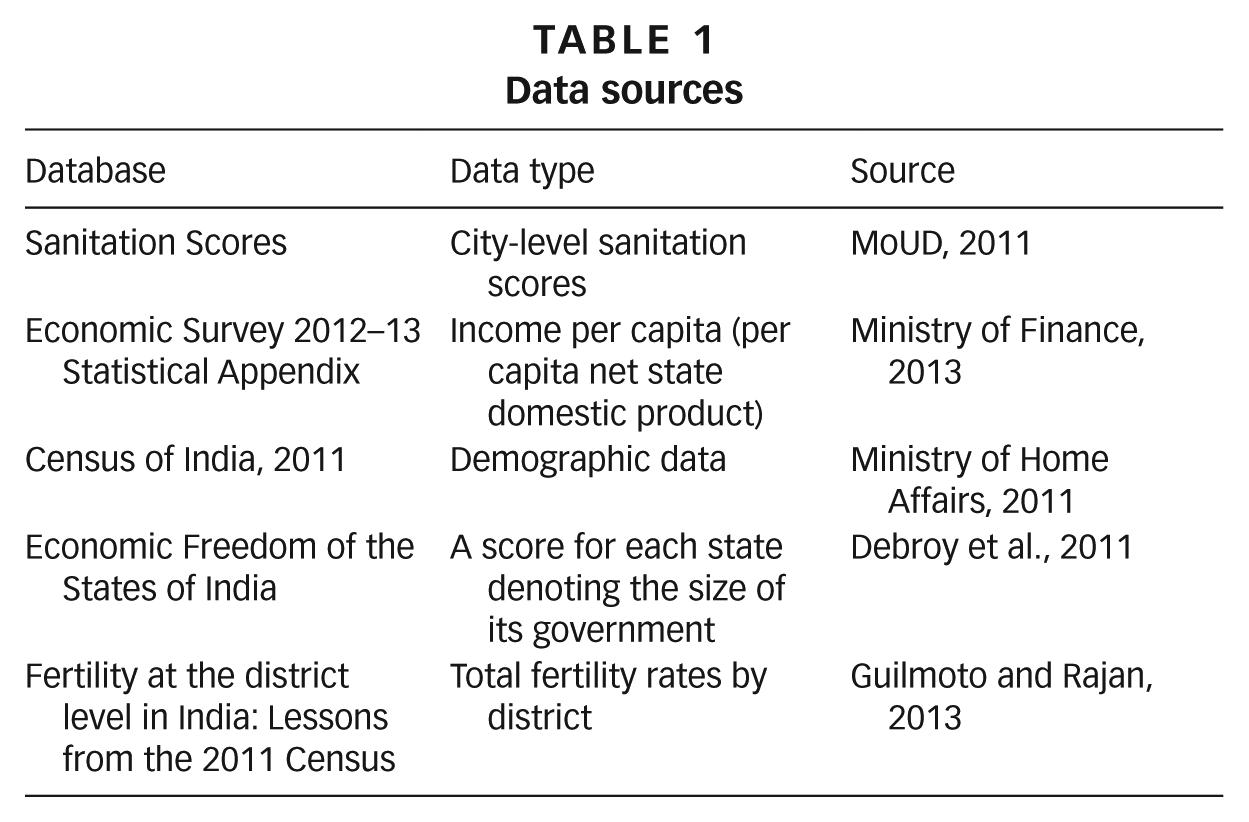
Sanitation scores were obtained from MoUD. Demographic data were obtained from the Census of India.(45) Data on economic, governance and social indicators were obtained from the census and other sources. See Table 1 for a complete list of sources.
Data sources
b. Variables
Sanitation score (SANSCORE): This variable uses the sanitation score awarded to each city. The total score is based on 19 indicators, which are categorized as output (50 points), process (30 points) and outcome (20 points), bringing the total to a maximum of 100 points. The indicators cover the water, wastewater, stormwater and solid waste sectors. We highlight a few example parameters that display the range of criteria that go into quantifying a broadly defined measure of sanitation. Output parameters, for instance, include no open defecation (16 points) and the proportion of treated water that is reused for non-potable applications (3 points); process parameters include monitoring and tracking systems to identify incidences of open defecation (4 points) and efficient solid waste management systems (5 points); and outcome parameters include improvements in quality of drinking water compared to baseline (7 points) and reduction in waterborne diseases compared to baseline (6 points). Solid waste indicators constitute a small proportion (18 per cent) of the overall score, and a revised score without the solid waste component correlated well with the overall sanitation score (Spearman’s ρ = 0.98, p < 0.001). Therefore, the use of SANSCORE to analyze the state of water, wastewater and stormwater infrastructure is appropriate.
Next, we describe our independent variables; a summary is presented in Table 2. The variables capture economic, demographic, social and sector variables.
Variable definitions and statistics
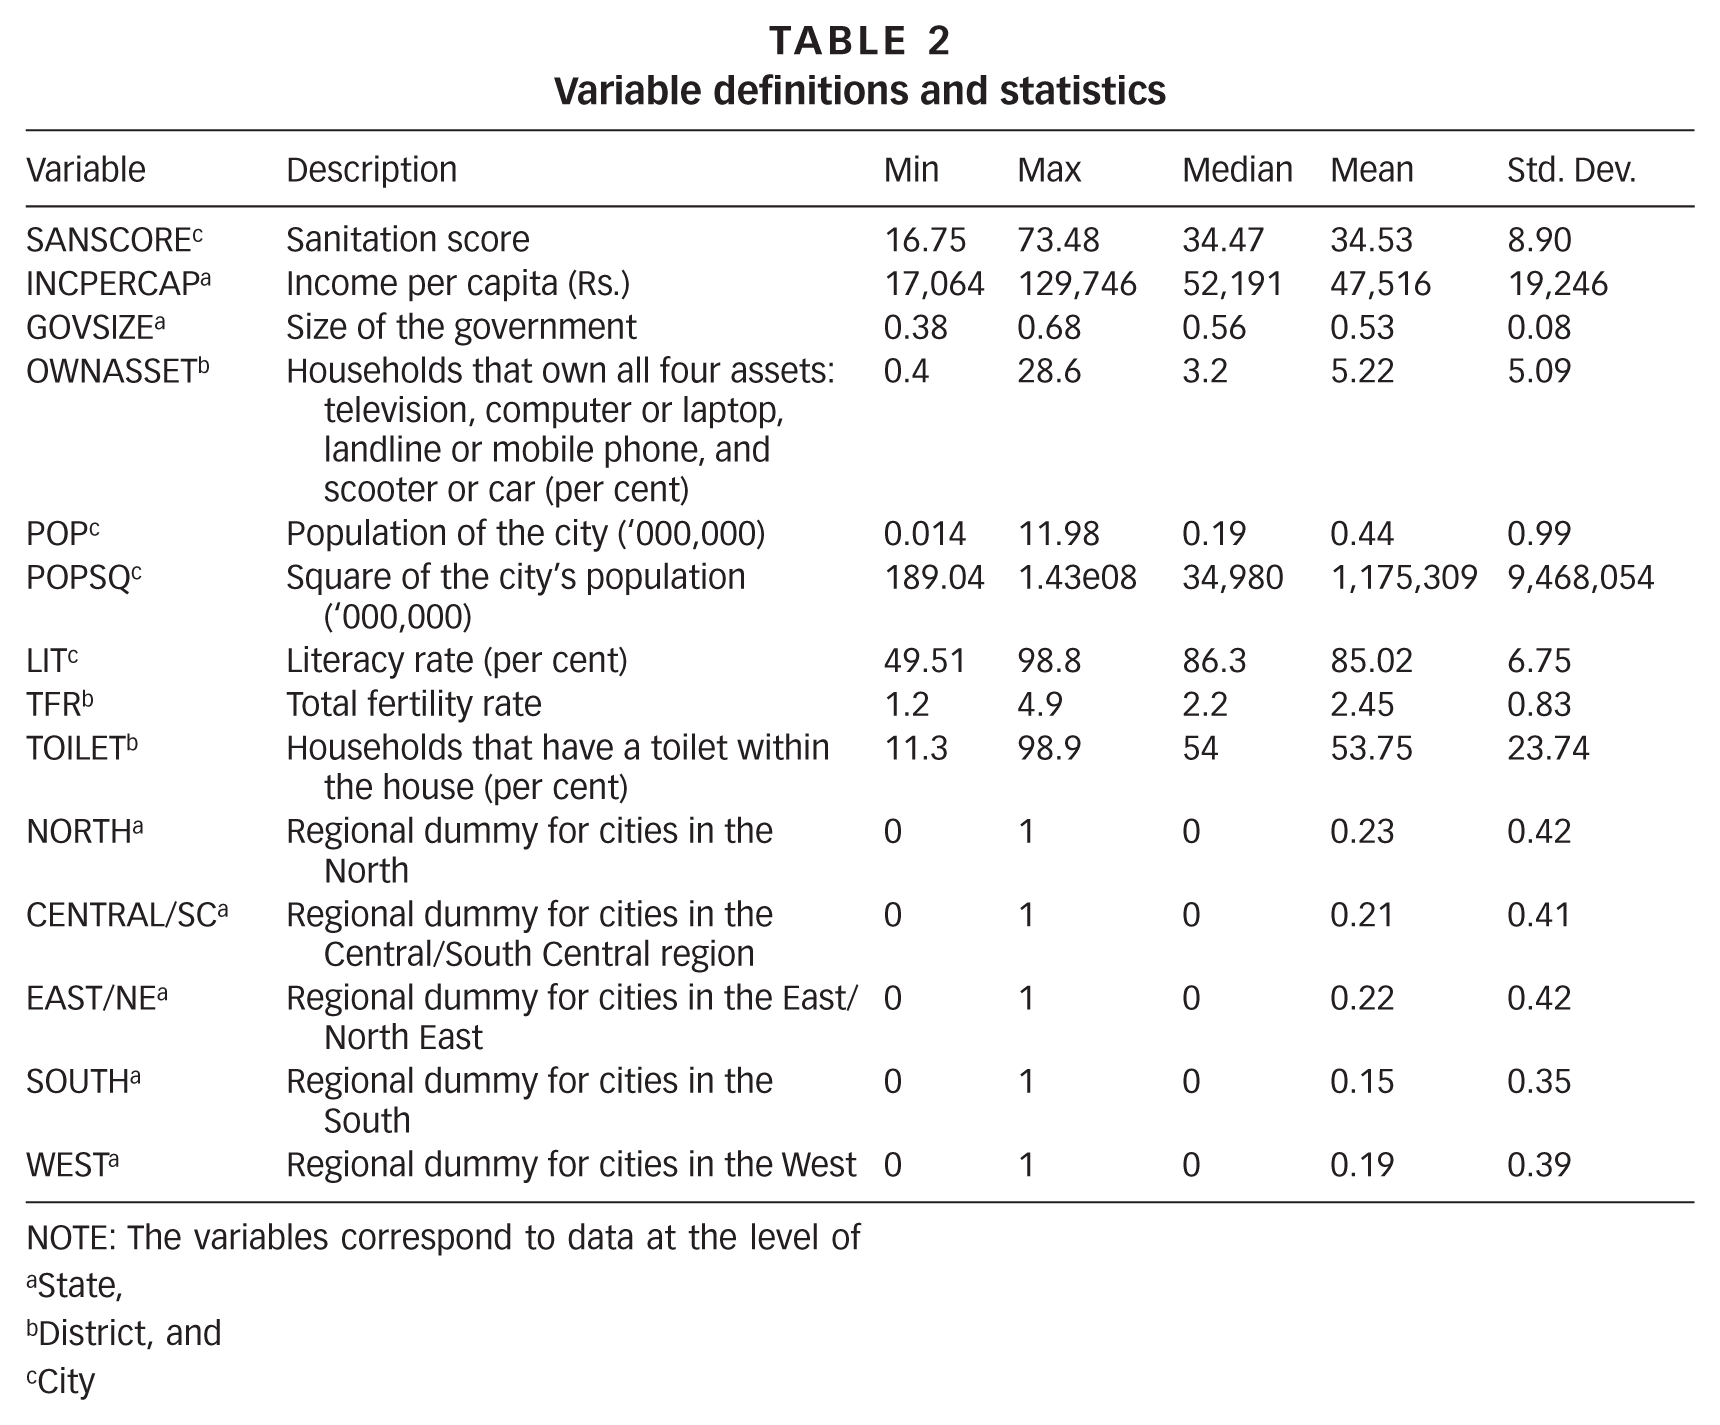
NOTE: The variables correspond to data at the level of
State,
District, and
City
Income per capita (INCPERCAP): Gross state domestic product divided by the population of the state during 2009–10, expressed in Rs. This variable controls for the relative affluence of the state in which the city is based. Higher income per capita would result in more tax revenues to the state, which allows for better water and wastewater infrastructure.( 46 )
Size of the government (GOVSIZE): Despite having a large economy, it is possible that certain states do not invest in the public sector. The Academic Foundation, in partnership with the Cato Institute, issues an “Economic Freedom Index” for Indian states, based on various measures of the states’ involvement in the economy.(47) One of the measures used in the freedom index is the size of the government, which ranges from 0 to 1. According to this index, taxes on income, commodities and property, a large number of public sector workers and high government revenue expenditures are indicators of an extensive government role in the economy. However, the freedom index and its components are measured in a counterintuitive way – a higher score implies a freer economy. For the purposes of our analysis, we define

where GovSizeEconomic Freedom is the average rating for 2005 and 2009,
such that a higher score on GovSizesanitation indicates a government that spends more on public programmes. As such, we expect higher sanitation scores in cities whose state governments have a bigger government. This variable is only available for the 20 large states.
Asset ownership (OWNASSET): Ownership of assets, recorded as a percentage of households in a district during the 2011 decennial census. The census records the ownership of the following assets: television; computer or laptop; landline or mobile phone; and scooter or car; and provides the percentage of households in each district that own all of the four assets. Although television and mobile phone ownership has rapidly risen (due to, and simultaneously resulting in, their low costs), computers and automobiles are still expensive products owned by a very small proportion of the population.(48) As a result, ownership of all four assets signifies better economic status of the residents, which we expect to be associated with improved sanitation outcomes.
Population: Population (POP) of the city and its square (POPSQ). These variables are proxies for the availability of resources and prior infrastructure. Larger cities have some, if not adequate, infrastructure that provides a minimal level of services to their residents. Small cities lack the infrastructure and the resources needed to provide adequate services. According to the Central Pollution Control Board, several mid-sized to small cities have low rates of water connection, and no wastewater treatment facilities.(49) Based on available data, we expect cities with large populations to score higher on the sanitation index.
Literacy rate (LIT): Proportion of literates in the district that contains the city. Literacy is defined as the ability to read and write with understanding in any language for individuals aged 7 and above. The connection between literacy and health outcomes is well established.(50) Even though India’s literacy rate has risen rapidly in the last few decades, it is still below the world average and is spatially heterogeneous. We expect literacy rates to be positively associated with sanitation scores.
Total fertility rate (TFR): Average number of children born to a woman in her reproductive lifetime. TFR is negatively correlated with wealth, education, urbanization, female labour participation and access to contraception, and is an important indicator of women’s rights.(51) TFR for each district containing a particular city was obtained from Guilmoto and Rajan,(52) and is expected to be negatively correlated with the sanitation score.
Toilet within premises (TOILET): Proportion of households in a district that have a toilet located within the house. For the purposes of census enumeration, toilet can refer to a flush/pour toilet connected to a sewer system or septic tank, a pit toilet with or without a slab, or a service toilet where night soil may or may not be removed regularly. We expect a positive association between the proportion of toilets within premises and the city’s sanitation score. Sewer coverage for each city may have been another important variable to include in our model. However, we were unable to identify reliable datasets that could provide such information.
Region: Region of the country where the city is located. States are grouped into to five regions – North, Central/South Central, East/North East, South, and West – based on the classification used by MoUD during the sanitation rating exercise.(53) A dummy is used for each region.
c. Model
An ordinary least squares (OLS) model is used to estimate the impact of independent variables on the city sanitation scores. The inclusion of economic, governance, social and sector controls minimizes the possibility of omitted variable bias. Further, a specification test was applied to rule out that possibility, and to validate the inclusion of variables chosen. Multicollinearity was tested using the variable inflation factor, and no significant effect was found.
VII. Results and Discussion
The Ministry of Urban Development categorized cities into four colour categories based on the sanitation score. Cities scoring more than 90.5 points are considered “healthy and clean” (green). Cities that score between 66.5 and 90.5 points are considered “recovering but still diseased” (blue); cities that score between 33.5 and 66.5 points “need considerable improvement” (black); and those scoring below 33.5 points “require immediate remedial action” (red).(54) Of the 421 cities evaluated by MoUD,(55) none was considered healthy and clean. Chandigarh, a union territory (UT), was the highest ranked city, scoring 73.48 points, followed by Mysore, Karnataka and Surat, Gujarat.(56) Churu, Rajasthan scored 16.75 and was the lowest ranked city in the list. Four cities were rated blue, 230 were rated black and the remaining 189 were rated red. Although this article will not discuss individual city scores, we wish to point out the unique characteristics of two of the top three cities in the list. Chandigarh was the first planned city in India post-independence, designed by French designer Le Corbusier in 1947.(57) Surat was a typical Indian city until 1995, when heavy flooding resulted in unsanitary conditions that led to a severe and deadly outbreak of pneumonic plague. Cleanup efforts since then have had dramatic results.(58) Sanitation scores seem to increase with city size, although the three largest cities (Greater Mumbai, Delhi and Chennai), accounting for more than 10 per cent of the country’s urban population, score poorly (Figure 1). Except for Surat, all the 10 largest cities were rated black.
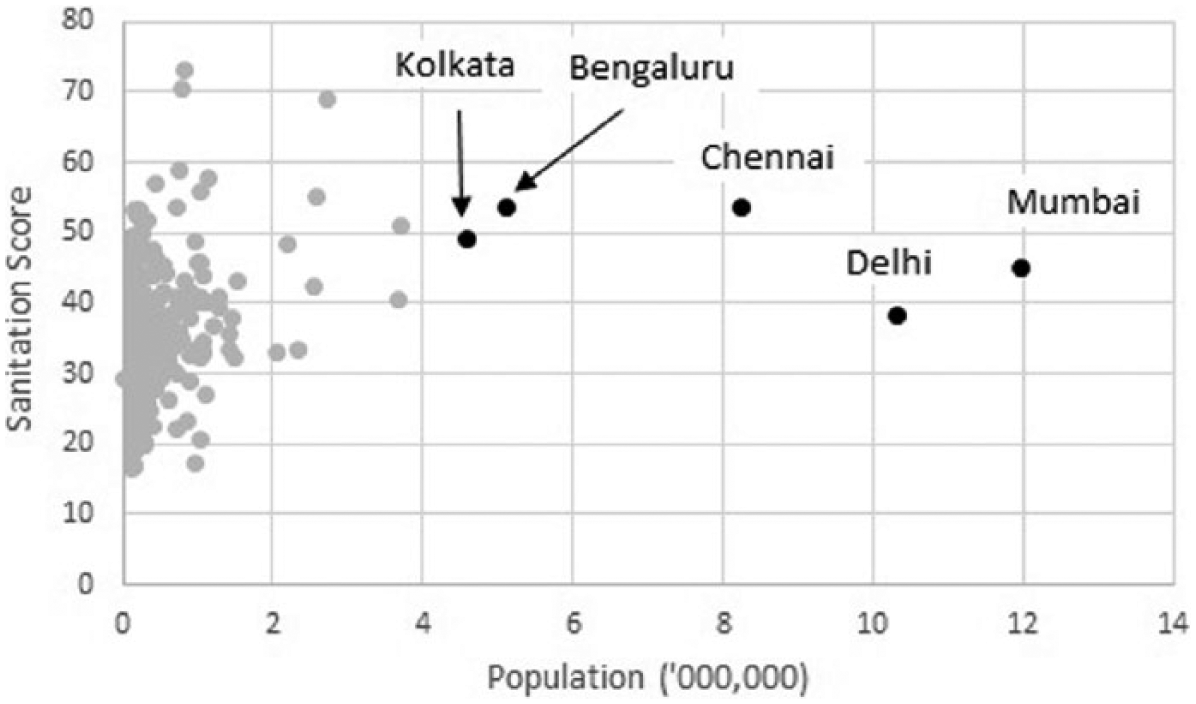
Sanitation scores plotted against population. The five largest cities are highlighted
Next, we aggregated the scores for individual cities and weighted them with the population to arrive at a weighted average sanitation score for each state and union territory in India (Figure 2). We do not use the colour bands used by MoUD in the original rating exercise since all the states would fall in either the red (33.5 points or fewer) or black (33.5 – 66.5 points) band. We used Jenks optimization to display the state averages in different classes, such that the squared deviation between classes is minimized. Meghalaya, which had only one city in the survey, was the highest scoring state, and was followed by Tamil Nadu and Gujarat, each of which had more than 20 cities in the survey. Jammu & Kashmir was the lowest scoring state. Figure 3 shows the average scores for each region. The weighted average scores are consistently higher than the simple average scores, confirming the earlier observation that scores improve with city size. The South scores better than the other four regions. The Southern states of Karnataka, Kerala and Tamil Nadu are socially more progressive than the nation as a whole, with low fertility rates and high literacy. Karnataka and Tamil Nadu are also two of the better performing economies in the country. The national weighted average sanitation score was 39.72, implying that, on average, urban India needs “immediate remedial action” through considerable improvement in its water and sanitation infrastructure.
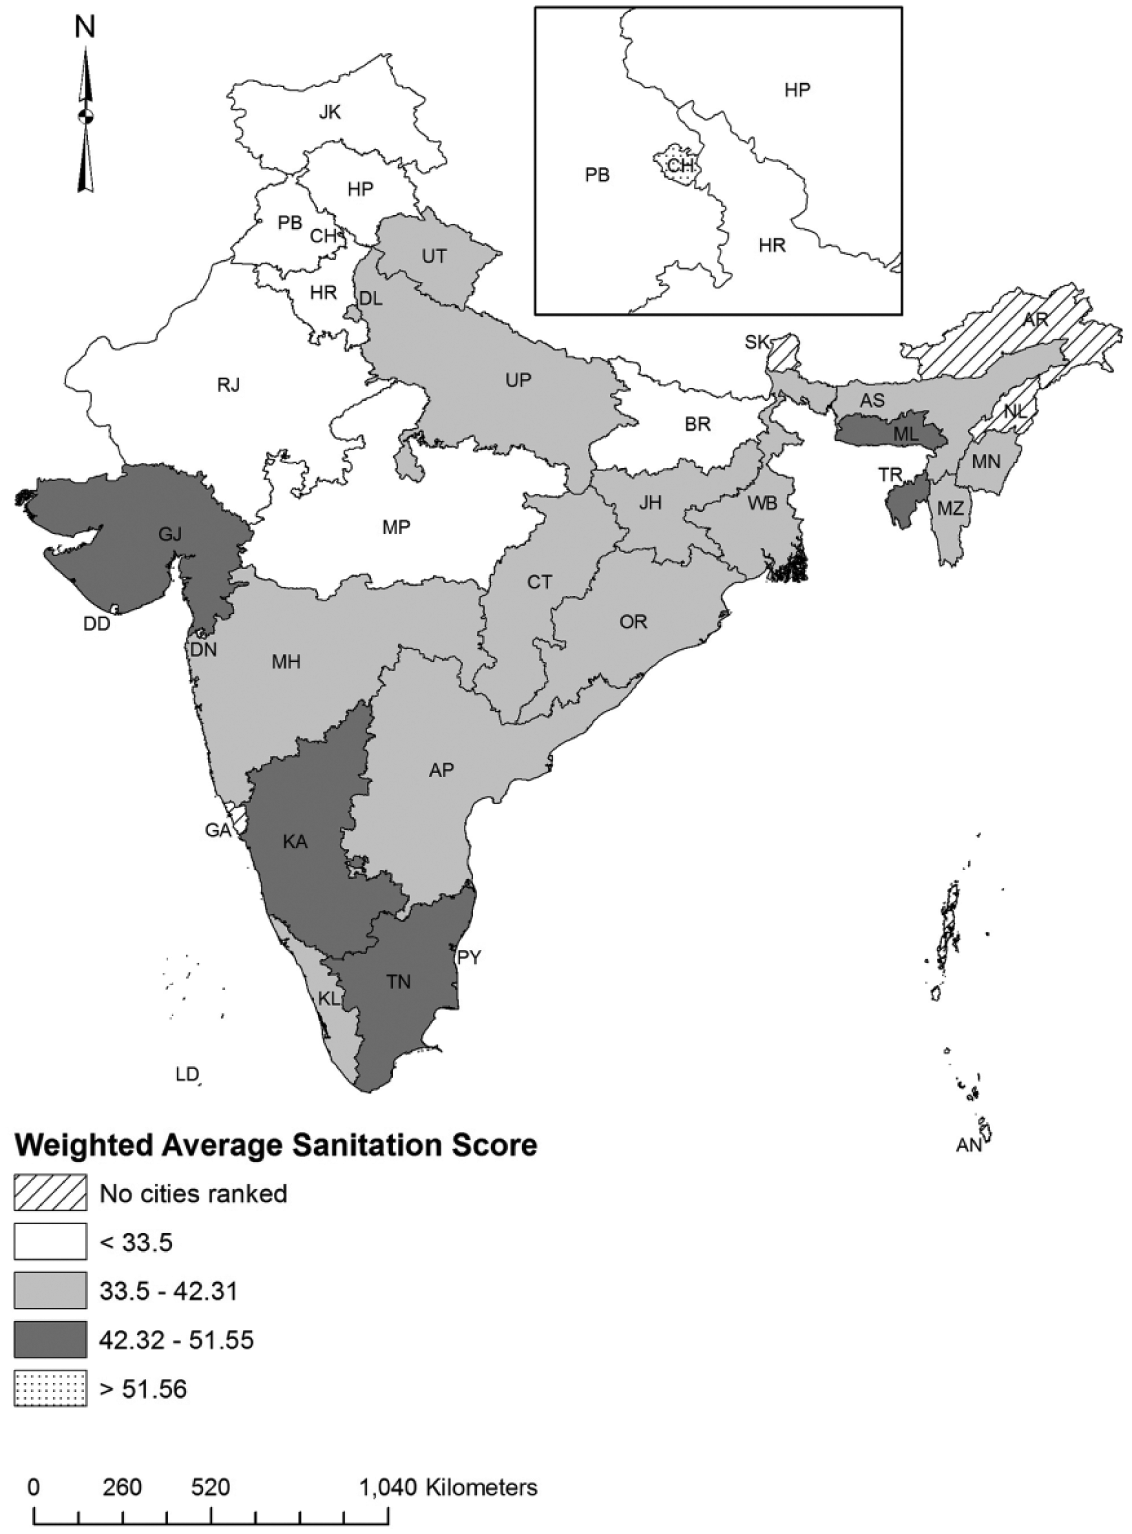
Weighted average sanitation scores for states and union territories in India
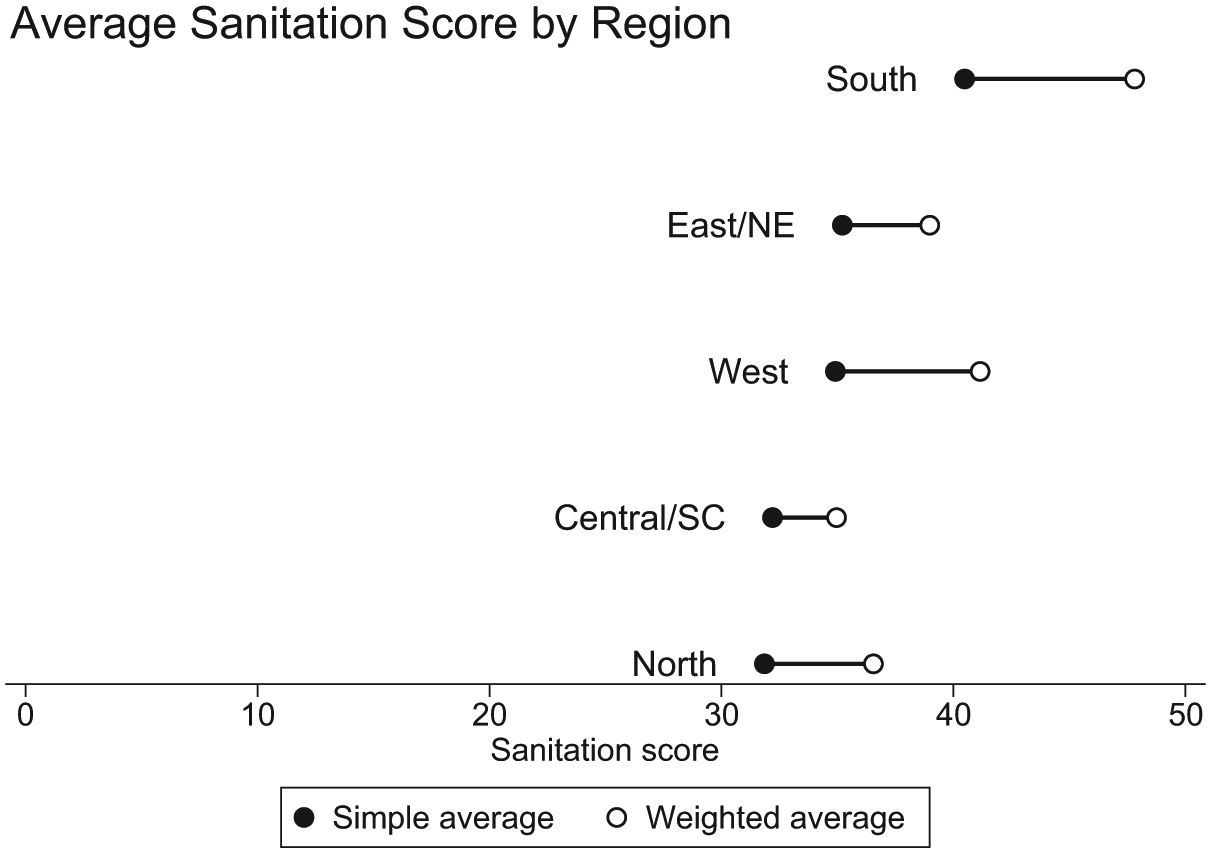
Average sanitation scores for the five regions
Table 3 shows the estimates for sanitation score (SANSCORE). Columns present a reduced model (1) and an expanded model (2). We first present the results of the reduced model (1). Although income per capita is not significant, asset ownership is a significant determinant of sanitation score. Asset ownership is an indicator of high disposable income; therefore, its relationship with sanitation score is along expected lines. Demographic variables, population (POP) and the square of the population (POPSQ), are significant in the model, but in a rather unexpected way. POP is positive and significant, confirming our initial hypothesis that larger cities have better sanitation infrastructure. However, the negative significance of POPSQ suggests a non-linear relationship between the size of the city and its sanitation infrastructure. More specifically, it suggests that as cities get bigger, they offer better water and wastewater services compared to their smaller counterparts. However, they reach a critical size, after which the sanitation services and infrastructure do not match the proportional increase in population. That may explain the fact that none of the five largest cities appears in the top 10 ranks of SANSCORE.(59) Chandigarh, the highest scoring city in the list, is the 49th largest.
OLS regression estimates of sanitation score
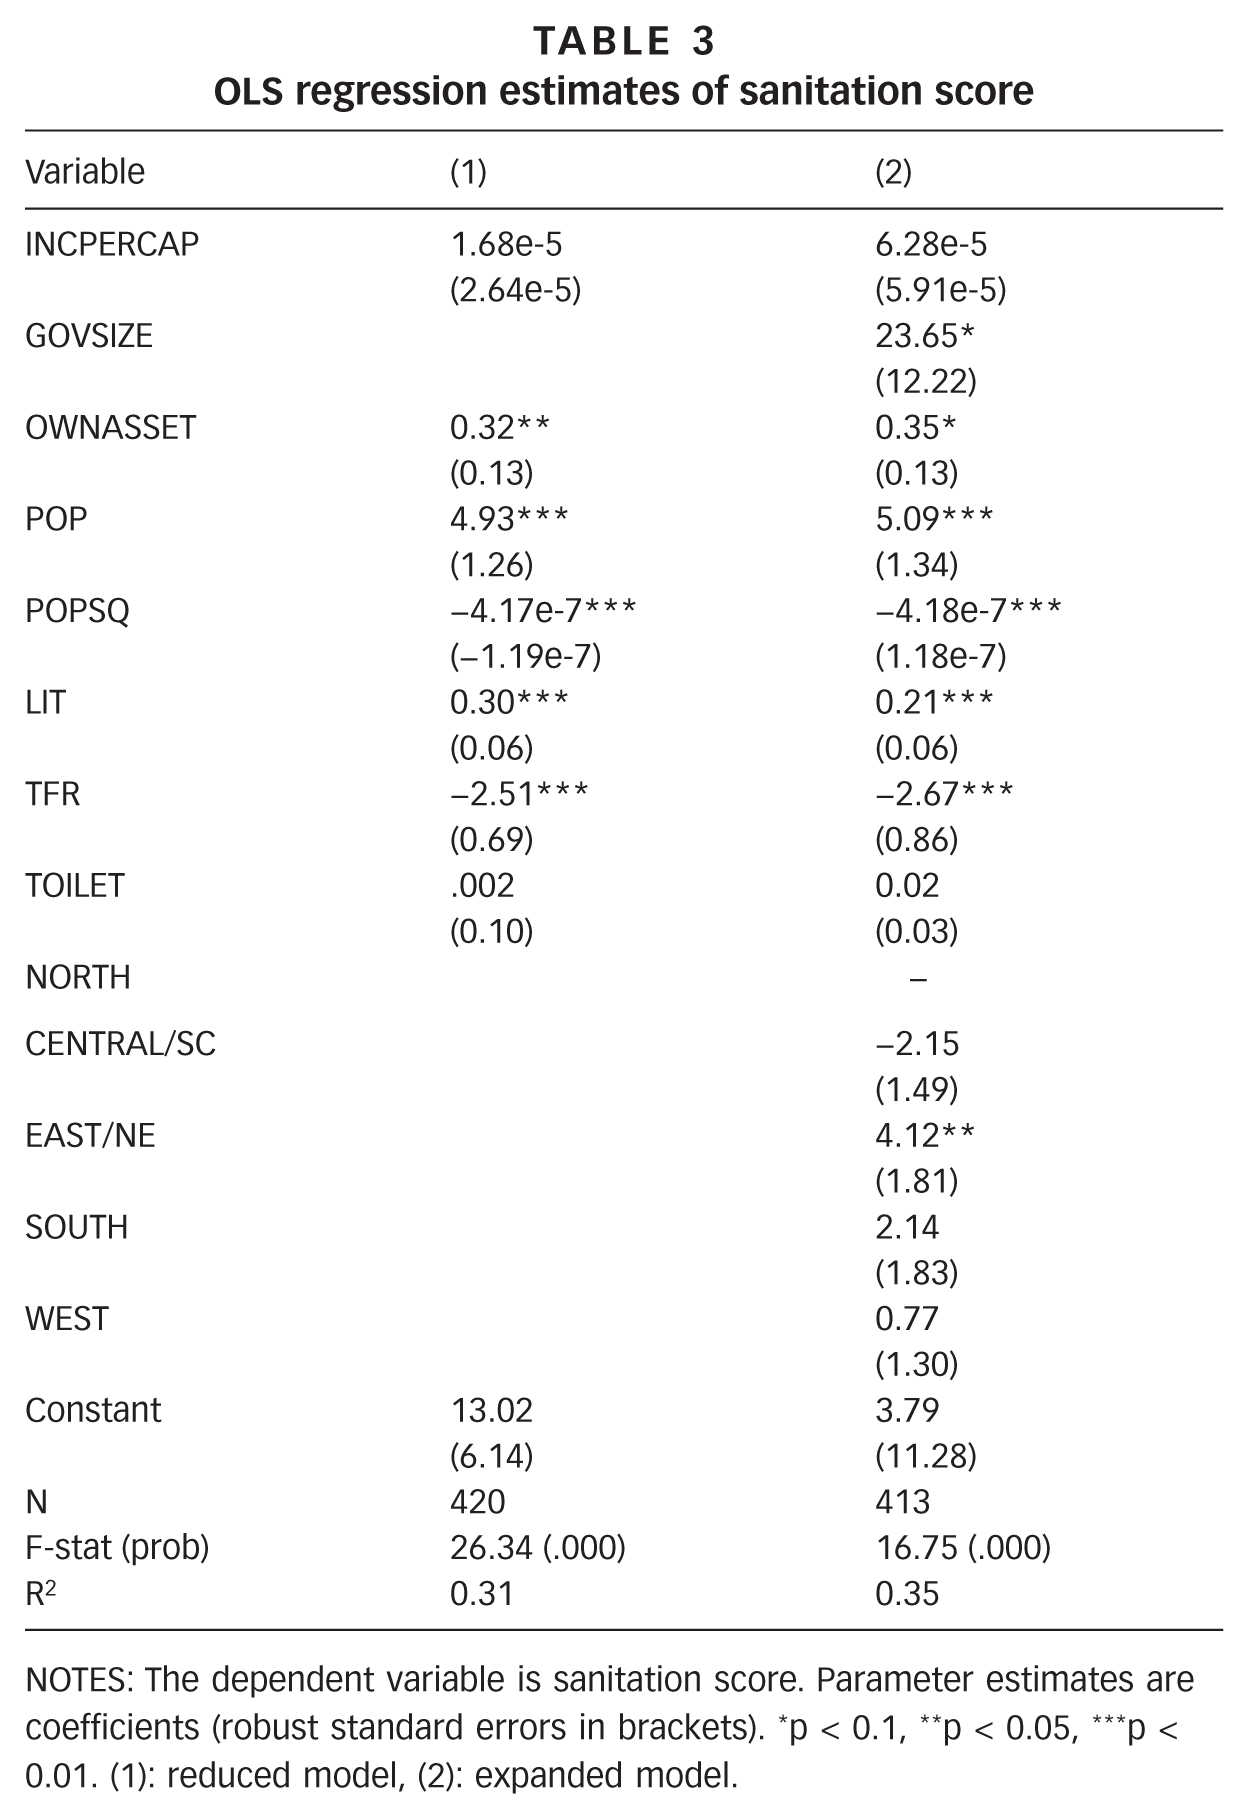
NOTES: The dependent variable is sanitation score. Parameter estimates are coefficients (robust standard errors in brackets). *p < 0.1, **p < 0.05, ***p < 0.01. (1): reduced model, (2): expanded model.
Literacy and total fertility rates are both significant, respectively positive and negative, in the model. While literacy rate is a general social indicator, total fertility rate is a gender-specific indicator and is strongly tied to women’s rights and awareness. Higher literacy rates and low TFR are associated with more education and better health outcomes; therefore, it is not surprising to see their respective associations with the sanitation scores. Ghosh and Cairncross show an inverse relationship between female literacy and open defecation using district-level figures for toilets in a household.(60) Most surprisingly, our estimates show that increased presence of household toilets does not influence the sanitation score. This could be a data issue: as we discussed earlier in Section V, the sanitation scores are not designed to capture the quality of household-level sanitation, and as a result, the city-wide scores are not influenced by the presence of toilets. However, recent literature may suggest an alternative explanation. A large-scale survey conducted in five North Indian states in the “Hindi Heartland” revealed that in over 40 per cent of the households with a working toilet, at least one member of the family defecates in the open.(61) Randomized controlled trials assessing the impact of the Total Sanitation Campaign in Madhya Pradesh and Odisha reported that, even though latrine construction increased in the “treatment” villages, the rates of open defecation did not fall correspondingly.(62) All of this suggests that the mere presence of a toilet does not guarantee a sanitary environment, hence our results at a higher spatial scale confirm field-level observations reported in the literature.
In the expanded model (2), we introduce the size of the government and regional dummy variables. Population, square of the population, literacy rate and TFR remain significant at the same levels, while asset ownership is significant only at the 10 per cent level. Size of the government is positive and significant, indicating some benefits of a government that collects more taxes and maintains a large budget flow toward improving the sanitation infrastructure. The estimates suggest no difference in SANSCORE among the North, Central/South Central, South and West regions. However, compared to cities in these regions, cities in the East/North East region record higher sanitation scores. The advantage garnered by Southern cities in the raw scores (Figure 3) disappears when additional controls are factored in.
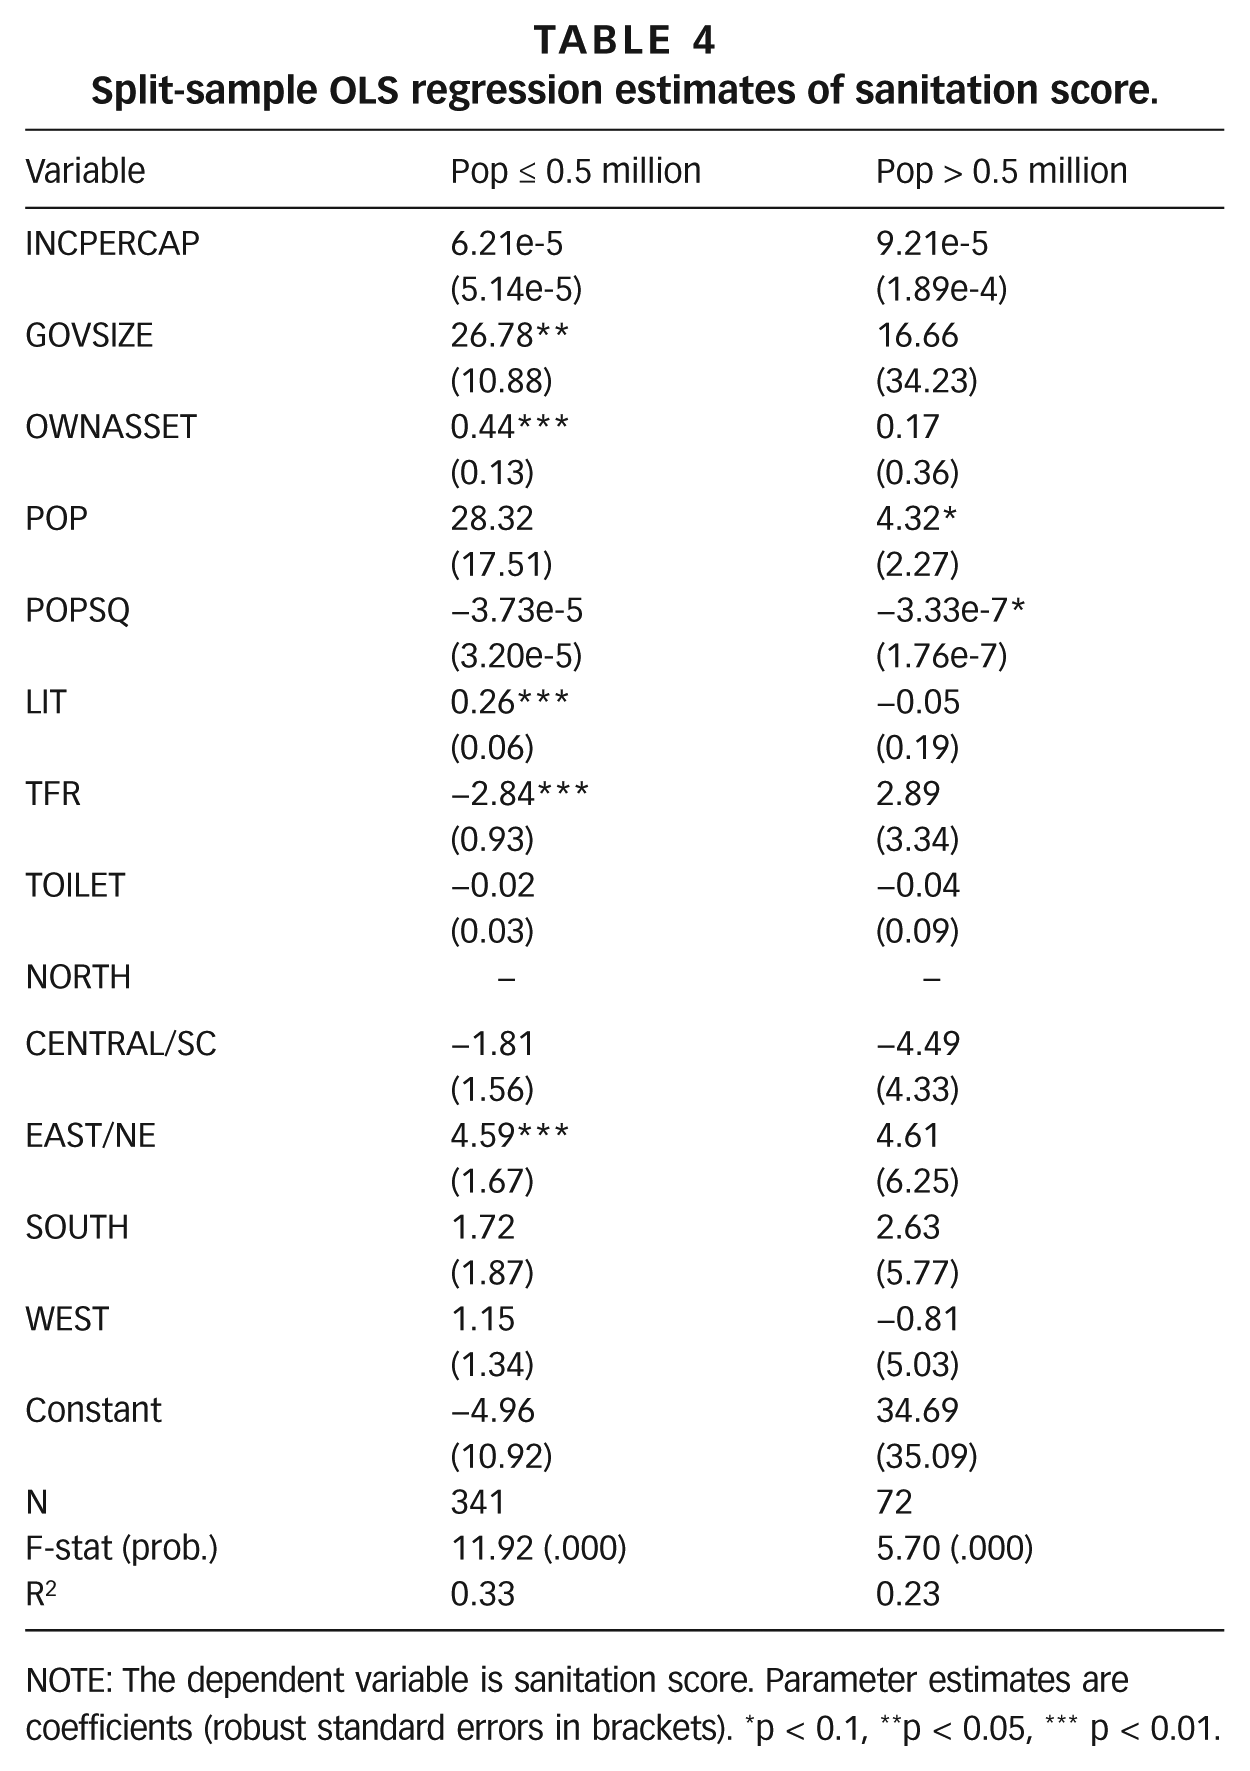
To further clarify the relationship between population and sanitation scores, we split the sample at 0.5 million persons to get a sample of small cities (0.5 million and fewer) and medium and large cities (greater than 0.5 million). We discuss the results of the split-sample regression (Table 4). For small cities, economic controls such as size of the government and asset ownership are positive and significant in the model. Population and its square have no effect on sanitation score. Literacy rate and TFR are significant in expected ways. No regional effect is observed. In contrast, the non-linear effect of population is observed in medium and large cities. None of the other variables are significant in the “medium and large cities” model.
Split-sample OLS regression estimates of sanitation score.
NOTE: The dependent variable is sanitation score. Parameter estimates are coefficients (robust standard errors in brackets). *p < 0.1, **p < 0.05, *** p < 0.01.
The split-sample regression estimates help unpack the sanitation data. Smaller cities do not differentiate among themselves on the sanitation score based on size, while medium and large cities seem to do so. Sanitation scores improve with city size (up to around 0.55 million), after which they are inversely related to city size. Further, government support plays a much more prominent role in the case of small cities. That, combined with asset ownership, results in better sanitation outcomes for those cities where the residents are in a position to pay for basic services. A strong regional pattern is also displayed among smaller cities, while the regions are indistinguishable from each other among medium and large cities. The difference in patterns observed in small as against medium to large cities points to a need for customized policy prescriptions for different classes of cities, preferably designed by municipal governments, that go beyond the targets set by the national government.
In the last decade, the Jawaharlal Nehru National Urban Renewal Mission, with its flagship programme for the largest cities, along with its counterpart for smaller cities, the Urban Infrastructure Development Scheme for Small and Medium Towns, has been the primary channel for improving infrastructure and civic services in Indian cities. Even though our estimates suggest a weak effect of the state government involvement in improving sanitation outcomes, targeted programmes like JNNURM can be a game-changer. The programme emphasized that participating cities be credit-rated to access the capital market for infrastructure financing. Such a mandate can allow the national and state governments to focus on smaller and credit-risky cities, which have traditionally received less attention from government and private investors. Already, we are observing some of these effects. Since the initiation of the JNNURM programme, a number of cities, large and small, have pursued PPPs in the water and wastewater sector.(63) Significant government financing has resulted in a majority of the PPP projects being located in cities with no bond ratings. In addition, cities with low or no bond ratings have attracted higher levels of per capita project investment through PPPs.
The National Urban Sanitation Policy has been an additional impetus to sanitation improvement in urban India. The sanitation scores apart, the policy calls for state-level sanitation policies and city-level sanitation plans. Some states (for example, Chhattisgarh and Odisha) have already created state-level “Urban Sanitation Strategy” documents, while others are in the process of doing so.(64) Although the 74th Constitutional Amendment Act of 1992 gave constitutional recognition to the urban local bodies (ULBs), state governments have been reluctant to delegate their authority and strengthen municipal-level reforms. As a result, states have been and remain the primary drivers of policy changes at the municipal level. ULBs have limited ability to raise revenue to finance infrastructure upgrades and civic improvements, and depend on their respective state governments to allocate funds. The emphasis on decentralized decision-making through NUSP and JNNURM, along with the increasing use of PPPs, promises to change this dynamic by strengthening urban infrastructure, while also addressing the administrative and financial weaknesses in ULBs.
After the 2014 national elections, which witnessed a change of power from the centre-left Congress Party to the centre-right Bharatiya Janata Party), it is pertinent to ask if the urban development programmes initiated by the previous government are likely to continue. There has been much speculation about a dramatic course correction in the economic and development programmes. Although the BJP manifesto did not specifically address the continuity of the JNNURM programme initiated by the Congress-led government, it emphasized water security and listed a series of measures, such as building sewage treatment plants and desalination plants in coastal cities that seem to be JNNURM-like in essence.(65) Further, the BJP manifesto aimed for an open defecation-free India and the introduction of “sanitation ratings” that will measure and rank cities on sanitation, without mentioning that such a programme already exists. It appears that the Modi government is likely to continue some of the flagship urban development programmes of the previous government, possibly with some changes.(66) In fact, the Prime Minister-designate Narendra Modi channelled Mahatma Gandhi in his victory speech in Varanasi, Uttar Pradesh (also known by its alternate name, Kashi) – one of the two constituencies from where he contested and won – when he said, “Take a pledge that from today that you would keep the city of Kashi clean. We are all servants of Kashi. It is our responsibility to keep it clean.”(67)
The launch of the Mission Swachh Bharat (Mission Clean India) seems to signal the intent of the new administration in tackling sanitation as a public policy and public health challenge.(68) The evaluation of city-level sanitation scores on a regular basis can achieve a few objectives. Scores in later surveys can be compared to the baseline scores achieved in the 2009 survey to quantify progress made by the cities on the various indicators. Earlier in the article, we discussed the subjective nature of the metrics that comprise the sanitation score. Improvements to the scoring methodology will be needed to ensure consistent measurements over time. Though welcome, such improvements could render the comparison with the 2009 score invalid. Therefore, the administration must be careful in revising the scoring methodology when the new “sanitation ratings” exercise gets underway. City administrators could be brought together for state- and national-level meetings focused on sanitation to exchange ideas and measures implemented in their respective jurisdictions. Further, this programme could be made more effective by pegging national and state funding to cities based on progress made on the indicators. That would provide an incentive for cities to undertake rapid action on sanitation. Extending this programme to towns with populations of less than 100,000 would cover the remaining urban population and give a more holistic view of urban sanitation in India.
VIII. Conclusions
The urban areas in India are growing much faster than expected, and much of the growth is happening in the suburban metropolitan areas – satellite towns around major metro cities.(69) Urban areas are increasingly strained in providing basic services to residents. Improvement in urban services has received prominence in recent years through government programmes such as JNNURM and NUSP. Despite its limitations, the use of a city-level sanitation score to assess the state of current infrastructure and to monitor progress is novel. We analyze the sanitation score for 421 cities to identify factors that explain variation in scores. Our estimates suggest that higher sanitation scores are partly a result of where cities are located. Cities in the South score better than the rest of the cities, though that effect disappears when additional controls are factored in. Cities in the East and North East, and those that spend more on public programmes, perform better on this metric. In addition, a higher proportion of wealthy residents, high literacy, low total fertility rate and higher population (up to 0.55 million) are correlated with a high sanitation score. Increased presence of toilets does not influence the city-level sanitation score. This is consistent with recent literature showing that a singular focus on increased construction of toilets may not improve sanitation outcomes.
Further, smaller cities display characteristics not observed in medium and large cities. Economic factors and regional controls play a much more prominent role in determining sanitation scores for smaller cities, while medium and large cities display very little variation, except for size. This points to a need for customized policy prescriptions for different classes of cities, preferably designed by municipal governments, that go beyond the targets set by the national government. Programmes such as JNNURM and NUSP have played a significant role in increasing investment in cities of all sizes, but they need to be complemented by state and local governments, with active participation from the private sector and local communities. It remains to be seen if these investments can result in measurably improved health, environmental and social outcomes.
Footnotes
Acknowledgements
Veeravenkata Sandeep Vanka provided research support in data gathering and organization. This research was supported in part by the New York State Environmental Protection Fund via the Hudson River Estuary Program of the New York State Department of Environmental Conservation (USA).
1.
United Nations (2000), United Nations Millennium Declaration, United Nations General Assembly, New York, 18 September, available at ![]() .
.
2.
WHO/UNICEF (2013), Progress on Sanitation and Drinking-Water – 2013 Update, Joint Monitoring Programme for Water Supply and Sanitation, March, available at ![]() .
.
3.
Bain, Rob E S, Stephen W Gundry, Jim A Wright, Hong Yang, Steve Pedley and Jamie K Bartram (2012), “Accounting for water quality in monitoring access to safe drinking-water as part of the Millennium Development Goals: lessons from five countries”, Bulletin of the World Health Organization Vol 90, No 3, pages 228–235; also Satterthwaite, David (2003), “The Millennium Development Goals and urban poverty reduction: great expectations and nonsense statistics”, Environment and Urbanization, Vol 15, No 2, pages 179–190.
4.
5.
Vedachalam, Sridhar (2012), “Water supply in Chennai: Desalination and missed opportunities”, Economic and Political Weekly, Vol 47, No 23, pages 26–29.
6.
Narain, Sunita (2012), “Sanitation for all”, Nature Vol 486, page 185.
7.
Boschi-Pinto, Cynthia, Lana Velebit and Kenji Shibuya (2008), “Estimating child mortality due to diarrhea in developing countries”, Bulletin of the World Health Organization Vol 86, pages 710–717.
8.
Department for International Development (2010), Access to Safe Water for the Bottom of the Pyramid: Strategies for Disseminating Technology Research Benefits – Secondary Research Report, available at ![]() .
.
9.
Water and Sanitation Program (2011), Economic Impacts of Inadequate Sanitation in India, New Delhi, available at ![]() .
.
10.
Hutton, Guy, Laurence Haller and Jamie Bartram (2007), Economic and Health Effects of Increasing Coverage of Low-Cost Household Drinking Water Supply and Sanitation Interventions to Countries Off-track to Meet MDG Target 10, World Health Organization, Geneva, 53 pages.
11.
See reference 9.
13.
14.
Cutler, David and Grant Miller (2005), “The role of public health improvements in health advances: The twentieth-century United States”, Demography Vol 42, Issue 1, pages 1–22.
15.
Troesken, Werner (2004), Water, Race, and Disease, MIT Press, Cambridge, MA.
16.
Fewtrell, Lorna, Rachel B Kaufmann, David Kay, Wayne Enanoria, Laurence Haller and John M Colford Jr (2005), “Water, sanitation, and hygiene interventions to reduce diarrhoea in less developed countries: a systematic review and meta-analysis”, The Lancet Infectious Diseases Vol 5, No 1, pages 42–52.
17.
Benova, Lenka, Oliver Cumming and Oona M R Campbell (2014), “Systematic review and meta-analysis: association between water and sanitation environment and maternal mortality”, Tropical Medicine and International Health Vol 19, No 4, pages 368–387.
18.
See reference 15.
19.
Watson, Tara (2006), “Public health investments and the infant mortality gap: Evidence from federal sanitation interventions on U.S. Indian reservations”, Journal of Public Economics, Vol 90, Issues 8–9, pages 1537–1560.
20.
Epstein, M B, M N Bates, N K Arora, K Balakrishnan, D W Jack and K R Smith (2013), “Household fuels, low birth weight, and neonatal death in India: The separate impacts of biomass, kerosene, and coal”, International Journal of Hygiene and Environmental Health Vol 216, Issue 5, pages 523–532.
21.
Dangour, Alan D, Louise Watson, Oliver Cumming, Sophie Boisson, Yan Che, Yael Velleman, Sue Cavill, Elizabeth Allen and Ricardo Uauy (2013), “Interventions to improve water quality and supply, sanitation and hygiene practices, and their effects on the nutritional status of children”, Cochrane Database of Systematic Reviews Issue 8, Article No CD009382, DOI 10.1002/14651858.CD009382.pub2.
22.
Spears, Dean (2013), “How Much International Variation in Child Height Can Sanitation Explain?” Policy Research Working Paper 6351, World Bank, Washington DC, available at https://openknowledge.worldbank.org/handle/10986/13163; also Spears, Dean, Arabinda Ghosh and Oliver Cumming (2013), “Open Defecation and Childhood Stunting in India: An Ecological Analysis of New Data from 112 Districts”, PLOS ONE Vol 8, No 9, e73784.
23.
Pearson, Joanna and Kate McPhedran (2008), “A literature review of the non-health impacts of sanitation”, Waterlines Vol 27, No 1, pages 48–61.
24.
Freeman, Matthew C, Leslie E Greene, Robert Dreibelbis, Shadi Saboori, Richard Muga, Babette Brumback and Richard Rheingans (2012), “Assessing the impact of a school-based water treatment, hygiene and sanitation programme on pupil absence in Nyanza Province, Kenya: a cluster-randomized trial”, Tropical Medicine & International Health Vol 17, pages 380–391.
25.
Spears, Dean (2012), “Height and cognitive achievement among Indian children”, Economics and Human Biology Vol 10, Issue 2, pages 210–219.
26.
Durán-Narucki, Valkiria (2008), “School building condition, school attendance, and academic achievement in New York City public schools: A mediation model”, Journal of Environmental Psychology Vol 28, Issue 3, pages 278–286.
27.
Press Information Bureau (2008), “PM addresses the Third South Asian Conference on Sanitation”, 18 November, Government of India, New Delhi, available at ![]() .
.
28.
Vedachalam, Sridhar (2011), “WaSH and human development”, Aguanomics, 11 May, available at ![]() .
.
29.
Chaplin, Susan E (2011), “Indian cities, sanitation and the state: The politics of the failure to provide”, Environment and Urbanization Vol 23, No 1, pages 57–70.
30.
Brocklehurst, Clarissa (2010), “Water, Sanitation and Hygiene – The Big Picture”, UNICEF.
31.
Sathyaseelan, Samuel (2013), “Neglect of sewage workers: Concerns about the new Act”, Economic and Political Weekly Vol 48, No 49, pages 33–37.
33.
In September 2014, the recently-elected Modi administration restructured the Nirmal Bharat Abhiyan into Swachh Bharat Mission with two sub-missions, each focusing on rural or urban areas. See Press Information Bureau (2014), “Restructuring of the Nirmal Bharat Abhiyan into Swachh Bharat Mission”, 24 September, Government of India, New Delhi, available at ![]() .
.
35.
See reference 12.
36.
37.
Vedachalam, Sridhar, R Richard Geddes and Susan J Riha (2014), “Public-Private Partnerships and Contract Choice in India’s Water and Wastewater Sector”, Working paper, available at ![]() .
.
38.
WHO/UNICEF Fund Joint Monitoring Programme for Water Supply and Sanitation (2014), “The sanitation and drinking-water ladders”, available at ![]() .
.
39.
Gunawardana, I P P and L W Galagedara (2013), “A new approach to measure sanitation performance”, Journal of Water, Sanitation and Hygiene for Development Vol 3, No 2, pages 269–282.
40.
Mehta, Meera and Dinesh Mehta (2013), “City sanitation ladder: Moving from household to citywide sanitation assessment”, Journal of Water, Sanitation and Hygiene for Development Vol 3, No 4, pages 481–488.
41.
Although MoUD uses the term cities, it is more appropriate to refer to them as municipalities (often referred to as urban local bodies, ULBs, in official parlance). In cities that contain multiple municipalities (Ambala, Delhi and Kanpur), the municipalities are rated separately, with varying results. For the purpose of data analysis, we aggregated the scores from the three ULBs in Delhi and used a weighted average score to pair them with independent variables that are available only at the city level (or district level) and not at the ULB level. Kanpur and Kanpur Cantonment come under different districts, and Ambala (254,847) and Ambala Sadar (106, 568) have comparable populations; hence, they were retained as individual “cities” in our dataset.
42.
See reference 13.
43.
See reference 13.
44.
See reference 12.
45.
Ministry of Home Affairs (2011), CensusInfo India 2011 v2.0, Government of India, New Delhi, available at ![]() .
.
47.
Debroy, Bibek, Laveesh Bhandari and Swaminathan S Anklesaria Aiyar (2011), Economic Freedom of the States of India 2011, Academic Foundation, New Delhi.
48.
A little less than 10 per cent of the households own either a computer or a laptop, according to the 2011 Census. See Hawkes, Rebecca (2012), “India census reveals rapid rise in TV, mobile ownership”, Rapid TV News, 14 March, available at ![]() .
.
49.
See reference 4.
50.
Berkman, N D, D A DeWalt, M P Pignone, S L Sheridan, K N Lohr, L Lux, S F Sutton, T Swinson and A J Bonito (2004), “Literacy and Health Outcomes: Summary”, in Agency for Healthcare Research and Quality, AHRQ Evidence Report Summaries No 87, Rockville, available at http://www.ncbi.nlm.nih.gov/books/NBK11942; also Weiss, Barry D, Gregory Hart and Ronald E Pust (1999), “The relationship between literacy and health”, Journal of the Health Care for the Poor and Underserved, Vol 1, No 4, pages 351–363.
51.
Winter, Jay and Michael Teitelbaum (2013), The Global Spread of Fertility Decline: Population, Fear and Uncertainty, Yale University Press, New Haven.
52.
Guilmoto, Christophe Z and S Irudaya Rajan (2013), “Fertility at the district level in India: Lessons from the 2011 Census”, Economic and Political Weekly Vol 48, No 23, pages 59–70.
54.
See Table 4 in reference 13. The intervals for the four categories, as defined in the article, differ slightly from those described in ![]() . As per the MoUD description, there is a gap between the end of an interval and the beginning of the next. Therefore, the status of cities that score, for example, between 33.00 and 33.99 is unclear. However, the dataset released by MoUD places cities scoring 33.50 or below in the “red” category and those above 33.50 in the “black” category. Correspondingly, we revised the intervals to ensure continuity among the four intervals.
. As per the MoUD description, there is a gap between the end of an interval and the beginning of the next. Therefore, the status of cities that score, for example, between 33.00 and 33.99 is unclear. However, the dataset released by MoUD places cities scoring 33.50 or below in the “red” category and those above 33.50 in the “black” category. Correspondingly, we revised the intervals to ensure continuity among the four intervals.
55.
Though the MoUD documents state 423 cities were evaluated, our count consolidates three of Delhi’s ULBs into one city, hence 421 cities.
56.
A union territory is an administrative region in India that is ruled directly by the central government with an appointed administrator. Some UTs like Delhi and Puducherry have an elected legislature and head of state.
57.
Chandigarh is also a unique Indian city. Apart from being a UT, it also serves as the capital for two bordering states, Punjab and Haryana.
58.
Kapshe, Manmohan, Paulose N Kuriakose, Garima Srivastava and Akhilesh Surjan (2013), “Analysing the co-benefits: case of municipal sewage management at Surat, India”, Journal of Cleaner Production Vol 58, pages 51–60.
59.
Two of Delhi’s smaller ULBs appear in the original top 10 list. However, collectively, they account for only 4 per cent of the city’s population.
60.
Ghosh, Arabinda and Sandy Cairncross (2014), “The uneven progress of sanitation in India”, Journal of Water, Sanitation and Hygiene for Development Vol 4, No 1, pages 15–22.
61.
Coffey, Diane, Aashish Gupta, Payal Hathi, Nidhi Khurana, Nikhil Srivastav, Sangita Vyas and Dean Spears (2014), “Open defecation: Evidence from a new survey in rural North India”, Economic and Political Weekly Vol 49, No 38, pages 43–55.
62.
Barnard, Sharmani, Parimita Routray, Fiona Majorin, Rachel Peletz, Sophie Boisson, Antara Sinha and Thomas Clasen (2013), “Impact of Indian Total Sanitation Campaign on Latrine Coverage and Use: A Cross-Sectional Study in Orissa Three Years following Programme Implementation”, PLOS One, Vol 8, No 8, e71438; also Patil, Sumeet R, Benjamin F Arnold, Alicia L Salvatore, Bertha Briceno, Sandipan Ganguly, John M Colford Jr and Paul J Gertler (2014), “The effect of India’s total sanitation campaign on defecation behaviors and child health in rural Madhya Pradesh: a cluster randomized controlled trial”, PLOS Medicine Vol 11, No 8, e1001709.
63.
See reference 37.
64.
There are, however, some states like Jharkhand, whose sanitation policy exclusively focuses on rural sanitation.
65.
JNNURM ended on 31 March 2014 and was not extended by the outgoing United Progressive Alliance government. Statements from MoUD of the BJP government indicate that JNNURM will not be extended, but it will be replaced by a different programme focused on the creation of “smart cities”. See also Bharatiya Janata Party (2014), Election Manifesto 2014, New Delhi, available at ![]() .
.
66.
The Ministry of Tourism is introducing its own “cleanliness index” aimed towards attracting greater numbers of foreign tourists to Indian cities. It is not apparent if this index is prepared in conjunction with MoUD, which is in charge of urban sanitation issues. See Bhargava, Yuthika and Anita Joshua (2014), “Cleanliness index soon to rank cities”, The Hindu, 20 September, available at ![]() .
.
67.
Parera, Ayeshea (2014), “LIVE: Sonia congratulates Modi during CPP meet”, FIRSTPOST, 24 May, available at ![]() .
.
68.
Although the launch of the mission garnered excessive publicity and media coverage, a clear policy document with measurable objectives and an implementation plan is yet to be released.