
Abstract
Urban sanitation in India faces many challenges. Nearly 60 million people in urban areas lack access to improved sanitation arrangements, and more than two-thirds of wastewater is let out untreated into the environment, polluting land and water bodies. To respond to these environmental and public health challenges, urban India will need to address the full cycle of sanitation, i.e. universal access to toilets, with safe collection, conveyance and treatment of human excreta. This paper outlines these concerns, and highlights the need for focusing on access to water and the full cycle of sanitation for the urban poor, as fundamental to addressing the sanitation challenge. Priorities for policy and financing for urban sanitation in India are discussed, and the paper concludes with an examination of key policy initiatives in the last decade, assessing the extent to which these priorities are gaining attention.
I. Urban Sanitation:(1) From “Toilets” To The Whole Wastewater Cycle
“More Indians have mobile phones than toilets”.(2) This sensational news first made headlines in 2010 in both Indian and international media and has since been featured in the media with striking regularity. In India’s parliamentary elections in 2014, toilets were highlighted by the two largest political parties; the Bharatiya Janata Party (BJP) manifesto called for an “open defecation free India”, and the Indian National Congress (INC) manifesto promised a “functional toilet in every school and every household”.(3) The new government has launched a massive new programme – Swachh Bharat Mission (SBM), including an aggressive public campaign around sanitation and “cleanliness”. Sanitation appears finally to be getting the attention it deserves.
But it is imperative that urban India address not just toilets but the full cycle of sanitation if it wishes to meet the environmental and public health challenges. The paper identifies key steps and presents priorities for policy and financing for urban sanitation in India.
a. The imperative to address the full water and wastewater cycle
Lack of adequate sanitation remains a major cause of disease in developing countries. Diarrhoea is the second leading cause of mortality among children under five globally,(4) with deaths directly attributable to lack of adequate sanitation and associated hygiene practices.(5) In the absence of adequate sanitation, interventions that improve water or hygiene are less effective than they would be if sanitation were improved.(6)
The urban poor suffer disproportionately from the lack of adequate sanitation. A study estimating related economic losses showed that urban households in the poorest quintile bear the highest per capita economic impacts of inadequate sanitation, 1.75 times the national per capita losses and 60 per cent more than the urban figure.(7)
By definition, a sanitation system needs to perform the following: collect and isolate human waste, safely transmit this waste, and then treat this waste before reusing it or letting it out in the environment.(8) A functional toilet performs only a few of these functions: collection and isolation, temporary storage in the case of on-site systems, and partial treatment. Without concomitant attention to safe waste collection and disposal, “improved toilets” will not necessarily lead to improved health outcomes – given the multiple routes through which faecal exposure takes place.(9) Studies have shown that improved health outcomes are dependent on neighbours’ access to adequate sanitation,(10) and that sanitation at the community level is necessary to achieve health outcomes.(11)
The Millennium Development Goal (MDG) pertaining to sanitation referred to “access to improved sanitation”, without mention of safe waste conveyance and disposal.(12) These definitions have influenced funding to the sector globally.(13) Hence, there is a need to reiterate the importance of the whole wastewater approach to urban sanitation for achieving public health outcomes.
b. Access to drinking water
The deficits in sanitation become more critical in the context of the absence of reliable, safe water in Indian cities. Only a little more than 60 per cent of urban households have access to public supplies of drinking water.(14) Even households connected to the public supply system receive on average only three hours of drinking water supply a day, and an average of 75 litres per capita as opposed to the norm of 135.(15) Most urban households in India depend on multiple sources – often separate sources for potable and non-potable uses, as is clear from case studies from several parts of India.(16)
The most worrisome consequence of this dependence on non-public, non-networked sources, often multiple and distant, is the contamination of water, especially for potable uses.(17) Even water from public systems can be contaminated, however.(18) Middle-income and rich households can insulate themselves by using bottled water or electrical mechanical purifiers, and the past few years have seen dramatic growth in these industries (22 per cent for the water purifiers and 15 per cent for bottled water).(19) In this context, it is important to ensure that the waste is safely collected and treated – no matter what the technologies or means are at each stage of the cycle.
c. Household-level deficits in sanitation
Table 1 clearly illustrates the scale of the deficit in urban sanitation at the household levels. According to census data, 13 per cent (10 million) households resort to open defecation, and another 3 per cent or 1.8 million households have “unimproved” sanitation (unimproved pit latrines, removal of night soil by humans, animals or direct flow into drainage). Six per cent or around 5 million households rely on public toilets but these do not include toilets shared by neighbours. However, the National Sample Survey Office estimates that around 31 per cent of urban households depend on shared/community/public toilets, out of which households with shared toilets account for 24 per cent.(20) While urban India has made some progress over the past decade, the lack of access to improved sanitation, particularly open defecation, poses a challenge, and needs to be addressed on a priority basis.
Distribution of urban households by type of toilet
SOURCE: Census of India (2011), Houselisting and Housing Census Data, available at http://www.censusindia.gov.in/2011census/hlo/HLO_Tables.html.
These deficits are not uniformly distributed, but vary within and across cities.(21) Within cities, access varies according to socioeconomic condition. As indicated in Figure 1, more than one-third of households in the lowest income category lack access to any toilets.(22)
Distribution of toilet facilities across different income groups, 2009
There is further differentiation among the urban poor – for example, a study has shown that the health burden on children is higher in more vulnerable slums (depending upon tenure security, service provisioning, and socioeconomic conditions).(23) But it is beyond the scope of the paper to explore these differences.
In addition to the lack of toilets, there are other less visible deficits at the household level. The first pertains to the design and construction of on-site systems. These systems can be considered “safe” only if they fulfil certain criteria, and in certain conditions.(24) For example, in the case of pit latrines, minimum distances to sources of drinking water need to be maintained to avoid the possibility of water contamination. In the case of septic tanks, there must be soakaways/drain fields. Many of these on-site systems are also poorly constructed and are thus rendered unsafe, letting untreated excreta out into the environment.(25) Urban poor households are more likely to be affected by these problems, as it is often not possible to construct soakaways or maintain minimum distances in high-density settlements. In the whole waste cycle approach, the definition of access to adequate sanitation at household level needs to include safe emptying, collection and treatment services, which will be discussed further below.(26)
d. Differentials across urban centres
While the poor are most likely to suffer from inadequate sanitation within particular cities, the distribution of these deficits across cities is more complex. Cities in India are divided into classes according to their population, and allocation of public funding across these classes is often a matter of debate.
Table 2 indicates that 60 per cent of the urban population lives in million-plus and other Class I cities. The table also shows the distribution of open defecation households across these categories. Clearly, the smaller the city class, the higher the percentage of the population defecating in the open (Column 8). The shares in the overall open defecation numbers are more equally distributed across different class sizes (Column 9).
Distribution of open defecation households across cities by population
NOTES: HH = households. OD = open defecation.
Cities refer to administrative units as reported in the census, and not urban agglomerations. There might be slight discrepancies in the number of cities falling under each size class because the census house listing and housing tables have been used. This city class system is generally used in India for public programmes and planning.
SOURCES: Census of India (2011), Houselisting and Housing Census Data, available at http://www.censusindia.gov.in/2011census/hlo/HLO_Tables.html; and analysis presented in IIHS (2014b), Sustaining Policy Momentum: Urban Water Supply and Sanitation, Rockefeller Foundation Urban Policy Papers, Indian Institute for Human Settlements.
Public funding has often been directed to Class I cities, particularly million-plus cities, partly because of their visibility. However, increasingly, there has been a call to invest more in smaller cities with their huge service deficits. But whether to focus on Class I cities because they are home to most of India’s population, or on smaller cities because of the higher percentage of their deficits, may be a misleading dichotomy. As far as sanitation is concerned, attention needs to be given to all cities, expanding the current policy focus on million-plus cities to all cities. More recent analysis has also underlined the need for attention to sanitation in the large number of peri-urban settlements and large settlements classified as “rural” for a variety of reasons, but rapidly becoming part of the urban landscape in India.
e. Conveyance and treatment deficits
Urban India faces a tremendous shortfall in facilities for safe waste collection, conveyance and treatment – for both on-site systems and networked systems. There is limited data for waste collection and treatment – indeed this limited data remains one of the major concerns. Nevertheless, there are estimates for the extent of the deficits – for both on-site and networked systems – as discussed below.
Sewerage networks
As illustrated in Table 1, only one-third of the urban households are connected to a sewerage system. There is limited data on wastewater collection; however, one study estimates that only one-third of total wastewater generated is collected in Class I and Class II cities.(27) Only 300-odd cities in India are estimated to have a sewerage network in place. Another dataset, collected for a set of 1,400 cities, indicates that collection efficiency is merely 10 per cent.(28)
Sewerage networks, where they exist, are badly maintained: there are frequent blockages, siltation, missing manhole covers, and gully pits. There is hardly any preventive maintenance and repairs are made only in case of crises.(29) Often, storm water enters sewers, which are not designed to take these loads, leading to overflow onto the surrounding areas. Improper disposal of solid waste also tends to block sewer lines.
Table 3 also shows the distribution of households connected to a sewerage network, indicating that million-plus and Class I cities account for 85 per cent of sewerage networks. Another study estimates that metropolitan areas account for 70 per cent of the entire sewerage network in the country.(30) However, given the top-heavy urbanization structure, the share of households not connected to a sewerage network is similar across class size.
Distribution of sewered households across cities by population
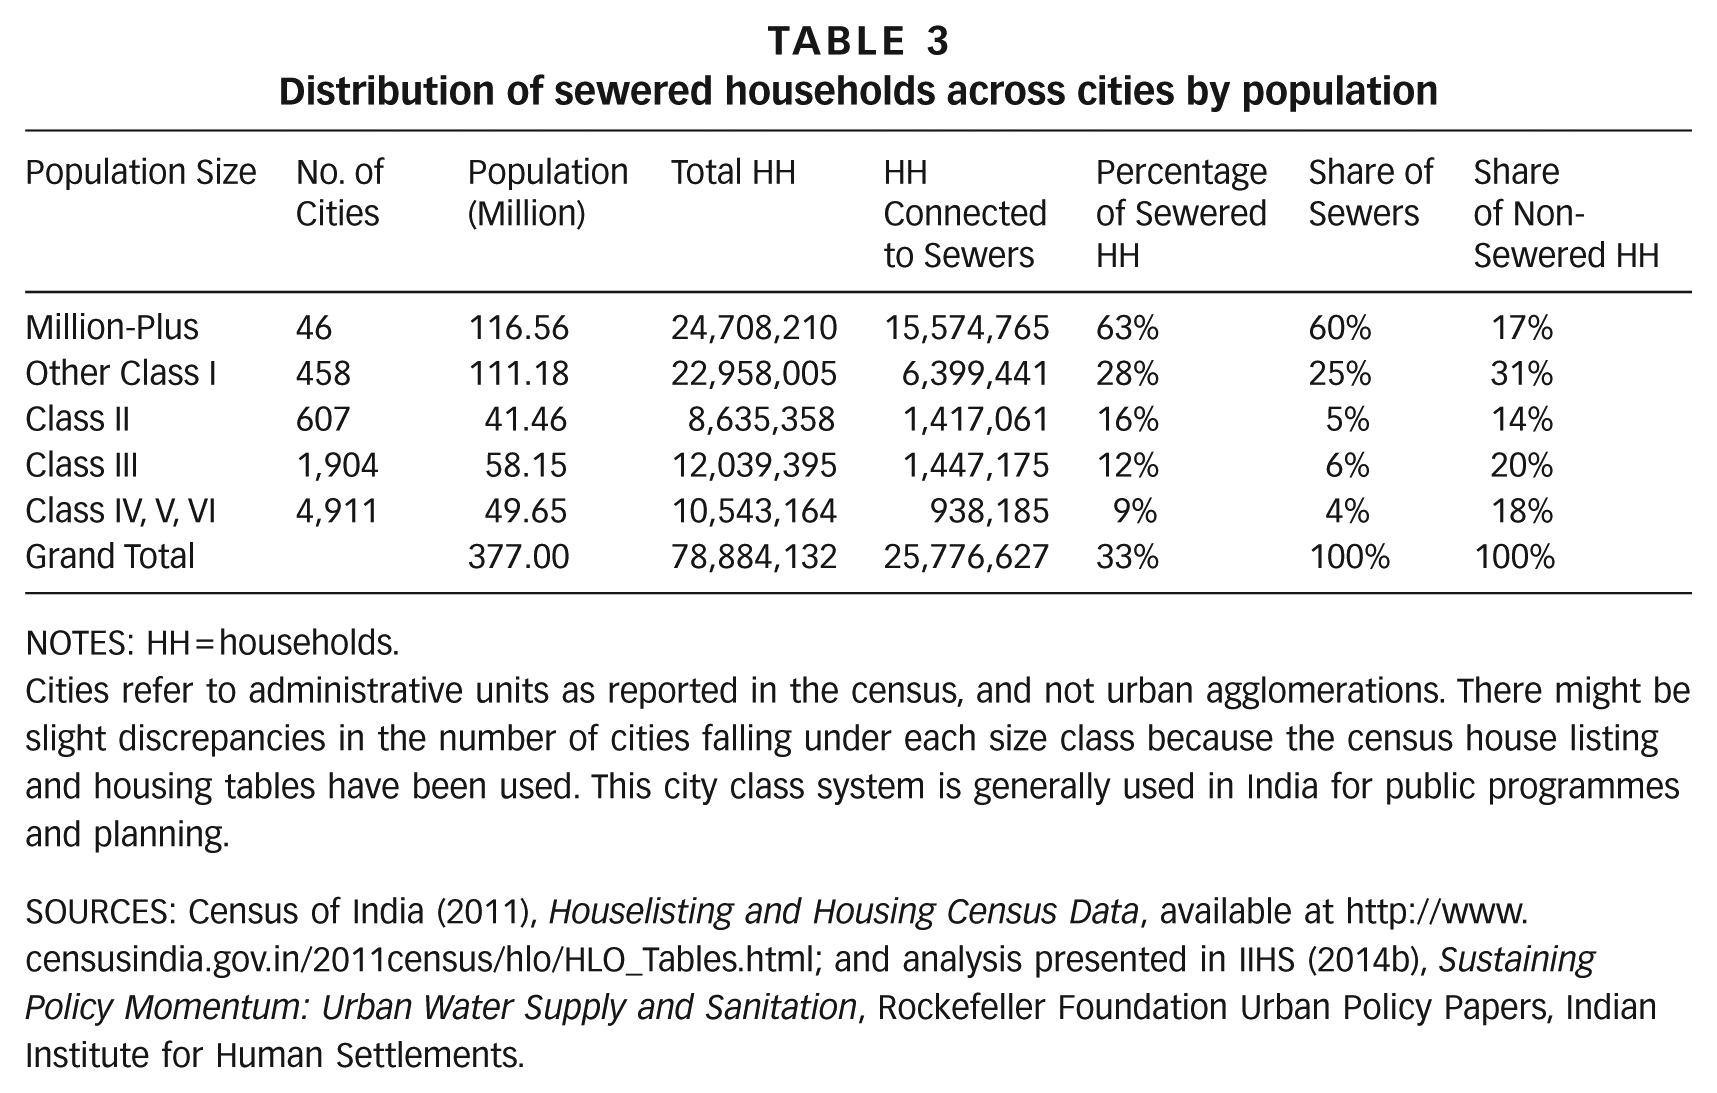
NOTES: HH = households.
Cities refer to administrative units as reported in the census, and not urban agglomerations. There might be slight discrepancies in the number of cities falling under each size class because the census house listing and housing tables have been used. This city class system is generally used in India for public programmes and planning.
SOURCES: Census of India (2011), Houselisting and Housing Census Data, available at http://www.censusindia.gov.in/2011census/hlo/HLO_Tables.html; and analysis presented in IIHS (2014b), Sustaining Policy Momentum: Urban Water Supply and Sanitation, Rockefeller Foundation Urban Policy Papers, Indian Institute for Human Settlements.
Deficits in wastewater treatment are even larger. In Class I and II cities, the existing treatment capacity stands at only 30 per cent of that required – 11,788 million litres for day (MLD) relative to wastewater generation of 38,255 MLD.(31) An inspection of 115 sewage treatment plants (STPs) found they were utilizing 72 per cent of their installed capacity;(32) thus effective treatment of wastewater could actually be as low as 22 per cent for Class I and Class II cities. Another dataset, including smaller towns, puts treatment capacity as low as 5 per cent.(33) In addition, conventional sewage treatment plants function inefficiently for a variety of reasons: lack of electricity, poor maintenance, and diversion of industrial wastewater to plants designed for domestic waste.
Most of the treatment capacity is in Class I cities. There are 211 treatment plants in Class I cities as compared to 31 in Class II cities and 26 in the remaining cities.(34) However, as with sewerage networks, the gaps seem equally distributed across class size.(35)
On-site systems
The situation is worse for on-site systems, both septic tanks and pit latrines. In the absence of soakaways, the effluent from most septic tanks is simply let out untreated into open drains.(36) The sludge is often collected manually, instead of with proper de-sludging equipment.(37) In some cases, households attempt to dissolve the sludge using chemicals to let it out into open drains.(38) In the case of pit latrines, the pits are supposed to be covered for a period of time, or are supposed to emptied – ensuring no direct contact between the faecal sludge and operator.(39) However, the faecal sludge is often manually removed. There are private players or honey-suckers (vacuum trucks) in some cities that offer emptying services, but little information is available for these.
In addition, there are virtually no facilities for treating faecal sludge.(40) In some cities, there are facilities alongside sewage treatment plants, but in most cases, the collected waste is dumped in the open without any treatment.(41) While some waste is collected safely, and treated, it is not possible to estimate the percentage.
Sewerage networks and STPs constitute the only form of public provisioning, and currently are a proxy for waste safely collected and treated. But only one-third of urban households are connected to a sewerage network, and treatment capacity exists only for 30 per cent of the wastewater generated. There are negligible facilities (for safe emptying, conveyance and treatment) for any kind of on-site systems. Meanwhile 10 million urban households still defecate in the open, another 2 million have access to unimproved sanitation, and another 5 million have access only to public toilets.
II. Priorities For Policy and Financing
The foregoing analysis suggests certain policy imperatives. First, policy needs to take cognizance of gaps in the entire waste cycle and to ensure they are addressed. Second, special attention needs to be paid to service provision to the urban poor. Third, the state needs to extend focus to all cities, irrespective of size. A key constraint to putting adequate sanitation systems in place is financing.
a. Financing requirements for urban sanitation
Figure 2 presents the three projections for required investments in sanitation. The first estimate, based on 2008 prices (US$ 1 = Indian rupees (INR) 44), was prepared by McKinsey Global Institute (MGI).(42) The second estimate was made by the High Powered Expert Committee (HPEC) on Urban Infrastructure, set up by the previous government to estimate investment requirements for the provision of urban infrastructure services over the next two decades, based on 2009 prices.(43) These estimates were prepared for 100 per cent sewer connectivity for all Indian cities. The third estimate, prepared by WSP, South Asia,(44) differs from others in two central aspects: it takes household investments into account, and it assumes a mix of different sanitation systems rather than sewerage only. If WSP estimates were to be reworked on the basis of using only sewerage systems, they would be still higher.
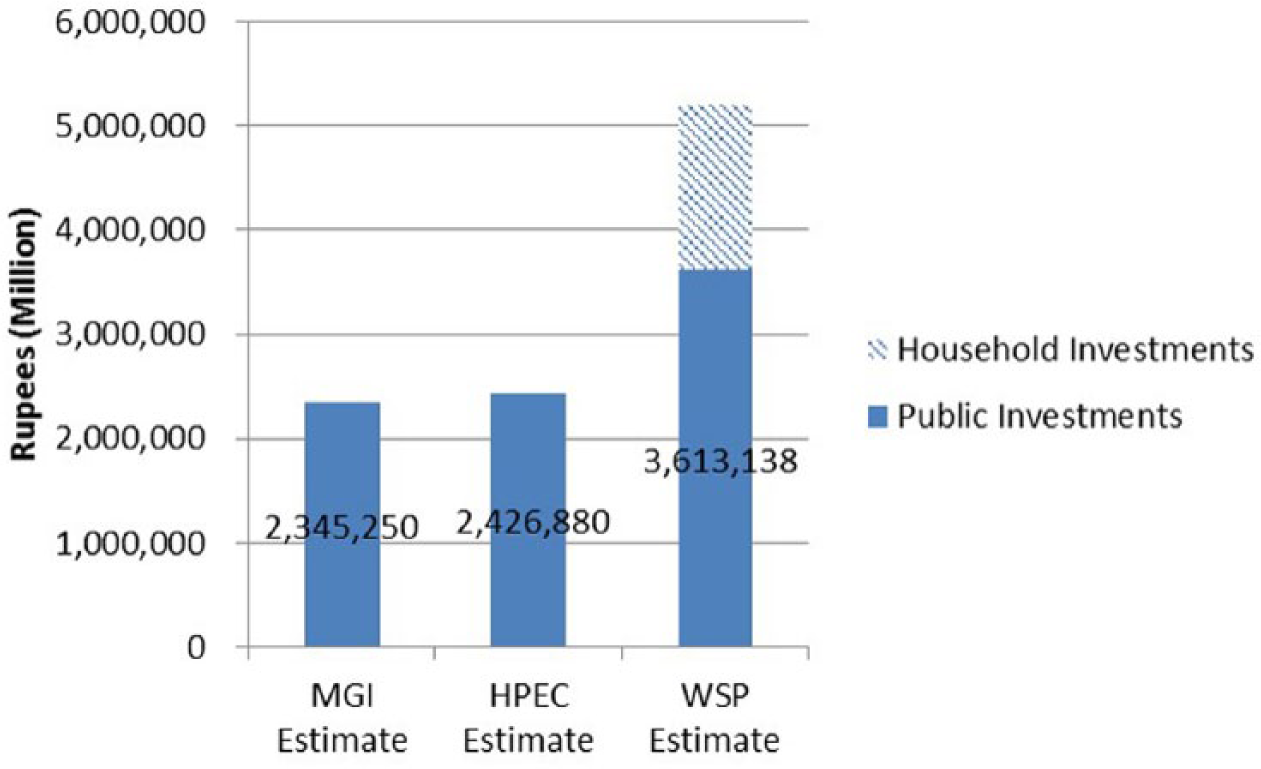
Estimated investments for urban sanitation in India
b. Previous investments and financing deficit
The estimates for urban sanitation range from approximately US$ 40,000 million to US$ 58,000 million,(45) around 10 to 15 times higher than sanitation investments (US$ 3,800 million) in the Jawaharlal Nehru National Urban Renewal Mission (JNNURM) (a recently concluded government programme discussed in later sections). JNNURM itself marked a significant increase in sanitation: its investments in sanitation over five years were equal to nearly half the investments made in both water and sanitation in the previous 55 years.(46)
Clearly, there is a severe financing deficit for urban sanitation. The existing policy discussions focus on removing this deficit by bringing in additional sources of funding. While additional funding is clearly needed in this sector, it might be prudent to re-examine the investment requirements, and assess whether these can be rationalized. One possible way the state can meet the deficits is by encouraging states and cities to examine and explore different technologies for safe conveyance and treatment.
c. Comparison of capital and operating costs for different technological systems
There are a few methodological issues in comparing costs of on-site sanitation systems and networked systems. First, the systems lend themselves to different units of analysis. The discrete units of on-site systems make costing per unit (or per household) easier. In the case of networked systems, costing is generally done per unit of length (usually km). In comparing these systems, the cost of networked systems is converted to per household costs by assuming a certain density of households. Second, in some analyses, only partial accounting is done: in the case of the on-site systems, the costs of conveyance and treatment are often not included. Conversely, in the cost of sewerage networks, the cost of the toilet is often not accounted for. For a meaningful comparison, all costs, whether public or household, need to be taken into account. The lack of comparable costs, both capital and operations & maintenance (O&M), remains one of the significant data gaps at the moment.
These difficulties apart, there is general agreement that on-site systems require less investment compared to sewerage networks. A study that compared on-site systems and the sewerage network in Senegal found that annualized capital costs for network systems were 10 times greater than for on-site systems.(47) The same study found that annual operating costs for sewer-based systems were 1.5 times higher than on-site systems.(48) One of the few studies that examined O&M costs in India found that per capita O&M costs for sewerage networks are anywhere between 1.3 and 3 times higher than for on-site systems.(49)
While overall costs of on-site systems are lower than for sewered networks, the household investment requirements for on-site systems, especially septic tanks, might be higher than for a household connected to a sewered network. In India, the combined cost of a water closet and sewerage connection was comparable to the cost of a pit latrine, and lower than the cost of a septic tank.(50) In one of the few studies that compare on-site systems with sewers, the household investments are found to be higher for on-site systems.(51) This conundrum of overall cheaper on-site systems requiring more investments from households has been experienced by NGOs in India. In a guidance note on community toilets for urban poor, SPARC clearly urges that these toilet blocks be attached to sewered networks as far as possible, because of the greater expense of building septic tanks.(52)
d. The imperative for faecal sludge management
Given the huge financing deficit in urban sanitation in India and the considerable investment required for sewerage systems, on-site systems offer one possible way forward to close at least a part of the sanitation deficit, even if this does imply higher costs for households. However, if on-site systems offer the best chance of addressing the deficits in India, then closer attention needs to be paid to all aspects, including awareness among households and effective and operational public systems. In short, appropriate faecal management systems need to be put in place.
Until recently, on-site systems were seen globally as informal, temporary solutions, and hence received little attention. However, there is gradual recognition that these can be permanent solutions, explored in an emerging body of work at the intersection of practice and research. The term increasingly being used is faecal sludge management, where faecal sludge refers to waste from any on-site sanitation system. A systems approach is often taken, asking that attention be paid to all aspects of every step in the sanitation chain, encompassing technology, management and planning perspectives.(53)
e. Access to water and sanitation for the urban poor
Putting effective faecal sludge management systems in place will enable more cities to close some of the collection, conveyance and treatment deficits. However, enabling access for the urban poor means addressing an additional set of issues. The concerns of the urban poor cannot be seen in isolation from city-level systems. It is important to ensure access not only to toilets, but also to facilities for safe conveyance and treatment.
Affordability
In the absence of public provisioning, the urban poor often construct toilets, drawing on their own savings. Cost remains a major concern.
While on-site sanitation systems are often purported to be cheaper, as discussed above they can require more investment from households, which often cannot afford even the waste removal costs. It is ironic that the poor should need to invest more than middle-income and rich households, many of them connected to sewerage networks typically subsidized through public investments. Policy needs to be cognizant of this additional burden on the urban poor.
If the poor spend more on the construction of individual toilets, then there is some case for redistribution of some funds from expensive city-level sewerage systems to assist poor households with the costs of their on-site systems, including access to safe removal facilities. Given the mixed records of toilet subsidies in rural India, however, this needs to be thought through carefully, and certainly needs to be demand led. Moreover, some public funding needs to be reserved for “soft” activities like communications and awareness generation.
Land ownership and tenure security
Land ownership and tenure security remain key challenges with regard to services for the poor, whether in the case of self- or public provisioning for toilets. Few studies explore access to sanitation facilities across the range of the tenure continuum. One study that explores this in detail found that in the case of self-provisioning, security of tenure matters more than legal status per se, while in the case of government provisioning a clear legal status was more important.(54)
In India, slum improvement programmes have been limited to slums with clear legal status. Delinking public provisioning from legal status has been proposed as a way to close the sanitation deficit. But security of tenure is also important. Many poor households construct individual toilets with their own investments,(55) and experience has shown that they are more likely to invest in improving their living conditions if they have secure tenure.(56) Thus, there is need both for government to extend service to urban poor households, irrespective of land ownership, and to enable self-provisioning by providing tenure security through appropriate methods.
Space constraints
Space constraints, particularly in metropolitan areas, can get in the way of access to individual toilets for the urban poor. Community toilets are often seen as a solution when there are severe space constraints or where the issue of tenure security cannot be solved easily.(57) These facilities can be located on private or public land, provided by public utilities or run in private–public partnership mode. However, they face a range of problems, the most prominent being lack of proper maintenance.(58) In addition, these toilets need to be financially sustainable, whether funded by the public utilities or with operating costs met by user fees, in the form of either a monthly pass or pay-per-use. Policy needs to address the critical concerns of tenure security, affordability and space constraints in order to meet this challenge of ensuring access for the poor.
To summarize, the policy priorities are: addressing deficits in the entire waste cycle, expanding focus to all cities, putting faecal sludge management systems in place, and addressing the needs of the urban poor – particularly the issues of tenure security and cost sharing. While it is not possible to treat these concerns in this paper, it needs to be highlighted here that concerns of institutional strengthening and capacity building remain central to the challenge. The next section provides an overview of the current policy framework in India, and identifies how far it has moved on the above fronts.
III. National Policy Frame in India:(59) Understanding Key Shifts
a. Importance of the national policy framework
Urban water and sanitation were designated as state responsibilities in the Indian constitution.(60) The mandate for these services shifted to local governments after the 74th Constitutional Amendment Act was enacted.(61) Thus, according to the current legislative framework, the national government has little apparent role in matters of urban sanitation.
In reality, the national government has tremendous influence on this “sector”. It has hitherto provided the bulk of the capital investments in urban sanitation(62) through various programmes, the design of which has had considerable impact on the nature and direction of the investments. In addition, projects are approved on the basis of technical specifications designed at the national level. This is not to say that the roles of the state and local government are not important – but their actions are highly influenced by national-level policies and programmes.
Until a decade ago, there were three types of programmes/investments in urban sanitation. The first were centrally sponsored programmes for improving urban water and sanitation. The bulk of these investments (estimated at about US$ 8,300 million) was directed to water supply schemes; investments in sanitation were mostly for sewerage networks and sewage treatment plants.(63) The second stream of investments came from the massive river cleaning programmes launched in the 1980s; their urban component included construction of sewage treatment plants in riverside towns. The third stream of investments was through various slum upgrading and social welfare programmes targeted at the urban poor. The sanitation component in these programmes was provisioning of individual or community toilets, either pit latrines or septic tanks.(64)
Most of these investments were driven by programme specificities and not guided by any policy. The last decade, however, has seen a spate of different initiatives at the national level. These can be divided into three kinds: policies and advisories, programmes and investments, and data/information initiatives. The rest of this section outlines some of these key initiatives, and assesses how far they meet the priorities laid out above. In particular, it focuses on the National Urban Sanitation Policy (NUSP) and the Jawaharlal Nehru National Urban Renewal Mission (JNNURM) as the most significant.
b. JNNURM
Recognizing the huge infrastructure deficits in Indian cities, the government of India launched JNNURM in late 2005. The programme was meant to infuse capital for infrastructure into select Indian cities as well as initiating a set of urban reforms.
The mission focused on 65 selected cities (mostly million-plus), and included two sub-missions: Urban Infrastructure and Governance (UIG), which focused on infrastructure; and Basic Services for the Urban Poor (BSUP), with a focus on shelter for the urban poor. For all other medium and small towns in the country, the Urban Infrastructure Development Scheme for Small and Medium Towns (UIDSSMT) and the Integrated Housing and Slum Development Programme (IHSDP) were launched with focus areas mirroring those of UIG and BSUP respectively.
As seen in Figure 3A, a large chunk (71 per cent) of the investments went primarily to the million-plus or other mission cities. In UIG, sanitation projects received 24 per cent (US$ 2,550 million) of the funding;(65) under UIDSSMT, sanitation projects accounted for 29 per cent (US$ 1,295 million).(66)
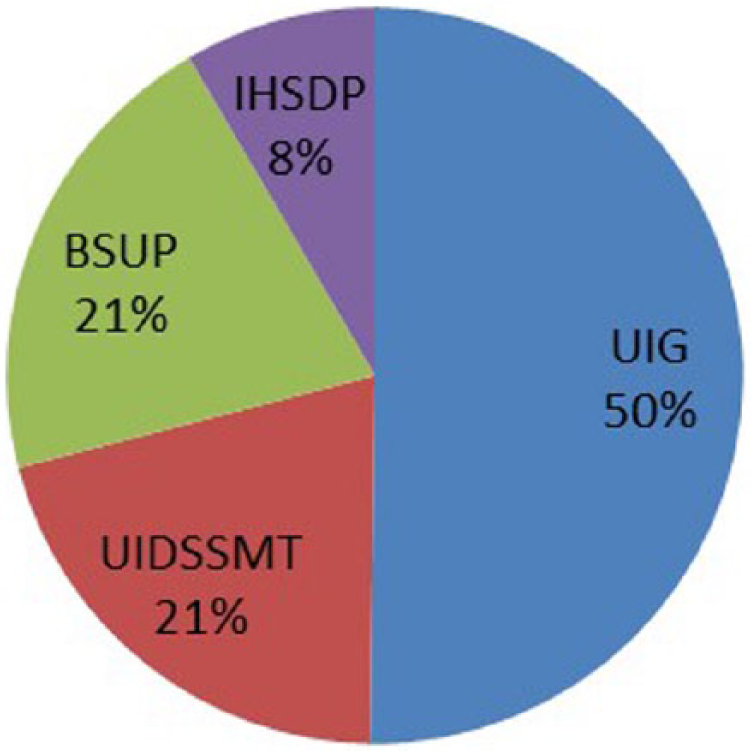
Approved costs across sub-missions
Figure 3B represents the distribution of the investments in sanitation across different kinds of projects for UIG. Sanitation investment went to expansion or retrofitting of sewerage networks, and there is little evidence of funds going to faecal sludge management. Only 6 per cent of the funds went to construction of STPs.
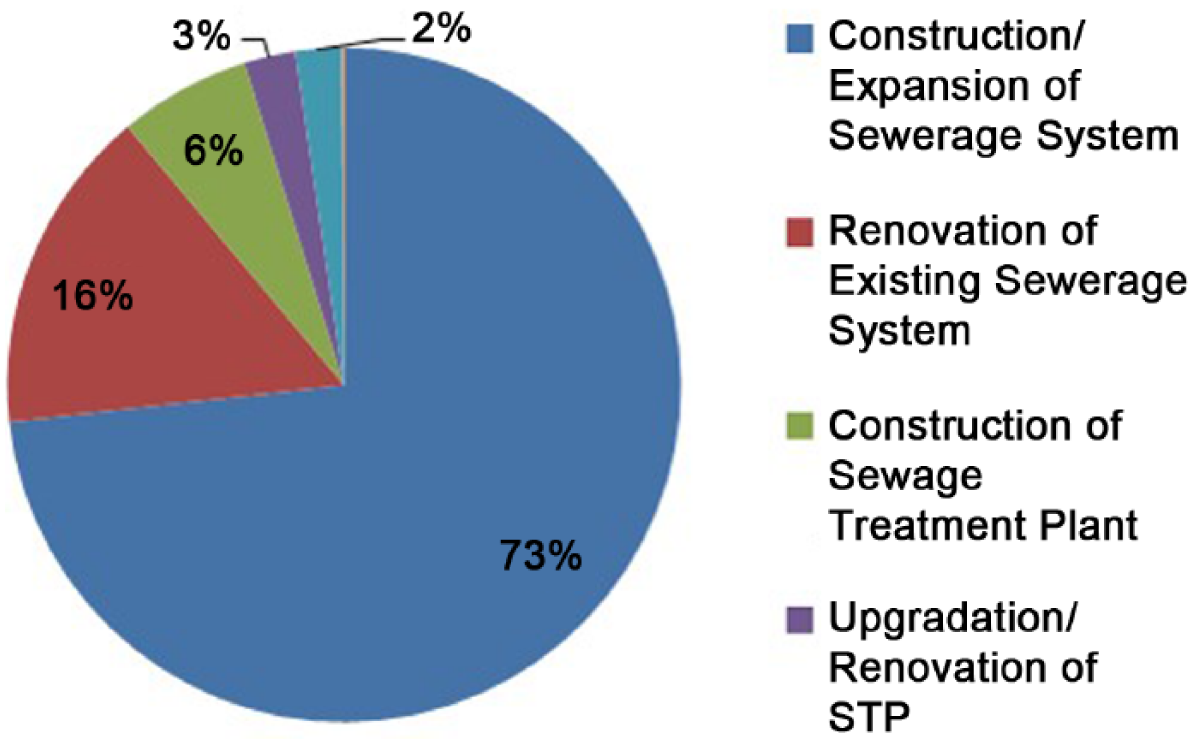
Distribution of investments in sanitation sector across different types of projects
While there was a dedicated fund for the urban poor, it was limited to one-third of the investments. Moreover, most of this funding went to low-cost housing, as opposed to reaching out to larger numbers of urban poor through a range of slum upgrading programmes.
JNNURM was designed to enable cities to develop their own priorities on the basis of city-wide planning, and the mission cities were required to submit a City Development Plan before they could access funds. However, most City Development Plans show remarkable similarities in priorities and kinds of projects selected across sectors.(67) While this similarity could be attributed to many factors, one possible constraint could have been that the projects had to be prepared in accordance with Central Public Health and Environmental Engineering Organisation (CPHEEO) manuals(68) – and these listed only sewerage systems, leaving little scope for other technological options.
Thus, most investment in urban sanitation in the last decade was directed to networked systems in larger cities. There is little evidence of cities adopting the whole wastewater approach.
c. NUSP
The National Urban Sanitation Policy was launched in 2008. It is remarkable that a policy was actually formulated for urban sanitation, given that there is no matching policy for urban water supply. Along with Indonesia’s Sanitation Sector Improvement Programme, the NUSP is one of the few initiatives that has established a broad enabling environment for urban sanitation.(69)
The NUSP has several significant features, most of which point to new directions for urban sanitation in India. It recognizes the importance of the entire waste cycle, as well as open defecation free cities, and 100 per cent collection and treatment of waste are explicitly laid out as goals. In a remarkable departure from earlier initiatives, it promotes no particular technological solutions, instead encouraging all kinds of solutions. It also underlines the importance of operation and maintenance of all sanitary installations and facilities. Realizing the vast differences in the cities, it recommends that each state in India prepare a state sanitation strategy, and each city prepare a city sanitation plan.
The NUSP also places the needs of the urban poor right at the centre, highlighting the constraints that might limit their access – legal status, affordability and space constraints. It calls for the urban poor to be provided with sanitation facilities, irrespective of the legal status, and for delinking tenure from service provision.
The NUSP addresses most of the priorities laid out in this paper. The biggest policy drawback is the absence of dedicated funding. It has had minimal impact on the nature of JNNURM investments, since the launch/design of JNNURM preceded the NUSP. However, other initiatives have been launched as a result of the NUSP. A rollout of state urban strategies and city sanitation plans,(70) as well as some of the initiatives listed below, can at least partly be attributed to the NUSP.
d. Other initiatives
The government of India has issued a Septage Management Advisory, which highlights that septage management is an “area of neglect” and needs greater attention.(71) It identifies the following problems: insufficient knowledge and public involvement, inappropriate design and selection process, poor operation and management, and poor inspection and monitoring. It also highlights the components that need to be put in place.
The CPHEEO manuals, the basis of technical approvals for public projects, have been substantially revised.(72) They now recognize various on-site systems as safe, and provide comprehensive guidance for design and construction. In addition, two data collection initiatives, the Service Level Benchmarking and National Sanitation Rating, aim to close some of the data gaps.(73)
The initiatives listed were launched by the previous government, and the current government is rolling out its programmes. Under the Swachh Bharat Mission, a massive media campaign around sanitation has been launched, with advertisements in printed and audio-visual media, and a substantial presence in social media. It would not be amiss to say that sanitation has never occupied such a key place in the public imagination in India. In addition to government finance, the government plans to enlist corporate funding through various Corporate Social Responsibility (CSR) initiatives. Yet “toilets” remain the central attention of this attention. While details of the Swachh Bharat Mission and other government programmes are yet to be released, the early indications are that there will be a limited move from toilets to the whole wastewater cycle.
IV. Conclusions
While the recent attention to sanitation in both media and policy circles is a welcome step, there is an urgent need to expand attention to the whole wastewater cycle to achieve public health outcomes. This implies paying attention not only to wastewater conveyance and treatment, but also to less visible concerns like poor construction of on-site systems and lack of operations and maintenance. Given the scale of deficits (in both sanitation and finance), it is important to find solutions that will enable access for the maximum number of households, and also enable more cities to put in suitable systems of conveyance and treatment. This paper has argued that putting appropriate faecal sludge management systems in place is a promising way ahead. Further, there is a need to understand that the access of the urban poor is critical not only for them, but to achieve the objective of city-wide sanitation. Sanitation is a public good, the benefits of which will accrue only if everyone has access to sanitation services. Provisioning of services to the urban poor posits a vexed set of challenges like tenure security, which go beyond financing.
Finally, there have been considerable initiatives in India to tackle the urban sanitation problem. While most of these efforts hold promise, more needs to be done. Specifically, as the new government in India launches its new urban programmes, it is essential to take the above priorities into consideration.
Footnotes
Acknowledgements
The author would like to thank Vishnu M J for his research assistance.
1.
The focus of this paper is on human excreta management and related practices. Water supply has been included in analysis when relevant. Solid waste management and drainage are important aspects of urban environmental services impacting public health, but are not dealt with in this paper.
2.
These comments have been made for all of India – including rural India.
3.
BJP (2014), Election Manifesto 2014, available at http://www.bjp.org/images/pdf_2014/full_manifesto_english_07.04.2014.pdf; also INC (2014), Your Voice, Our Pledge: Lok Sabha Elections 2014 Manifesto, available at ![]() .
.
4.
5.
See reference 4.
6.
Eisenberg, J N, J C Scott and T Porco (2007), “Integrating disease control strategies: balancing water sanitation and hygiene interventions to reduce diarrheal disease burden”, American Journal of Public Health Vol 97, No 5, pages 846–852.
7.
8.
Carr, R (2001), “Excreta-related infections and the role of sanitation in the control of transmission”, in L Fewtrell and J Bartram (editors), Water Quality: Guidelines, Standards and Health, World Health Organization/IWA Publishing, London, pages 89–114.
9.
See reference 7.
10.
Andres, L A, B Briceño, C Chase and J A Echenique (2014), Sanitation and externalities: evidence from early childhood health in rural India, World Bank Policy Research Working Papers.
11.
See reference 6.
12.
WHO/UNICEF (2000), Global Water Supply and Sanitation Assessment: 2000 Report, World Health Organization, Geneva. According to the WHO-UNICEF Joint Monitoring Programme, the following are considered as “improved sanitation”: flush toilet, piped sewer system, septic tank, flush/pour flush to pit latrine, ventilated improved pit (VIP) latrine, pit latrine with slab and composting toilet. Shared or public toilets are not included in the definition of improved sanitation (![]() ).
).
13.
Toubkiss, J (2006), “Costing MDG Target 10 on water supply and sanitation: comparative analysis obstacles and recommendations”, Costing MDG Target 10 on water supply and sanitation: comparative analysis obstacles and recommendations, World Water Council.
14.
Census of India (2011), Houselisting and Housing Census Data, available at ![]() . There are no official estimates for access to water through a public utility. However, based on the definition in the Census of India figures, the percentage for treated tap water can be taken as a proxy for municipal water supply.
. There are no official estimates for access to water through a public utility. However, based on the definition in the Census of India figures, the percentage for treated tap water can be taken as a proxy for municipal water supply.
15.
16.
See for example World Bank (2006), Water Supply and Sanitation: Bridging the Gap between Infrastructure and Service, India Country Team, Energy and Infrastructure Department, South Asia Region, World Bank, New Delhi; also Bangalore Water Supply and Sewage Board/AusAID (2002), Baseline Socio-Economic Survey Report, IMRB International/Bangalore Water Supply and Environmental Sanitation Master Plan Project (BWSESMP), Bangalore; IIHS (2014a), Future Proofing Indian Cities: Bangalore Action Plan for Green-Blue Infrastructure, Future Proofing Indian Cities, Indian Institute for Human Settlements; and Grönwall, J T, M Mulenga, and G McGranahan (2010), Groundwater, self-supply and poor urban dwellers: A review with case studies of Bangalore and Lusaka, International Institute for Environment and Development.
17.
While there are only a few systematic studies that examine water contamination at the household level, there is sufficient newspaper reportage that confirms this issue. In addition, there is evidence at least for some Indian cities that groundwater aquifers in urban areas are polluted. See for example Asadi, S S, P Vuppala and M A Reddy (2007), “Remote Sensing and GIS Techniques for Evaluation of Groundwater Quality in Municipal Corporation of Hyderabad (Zone-V), India”, International Journal of Environmental Research and Public Health Vol 4, No 1, pages 45–52; also Jat, M K, D Khare and P Garg (2009), “Urbanization and its impact on groundwater: a remote sensing and GIS-based assessment approach”, The Environmentalist Vol 29, No 1, pages 17–32; Pandit, M, V Bhardwaj and N Pareek (2009), “Urbanization impact on hydrogeological regime in Jaipur Urban Block: a rapidly growing urban center in NW India”, The Environmentalist Vol 29, No 4, pages 341–347; Rahman, A (2008), “A GIS based DRASTIC model for assessing groundwater vulnerability in shallow aquifer in Aligarh, India”, Applied Geography Vol 28, No 1, pages 32–53; and Hunse, T M, M A Farookh and H Jayaprakash (2011), “Hydrogeological Mapping of Bangalore City”, in S Das (editor), Bengaluru - Water problems of the fastest growing city in India, Geological Society of India, Bangalore.
18.
See for example Kumar, C (2014), “Contaminated water proves a quiet killer”, Times of India, 24 January, available at http://timesofindia.indiatimes.com/city/bangalore/Contaminated-water-proves-a-quiet-killer/articleshow/29268087.cms; also Sharma, N (2014), “Sector 19 residents still wary of water supply”, Times of India, 4 September, available at ![]() .
.
19.
For water purifiers, http://www.techsciresearch.com/1361, accessed November 2014. For the bottled water industry, ![]() , accessed November 2014.
, accessed November 2014.
20.
21.
22.
See reference 20.
23.
Agarwal, S and S Taneja (2005), “All slums are not equal: child health conditions among the urban poor”, Indian Pediatrics Vol 42, No 3, pages 233–244.
25.
WSP-TARU (2008), Review of Sewerage and Sanitation Interventions in Urban India, Water and Sanitation Program-South Asia, New Delhi; also ![]() , Advisory Note on Septage Management in Indian Cities, Ministry of Urban Development, New Delhi.
, Advisory Note on Septage Management in Indian Cities, Ministry of Urban Development, New Delhi.
26.
27.
28.
See reference 15.
30.
Narain, S (2012), Excreta Matters - SOE 7 (Vol. 1), Center for Science and Environment, New Delhi.
31.
33.
See reference 15.
34.
35.
Treatment gaps are calculated based on the difference between wastewater generated (assuming water supply of 135 litres per capita per day, as well as 80 per cent conversion to wastewater) and existing treatment capacities.
36.
See reference 25, WSP-TARU (2008); also AECOM International Development, Inc./Department of Water and Sanitation in Developing Countries (2010), A Rapid Assessment of Septage Management in Asia: Policies and Practices in India, Indonesia, Malaysia, the Philippines, Sri Lanka, Thailand, and Vietnam, USAID, Washington, DC; and ![]() , Urban Water and Sanitation in Maharashtra, All India Institute of Local Self Government, Mumbai.
, Urban Water and Sanitation in Maharashtra, All India Institute of Local Self Government, Mumbai.
39.
See reference 24.
40.
There is a wide variety of terms used to describe wastes from on-site systems. Increasingly, the term faecal sludge is being used to denote waste collected from any on-site system (whether septic tanks or pit latrines).
41.
See reference 25, WSP-TARU (2008); also see reference 36, AECOM International Development, Inc. (2010); and reference 36, ![]() .
.
42.
43.
44.
45.
See reference 42; also see reference 43; and reference 44.
47.
Dodane, P-H, M Mbéguéré, O Sow and L Strande (2012), “Capital and Operating Costs of Full-Scale Fecal Sludge Management and Wastewater Treatment Systems in Dakar, Senegal”, Environmental Science & Technology Vol 46, No 7, pages 3705–3711, doi: 10.1021/es2045234.
48.
See reference 47.
49.
Mathur, M P, R Chandra, S Singh and B Chattopadhyaya (2007), Norms and Standards of Municipal Basic Services in India, NIUA Working Paper Series, National Institute of Urban Affairs, New Delhi.
50.
See reference 44.
51.
See reference 47.
52.
53.
Strande, L, M Ronteltap and D Brdjanovic (editors) (2014), Faecal Sludge Management: Systems Approach for Implementation and Operation, IWA Publishing, London.
54.
Scott, P (2011), Unbundling tenure issues for urban sanitation development, Doctor of Philosophy thesis, Loughborough University.
55.
Evans, B, L Haller and G Hutton (2004), Closing the sanitation gap: the case for better public funding of sanitation and hygiene, Background paper for Round Table on Sustainable Development, 10 March, Organisation for Economic Co-operation and Development, Paris.
56.
Mahadevia, D (2011), Tenure Security and Urban Social Protection in India, Centre for Social Protection Research Report 05.
57.
Patel, Sheela and the SPARC team (2015), “The 20-year sanitation partnership partnership of Mumbai and the Indian Alliance”, Environment and Urbanization Vol 27, No 1, pages 55–72.
58.
59.
All the policies and initiatives were launched by the previous government. There has been a change of government in India recently. While details of new programmes are still being finalized, and rollout of programmes is yet to begin, the analysis presented in this section is likely to remain relevant.
60.
Under the Indian constitution, legislative subjects and the respective competence of the union and the states are arranged according to the three lists: List I (“Union List” containing entries for parliamentary legislation and central authority), List II (or the “State List” containing entries that are matters of state legislation and state authority) and List III (“Concurrent List”, over which both the union and states have authority and which can be legislated by both legislatures).
65.
MoUD (2014a), Sector Wise Details of Projects Sanctioned under JnNURM (UIG), Ministry of Urban Development, New Delhi, accessed September 2014 at ![]() .
.
66.
67.
Wankhade, K (2012), JNNURM: An Opportunity for Sustainable Urbanisation, Indian Institute for Human Settlements.
68.
These manuals have since been revised.
69.
See reference 26.
70.
As of August 2014, 16 states have prepared state urban sanitation strategies, and 73 cities have submitted their city sanitation plans. See MoUD (2014c), Draft State Sanitation Strategies-SSS, Ministry of Urban Development, New Delhi, available at http://moud.gov.in/sites/upload_files/moud/files/List_Of_SSS_Cities.pdf; also MoUD (2014d), List of CSP Cities, Ministry of Urban Development, New Delhi, available at ![]() .
.
73.
MoUD (2010), Improving urban services through Service Level Benchmarking, Ministry of Urban Development, New Delhi; also ![]() , FAQ on City Sanitation Ratings, New Delhi.
, FAQ on City Sanitation Ratings, New Delhi.