
Abstract
Low adhesion between wheel and rail can be caused by autumn leaf fall, reacting and adhering with the steel, resulting in signals passed at danger, station overruns or in worst cases derailments and collisions. Various methods to remove this layer or increase friction have been developed including water jetting, abrasive cleaning, traction gels and chemical treatments, new interventions are trialled each year. However, representative low friction conditions are difficult to generate repeatedly and measure, as such the efficacy of these interventions remains difficult to establish. Twenty years ago British Rail Research stated “Paradoxically it has been the lack of low adhesion that has hindered the development of low adhesion remedies”. This still remains largely true today. In this paper a method is proposed to form a representative organic layer, by placing powdered leaf material on the railhead and rolling with a vehicle until it has blackened and bonded to the underlying steel. The layers were visually inspected using industry guidelines and their friction was measured using the new Rivelin Rail PRT300 tribometer. The method was found to be capable of reliably producing contamination levels from light to heavy as required for testing by varying the quantity of leaves added. Friction coefficients for medium and heavily contaminated rails were all below 0.05, these would typically be described as ultra-low adhesion. As an illustration of the method, a trial of a new (anonymised) railhead cleaning technique is included in this work as a case study. The layer formation and measurement methodology proposed could be adopted by the wider rail industry to provide a more data-driven approach to understanding friction enhancer and railhead cleaning technology performance, through optimising current treatments and assessing the performance of novel technology.
Keywords
Introduction
Autumnal leaf fall causes leaves to be deposited directly on the railhead or be picked up and re-deposited by airflow caused by vehicle passage. This organic material reacts and bonds to the railhead to form a black layer which causes ultra-low friction conditions when wetted.1–3
The investigation report of a recent collision between passenger trains in Salisbury, UK, stated “The level of wheel/rail adhesion was very low due to leaf contamination on the railhead, and had been made worse by a band of drizzle that occurred immediately before the passage of train”. 4 A recommendation was made to the Rail Delivery Group in consultation with train operators and the Rail Safety and Standards Board regarding the review of technologies other than sanding systems and wheel slide protection to improve braking in low adhesion conditions.
Friction enhancing products5,6 or rail cleaning methods have attempted to mitigate this issue for decades. Some are train-borne such as high pressure water jetting and others are applied wayside; such as traction gels which are solid particles suspended in a gel. 7 Manual cleaning is also carried out, either from vehicle based scrubbers or petrol powered hand pushed devices. Chemical treatments such as citric based cleaners, acid or enzymes have also been used or trialled.
On the GB network, over £64 million/year is spent on improving friction 8 using these various techniques and yet there is very little quantitative evidence on their performance which means strategies can be divisive, certain methods are deemed effective on some routes but not others through anecdotal evidence.
Current methods require optimisation; for instance, assessing the extent of low friction that requires cleaning, the number of traction gel applicators (TGA’s) required and the carry-down of product, or the volume of chemical cleaner required. Novel friction enhancing products are being developed,7,9 but despite the large costs and complexities in developing and trialling these, it is difficult to quantify their effectiveness.
Two major obstacles slow down this optimisation and innovation; the ability to simulate representative and repeatable low adhesion at test sites and the lack of measuring equipment to quantify improvements in wheel/rail friction.
Access to operational rail can be difficult during innovation projects due to expense, complexity and safety so heritage lines or closed loop test centres are often preferred. These may not have the tree cover or traffic density for operational leaf layer formation, so a convenient method to form a reproduceable layer during trials is required. The requirement for repeatable test track simulation was described by British Rail Research in the 1970’s: “The statistical chance of adhesion being low during the passage of a train is small …Paradoxically it has been the lack of low adhesion that has hindered the development of low adhesion remedies”. 5
The formation and bonding of leaf layers is dependent on a range of environmental conditions, such as water content (present in organic material or precipitation, humidity or dew), temperature and the presence of other third body materials such as iron oxides. Contact conditions also play a role, such as the number of wheel passes, increased creepage under braking or traction, or axle load.10–12 The leaf type, as well as quantity, also play a role. 13
The number of variables affecting formation and bonding has made representative simulation difficult, without a reliable method several researchers have used more convenient contaminants as analogues. Paper tape, designed for parcel packing has been used, because it is relatively quick to lay, and it provides a physical layer to remove. The layer produces low friction conditions due to the gummed surface which is similar to that found on an envelope. 14 Dried, whole leaves represent a closer analogue, however their application is slow and the resulting layers are variable in practice. 15
Other low friction producing liquids may be used to assess braking systems, but these do not bond or behave like a leaf layer and the optimal cleaning mechanism is likely different, BRR stated “Low wheel/rail adhesion can be produced by treating the track with liquids such as oil or detergent. The unnatural conditioning of the railhead by these fluids, renders them virtually useless for the assessment of low adhesion remedies”. 16
Lack of appropriate measurement equipment has also hampered progress. Assessment methods using whole trains, such as braking trials and on train friction measurement systems are often prohibitively expensive as well as being open to influences from driver behaviour, vehicle speed, and WSP activation.15,16
Assessing the benefits of friction management via in-direct indicators alone, such as Key Performance Indicators can be complex and prone to errors due to the number of variables involved. For instance, inconsistent weather conditions and leaf fall, changes in driving styles and the impact of other mitigation methods used can all cause changes in delay minutes, station overruns and signals passed at danger (SPADs).
Portable friction measuring devices (tribometers) provide an efficient and low cost solution. They can provide more controlled test conditions than braking trials. However, previous rail-specific devices have been designed for measuring oil/grease lubricated conditions and have not been able to measure low friction conditions due to leaf layers, even with the vehicle experiencing visible wheel slip or slide.
17
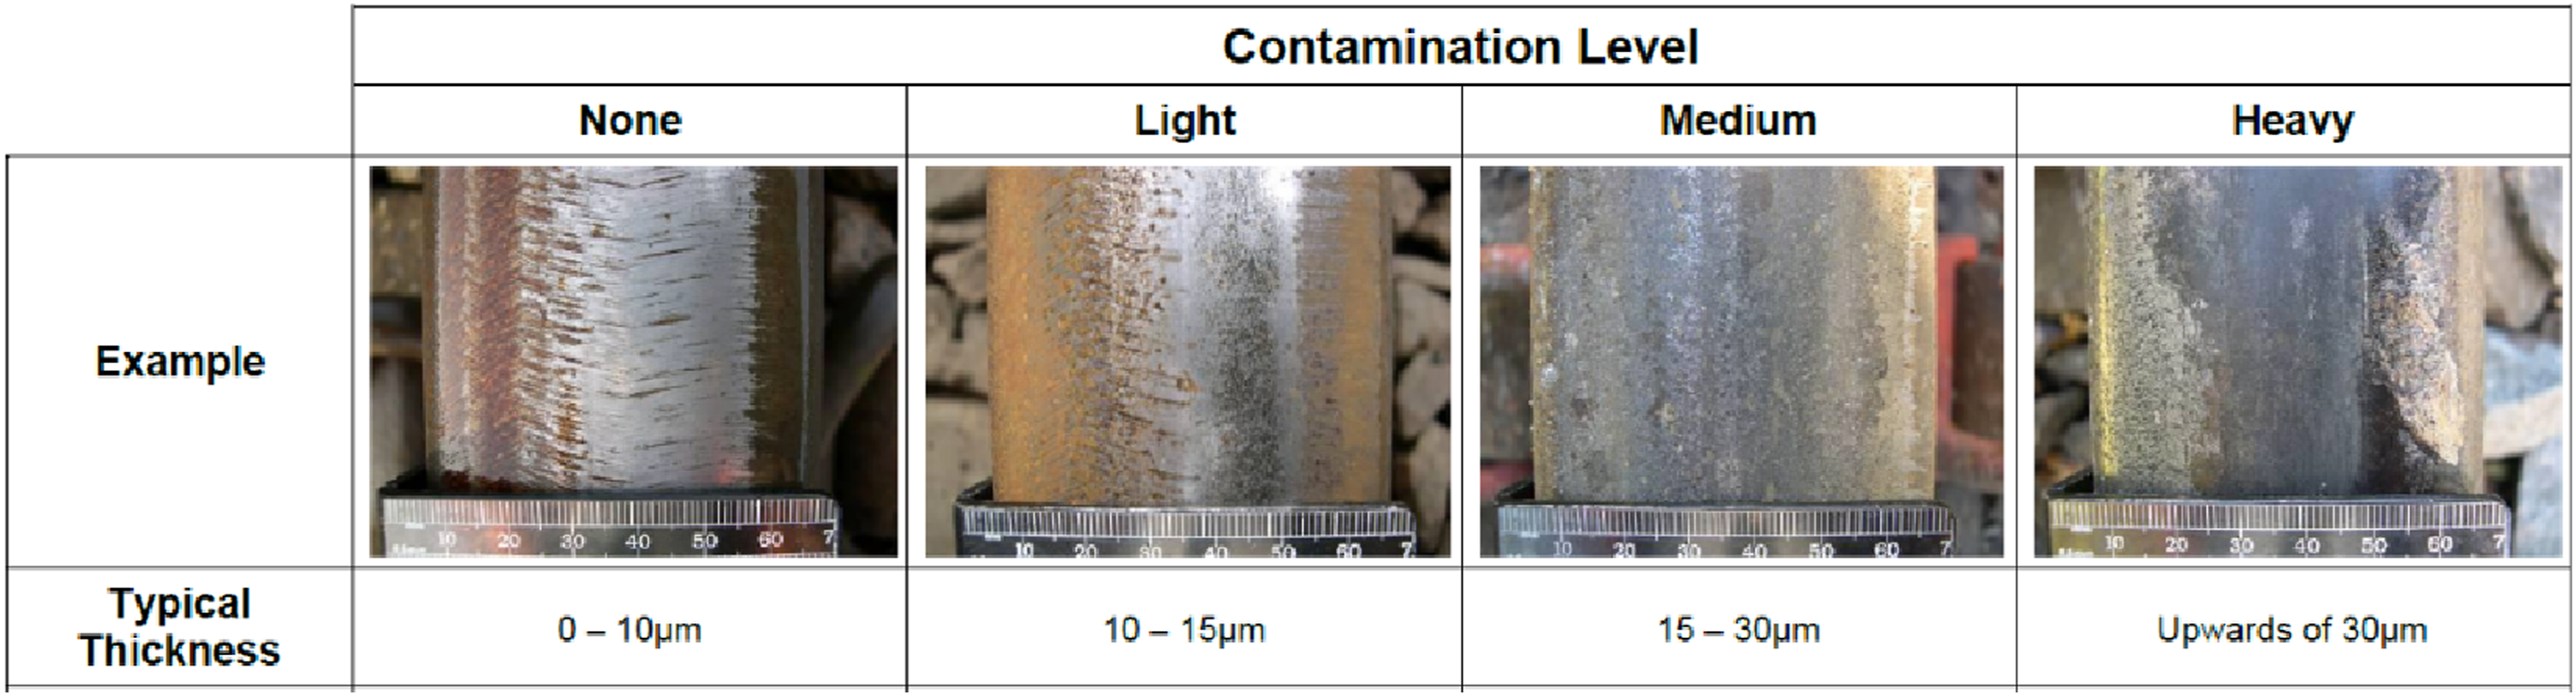
Due to the lack of suitable friction measuring devices, proxy measurements are used by the rail industry during rail inspections. Eddy current layer thickness measurements are an example of this, with a screenshot from a rail inspection training manual shown in Figure 1.
18
This is difficult to average when measuring “patchy” leaf layers and very thin films of contamination have been shown to produce very low friction conditions. Designated contamination levels (lower) for leaf layer thickness, determined by Network Rail (Eddy Current Training Brief, Network Rail, 2010
18
).
This work aims to tackle these two barriers by proposing a methodology which can be carried out year-round to form a representative organic layer which is adhered to the railhead. The layer produces measurable low friction so that the effectiveness of a mitigation strategy can be quantified. Friction measurements are carried out using the Rivelin Rail portable tribometer and any change in friction after rail treatment can be measured.
The leaf layer formation method is described in the methodology, with results compared against leaf layers formed during normal network operation. Any changes in method required due to the inevitable variance in environmental and contact conditions are highlighted. A case study, using the proposed methodology to assess the performance of a new rail cleaning product, is shown in the subsequent case study. Layer formation and friction, alongside railhead imaging and layer thickness data, was used to quantify cleaning performance.
Methodology
Railhead conditioning
Railhead conditioning was carried out to create a representative level of leaf contamination that would produce low friction conditions and require cleaning during the autumn season. A leaf layer formation method was used, developed through a combination of previous field trials and small and full scale laboratory tests.15,19,20
The method was developed on a heritage line, which often has a visibly thicker railhead iron oxide layer than is found on regularly used rail. To remove the oxide layer, the railhead was lightly sanded with a sanding star drill attachment to expose the bare steel (example in Figure 3) and allow quicker reaction with leaf material. Blended, naturally fallen, Sycamore leaves (approximately 3 mm size pieces) were then placed on the railhead by hand. This was repeated with both freshly fallen, frozen (in plastic bags) and air-dried leaves. The additional moisture content in freshly fallen or frozen leaves more rapidly bonded with the steel substrate than the air-dried leaves (which required additional water spraying), but all could be used with this methodology.
A vehicle (in this case a Class 142 Pacer and a Class 33 were both used) was rolled over the leaf layer at approximately 10 mph between two and eight times. This blackened the leaf layer and caused it to bond with the steel. This process is shown in Figure 2. The variance in number of rolls with the vehicle is due to different environmental conditions and number of axles altering how quickly the leaf layer is formed and the bonding of the leaf layer. The bond strength of leaf layers has been shown to increase (approximately linearly) with number of wheel passes on the Huddersfield Adhesion and Rolling Contact Dynamics (HAROLD) test rig, with the higher wheel load resulting in higher bond strength.
10
The high pressure and temperature catalytic reactions of leaf material and their potential impact on friction and bonding to the railhead have been investigated.
3
Flow chart of leaf layer formation process.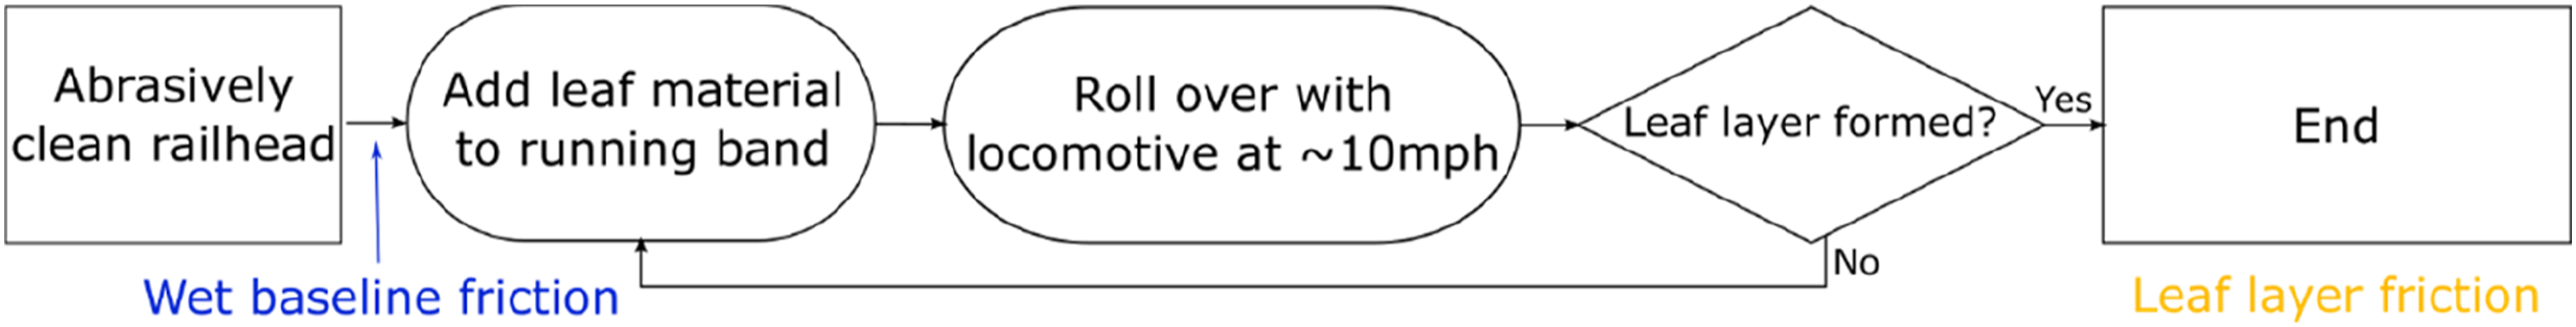
The possible variation in method is a necessity for widespread adoption of this approach. The leaf layer was deemed formed when it was blackened and covered the majority of the running band but was sometimes patchy in places. By changing the quantity of leaf powder added this could visibly resemble “light”, “medium” or “high” under Network Rail guidelines (Figure 1). During these tests, between 6 and 10 g of leaf powder per metre was added.
This technique was repeated over two different test sites; Wensleydale Heritage Railway and East Lancashire Heritage Railway, with a total of 18 leaf layers formed. It was carried out in the UK summer and winter, with air temperature conditions between +27°C and 0°C. Testing could not be carried out under sub-zero temperatures, due to ice forming on the railhead.
Some changes in the methodology were required to accommodate the variance in environmental conditions. In very hot conditions or when using dry leaf powder, a handheld spray bottle was used to wet the railhead before leaf material application to aid bonding. In damper conditions more leaf material was required to form a layer, due to increased pick-up of leaf material by wheel passage. Some testing was carried out in light rain but it was not possible to form a leaf layer in heavy rain, the leaf material remained soft instead of bonding and appeared to be pushed from the contact band. This effect also occurs under operational conditions and rail leaf layers do not form or can be rapidly removed under heavy rain conditions. 21
On each test site: a 10 m section was marked out and six measurement locations labelled with acrylic pen, three on each rail leg over the 10 m distance. A schematic of measurement locations is shown in Figure 3. A schematic of the measurement locations (upper), railhead images during the leaf conditioning, showing the blackening on the leaf material after vehicle passage (lower).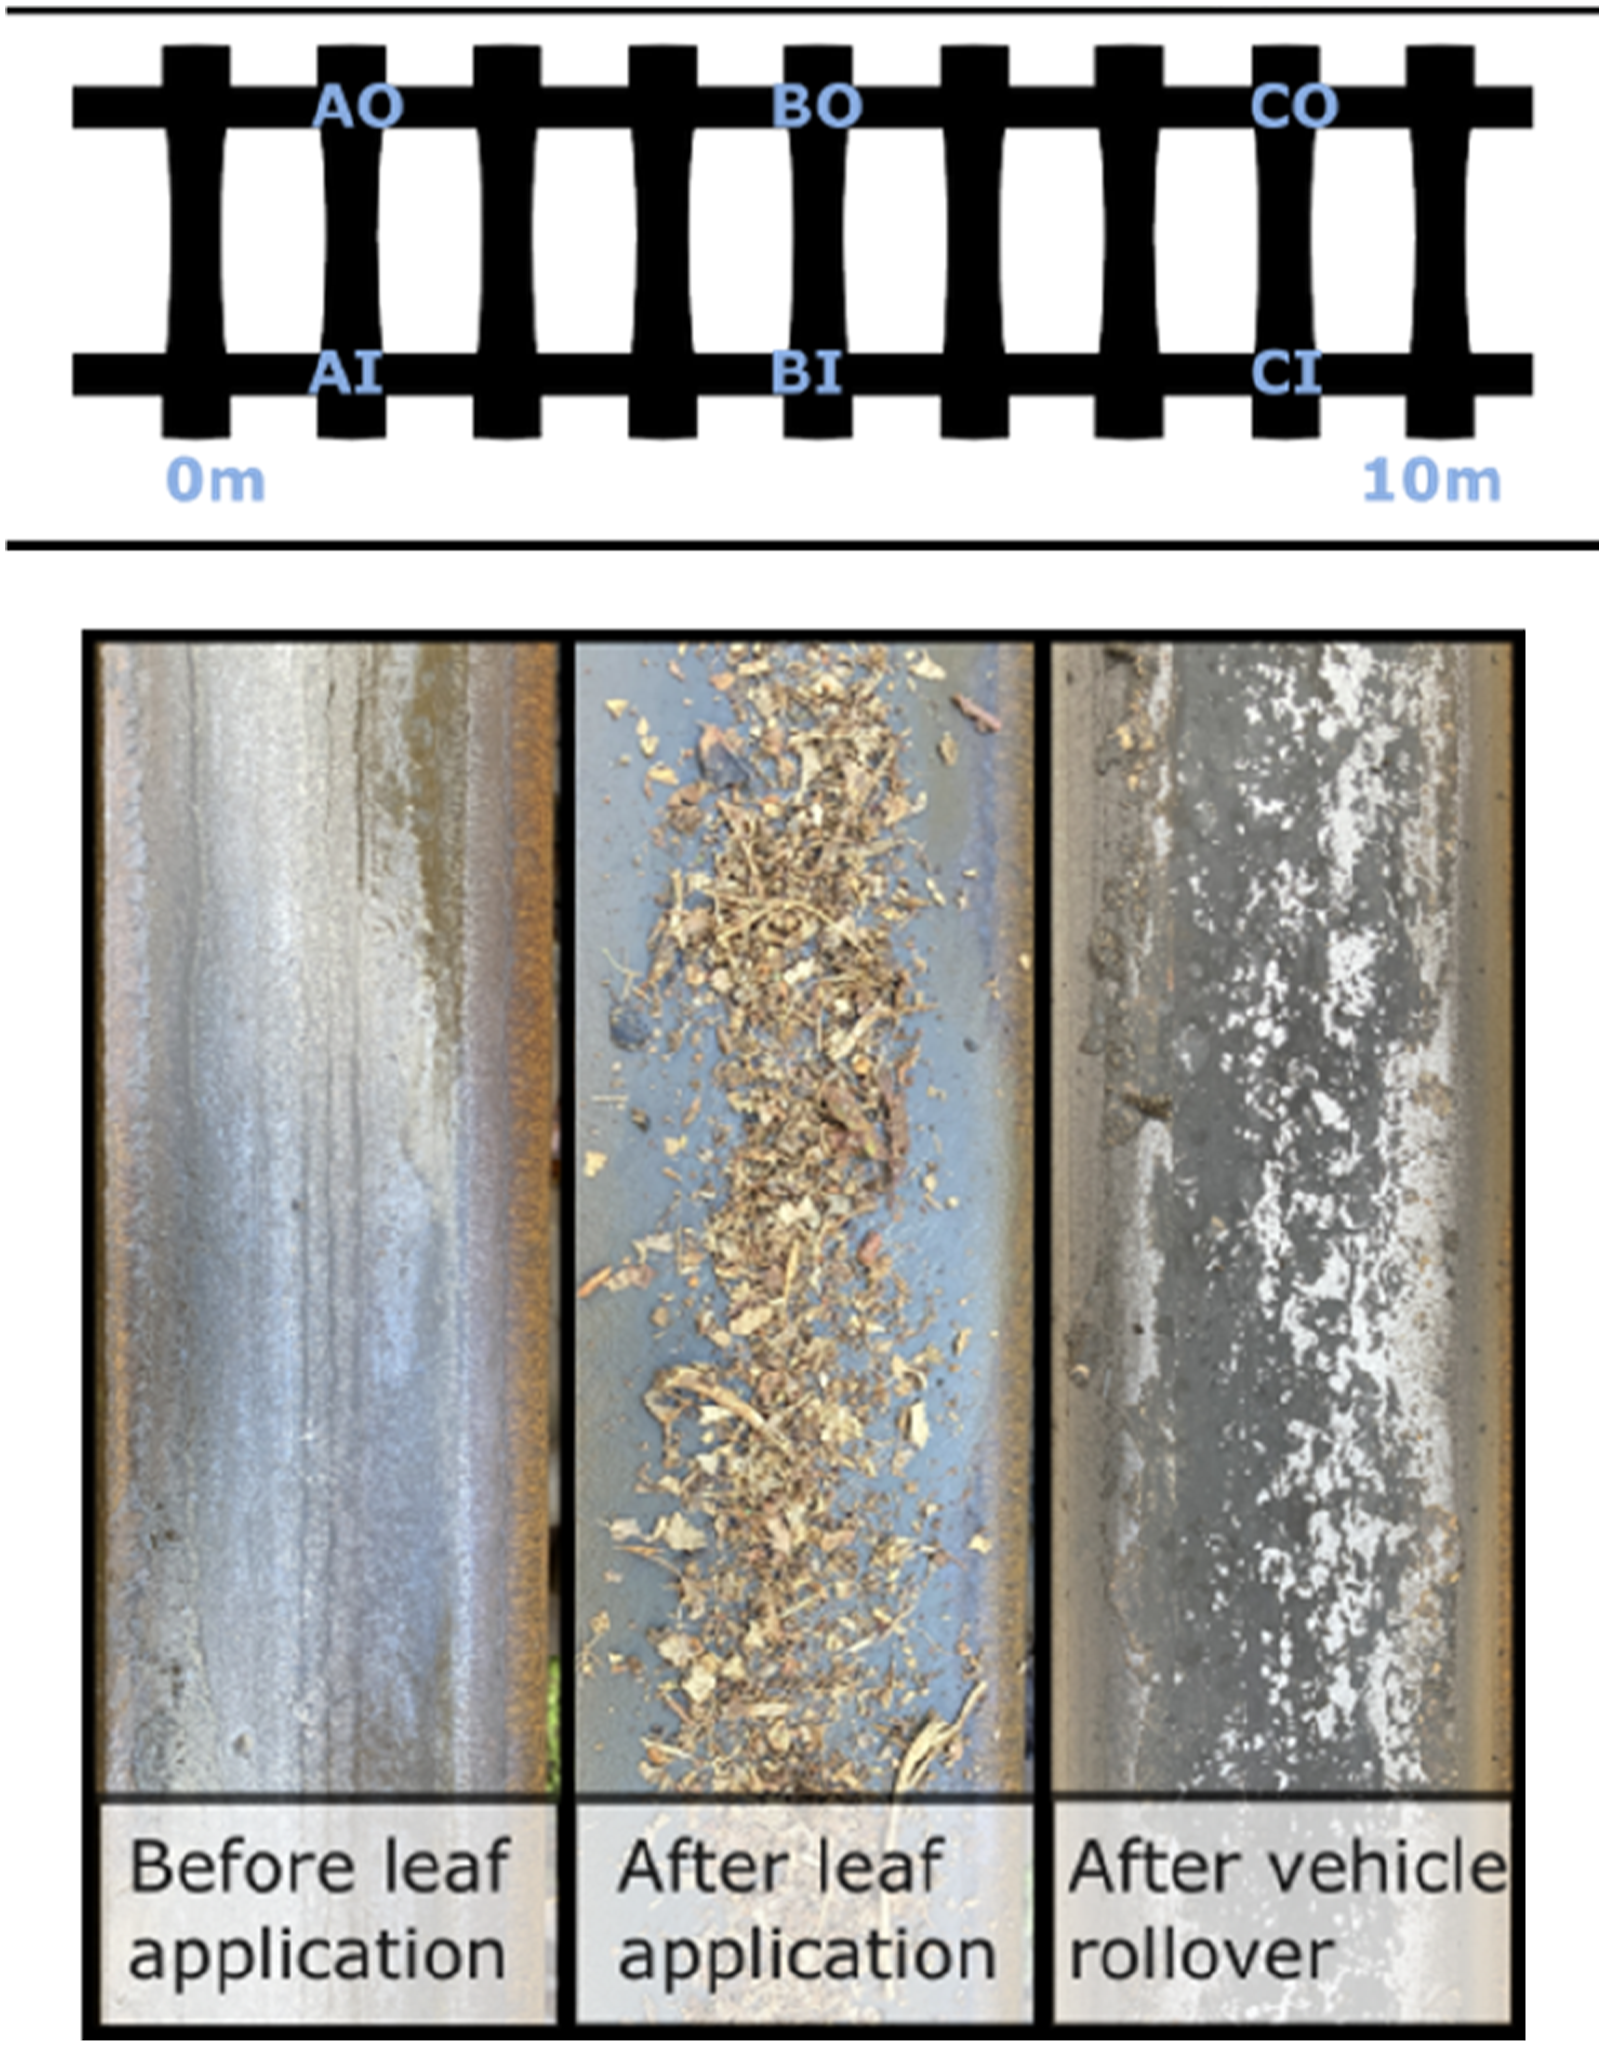
During the leaf layer formation procedure, the leaf material was first rolled flat to form a brown layer and this turned to a black colour resembling the layers that cause autumn disruption with additional wheel passes. The layer turned darker more rapidly up a gradient, presumably with additional creepage, but this could cause the leaf material to be picked up and adhere to the wheels rather than rails. In this situation leaf material was deposited further along the rail (often one wheel circumference) from the test site. Once formed the layer also adhered strongly to the railhead and it was difficult to remove even with a sander/wire brush. An example image of the rail before and after the formation procedure is shown in Figure 3 (lower).
Railhead measurements
The Rivelin Rail PRT300 portable railhead tribometer was used to measure railhead friction, shown in Figure 4.
22
The device magnetically clamps to the railhead and uses a freely rotating ER8 steel wheel as the counter body to the rail. Up to 200 N normal force can be applied, producing a maximum wheel/rail contact stress of 1 GPa which is representative for wheel tread/railhead contact conditions.
23
The Rivelin Rail portable tribometer.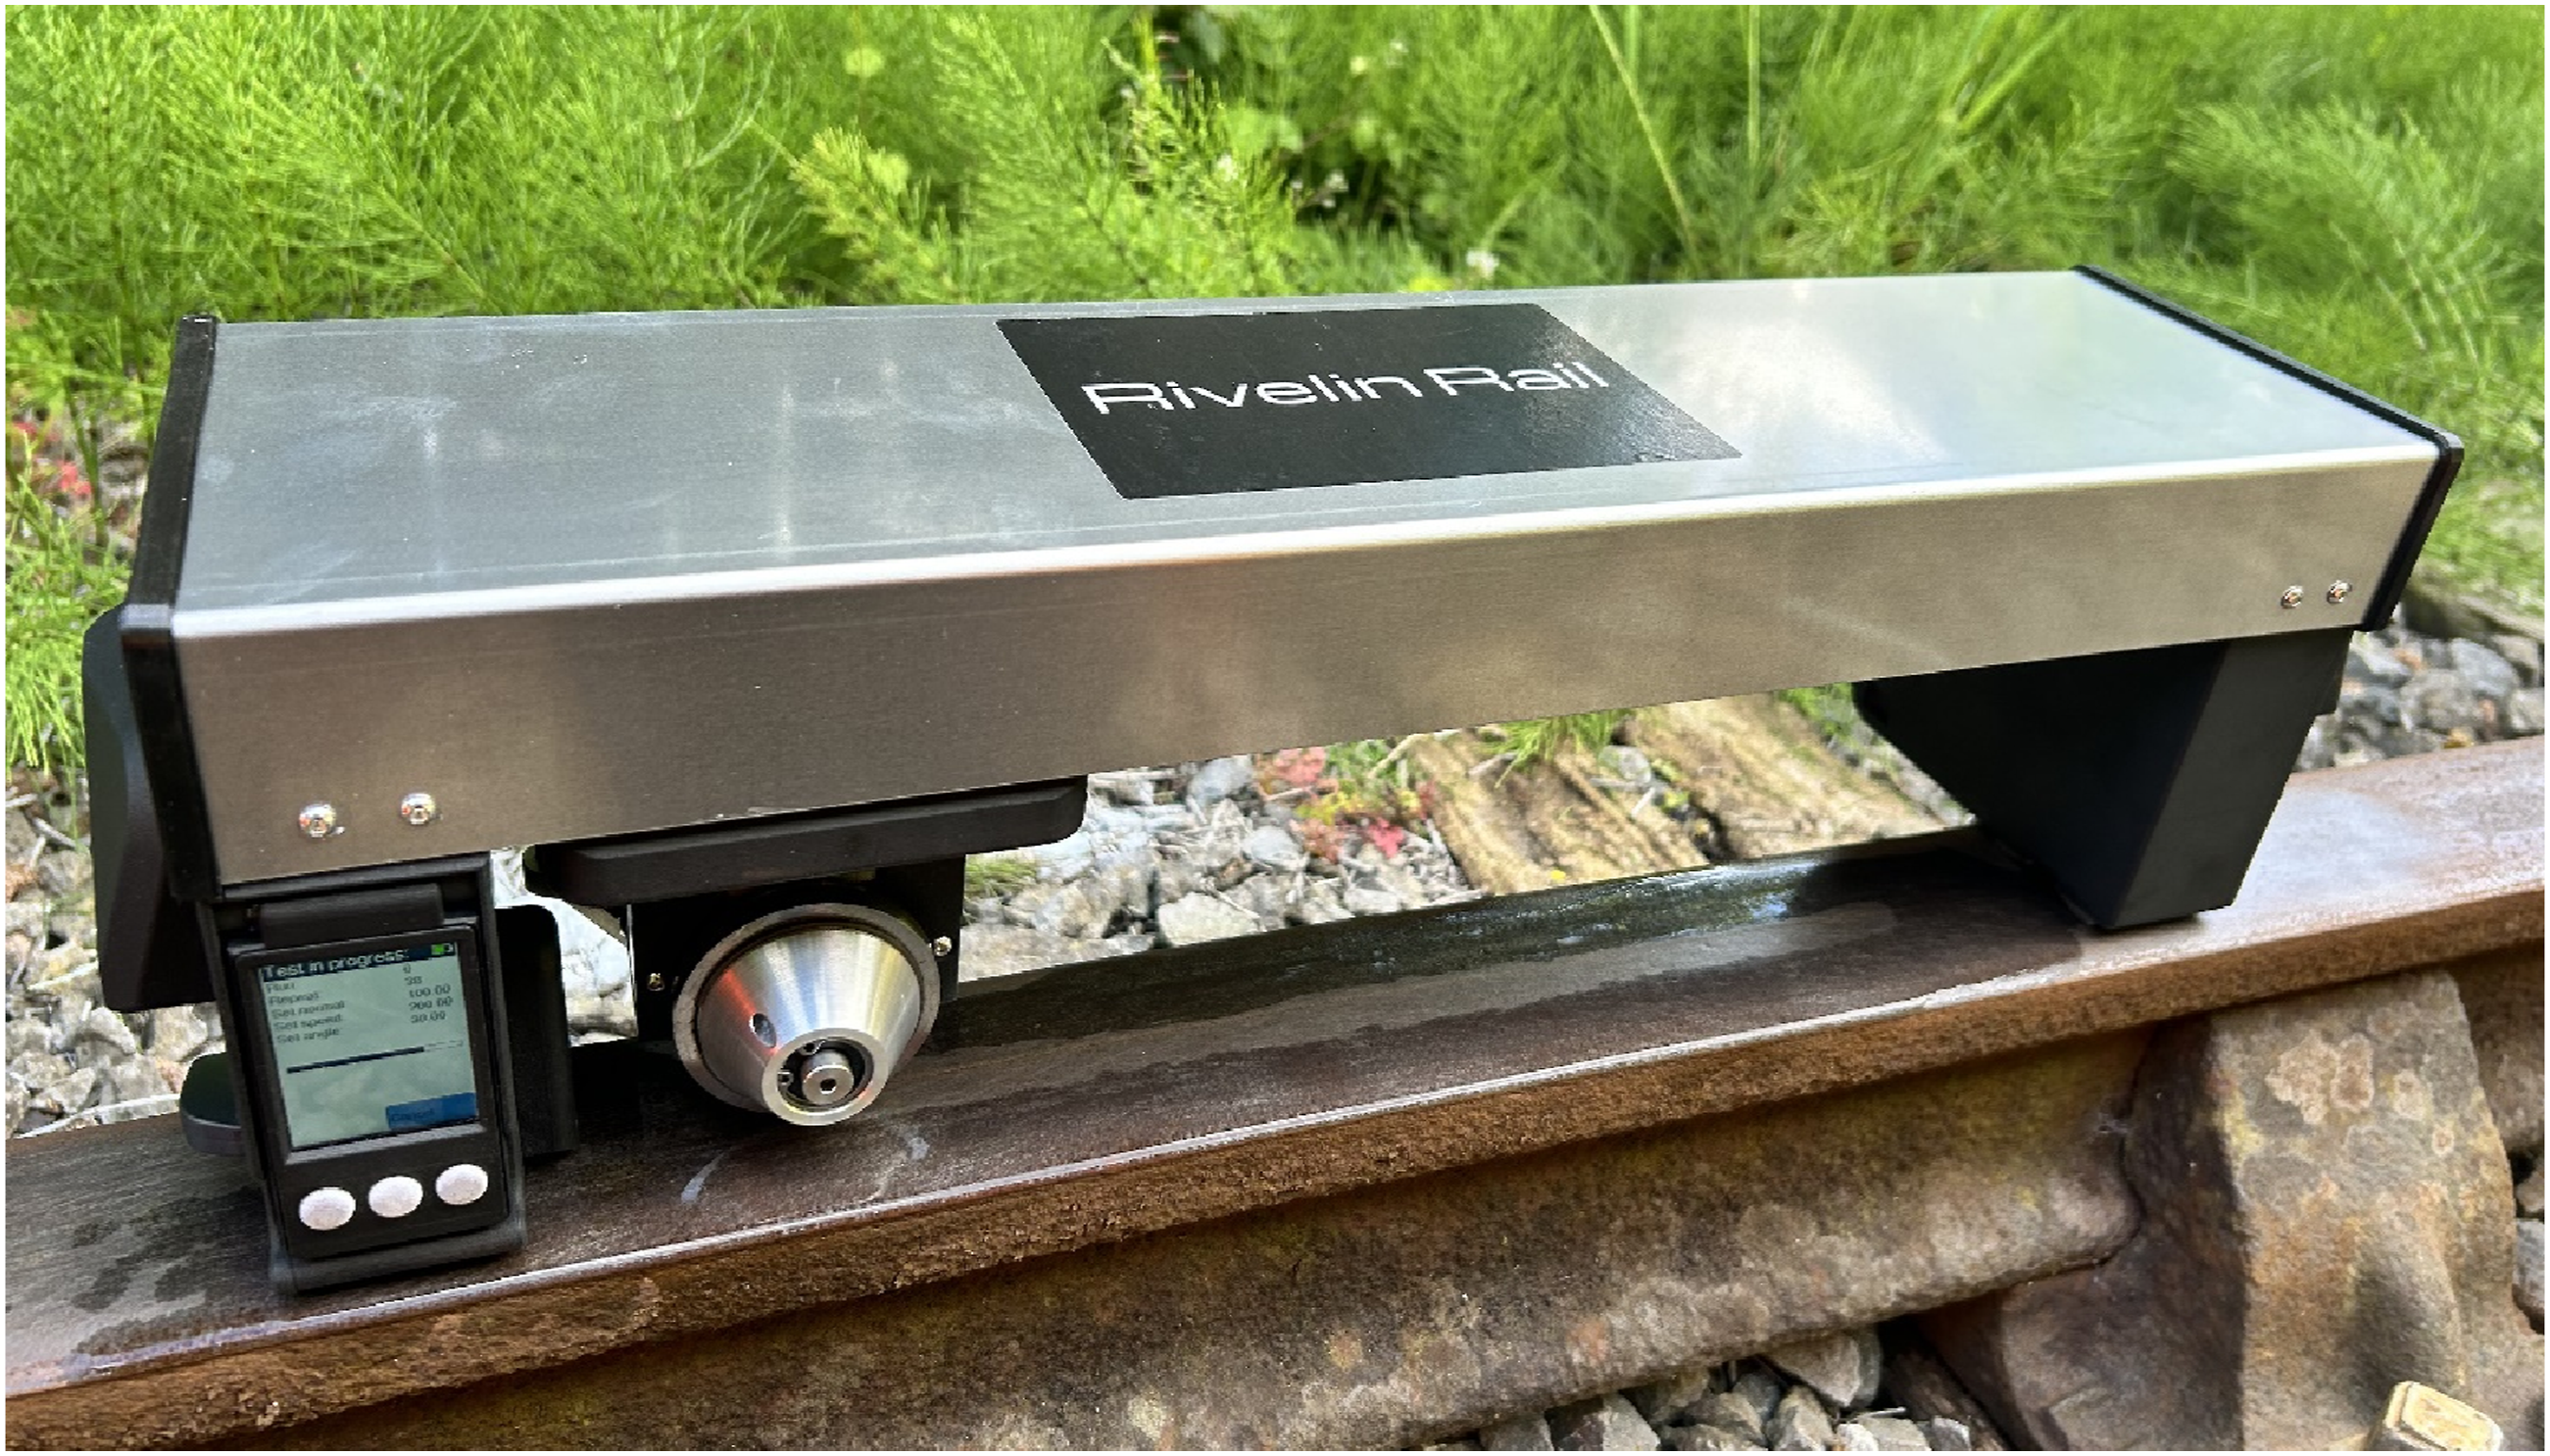
The wheel rolls along a 300 mm length of rail at 200 mms−1. The wheel’s axis of rotation is rotated to an angle with the direction of travel which produces lateral creep in the contact. The resultant force on the ball is measured with a sampling frequency of 100 Hz. The lateral creep can be converted to an effective linear creep by taking the tangent of the angle, throughout this report this conversion has been applied. An image of the tribometer is shown in Figure 4.
For this work, tests were carried out at 700 MPa contact pressure (simulating wheel tread/rail head stress for a light rail system) and 3% effective linear creep (30 mrad angle) to ensure creep force saturation for all rail conditions and compare against a library of previous results.
Railhead friction, in the running band, was measured at the six locations indicated in Figure 3 after each cleaning run. The tribometer displays an average friction coefficient for each run, but also records approximately 300 data points per repeat (4 repeats at each measurement location). This granular data is especially important when measuring railhead leaf layers, which often have an inconsistent and patchy distribution on the steel surface. The tribometer wheel will pick-up contamination similarly to a train wheel. To prevent buildup between measurements, an isopropyl alcohol wipe was used to clean the wheel between every test.
Before and after railhead cleaning the friction coefficient was measured when the rail was wet, repeating the methodology carried out during British Rail Research trials of friction enhancing products. 16 This was deemed the most appropriate technique to assess how much leaf layer was remaining and whether it had the potential to cause low adhesion, as dry leaf layers do not generally produce low friction or impede braking. 16 Due to melting frost during or precipitation during some test days the railhead was also wet in places and the cleaning system applied water, which made dry baseline values impossible to measure at times.
An eddy current layer thickness measuring device was also used to measure layer thickness to Network Rail recommendations. 18 At least 5 measurements were taken from the running band per measurement location to account for layer inconsistencies. The thickness measuring device only works in dry conditions so measurements were taken before the rail was wetted for friction measurements. The mean average values were 4.94 ± 2.66 for dry baseline and 25.07 ± 16.02 after leaf layer formation. On the majority of test days this would be classed as “medium” or “level 2” contamination level through Network Rail guidelines. 18
A Kernel Density Estimation plot showing measurements from all test days over the six test sites is shown in Figure 5. The mean average friction coefficient for wetted leaf layers was 0.042, which would be classed as ultra-low adhesion.
24
During vehicle passage during layer formation the driver stated that the low adhesion warning light in the cab had turned on (due to wheel slip/slide). The wheels were also visibly slipping and sliding when traction or braking was carried out before and after the test site due to the lack of Wheel Slide Protection in the test vehicle. Environmental conditions as well as friction coefficients for all test days are shown in the Appendix. A kernel density estimation plot (L) and boxplot (R) of rail conditions over 4 days of initial trials using the tribometer at the East Lancashire Heritage Railway, showing the distribution of friction coefficient measurements. Measurements were taken at 700 MPa and 3% effective linear creep.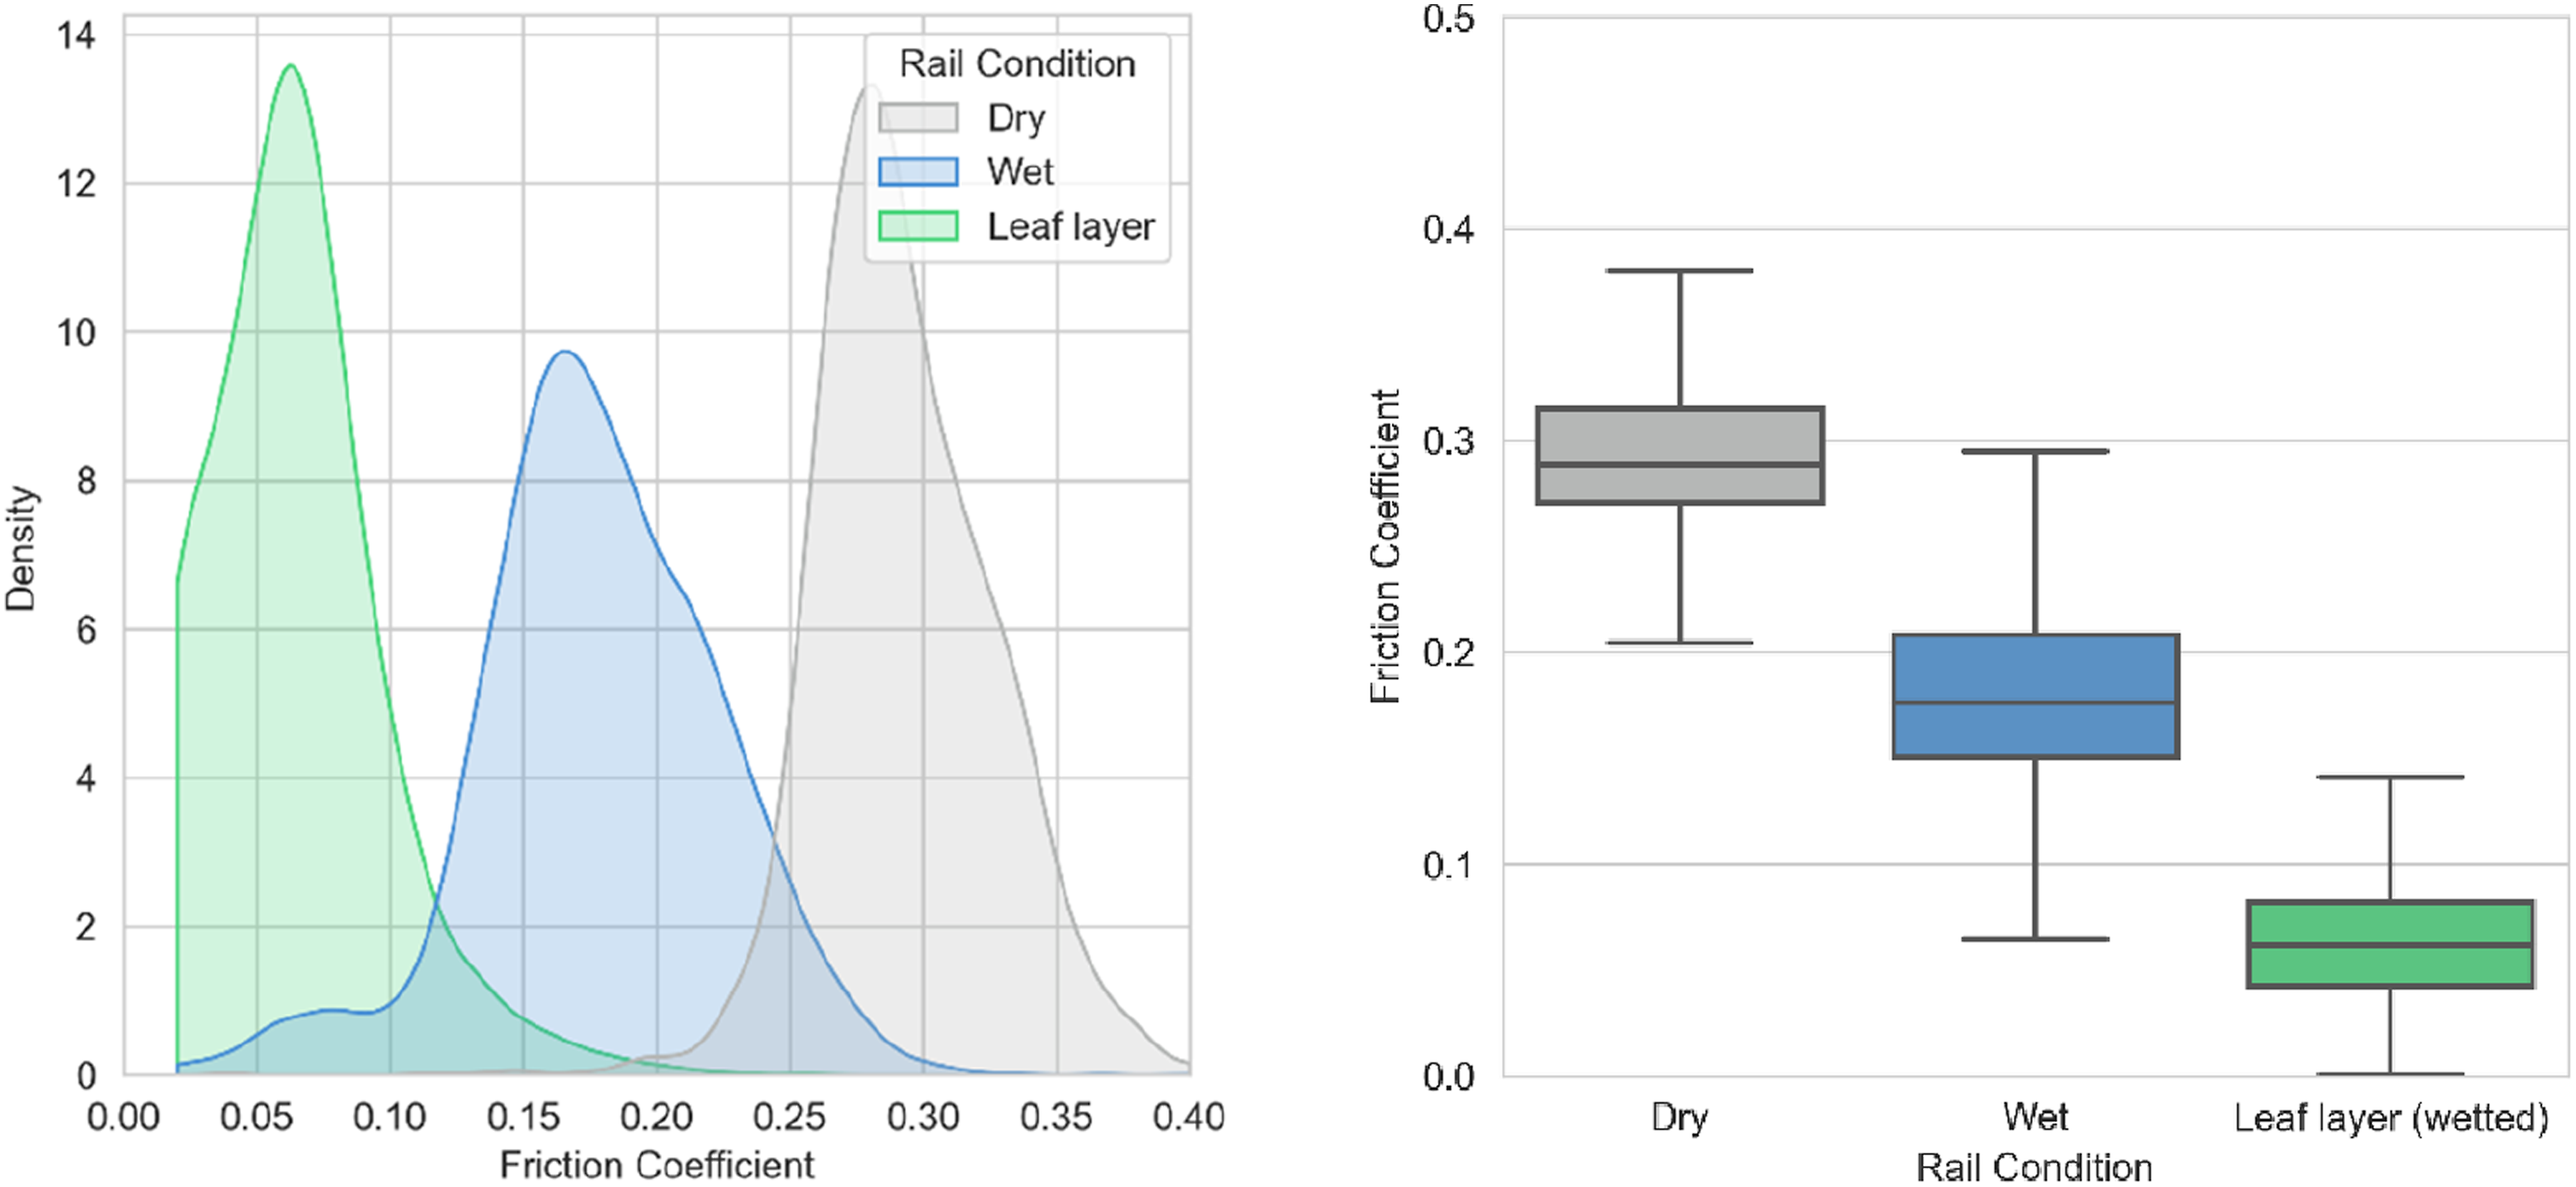
Rail cleaning techniques are often required to work on “light”, “medium” as well as “high” contamination conditions so on other test days the quantity of leaf material added was varied to change layer thickness and coverage, although the adherence of this material to the railhead was not necessarily any stronger. Tribometer measurements from all test days and images of “light”, “medium” and “heavy” contamination, designated using Network Rail guidance using the example in Figure 1, are displayed in Figure 6. Friction coefficients measured on level 1, 2 and 3 contamination (designated using Network Rail guidelines shown in Figure 1).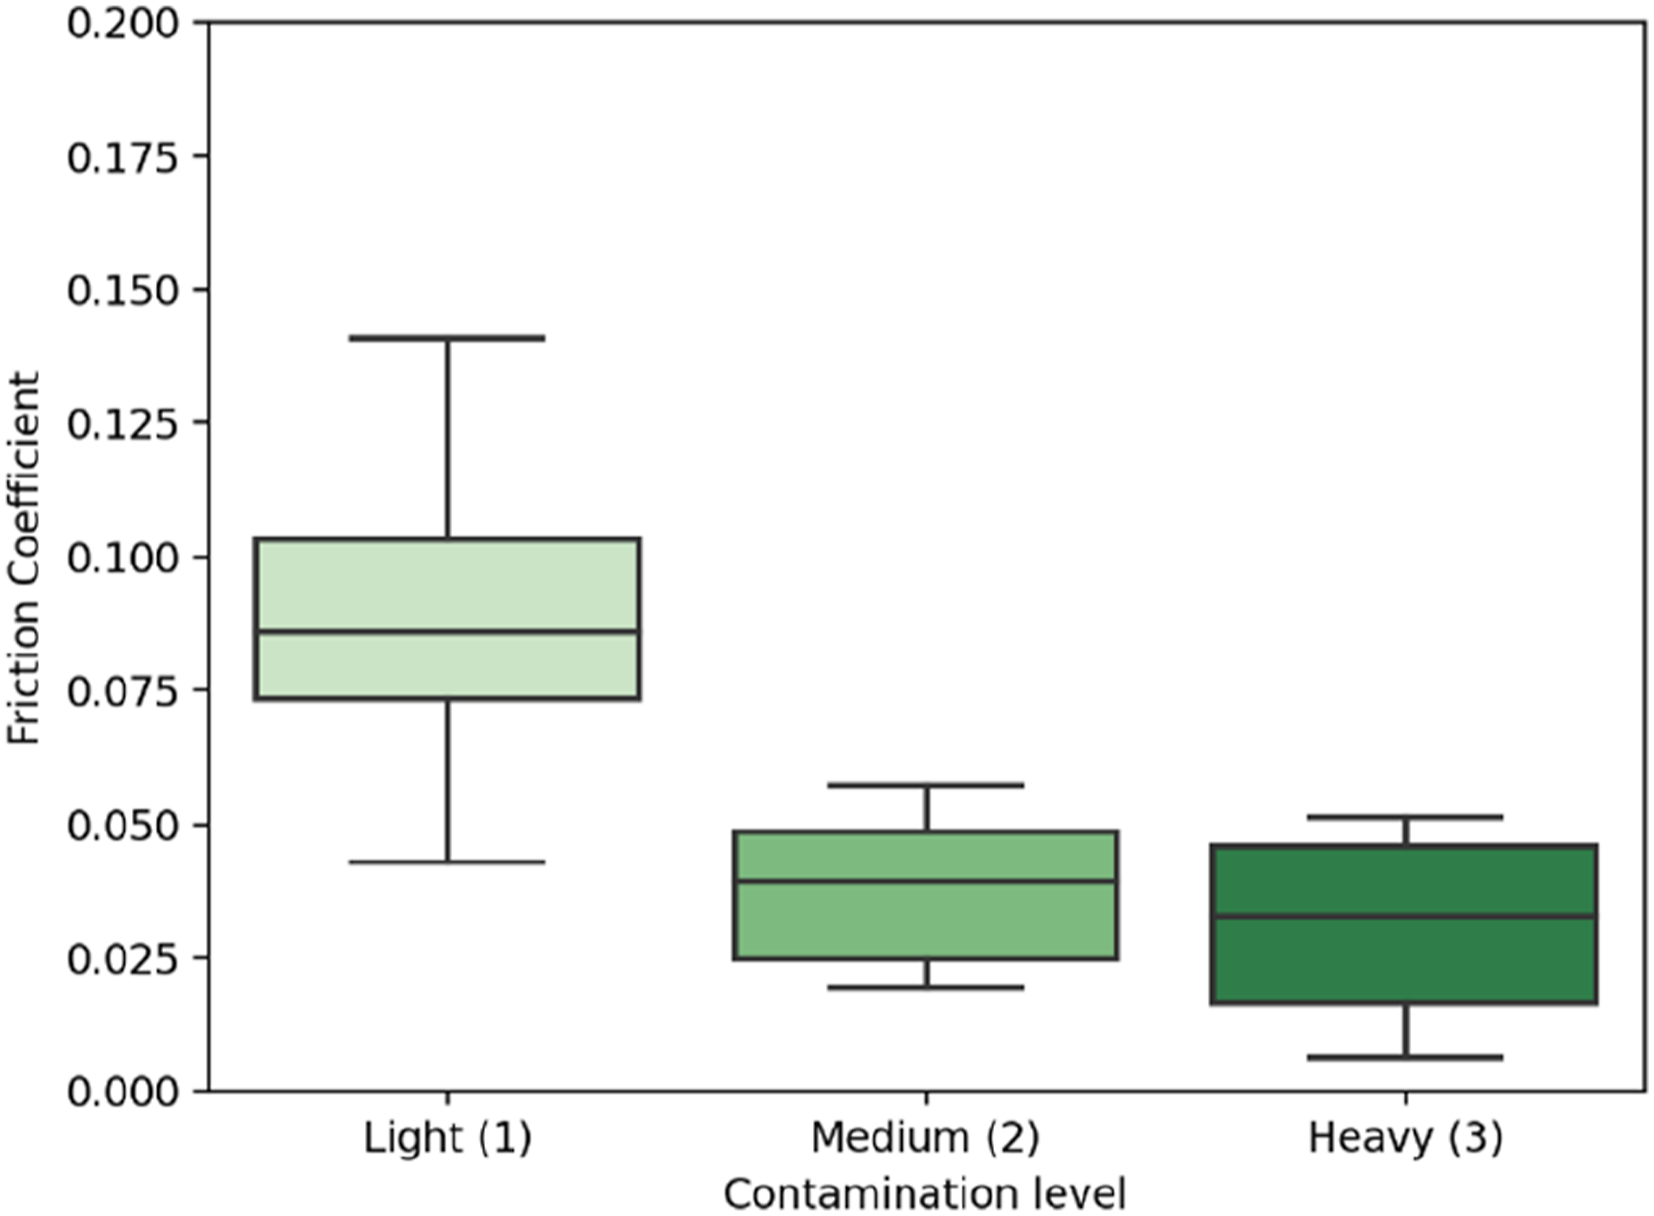
Case study- application of the railhead conditioning approach to assess a new rail cleaning method
Railhead conditioning
As an illustration of the methodology described in this case study, a new (anonymised) on-board rail cleaning method was trialled using the leaf layer formation and measurement procedure. In each trial a leaf layer was formed and friction measured at six locations, before cleaning the rail using the new technology. After cleaning the friction of the rail was measured again to assess the cleaning performance. This process was repeated ten times over 7 days.
The method for the assessment of railhead treatment is summarised below. Although used in this work for an on-board train based treatment, this methodology would also be applicable to assess the performance of wayside friction management, for example traction gel applicator’s, chemical (such as citrus cleaner or manual (such as wire brushing) treatments.
7
1) Abrasively clean rail surface to remove oxide and expose bare (reactive) steel 2) Spray with water and measure wet baseline friction coefficient at six marked locations 3) Create a leaf layer as described in “methodology” 4) Spray marked locations with water and measure wet leaf contaminated friction coefficient 5) Clean rail with technology being tested 6) Spray marked locations with water and measure wet cleaned friction coefficient
Railhead measurements
An example box plot of friction results (including the wet baseline, wetted leaf layer and wetted leaf layer after cleaning) is shown in Figure 7(L). All datapoints collected using the portable tribometer have been used (300 points per measurement) which shows the variability in railhead friction, especially when testing patchy leaf layers. Layer thickness measurements for baseline, leaf layer and leaf layer after cleaning are shown in Figure 7(R). Example images of the railhead before and after cleaning are shown in Figure 8. Friction coefficient (L) and eddy current layer thickness measurements (R) during the performance assessment of a new railhead cleaning method. Sample railhead images from site AO, for each of the cleaning test runs.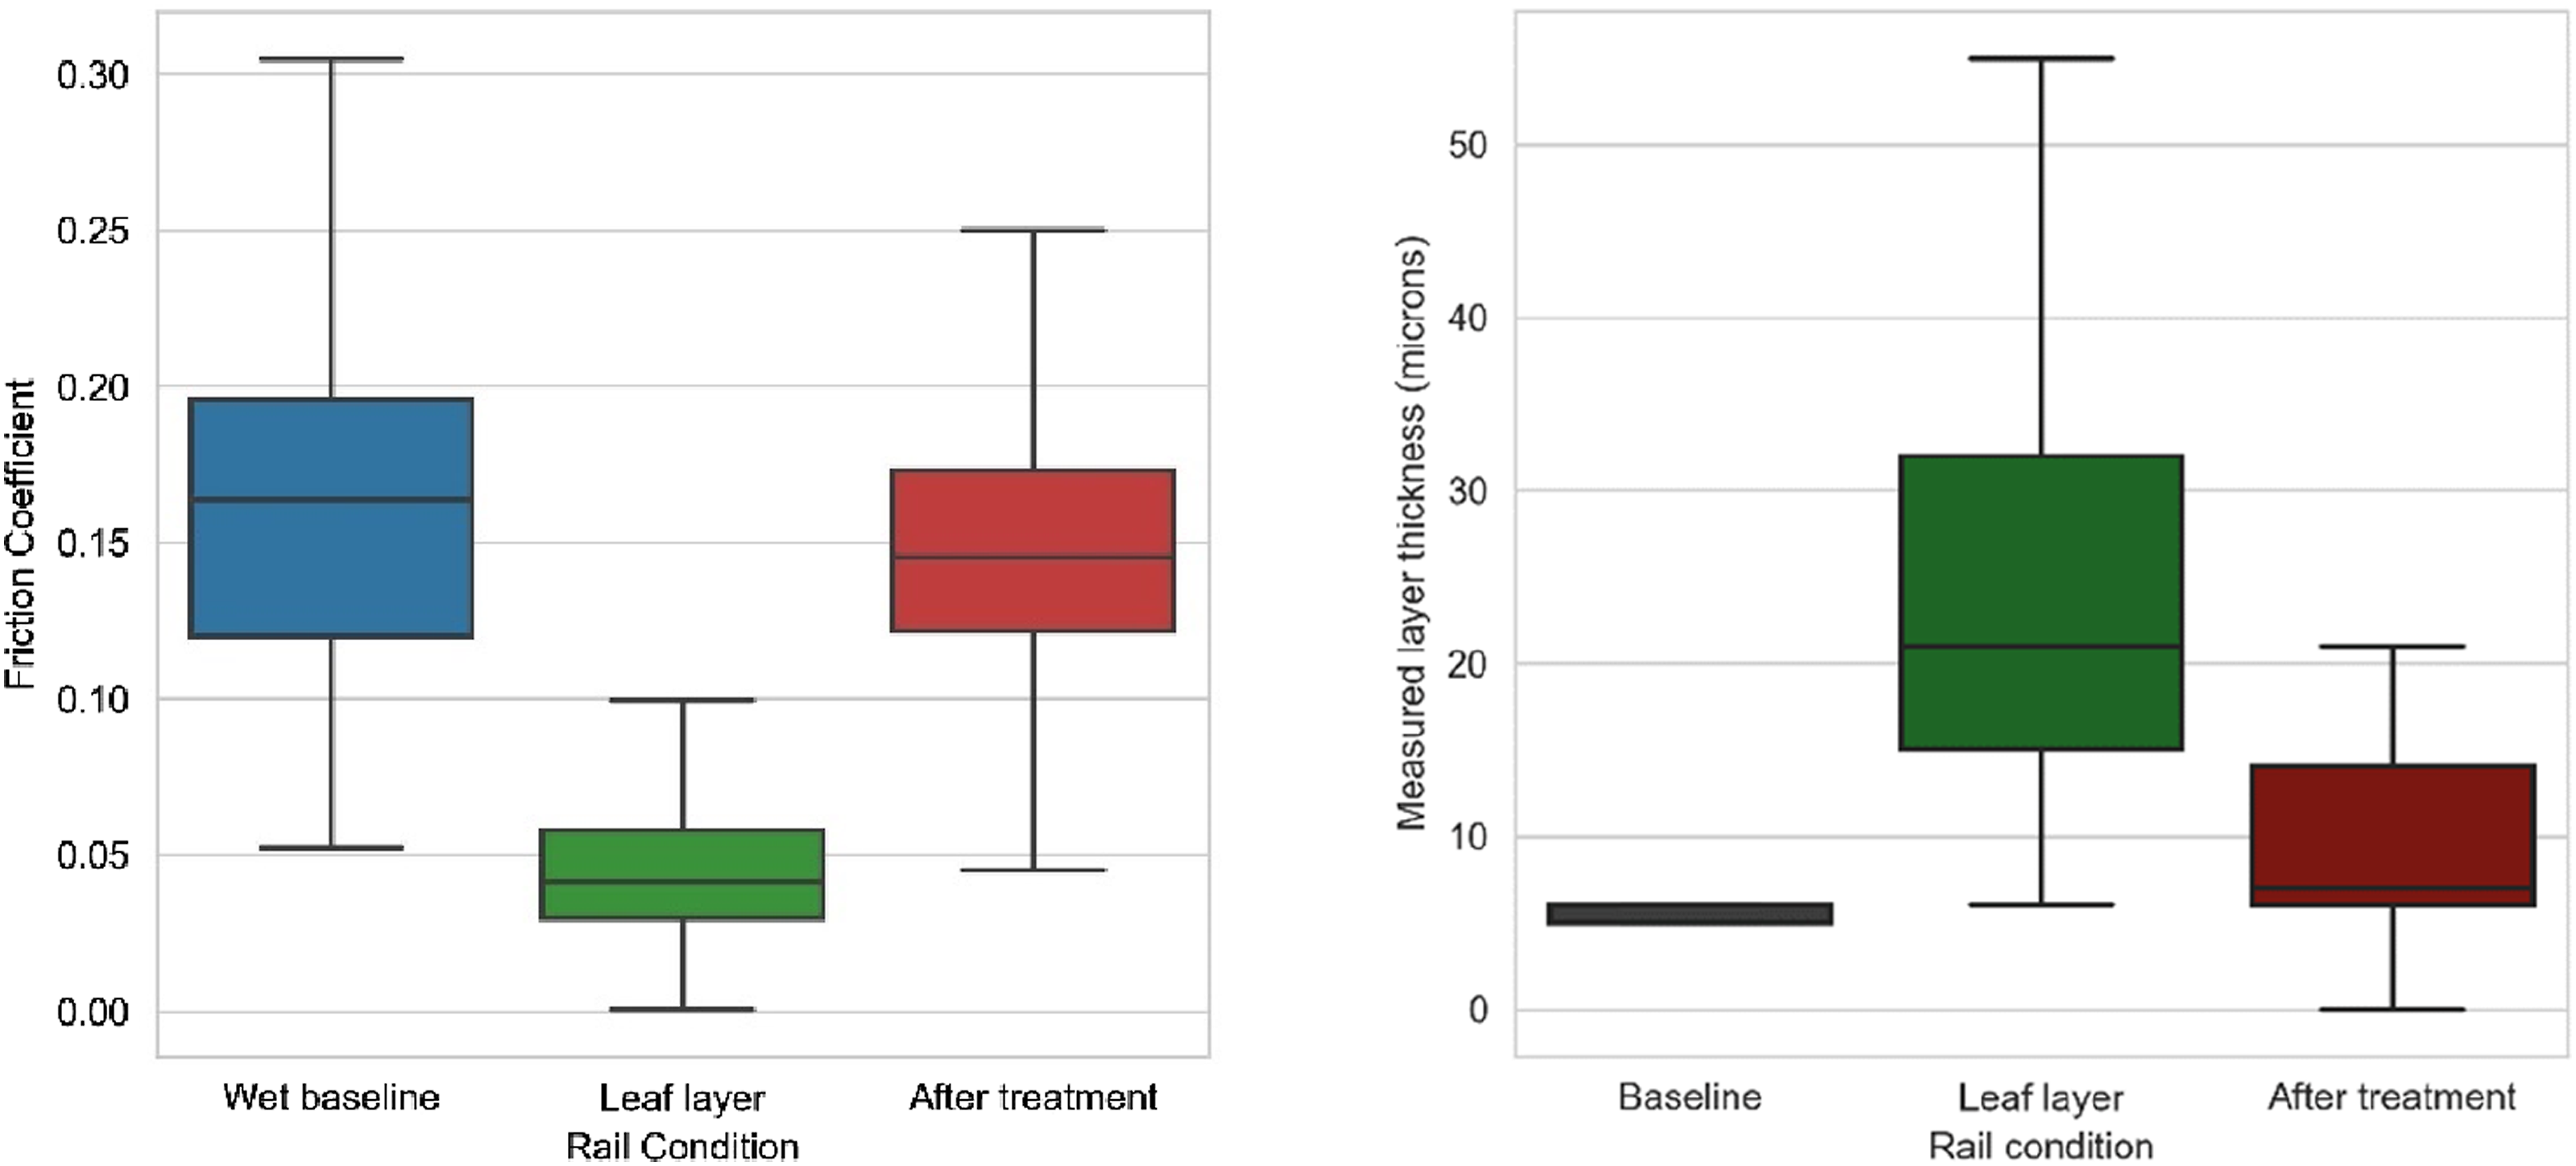

Braking trials
A brake trial methodology is described in 15 and has been adapted where possible to fit this current methodology. In this case, a Class 33 (no wheel slide protection system) was driven at 15 mph towards the braking site. At a marking cone before the test site the driver applied step 1 braking, step 1 was applied as long as there was no wheel slide, until the train slowed to 2 mph where the train was stopped on step 1. Three braking runs were carried out each on “dry”, wet and wetted leaf layer conditions. There was very light rain or drizzle before testing and the railhead was initially slightly damp. Although no additional water was added, this may explain why the “dry” measurements were lower than expected for typical dry values (Figure 5).
After three braking runs on the leaf layer, with visible wheel slides, the layer was spread out (covering almost the entire running band) and strongly adhered to the railhead. No bond strength tests were carried out during this testing, but the layer was difficult to remove using an abrasive sanding star. The lowest average friction coefficient recorded during this testing (0.029) was measured when this layer was wetted.
Figure 9 shows the braking distance for each of these test runs plotted alongside measured friction coefficient, for each rail condition. The ultra-low friction coefficients measured using the tribometer are validated by long braking distances and visible wheel slides experienced by the Class 33. Braking distance for dry, wet and wetted leaf layer conditions plotted alongside friction coefficient measured using the tribometer (left); the leaf layer after braking trials (right).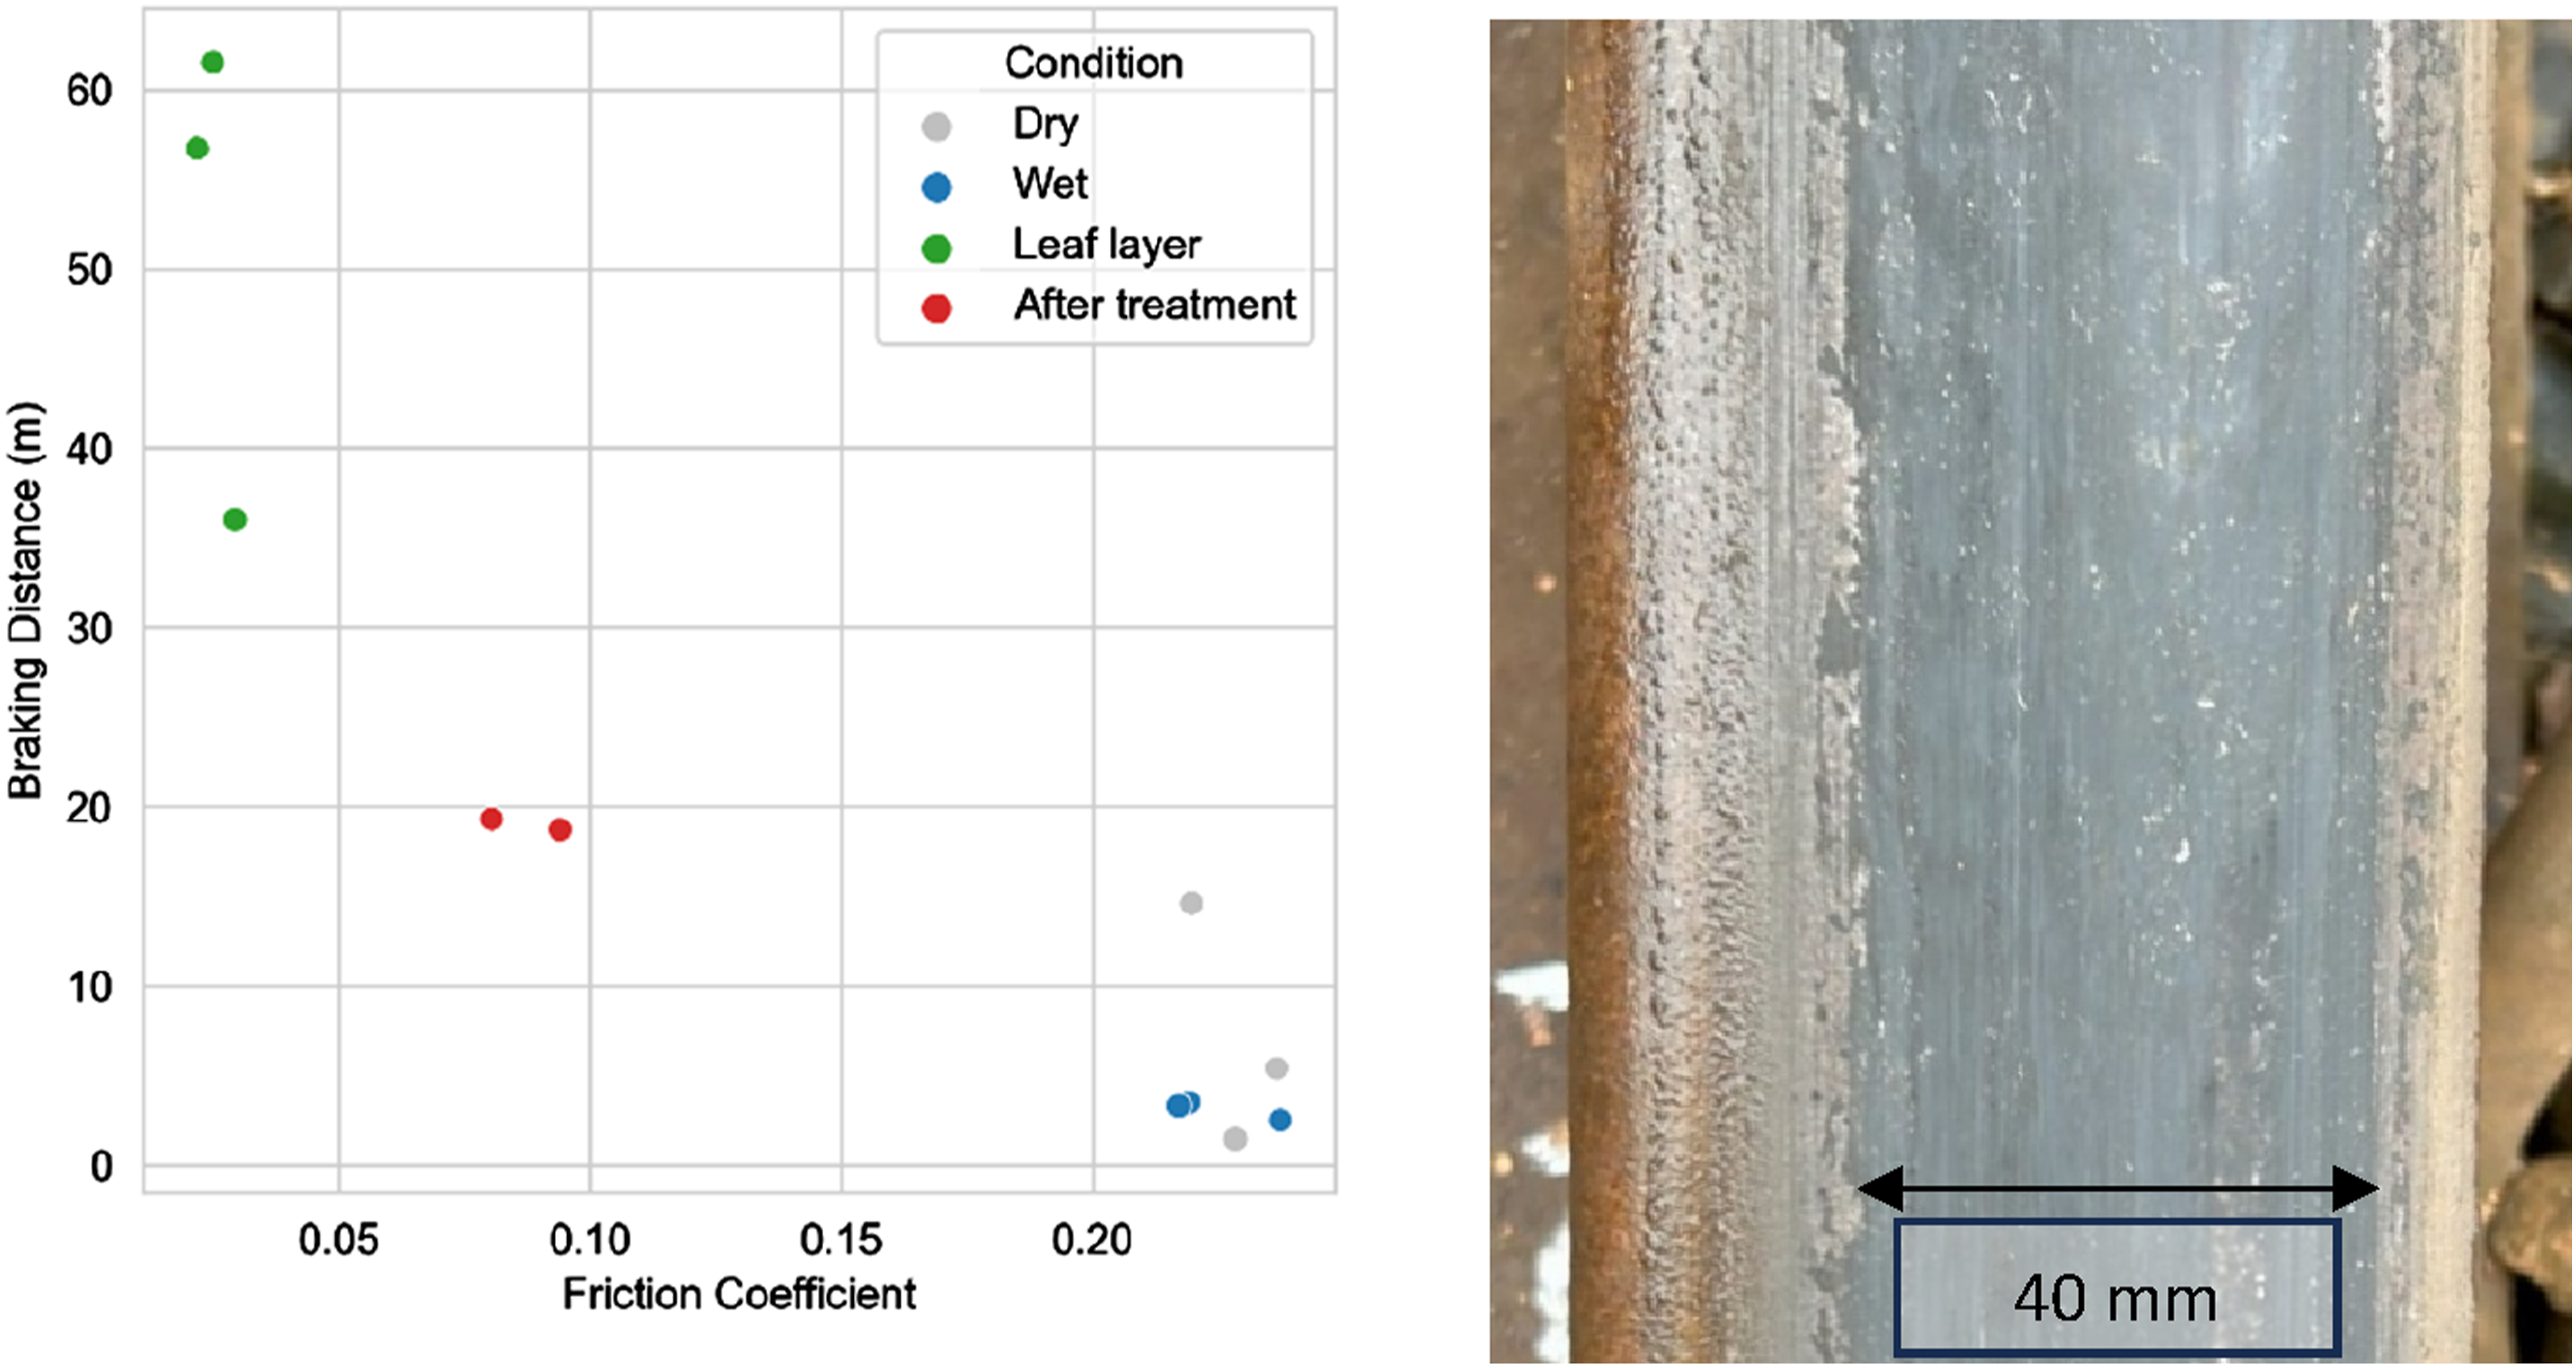
Discussion
Leaf layer formation approach
The leaf layer formed during the majority of this testing was visibly similar to that occurring in the field under standard operational use, resembling “medium” or “level 2” contamination using Network Rail guidelines. The leaf powder was first compacted onto the rail as a solid brown layer, blackening and bonding to the railhead after subsequent wheel passage. To determine whether cleaning was effective under different conditions, “light” or “heavy” contamination was also formed during some test days by changing the quantity of applied leaf material, with comparative measurements shown in Figure 6.
The mean average friction coefficient for wetted leaf layers was 0.042, which would be classed as ultra-low adhesion 24 The locomotive driver stated that he had to take care with traction and braking due to low adhesion and the wheel slide warning light turned on, this was reinforced with much longer stopping distance and visible wheel slide during the braking trials.
A comparable average friction coefficient of 0.040 was measured using the portable tribometer during the autumn season in a low adhesion “hotspot” on an operational railway, the layer was visibly similar to those formed during this testing.
The layer thickness measurements showed a decrease in layer thickness after railhead cleaning but due to the often patchy nature of the leaf film (Figure 8) there could be a measured layer in one reading but bare steel in the other, meaning the method is open to user bias.
The bond strength between leaf layer and the underlying steel substrate is important when assessing the performance of friction enhancing products, but is difficult to carry out. Techniques exist which have been designed for paint testing, where a stud is glued to the contamination and the torque required to break the leaf/rail bond measured. 21 The author’s experience is that operationally formed leaf layer can be patchy and it is often difficult to find a consistent layer to attach the relatively large head of the tool to. This would have only been possible to carry out in one of the layers shown in Figure 8. Moisture also softens the layer, under wet conditions the tool may also either not stick to the layer or shear the organic layer itself, rather than the organic/steel interface. If suitable measurement technology and procedures could be determined, such as those developed using closely controlled water volumes on laboratory formed leaf layer in Ref. 10, this would be a useful addition in future.
The leaf layer formation method described has been carried out at two different test sites over a range of environmental conditions and appears to be robust enough for a year-round method to assess the effectiveness of low adhesion remediation methods.
Data comparison and validation
As with any new measuring technique, it is important to ensure that measurements are validated and representative of the real wheel/rail contact. There are an extensive number of small scale laboratory studies and the library of data is growing as tribometer technology develops, but the availability of friction data from multi-day field trials remains limited, in part by the complexity and cost of running railway field trials and the aforementioned limitations in portable tribometer technology. Figure 10 shows the Rivelin Rail tribometer results plotted against two other pieces of test equipment in both the laboratory and the field. Box plots showing measured friction coefficients during a back-to-back test series on the same 1m section of rail in the laboratory (left) and a comparison of published data during field testing (right).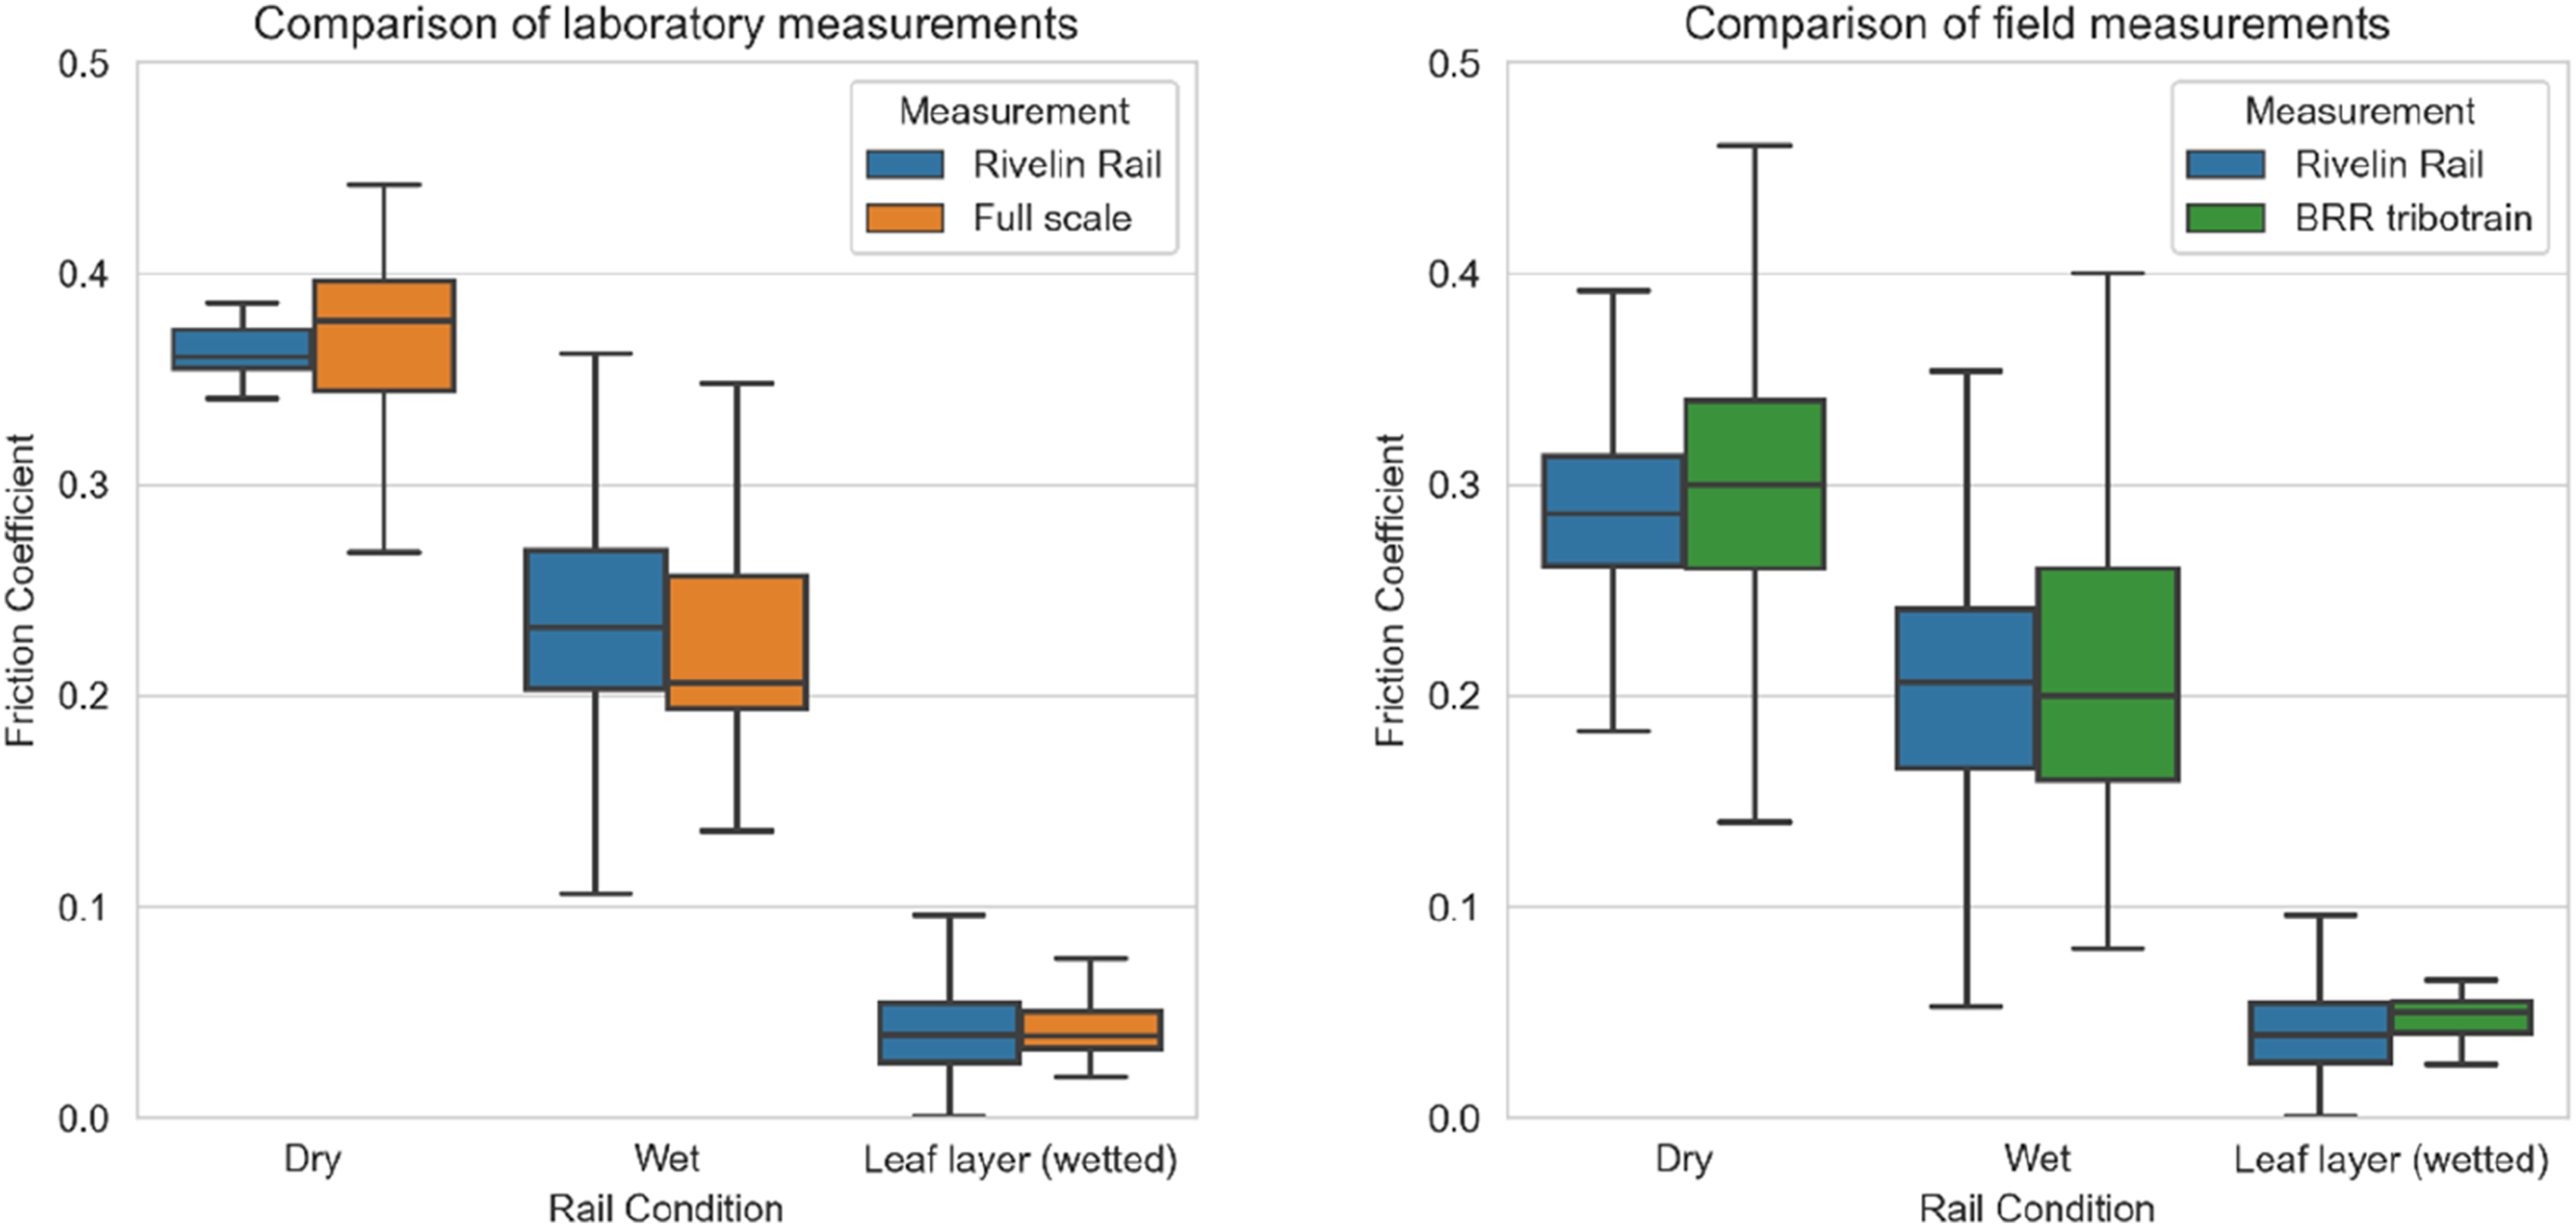
Back-to-back laboratory measurements were carried out using the University of Sheffield’s full scale test wheel and rail test facility (FSR) 25 and the Rivelin Rail portable tribometer, using the same 1m piece of rail (Figure 10, upper). Dry, wet and wetted leaf layer (using the methodology described in Ref. 19) were tested.
One of the most diverse field studies available is the British Rail tribometer-train data, a vehicle with an instrumented braked wheelset that measured the UK rail network from the 1970s to 1990s. As far as the authors know, the full dataset is no longer available. However, two of the published histograms for dry and wet values have been digitised and compared against the results of this study, this methodology was also used in previous work. 26 Wetted leaf layer data was digitised from a graph showing low friction conditions as the tribometer-train passed through a known low adhesion site, a 1.5 km long shaded cutting. 5 These three tribometer-train datasets were compared against all the portable tribometer measurements for dry, wet and leaf layer conditions collected during the field work presented in this paper.
Due to the approximately 20 year time gap between the two, back-to-back testing cannot be carried out, but over 803 datapoints (tribometer-train) and 58,036 datapoints (portable tribometer) the mean dry friction coefficient of the British Rail tribometer-train dataset is 0.30 ± 0.077, comparable to the 0.29 ± 0.048 measured during this field work with the Rivelin Rail tribometer.
The mean average dry friction coefficient for the full-scale test rig (FSR) was 0.36 ± 0.046, back to back results from the Rivelin Rail tribometer were 0.36 ± 0.011, showing good agreement. The friction coefficients from these lab tests are higher than the average field measurements, this is likely due to the state of the rail and environmental conditions. Wear particle/iron oxide debris and oil based contamination was removed from the railhead by acetone wipes prior to testing, these are known to lower the friction coefficient in an operational environment. 27 Laboratory testing is also carried out in a hot and dry environment, (24°C, 50 % RH) these conditions have been known to influence friction.28–30
The mean wet friction coefficients were 0.22 ± 0.057 for the Rivelin Rail tribometer over all tests, 0.21 ± 0.079 for the tribometer-train and 0.22 ± 0.051 for the FSR, showing good agreement between the different test methods.
Under leaf contamination the mean friction coefficient for the tribometer-train was 0.047, which compares well to the results from the Rivelin Rail tribometer from the leaf layers created in the field as part of this work (0.042). Back-to-back lab testing also shows good agreement between the FSR (0.042) and the Rivelin rail tribometer. To the authors knowledge these are the first published results showing agreement between a portable tribometer and full-scale measurements in ultra-low adhesion conditions.
Small-scale testing such as twin disc generally has a much higher dry friction coefficient, though they are comparable when lubricated or contaminated by leaves.20,31 In this case the samples are usually washed in an ultrasonic solvent bath so have minimal third body contamination before the test. Measurements are also often reported after high numbers (100’s or 1000’s) of repeating cycles, leading to visible surface degradation and changes in surface condition. The role of the third body layer which accumulates during the test and how it can increase the friction in comparison to larger scale testing has been discussed in previous work. 32 Measurements under dry conditions using the portable tribometer also show this increase in friction coefficient over repeated cycles.
Railhead cleaning case study
The cleaning procedure visibly reduced the coverage of organic contamination on the rail surface, although some contamination was still present after cleaning which shows why it can be difficult to determine how effective cleaning has been without friction measurements. Railheads are not binary “contaminated” or “clean” and even the light, medium and high contamination descriptions in Figure 1 can be interpretated differently.
The increase in friction after the first cleaning pass was statistically significant for each layer (t test against leaf layer values, n = 6), this was accompanied by a decrease in average layer thickness. There was a further increase in friction coefficient after the second cleaning pass when carried out.
Cleaning performance varied as factors such as the speed of passage or nozzle width changed and friction results help to quantify this, this more data-driven approach, coupled with a reliable leaf layer creation method, can aid optimisation of these treatments in future.
Cost/benefit studies have been carried out on a range of leaf layer mitigation methods 5 but the benefits are difficult to quantify using in-direct KPI’s due to variability in weather, traffic and driver behaviour. A case study such as this for different products could provide an “efficacy” rating for each product in this more controlled situation.
Conclusions
By abrasively removing third body material in the running band and applying powdered leaf material before wheel passes, a representative layer was formed that was visibly similar to the layers that cause autumn season low adhesion disruption.
The layer formation method was repeatable, with low friction coefficients below 0.1 measured for every layer using the Rivelin Rail portable tribometer. The driver also reported difficulties with traction and braking due to low adhesion and this was validated with braking trials. The method to form this layer was robust enough to be repeated under both summer and winter conditions, so could be suitable as a standard assessment for low adhesion mitigation treatments.
The railhead cleaning method used in the case study showed a statistically significant increase in friction coefficient after each first cleaning run. The rail was visibly cleaner, but leaf material remained on the running band and this did not increase to wet baseline values.
This method could be used to optimise existing cleaning/friction enhancing procedures and assess the performance of novel technologies. This more data-driven approach can aid optimisation and innovation in friction management to ultimately prevent wheel and rail damage, reduce delays and improve railway safety.
Footnotes
Declaration of conflicting interests
The author(s) declared the following potential conflicts of interest with respect to the research, authorship, and/or publication of this article: The authors Dr. Ben White and Dr. Michael Watson have developed and commercialised the portable rail tribometer used in this study
Funding
The author(s) received no financial support for the research, authorship, and/or publication of this article.
Appendix
Environmental data for each day of testing.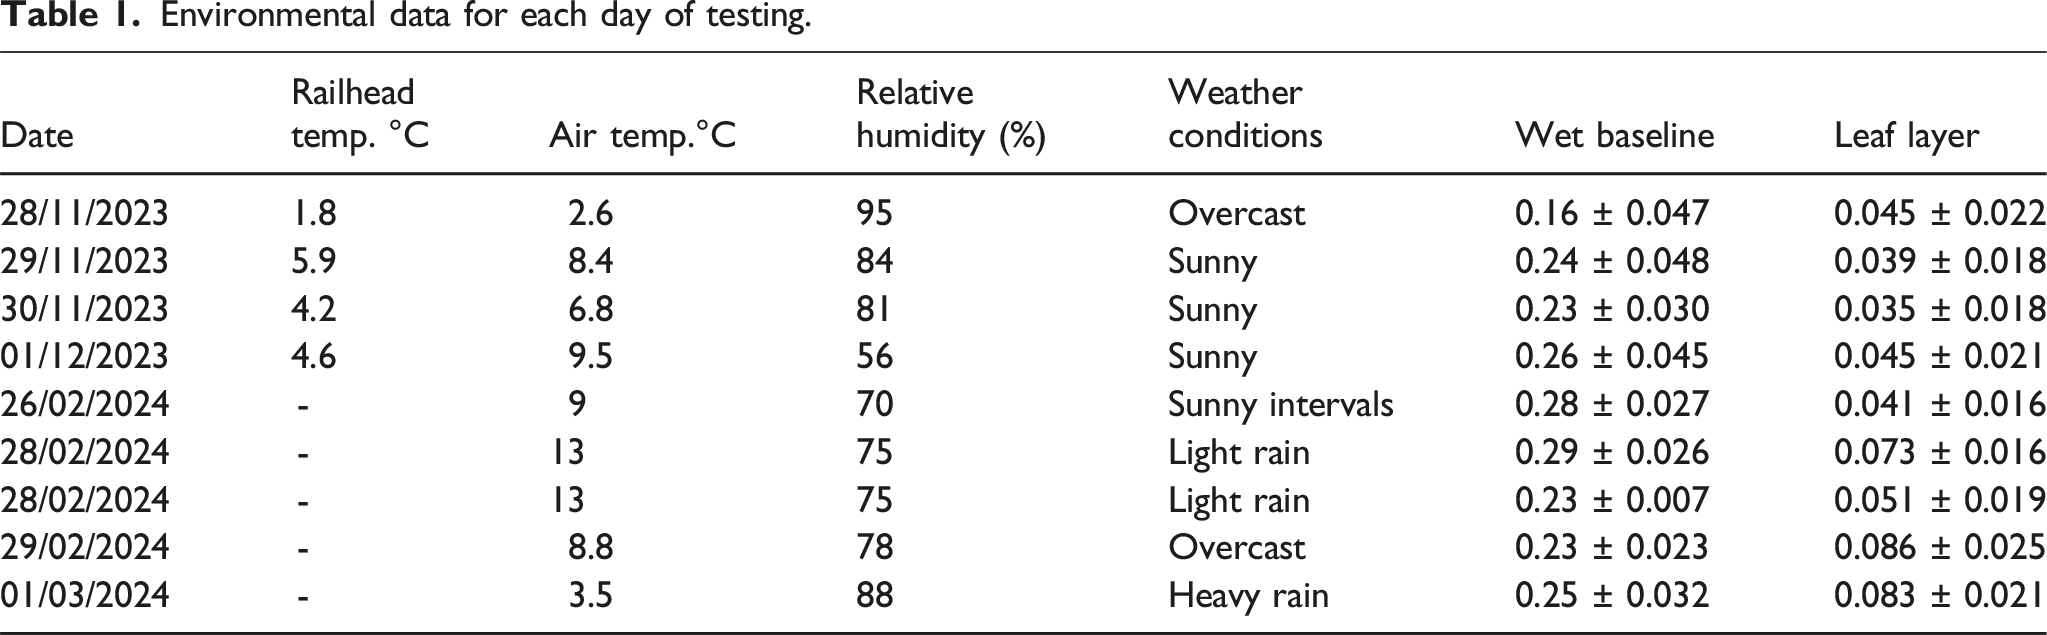
Date
Railhead temp. °C
Air temp.°C
Relative humidity (%)
Weather conditions
Wet baseline
Leaf layer
28/11/2023
1.8
2.6
95
Overcast
0.16 ± 0.047
0.045 ± 0.022
29/11/2023
5.9
8.4
84
Sunny
0.24 ± 0.048
0.039 ± 0.018
30/11/2023
4.2
6.8
81
Sunny
0.23 ± 0.030
0.035 ± 0.018
01/12/2023
4.6
9.5
56
Sunny
0.26 ± 0.045
0.045 ± 0.021
26/02/2024
-
9
70
Sunny intervals
0.28 ± 0.027
0.041 ± 0.016
28/02/2024
-
13
75
Light rain
0.29 ± 0.026
0.073 ± 0.016
28/02/2024
-
13
75
Light rain
0.23 ± 0.007
0.051 ± 0.019
29/02/2024
-
8.8
78
Overcast
0.23 ± 0.023
0.086 ± 0.025
01/03/2024
-
3.5
88
Heavy rain
0.25 ± 0.032
0.083 ± 0.021