
Abstract
Test methodologies originally developed for greases have been adapted to be used for top of rail friction modifiers (TORFMs). This has included: a small-scale benchtop tribometer to measure the tackiness of different TORFMs, attaching an applicator bar to a section of rail and rolling a scaled-wheel through the TORFM applied to the rail head to analyse the effect of different variables on pick-up, and applying TORFM to a full-scale test facility to analyse the scaling effects and the effect of slip, load and speed on pick-up. These methods can be used to measure the relative performance of different TORFMs with respect to how much product is picked up by the wheel. The results have shown that the relative ranking of different TORFMs is the same across the three test scales. This shows that these small-scale test methods that are more suitable for inclusion in test standards could be used to reduce the need for the more time-consuming and expensive larger scale tests, as the relative performance is the same.
Introduction
Top of rail friction modifiers (TORFMs) aim to deliver a targeted friction coefficient in the wheel–rail interface without negatively affecting train operations when braking and accelerating or causing surface damage. For TORFMs the friction ‘target’ is often quoted as 0.3–0.4. 1
There is often confusion in the industry and in academia about what products are called friction modifiers. This work uses a classification defined in a recent paper 1 that attempted to define terms and bring clarity to this issue. From the paper, top of rail (TOR) products are classified according to their drying behaviour with non-drying products called TOR lubricants (e.g. TOR oils, greases and water-based/oil hybrids) and drying products called TOR friction modifiers. This work has focussed on TORFMs that are applied from a wayside applicator initially to develop the test methods themselves. Other TOR products are available, and the methods developed in this work would be equally applicable to them.
Typically, a reservoir next to the track pumps TORFM through hoses to two applicator bars placed on the field side of each rail. The TORFM flows across the rail head forming a puddle. Current products 2 have a liquid phase that is predominantly water based; as the liquid phase evaporates, the solid particles are left behind in the third-body layer on TOR or on the wheel delivering the required friction level. The TORFM is pumped from a reservoir next to the track through an applicator and forms a ‘puddle’ on the top of the railhead. The wheel then picks up the TORFM as it rolls along the rail. Products are wet near to the applicator and material transfer takes place between the wheel and the rail; once the product is dry, there is little material transfer. 1 Solid stick friction modifiers do exist as well and these sticks encapsulate the friction modifier in a carrier material, which is applied directly to the wheel and as the stick wears, the friction modifier material is transferred to the wheel. These are not considered in this work.
There is a large volume of research that covers the benefits of TORFMs (see the next section), but there is little published work that analyses how a TORFM is picked up from a wayside applicator to the wheel. There is also currently no testing standard for TORFMs although the European Committee for Standardisation (CEN) is currently developing a standard to encompass all friction management products. Therefore, there is a need for laboratory-based tests that mimic the wheel–rail interaction with a wayside TORFM applicator as well as small-scale test methodologies that can compare between different products quickly and easily.
The aim of this work was to develop test methodologies that can be used to analyse the pick-up of TORFMs by the first wheel in the laboratory. This included different test scales to corroborate the small-scale results with larger more realistic test scales. Three TORFMs were chosen to study if the different test methodologies/scales gave the same performance ranking between them. Focussing on the first wheel simplifies the pick-up process in order to develop repeatable test methodologies that can provide comparisons between different TORFM products.
Friction modifier research
The benefits of TORFMs are well documented. They primarily aim to reduce rolling contact fatigue, wear, noise and corrugation thereby reducing maintenance requirements and improving safety. This is achieved through improving steering in curves, and hence reducing lateral forces and a reduction in stick-slip oscillations.3–11 They allow greater deformation of the third-body layer and therefore maintain positive friction characteristics up to higher creep rates. Positive friction characteristics are when friction increases with respect to increasing creep. 12 Fuel consumption of a train would be reduced due to reduced rolling and curve resistance when using a TORFM.11,13 A field study of a passenger transit system showed no negative effects of TORFMs on traction or braking. 14 They have also been shown to have no effect on track isolation, 15 although this was for solid stick rather than TORFMs. This is important, as introducing new materials into the industry can raise questions about the safe running of trains and so the lack of effect of the TORFM on impedance is a positive factor.
Most of this research has been in the field, which is costly in terms of time and money. The laboratory tests found in the literature have focussed on the benefits of the TORFM rather than the practical implications of how much product is picked up and the variables which affect this, such as lateral displacement of wheel, how much product is pumped, speed of wheel, position of applicator, etc.
There has been some work recently done that has developed test methodologies in the laboratory to measure these variables for curve lubricants. A recent paper has developed a tackiness test for grease. 16 This involves an approach-retraction method, which squeezes grease between two specimens and measures the force required to separate the specimens. This paper analysed the force–distance graph produced and calculated the work done to break the grease strings and thus defined the tackiness for different greases. It suggested a link between a grease with more tackiness, leading to a higher pick-up when a wheel is rolled along a grease applicator. However, this hypothesis has not been tested in the field yet. Additionally, another paper 17 has shown how a test method using a scaled-wheel can be used to evaluate different applicator bars and pump parameters to optimise grease application. It is expected that both these methods can be modified to be used for TORFMs.
Tackiness is one property that could affect pick-up of products from wayside applicator bars. Tackiness is defined as the ability of a substance to form strings. For TORFMs, tackiness is only relevant whilst the material remains wet and is transferred between the rail and the wheel near to the application site. Tackiness could be important as if the product is too tacky, then it will not be transferred easily to the wheel, whereas if it is not tacky enough then it will run off the rail before the wheel picks it up. Therefore, there is likely to be an optimum value of tackiness, but this is not known. The tackiness test could provide a relative ranking between products.
Test methodology
Tackiness
A test method originally developed for curve lubricants
16
was used to evaluate the tackiness of four variations of the same TORFM. No adaptation of the test method was needed. This was because even though the method was developed for gauge corner products, it is purely representative of the relative tackiness between the products, rather than representing gauge corner–wheel flange contact that occurs in curves. The tackiness of the product will change as it dries out; therefore, this test only relates to the initial passing of a wheel over the applicator site. A Bruker Universal Mechanical Tester was used for this work as it is extremely adaptable. Upper and lower specimens were machined from stainless steel with an upper specimen diameter of 29 mm. The upper specimen is moved under force control with the force recorded throughout the test using a 50 N load cell. Figure 1 shows a schematic of the test procedure.
Schematic of the test.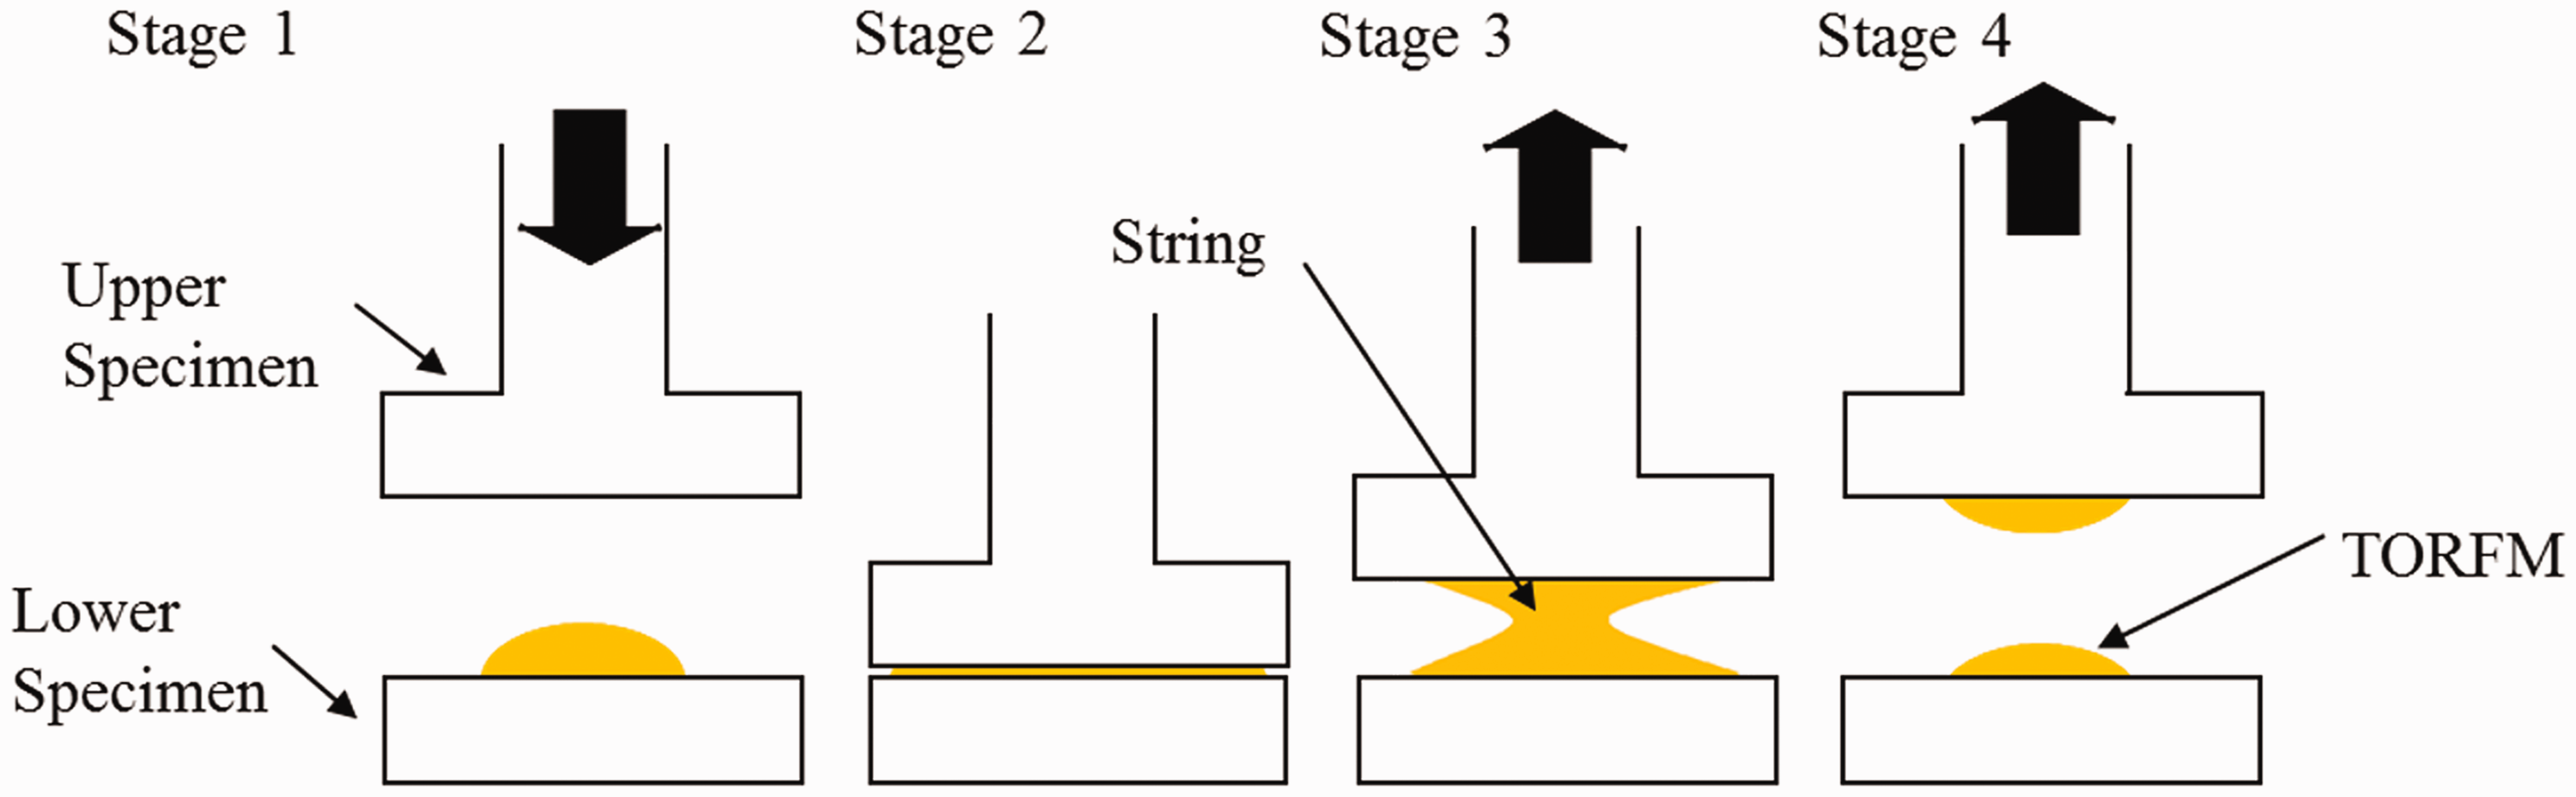
Smooth specimens (Ra = 0.6 µm) and rough specimens (Ra = 3 µm) were also tested to see the effect of roughness on the results. All the combinations of FM and roughness were tested at least three times to demonstrate the repeatability of the method.
The test was repeated on FM-C and FM-D a few months after the main study. The two products were from a different batch from the same supplier. Additionally, the laboratory/test environment was not controlled. This means that a small difference in the environmental conditions would be expected between the two data capture periods (although the environmental conditions were not recorded). How these repeat results are comparable to the previous results gives an indication of how robust the test method is.
The graphs presented later (Figures 2 and 3) show data just for the retraction part of the test (stages 3 and 4 in Figure 1). The graphs show that the force in the friction modifier is initially in compression (negative value) and starts to rise. The force increases to a peak value. After the peak force, separation has started, and the force tends to be zero as the strings break. The area under the force–displacement curve is the work required to break the TORFM strings; a MATLAB script calculates the size of this area. Since tackiness of a product is often defined as the ability of the product to form strings or threads,
18
the size of this area is referred to as the tackiness of the product in that test. The force is not representative of the wheel–rail contact. This is not an issue, as this test is about establishing relative performance between products rather than replicating the wheel–rail contact more closely.
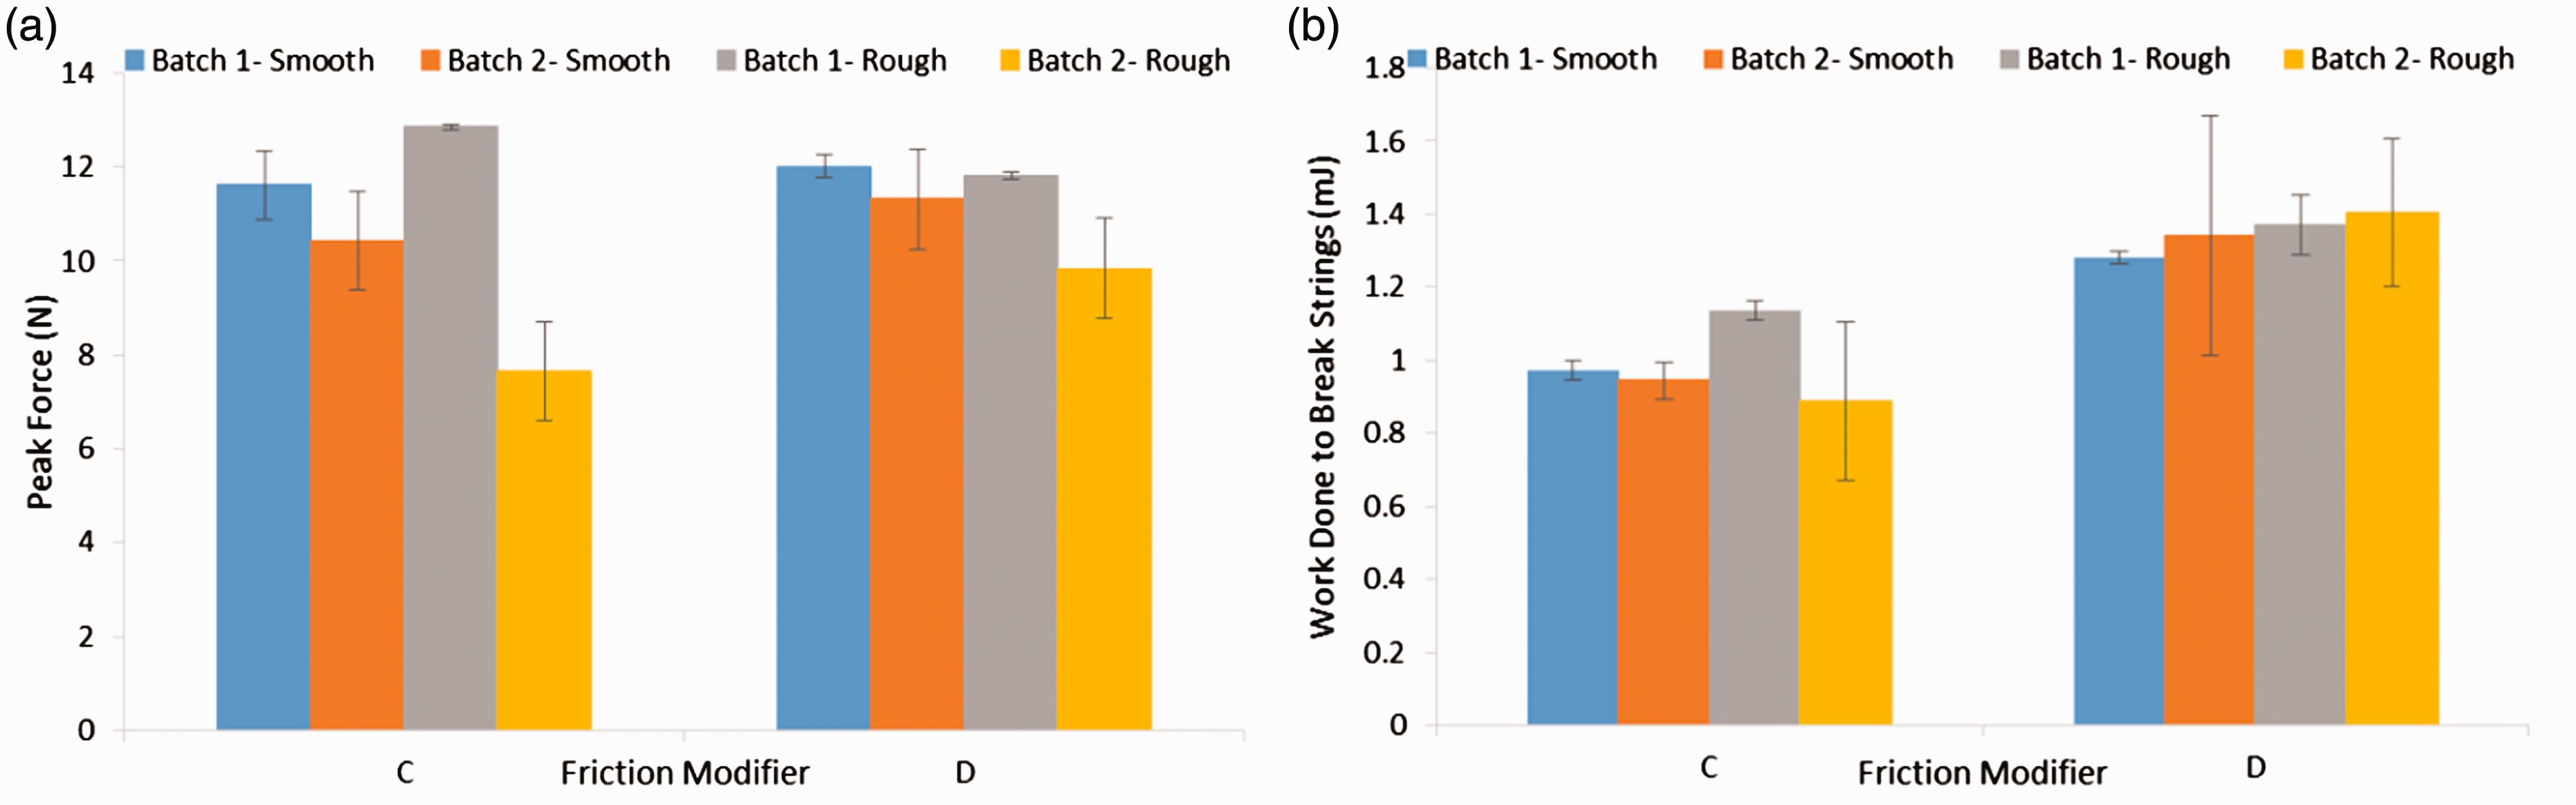
(a) Peak force during separation for TORFMs and specimen types; (b) work required to break strings during separation for both TORFMs and specimen types. (a) Peak force for two TORFMs from two different batches; (b) work done to break strings for two TORFMs from two different batches.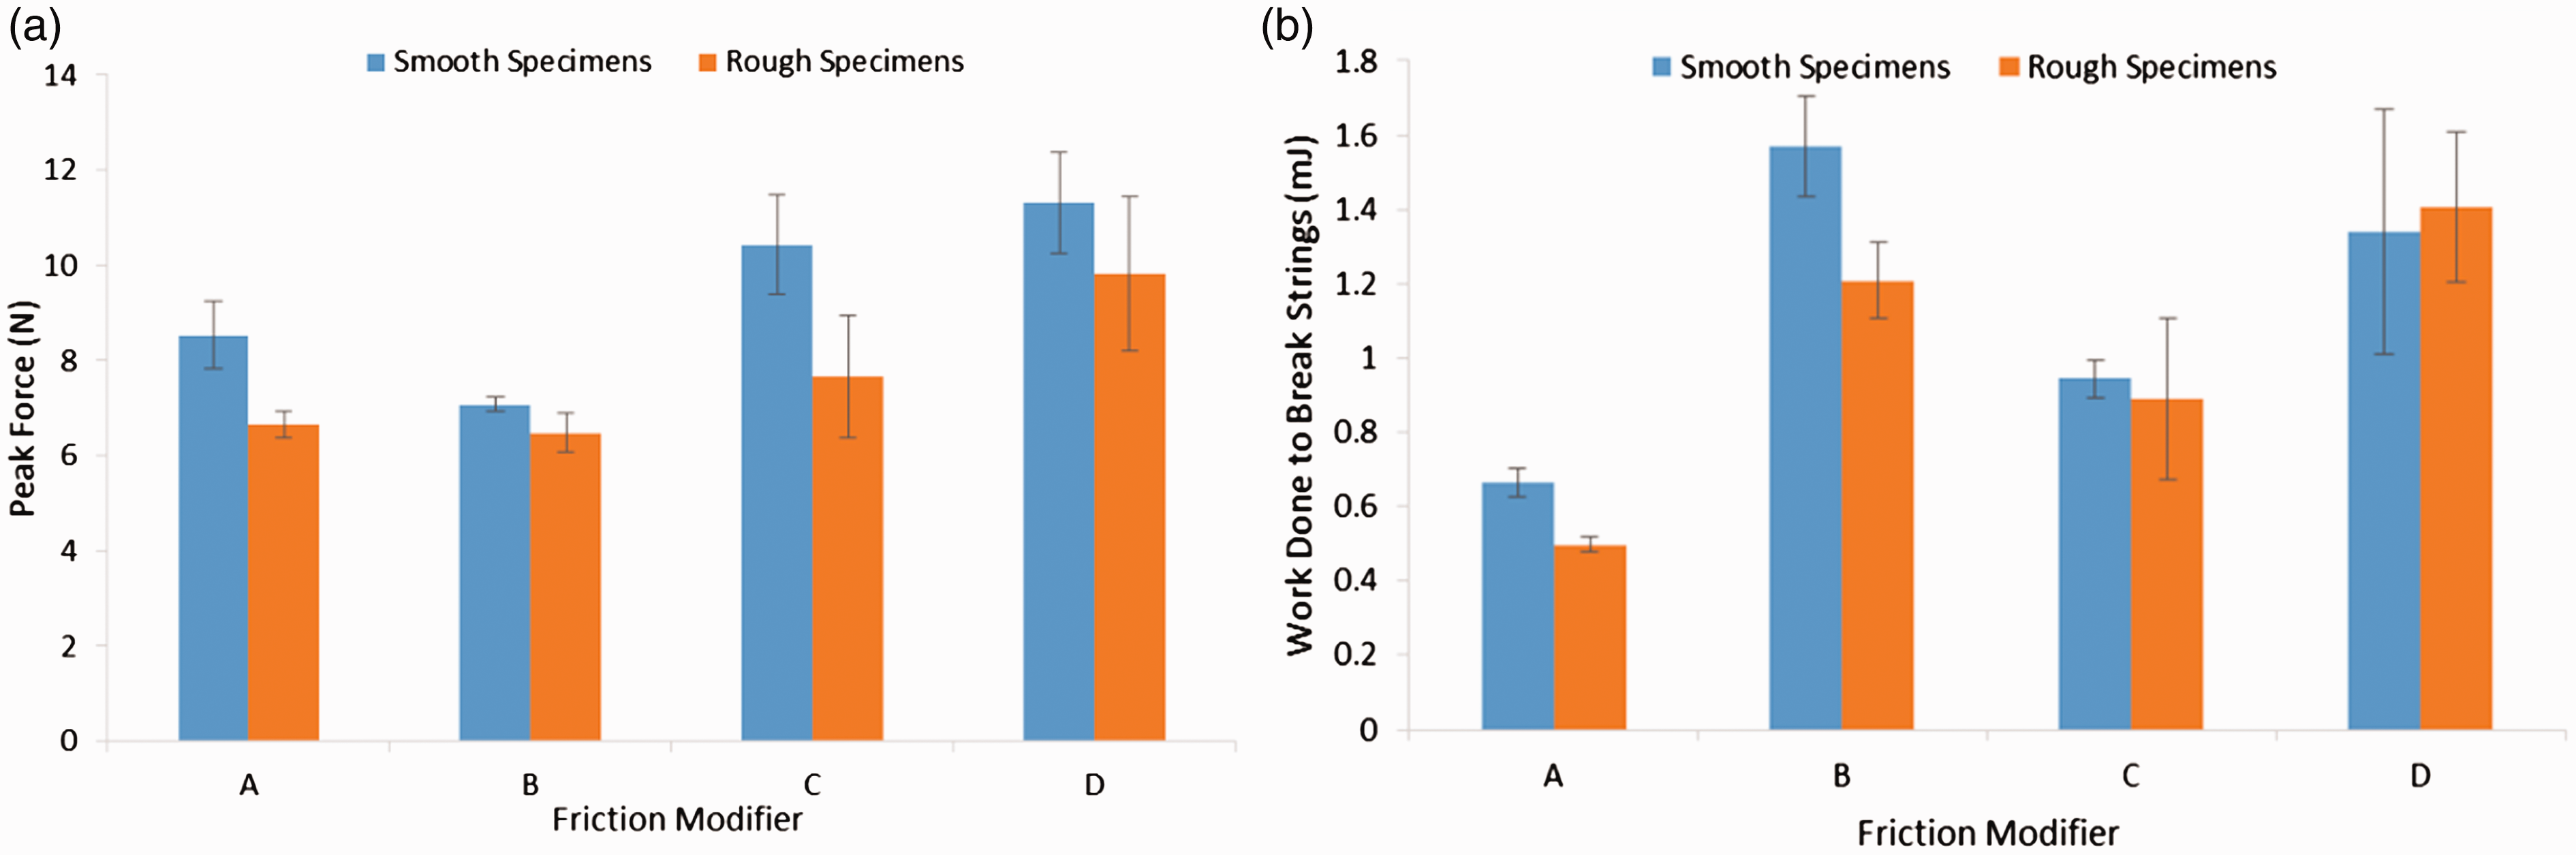
Scaled-wheel rig pick-up
A scaled wheel rig (SWR) was used to measure the pick-up of three variations of the same TORFM. The TORFMs used were the same batch of product as used in the “Tackiness” section. Only three out of the four TORFMs were tested, as there was not enough of FM-D available to carry out this test. A TOR-ML applicator bar 19 was attached to the rail. A hand pump was used to pump the TORFM through the applicator. The scaled-wheel was rolled along the rail through the ‘puddle’ of TORFM. The weight of TORFM transferred to the wheel during the roll was measured using a mass balance (accurate to ±0.005 g).
Initially, different parameters were tested using one TORFM before the different TORFMs were compared. This was done to see how different set-ups and pump amounts affected the pick-up. Four different pump amounts were tested. The amount of TORFM pumped out varied between TORFM (due to different viscosities) and between repeats. Therefore, the mass of the TORFM that the applicator outputted was weighed and the results averaged to give an average output for each pump amount and TORFM. The bar was set at two height positions. The ‘low’ position is the height that the manufacturers specify in their manual 19 and the ‘high’ position was set 2.5 mm higher. The amount of pick-up was measured after one-wheel pass through the puddle of TORFM. All parameters were tested at least three times and averaged to gain the mean value of the TORFM pick-up. The standard deviation was calculated and plotted onto the results as well.
After this initial phase of testing, the pick-up for the three different TORFMs was measured. This was done by rolling the wheel through the puddle of TORFM and weighing the TORFM picked up by the wheel. The wheel was rolled a further four times, weighing the amount of pick-up each time and not pumping any more TORFM between wheel passes. This gave a total of five wheel passes, which simulates five axles of a train passing. Typically, 20 axles pass before reapplication of TORFM, but this number can be lower. Five-wheel passes were chosen because after this amount the TORFM measured was zero or close to zero. This simulates the first carriage and the first wheel set of the second carriage passing over the applicator. Different pump amounts and wheel lateral displacements were also tested for one-wheel pass to corroborate the initial test findings.
The wheel profile used is P8 and the rail is BS113. Different profiles will affect the pick-up of products as the running band, and therefore how much product the wheel contacts will change. For the purposes of these test methodologies, keeping the profiles constant is important when comparing products to ensure that the differences seen in pick-up amounts are caused by the differences in products, rather than the difference in the rail profile. It follows that by keeping the product the same, and varying the profiles used, could be a way of optimising the wheel and rail profiles to improve pick-up. This is outside the scope of this work and could be an area for future development.
Full-scale test facility pick-up
The full-scale test facility (FSTF) 20 was used to measure the pick-up of three variations of the same TORFM on a full size wheel. The TORFMs used were the same batch of product as used in the following sections. The TOR-ML applicator does not fit onto this test rig. Therefore, a hand pump was used to apply TORFM directly to the TOR. It was chosen to apply the puddle to the middle of the railhead, as if it was applied more to the field side of the rail, the the TORFM flowed down the side of the rail before the wheel rolled over the puddle. This will mean there is a difference between FSTF and SWR absolute values, but a relative ranking of the three TORFMs will still be attained.
Initially, how the pick-up of TORFM to the wheel changed with different pump amounts, wheel lateral displacement, slip and applied load was studied with one TORFM. This was done by applying a set amount of TORFM, rolling the wheel through the puddle once and weighing the mass of TORFM picked-up on the wheel using paper towels and a mass balance accurate to ± 0.005 g.
After this initial phase of testing, the pick-up for the three different TORFMs was measured. This was done using the same method as for SWR detailed in the “Scaled-wheel rig pick-up” section. As the amount the hand pump outputs varies between pumps, a syringe was used to apply the TORFM to the rail to ensure that a constant volume was applied to the rail each time.
Results
Tackiness
Figure 2(a) shows the average peak force for all the TORFMs and for both specimens’ roughness. For all the TORFMs, there is a reduction in the peak force from the smooth to the rough specimens. The error bars show the standard deviation from the three results and so one result can cause a large spread.
Figure 2(b) shows the work done to break the strings during separation. There are large error bars. For all the TORFMs except FM-D, the rough specimens cause a reduction in the work done to break the strings.
Figure 3(a) shows the peak force for two different batches of two TORFMs. It is immediately apparent that the standard deviation is consistently higher for the second batch. This could be caused by batch two being stored for a longer period. This would allow separation within the product to occur, which is not fully remixed. Both products were mixed the same way (by hand) prior to the tests being performed. For the smooth specimens, FM-D has a higher peak force than FM-C (although batch two produces a slightly lower value). For the rough specimens, the FM-D has a lower peak force than FM-C from batch one, but this is reversed in batch two. This is likely to be caused by the separation/inadequate mixing problem mentioned already.
Figure 3(b) shows the work done to break strings for two different batches of two TORFMs. As in the previous figure, the standard deviation is much higher in batch two. The same relationship between FM-C and FM-D is seen in both batches for both specimen’s roughness (FM-C is less tacky than FM-D). Considering the large spread of data, there is a reasonable correlation between the two batches. FM-C has a slightly lower result for batch two than batch one (especially for the rough specimens), whereas FM-D has a slightly larger result for batch two than batch one.
Looking at the individual test results for batch two, the spread in the results was caused by one significantly different result from the other two repeats. Removing this repeat causes the standard deviation to fall to 0.13 from 0.32, which is a similar deviation to batch one (which had a deviation of 0.09). This supports the theory that separation of the product, and not fully remixing the product before testing caused the spread. This is because there is agreement between two out of the three tests, which show that the product is mostly mixed, but occasionally a significant change in tackiness/adhesion caused by a less well mixed part of the product ending up on the test specimen.
Scaled-wheel rig pick-up
Figure 4 shows how the amount of TORFM picked up by the wheel changes as the height of the applicator bar, the amount pumped out and the wheel lateral displacement change. Clearly, the more the TORFM pumped out, the more it is picked up by the wheel. This is because pumping more out results in a bigger puddle on the railhead and allows more TORFM to flow across the rail and enter the wheel–rail contact band. The high position of the bar results in more TORFM picked up by the wheel. This is because the high position results in slightly more of the TORFM flowing across the railhead, meaning that the wheel contacts a larger amount of TORFM. In the low position, with the extra small amount of TORFM pumped out, no pick-up of TORFM was recorded. This was because the puddle produced was not large enough to be in the wheel–rail contact zone. There is not much change in the pick-up with lateral displacement of the wheel. This is because the profile of the wheel does not change much in the wheel tread– railhead contact zone. All the tests show small standard deviation in the results, which shows that the tests are repeatable.
Variation in SWR TORFM pick-up with changes in the wheel lateral displacement.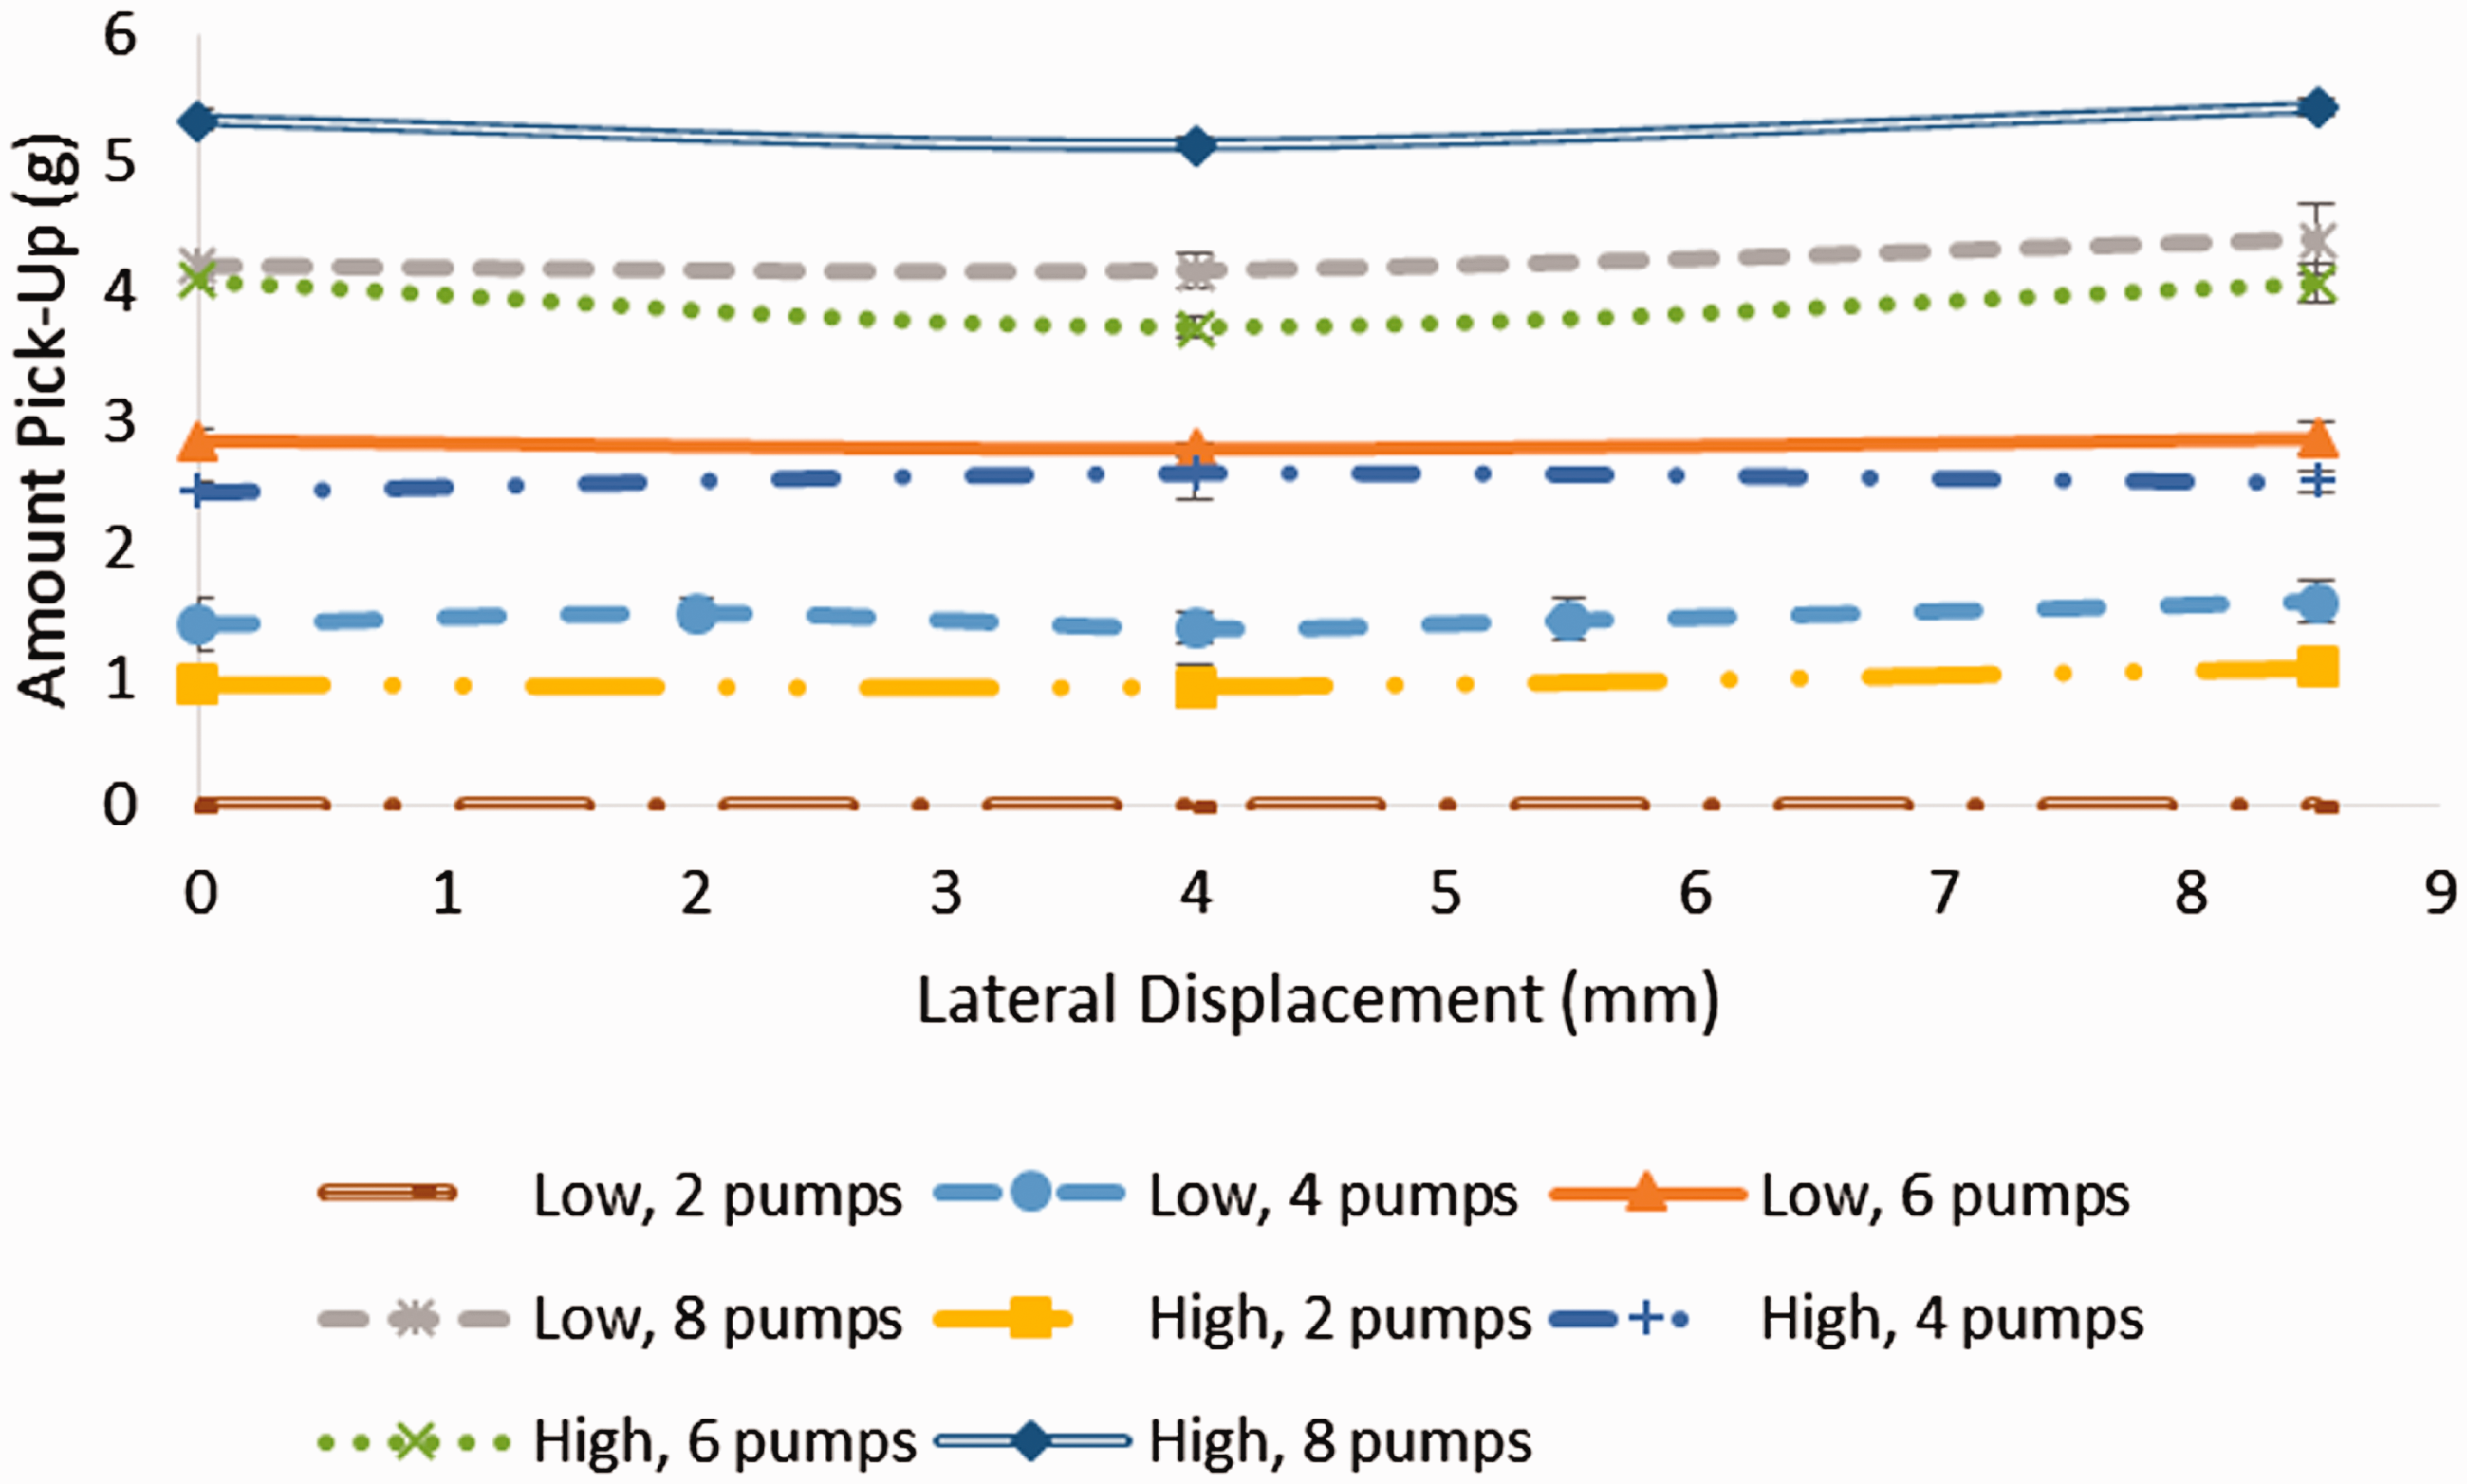
Figure 5 shows the average amounts pumped out, average amount of pick-up and the percentage picked up for different pump amounts. The same conclusions as shown in Figure 4 can also be seen in this figure. Additionally, for the high applicator bar position, more TORFM is pumped out for the same pump levels. This is based on where the outlet of the applicator sits in relation to the curve of the rail. The high applicator position means that less of the outlet port is ‘blocked’ by the rail meaning that it is easier for more of the product to flow across the rail. The applicator in the high position also results in a higher percentage being picked up by the wheel. Again, this is because more of the TORFM flows further across the railhead and into the contact band.
Variation in SWR pick-up with different test parameters for one-wheel pass for (a) low applicator bar, (b) high applicator bar.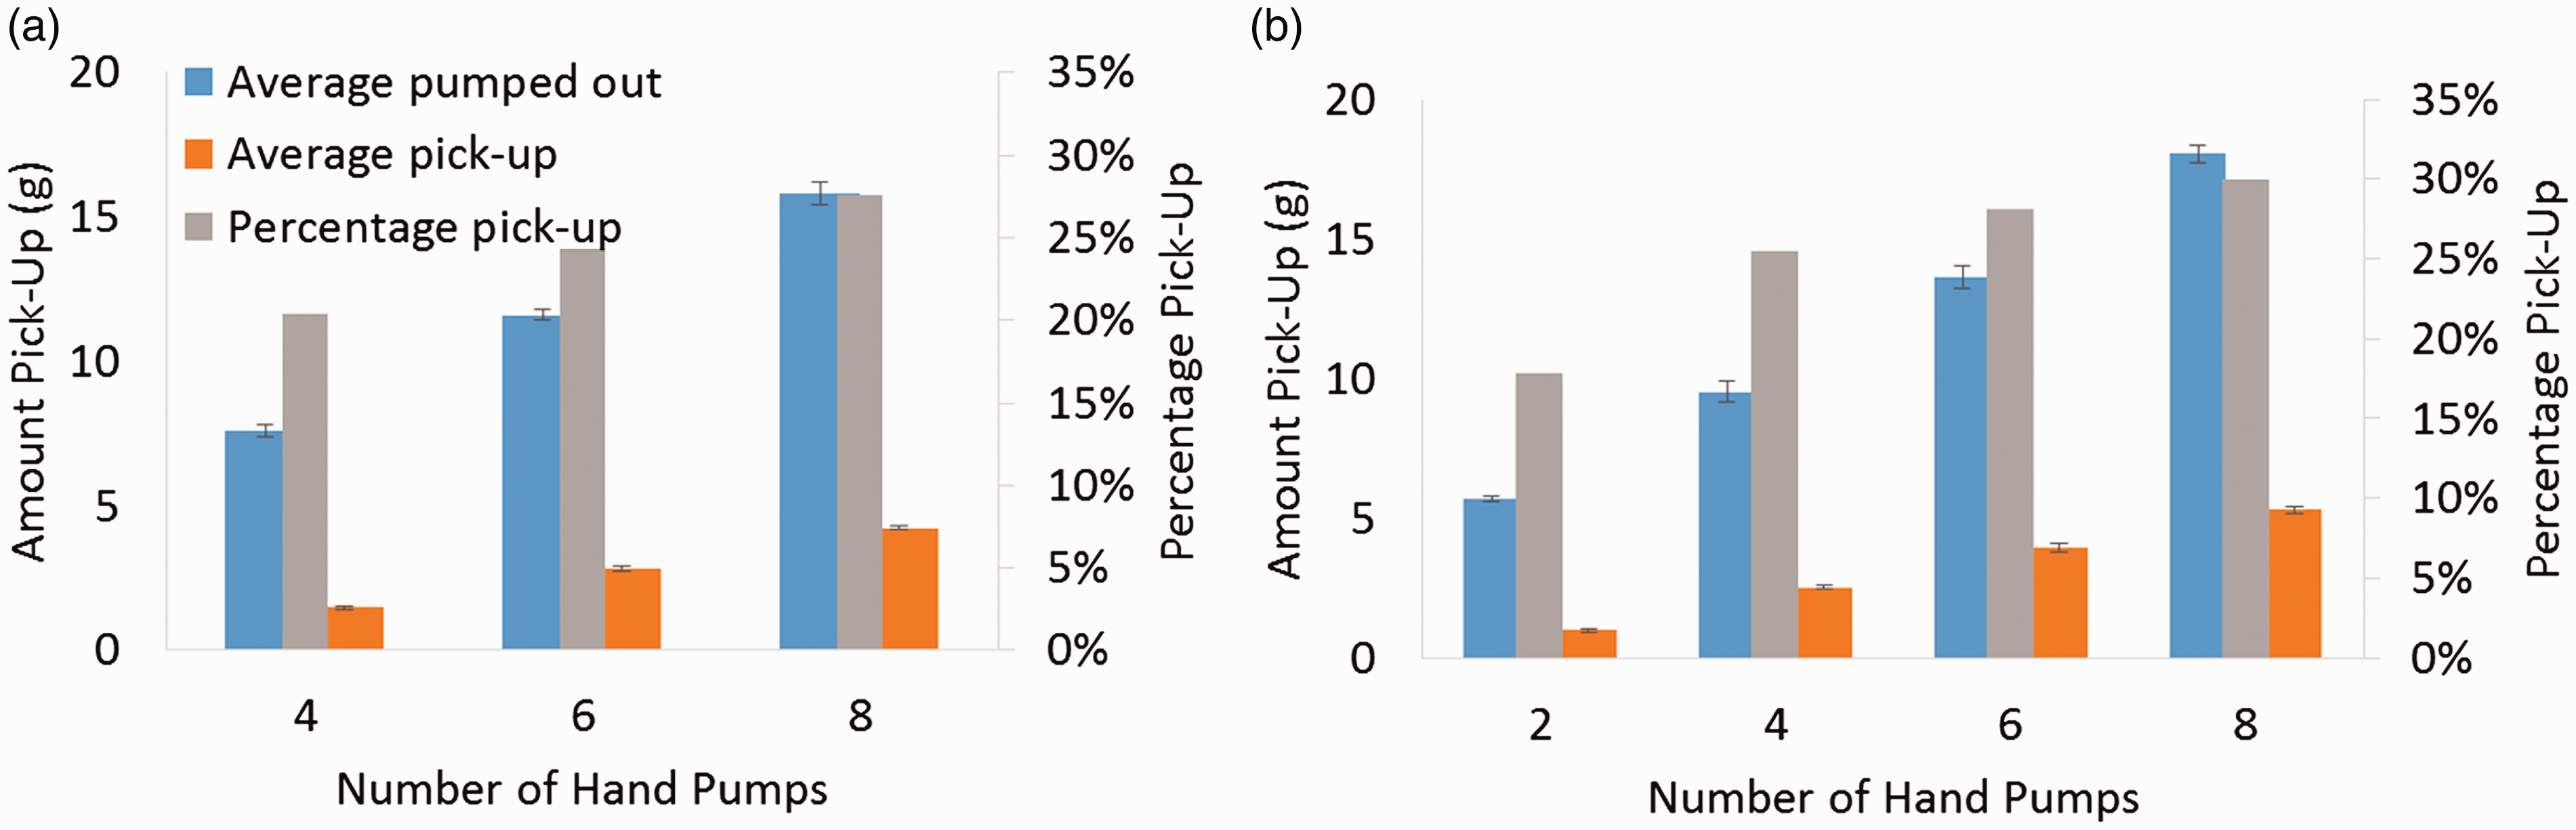
Figure 6 shows the amount picked up at different lateral displacements for three different formulations of the TORFM. All these tests were carried out at the low applicator bar height, as this is the height specified by the manufacturer. The same relationships displayed in Figure 4 are shown here for all three TORFMs. Increasing pump amount increases the pick-up of TORFM and lateral displacement has little effect on the pick-up amount.
SWR TORFM pick-up at different lateral displacements after one wheel pass for (a) TORFM-A, (b) TORFM-B, (c) TORFM-C, (d) average SWR pick-up for multiple rolls of three TORFMs.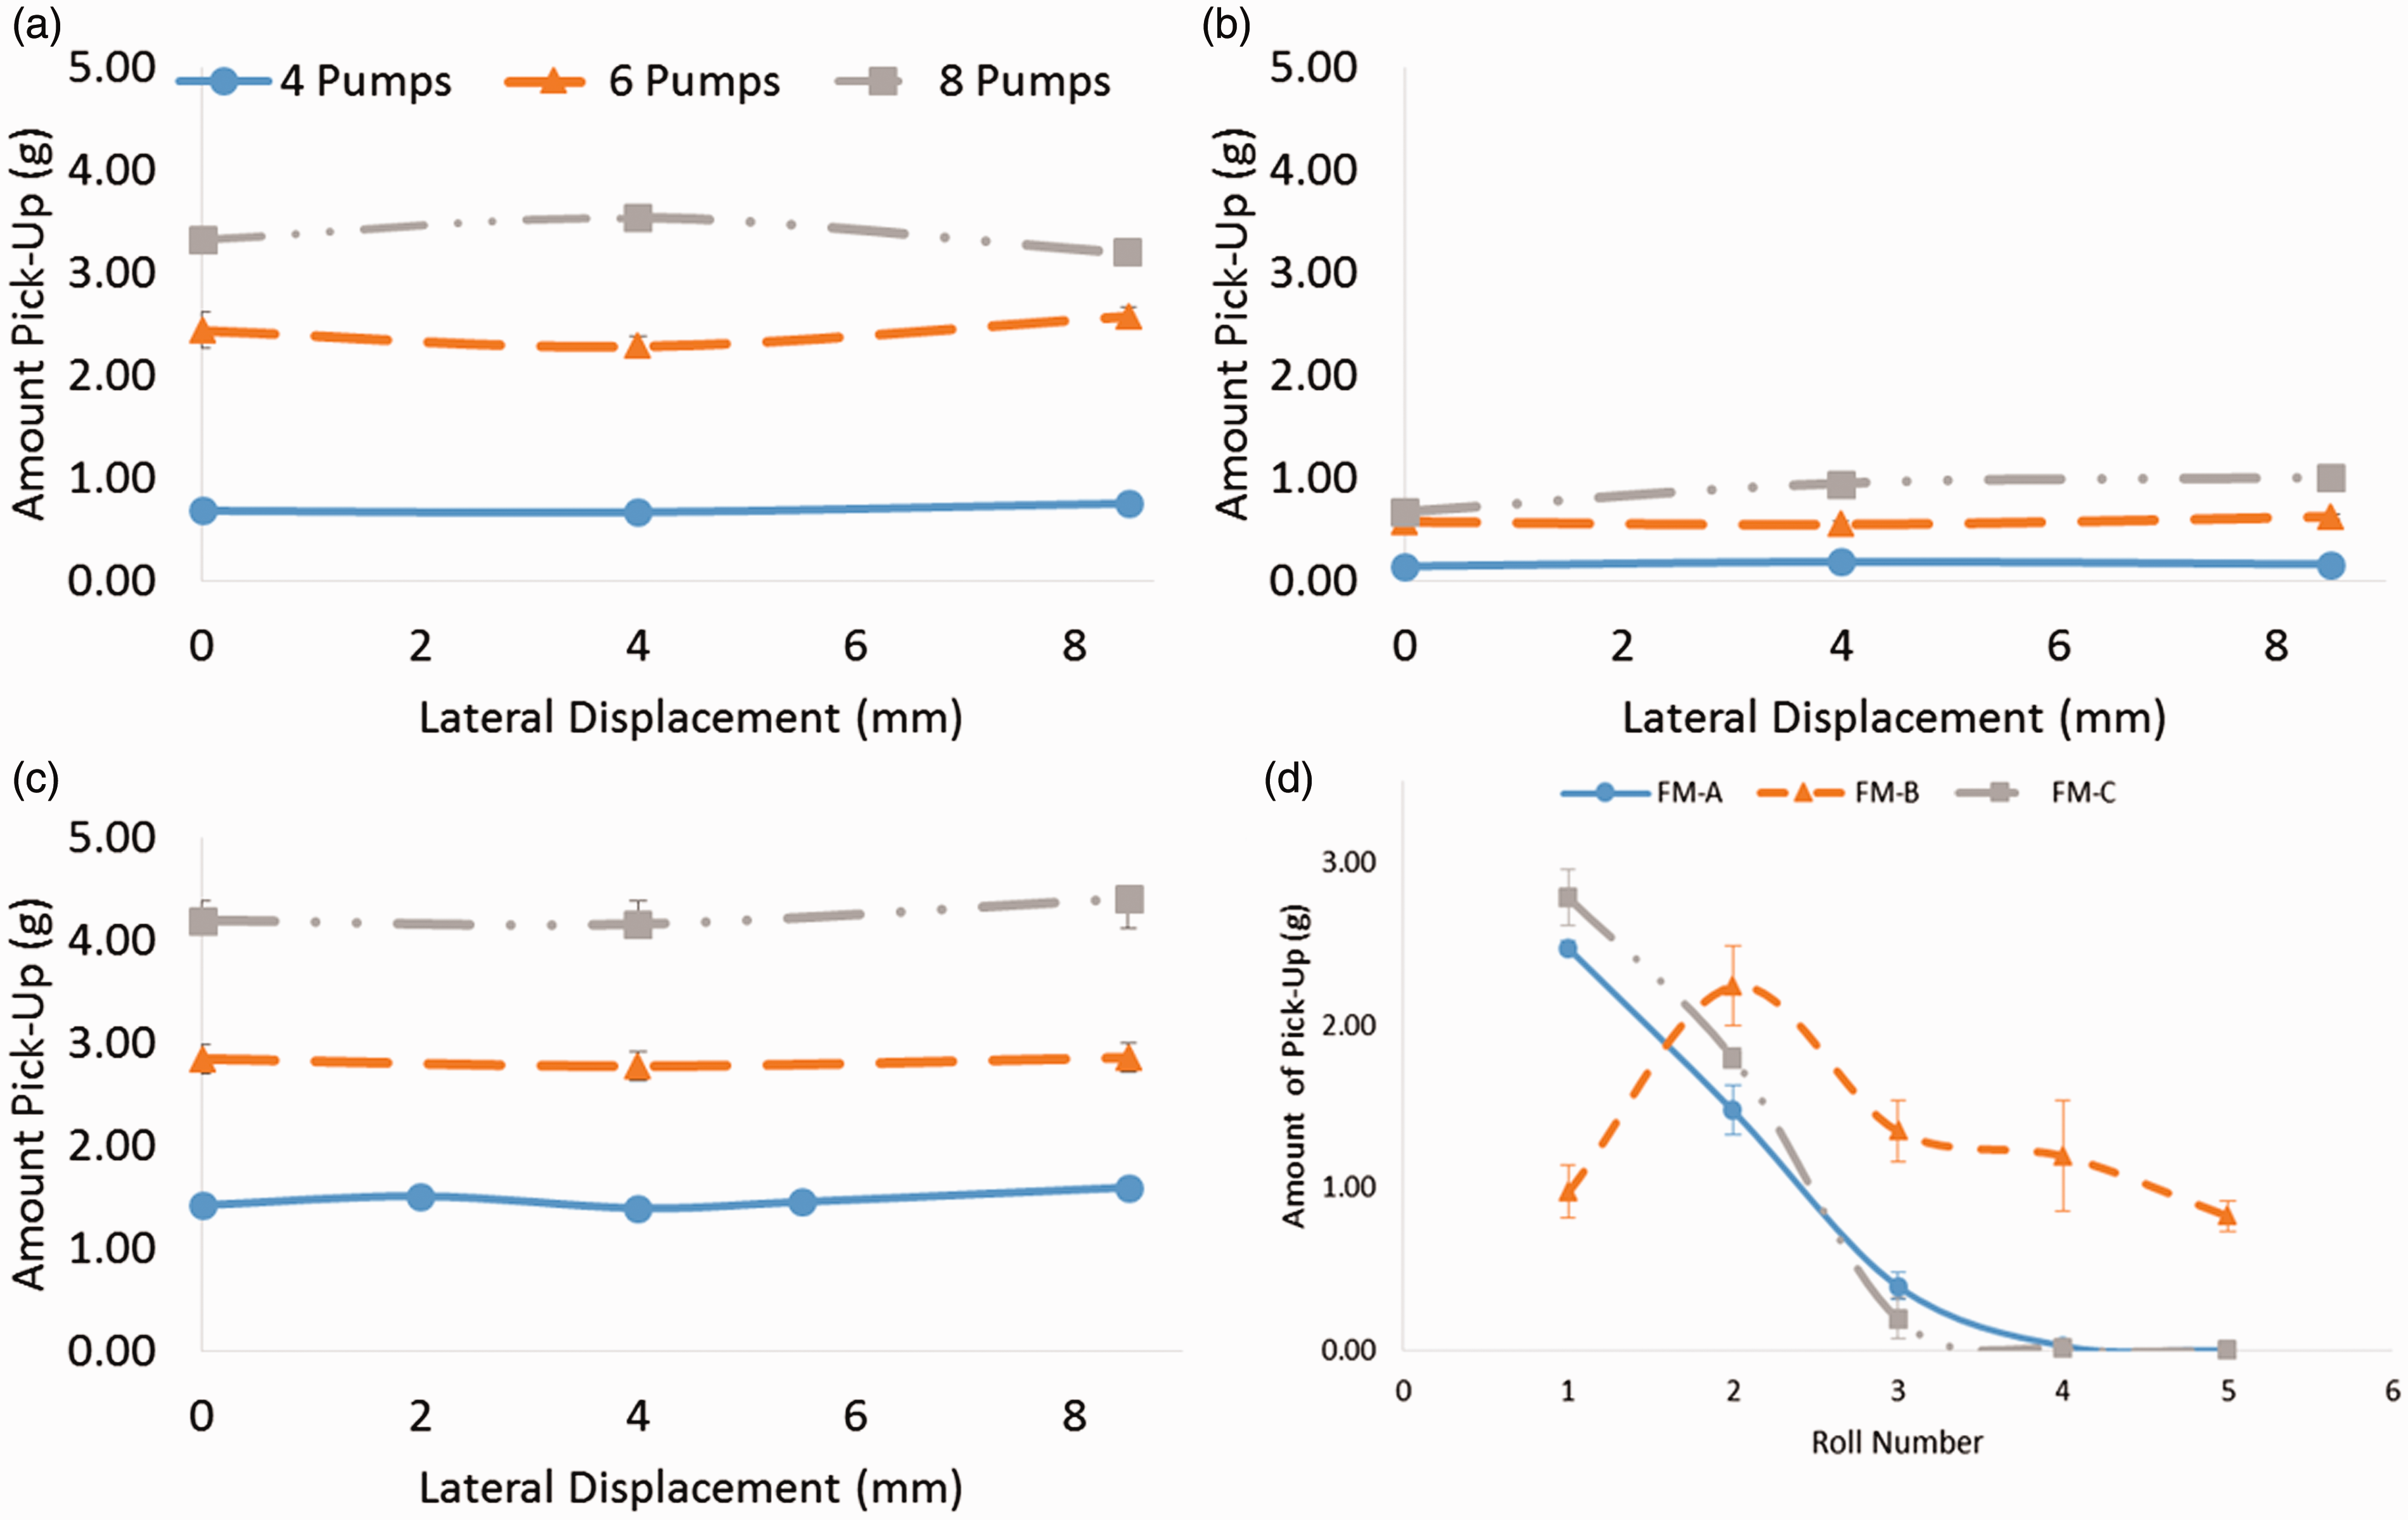
Figure 6(d) shows how the pick-up changes when the wheel is rolled multiple times through the same puddle for three different TORFMs. For TORFM-A and TORFM-C there is a decrease in pick-up with each roll, until no pick-up of TORFM is recorded. For TORFM-B the relationship is different. There is an increase in pick-up from roll 1 to roll 2, and then a decrease with each subsequent roll. This is because TORFM-B is much more viscous and tackier than the other two TORFMs. The first roll of the wheel picks up little TORFM but drags more of it across the rail. Therefore, when the wheel next passes there is more of it in the contact band for the wheel to pick-up. The more viscous nature of TORFM-B means that more of it stays in the contact band, whereas the other two TORFMs flow more easily and spread across the rail more, flowing out of the contact zone. This means that there is more TORFM-B available on subsequent rolls resulting in greater pick-up even on rolls 4 and 5. The relationship between viscosity and tackiness is not explored here, as this work focuses on the development of the test methods but could be an area for future work to understand the fundamental principles behind differences in the pick-up performance.
Figure 7(a) shows how the total pick-up from five rolls of the different TORFMs varies, as well as the percentage of TORFM pumped out that gets picked up by the wheel. TORFM-B has a higher overall pick-up due to reasons mentioned above and if the test is extended for further rolls, the difference between it and the other two TORFMs would grow as the pick-up had not reached zero on wheel pass 5. TORFM-A has a lower pick-up percentage than TORFM-C.
(a) Variation in SWR total pick-up for different TORFMs. (b) Pick-up from one roll on two different days.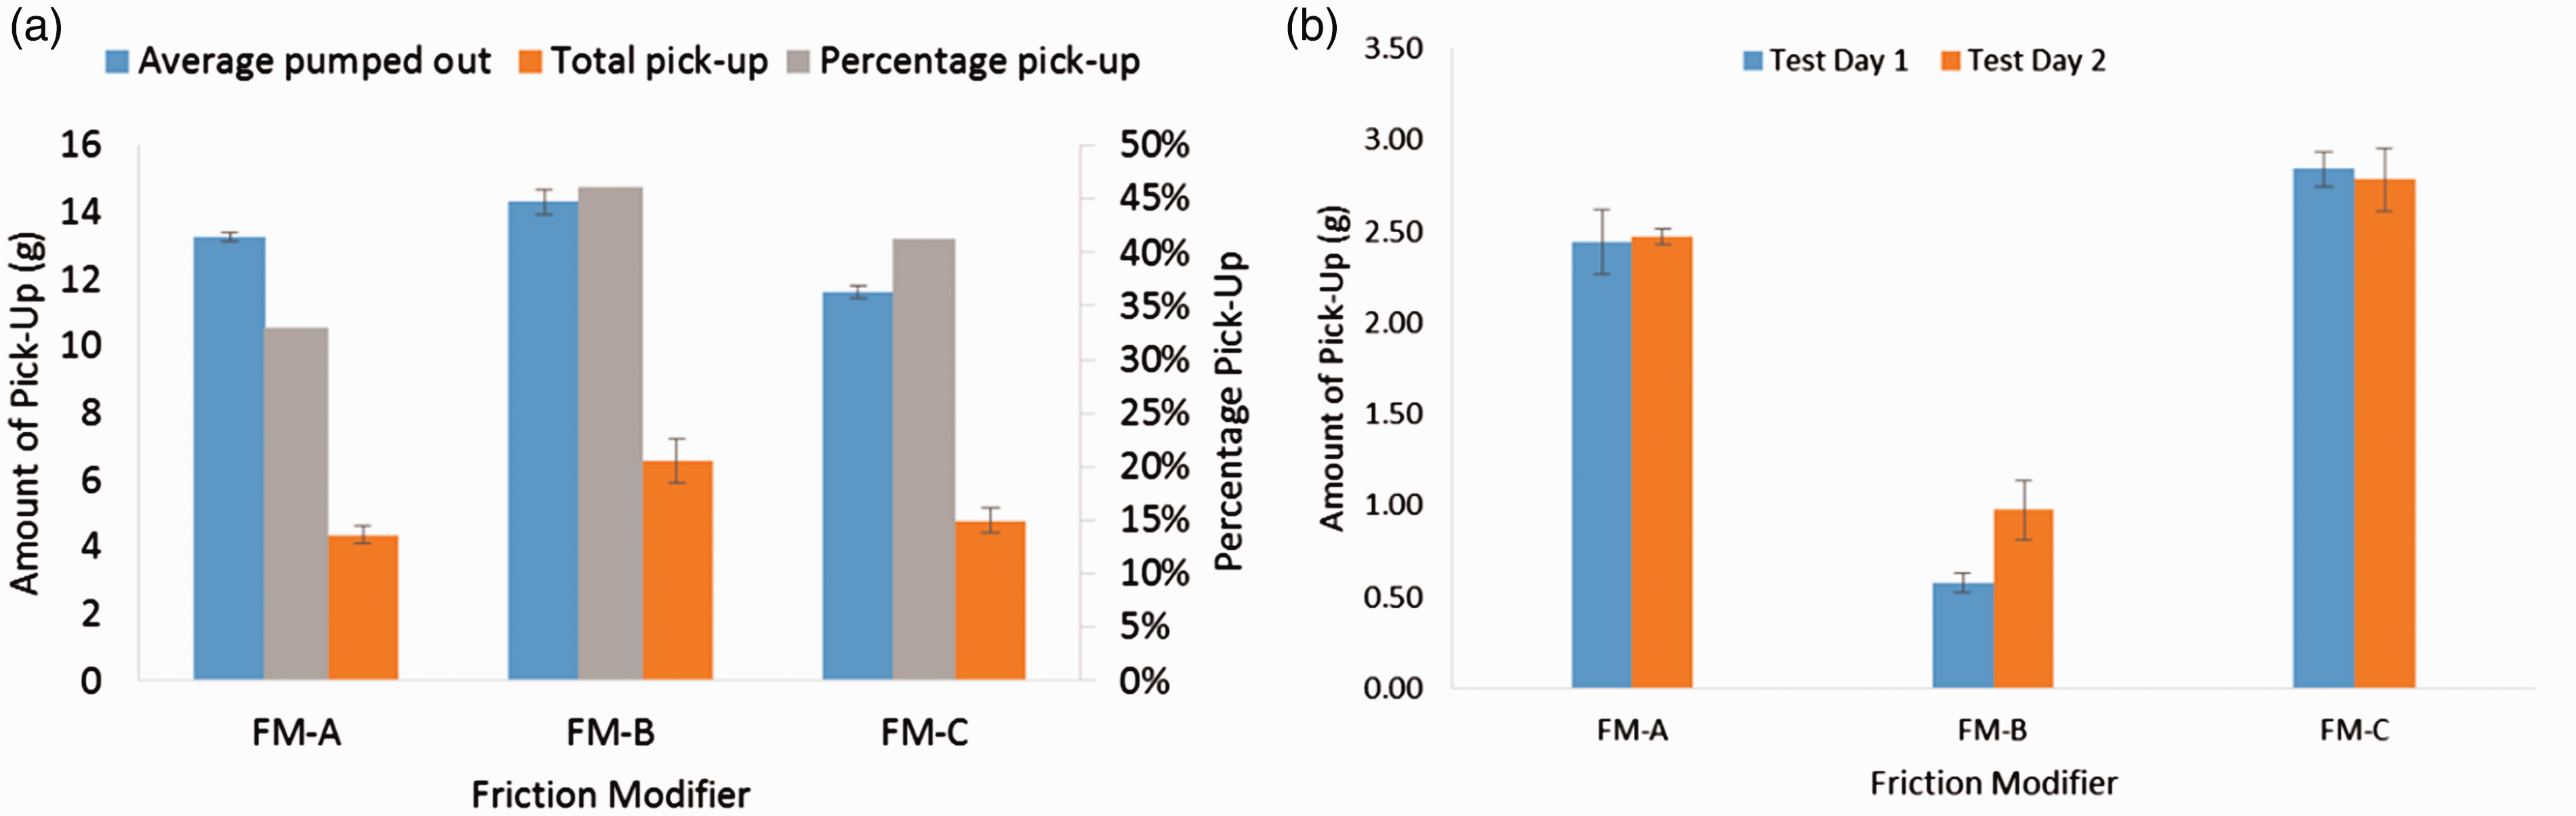
Figure 7(b) shows the pick-up during one roll on two separate testing days that took place one month apart. TORFM-A and TORFM-C values are very close, whereas there is a difference in the value for TORFM-B. The order of TORFM in terms of pick-up is the same on both days. This is more important than the absolute values. The differences are caused by environmental differences in the laboratory. The temperature/humidity was not recorded, but depending on what other test rigs are running, outside temperature, etc., the environment changes. Therefore, it is beneficial that the environment is not shown to change the ranking of which TORFM is better for pick-up.
Full-scale test facility pick-up
Figure 8 shows how the pick-up varies under different conditions. Figure 8(a) shows that as the pump output is increased, the amount of pick-up also increases due to there being more product available on the rail. However, if the amount on the rail increases too much it spills over the edge of the rail and is lost. Therefore, there is a change in gradient in the curve. For future tests, the amount of TORFM pumped out should be below 4 g to ensure that the TORFM stays on the rail where it will be used. The spread of the pump output between repeats in Figure 8(a) is because the pump does not output a uniform amount each time. Therefore, a syringe was used for further tests as the amount of output can be more carefully controlled. Figure 8(b) shows that there is a small increase in the pick-up with an increase in the lateral displacement. Figure 8(c) shows that increasing slip increases the pick-up of TORFM. However, the increase is very small and there is an overlap between the error bars for the two slip levels tested. Figure 8(d) shows that increasing the contact force between the wheel and the rail decreases the pick-up. This is because the increased force causes more of the TORFM to be squeezed out of the contact as the wheel rolls across the pool of TORFM. These loads correspond to contact pressures of approximately 900–1500 MPa and so relate to the differences between passenger and freight vehicles.
Variation in FSTF TORFM pick-up with (a) change in the pump output, (b) lateral displacement, (c) slip, (d) applied load.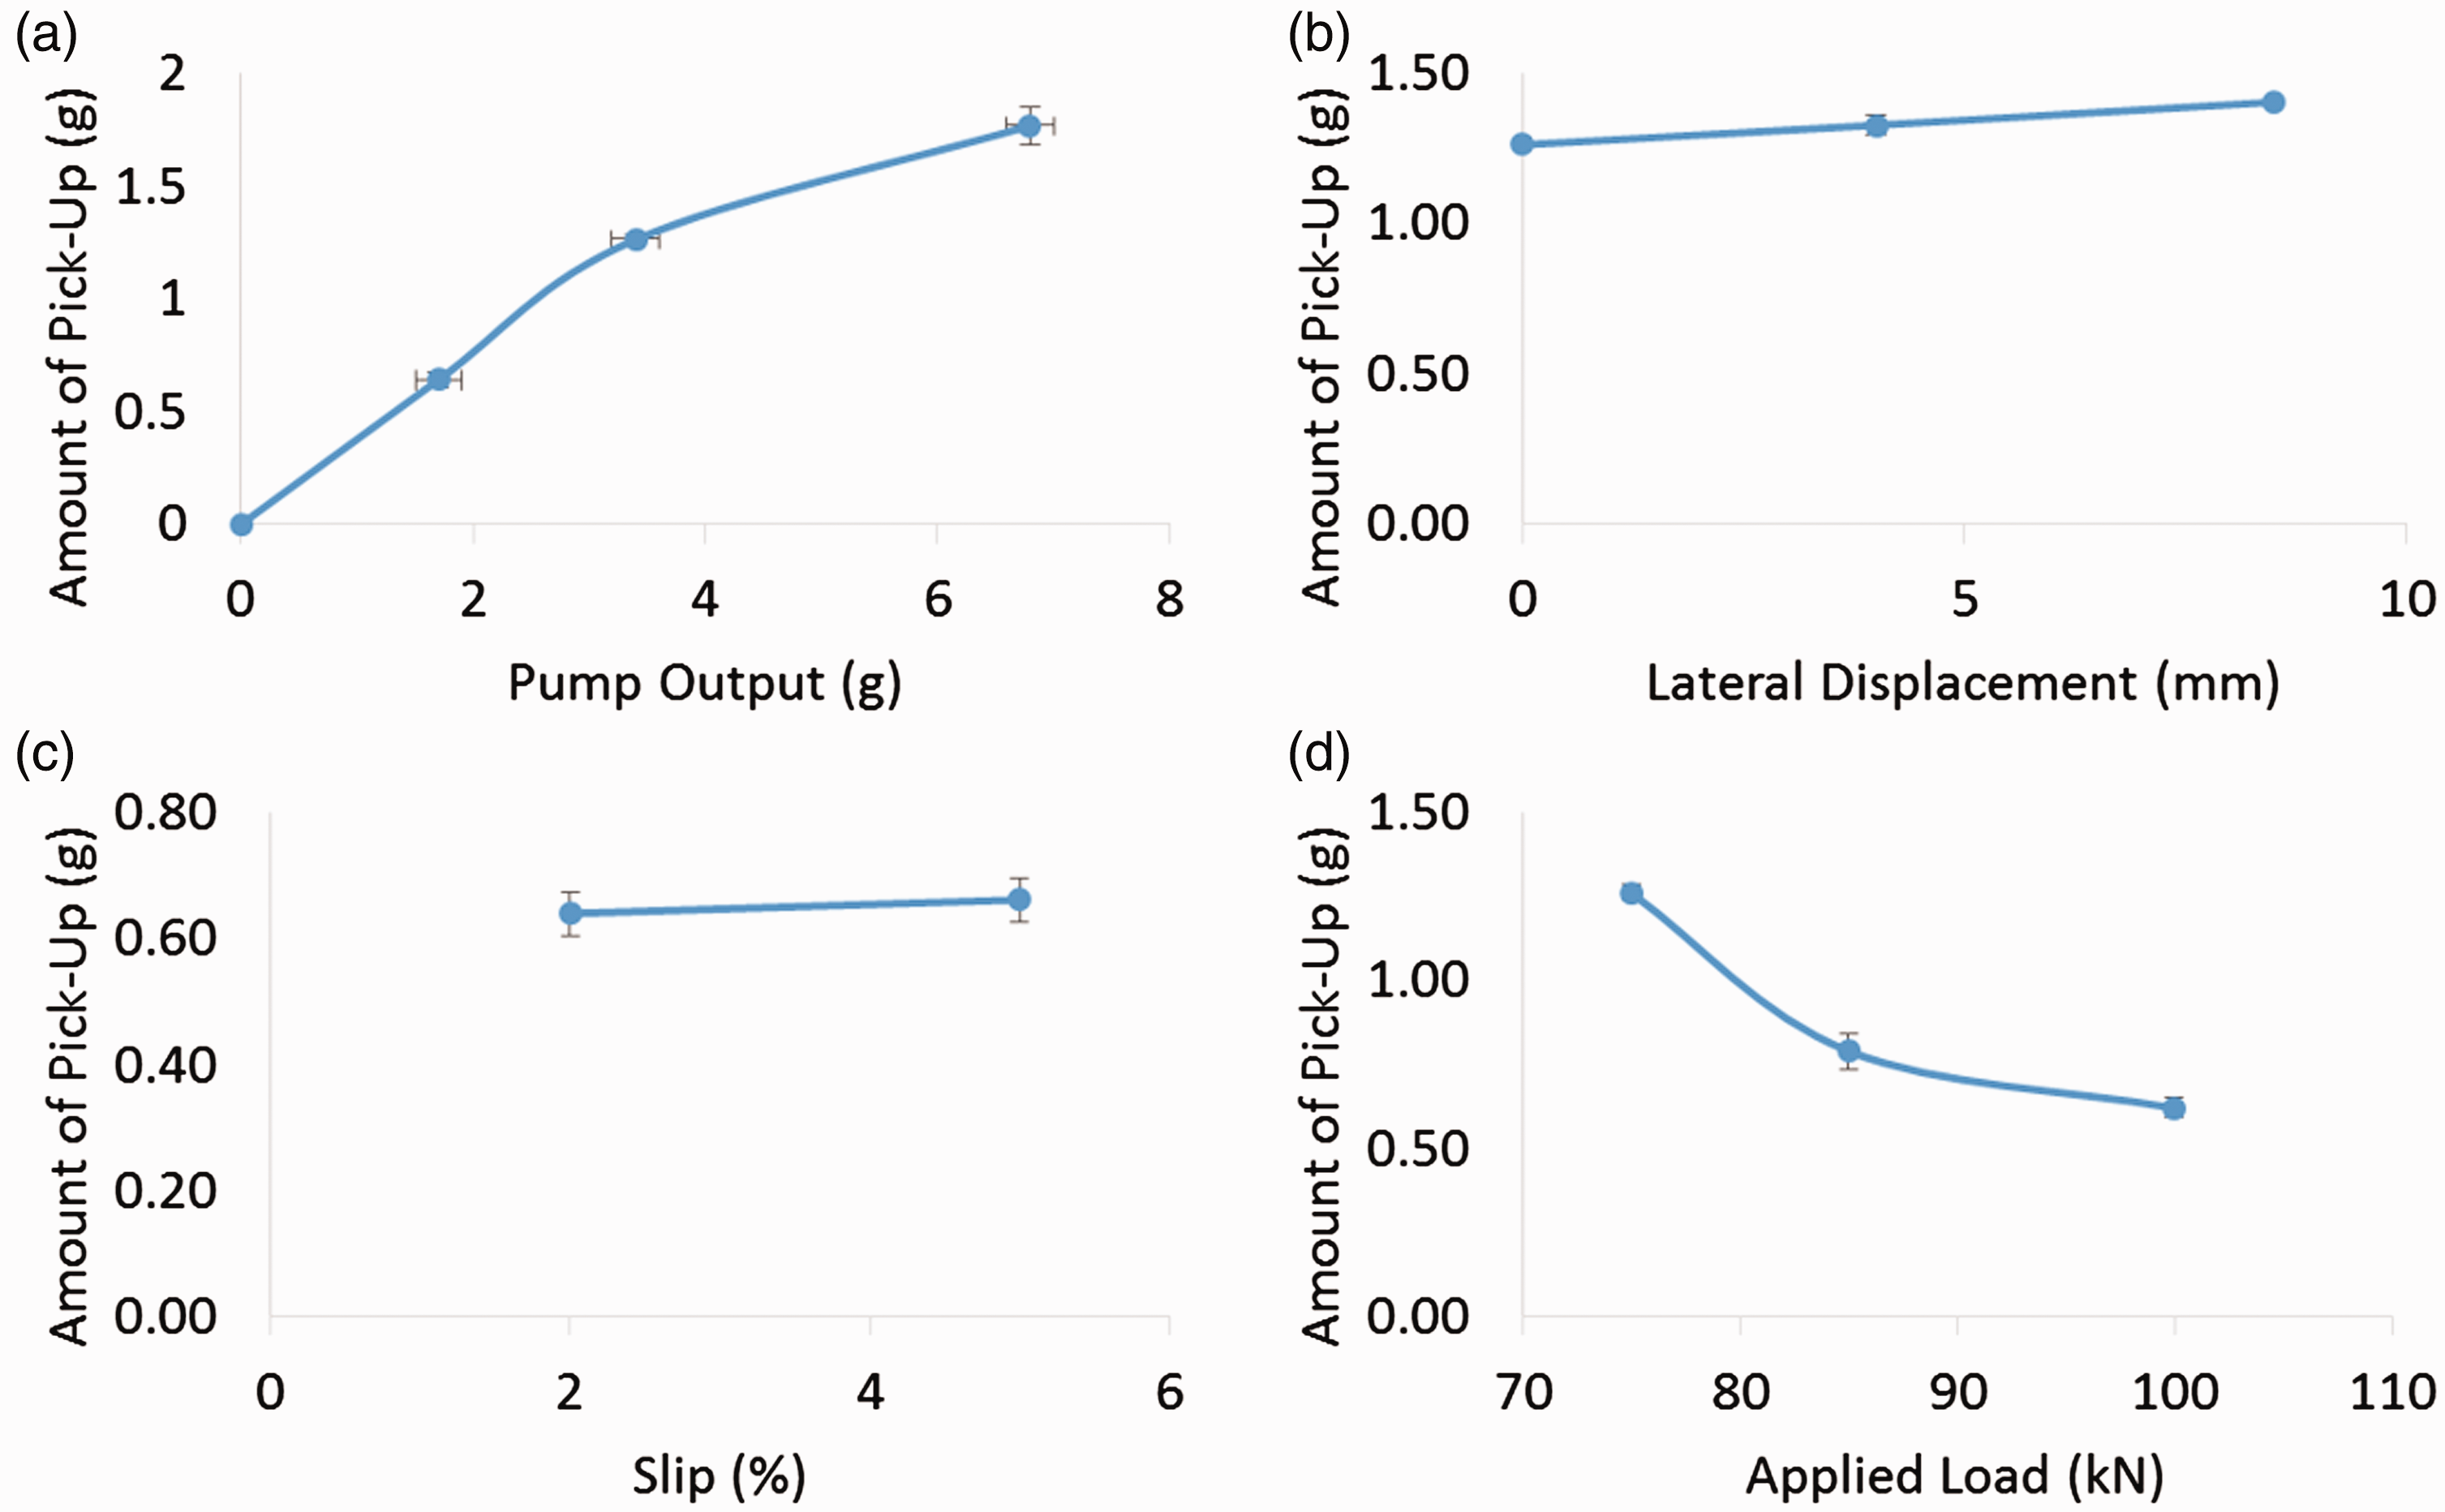
Figure 9(a) shows how the pick-up changes for multiple passes. This simulates a train passing an application site. For TORFM-A and TORFM-C there is a sharp drop off after the first wheel pass, whereas for TORFM-B there is an increase in pick-up from pass 1 to pass 2 and then the pick-up remains higher than the other two TORFMs. The spread for TORFM-B is larger. This is because it is much more viscous than the other two and does not flow across the railhead. This means that it stays in place until the wheel contacts the puddle. It is likely that the puddle is not of the same shape for each repeat, which influences where the TORFM goes once the wheel has contacted it and thus the shape of the puddle contributes to the larger spread.
(a) Average FSTF pick-up for multiple rolls of three TORFMs. (b) Total pick-up from the five passes for three TORFMs.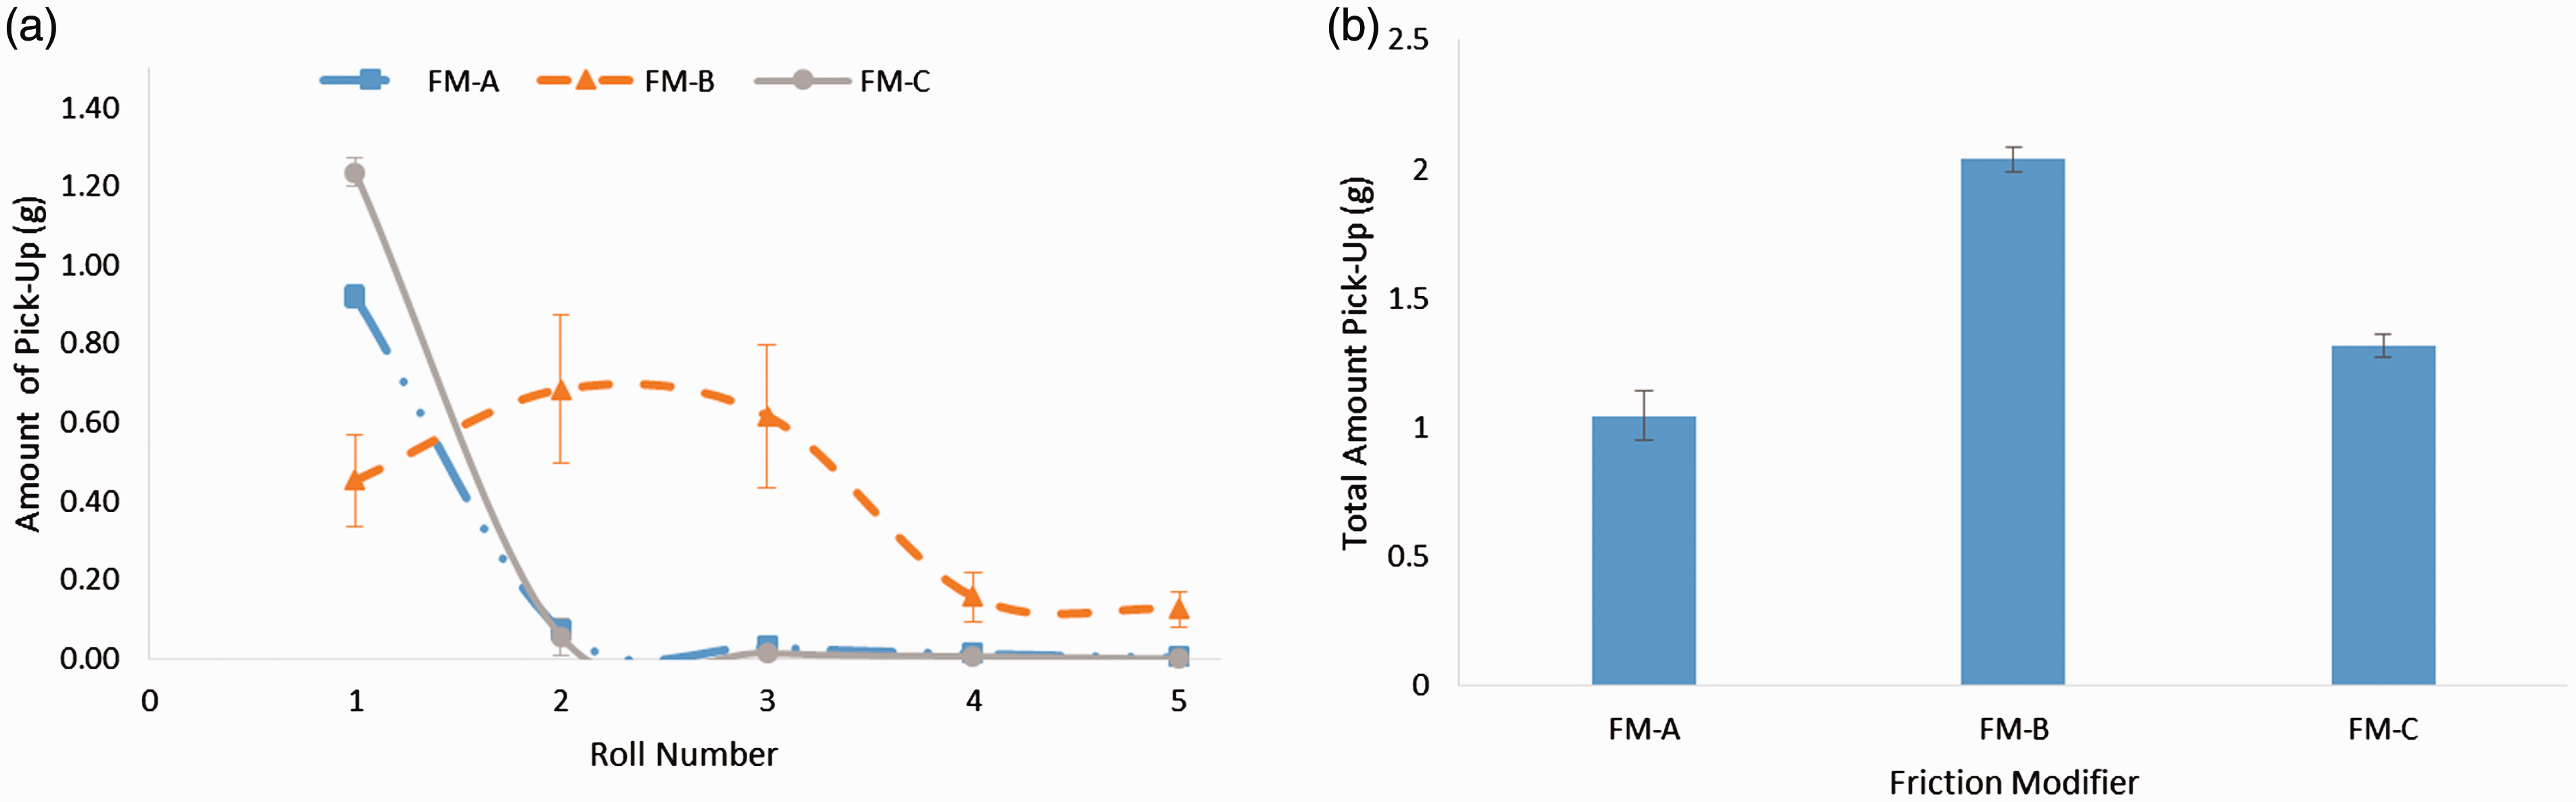
Figure 9(b) shows the total amount of TORFM picked up for the five passes of the wheel. It shows that TORFM-B has the greatest pick-up by a large margin and TORFM-A has a slightly lower pick-up amount than TORFM-C.
Discussion
Figure 10 shows the relative performance of the three TORFMs on each of the test rigs. For tackiness, the value is derived from dividing the tackiness of the TORFM by the maximum tackiness of the three TORFMs. For example, for TORFM-A
Ranking of the three TORFMs across the different test rigs.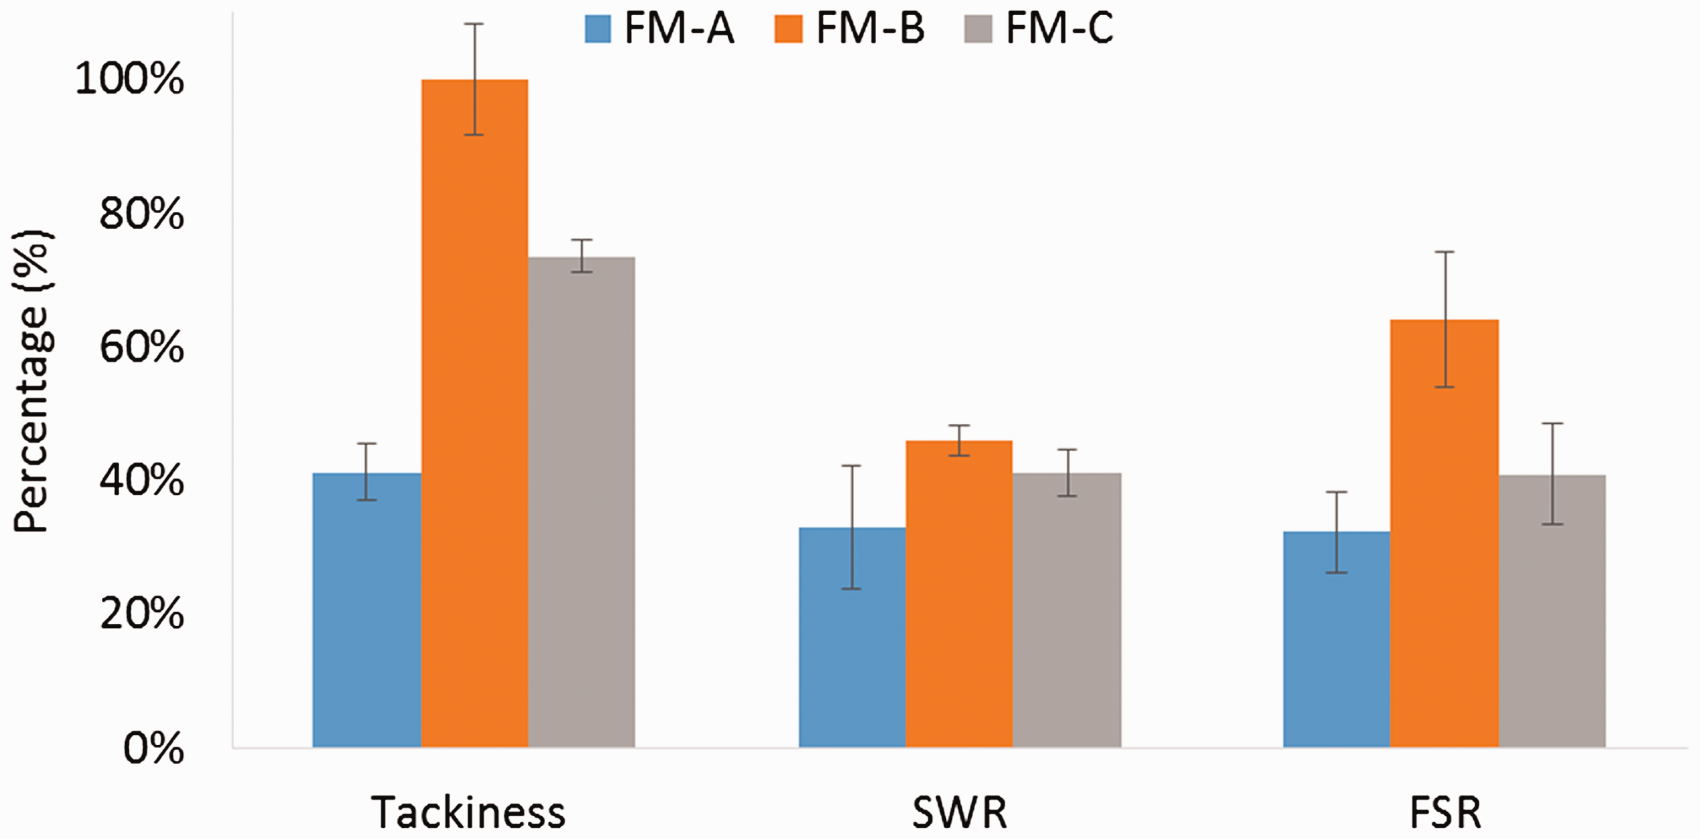
For the SWR and FSR, the percentage is the amount picked up by the wheel compared to the amount applied to the rail. Figure 10 shows that the ranking of performance is the same for each of the test rigs. TORFM-B is the tackiest formulation, TORFM-C is the lowest and TORFM-B gives the highest pick-up, TORFM-C gives the lowest. This means that the tackiness test may be an indicator of how one TOR product will perform (in terms of pick-up) compared to another. The values of pick-up between SWR and FSTF are different. This is expected due to the different loads, speeds and slip values between the two rigs as well as different application methods. It is more important that the relative ranking is the same rather than focussing on the absolute values. This is because the loads, speeds and slips will be different again in field conditions compared to the SWR and FSTF (as well as many other variations). Therefore, these two test rigs are representative of the relative performance rather than drawing out the exact amounts of pick-up that occurs in the field.
In the SWR tests, lateral displacement was shown not to influence the pick-up of TORFM (Figures 4 and 6). However, in the FSTF tests lateral displacement increased the pick-up slightly (Figure 8(b)). The increase is small relative to the amount of TORFM picked up and so is considered not to be important. This difference in relationship is caused by the variation in application of TORFM to the rail as the puddle is applied onto the centre of the rail rather than on the side of the rail from the applicator bar as in the SWR.
There are likely to be differences between the results in the laboratory and pick-up in field operation. These differences are caused by:
Speed of the wheel. The laboratory wheel speed is lower than field operation, which is an unavoidable limitation of the test rigs used. This could result in some product splashing as the wheel rolls through the puddle of TORFM. Storage of the product. The product is stored next to the rail in large containers. These containers are exposed to varying temperature/humidity and may allow the product to separate into its constituent parts. This means that when it is pumped onto the rail, the product may behave differently. Rail conditions. The rail in the FSR and SWR is clean, has an unworn profile and is at a relatively stable temperature. Conversely, in field operation, the rail may be worn and have contaminants (oxide, leaf, oil, grease, etc.) present. Wheel profiles. In the laboratory, the same wheel is used for all the tests. In field operation, different wheels will have different profiles depending on their worn state. Evaporation. The water in the product evaporates during the wheel–rail contact and over time. The evaporation rate will depend on many factors and will be variable from train to train. Therefore, the laboratory method focusses on the first few wheel passes after the product had been pumped out to minimise the effect of evaporation. Pump device. In the laboratory, a hand-pump was used rather than automated pumping equipment.
There are many properties that affect pick-up, such as drying rate, viscosity, tackiness and type of TORFM. These properties are difficult to test in isolation, but the SWR/FSTF pick-up tests could be used to test the effect of these properties on the pick-up.
Conclusions
A tackiness method developed for grease tackiness has been applied to friction modifiers. The results show that the method can differentiate between four similar TORFMs. The roughness of the specimens affects the results. However, in these tests, the ranking of the four TORFMs is the same regardless of what specimen roughness is used. However, it would be best if the specimens had the same roughness as the component being simulated (in this case the wheel and rail). This would eliminate a source of error when the results are scaled up to larger test rigs. The results from two different batches of the same TORFM generally show good agreement between each other although there are differences in absolute values. Care should be taken to ensure the products are fully mixed when using products that have been stored for a period of time. If the results show inconsistencies, then more repeats should be carried out or remix the product before carrying out the test again. The ranking of tackiness that this test method has given for the three TORFMs is the same as the ranking in the SWR and FSTF tests. Therefore, this tackiness test could potentially be used to predict the outcome of larger scale tests and can give indicators on how one product’s pick-up would compare to another’s. This is important as the SWR and FSTF are bespoke test rigs and access to them is limited, and tribometers that could be modified to carry out approach-retraction test method are more widely available. However, more testing is required to improve the gathered data and consider limitations of the test rigs (speed of wheel for example). Further work is also required to evaluate what level of tackiness is required for the required level of pick-up. It is important to reiterate that these tests focus on the initial pick-up of TORFM from wayside applicator to the wheel. Once the TORFM has been picked up and enters contact, there are too many variables for laboratory tests to take account of (different drying rates, splashing, etc.)
From the SWR and FSTF testing, it has been shown that the SWR could be used to rank different TORFMs and to differentiate between different applicator bars using this method. This is because it is easy to attach an applicator bar, and the results that this method gives are repeatable with a small standard deviation. As the FSTF has shown the same performance ranking of the three TORFMs as the SWR, it can be concluded that load, slip and speed do not affect the relative performance between different TORFMs. These are both new test methods and can be used to evaluate different applicator bars, different products and to verify the tackiness of test results.
Footnotes
Declaration of Conflicting Interests
The author(s) declared no potential conflicts of interest with respect to the research, authorship, and/or publication of this article.
Funding
The author(s) received no financial support for the research, authorship, and/or publication of this article.