
Abstract
Friction forces (often referred to as adhesion or traction forces) at the wheel/rail interface can vary dramatically due to changing environmental and contact conditions. The causes of this variance are partially documented, but it is not fully understood. Friction forces affect wheel and rail wear, traction energy usage, vehicle dynamics and safety through braking performance. A range of different portable railhead tribometers are used in the field to measure friction, but until recently have been limited in their performance, being unable to measure low friction situations or have made use of an unrealistic contact geometry. Recent developments have improved this situation but there is currently a lack of published field data which is required for validation, benchmarking and comparison between other studies and test rigs, as well as for input to multi-body dynamics simulations of railway vehicles. Friction studies in general are often undertaken for a specific period of time or under closely controlled conditions which makes it difficult to understand the true range of conditions occurring in the wheel/rail contact. In this paper an extensive dataset of railhead measurements is presented, using two types of measuring devices and three railhead conditions throughout a 4-week test period. Confidence in tribometer results was gained by comparing between established laboratory friction test rigs and methodologies. The results provide an insight into the friction variance and transient conditions that would occur on the railhead during operational use.
Keywords
Introduction
The friction coefficient between wheel and rail has a huge impact on railway operation; influencing vehicle performance, rail and wheel longevity, carbon emissions 1 and passenger safety. A third body layer naturally builds up on the rail steel surface during use 2 greatly influencing friction. Moreover, water or other contaminants can enter the wheel/rail contact and the resultant friction coefficient can vary dramatically. 3
Examples of third body materials that can enter the contact and change the friction experienced include ‘natural’ components such as water from precipitation, humidity or water jetting, iron oxides and wear particles, as well as organic contamination. Examples of components that are “artificial” include sand, oils and grease, top-of-rail friction management products, debris from road crossings 4 and freight vehicle overspill. 5 Naturally occurring, unmanaged coefficient of friction can vary between approximately 0.05 and 0.7. Typical values needed for braking are above 0.09, with 0.2 or above required for traction sufficient to maintain timetabled operation. 6
On-board train friction measurements have been carried out, but these require the use of specialist vehicles or instrumentation.3,7 During industry operation, portable tribometers are used as a flexible, quick and cost effective method to measure railhead friction. Examples of their use are: • Implementing or optimising friction management methods; reducing the friction to prevent excessive wear and squeal8–10 or increasing the friction coefficient to prevent wheel slips and spins, delays and safety concerns. • Assessing the role and extent of low friction after a safety incident, such as a station overrun or a signal passed at danger.
11
• Providing input into performance and braking models.
12
Unlike on-board measurements, the published portable tribometer measurements have often been taken over relatively short time periods under narrow windows of conditions, partly due the costs and complexity of field testing. Long term studies have been carried out with the most commonly used friction measuring device, the Salient Systems push tribometer, 6 but these have generally focussed on dry friction conditions or when using friction management products. This push tribometer is unable to measure low friction coefficient values due to its operational design which is reflected in the studies (friction coefficient of 0.25 for oiled rail and 0.5 for dry values 13 ). This limits the push tribometer usability in the UK where there is a focus on measuring low friction caused by organic railhead contamination, due to a wet climate, deciduous leaf cover and short intervals between station stops.14,15
Railhead friction studies have been carried out with a pendulum slip resistance tester16–18 and the results of low and high friction conditions correlate well to other friction measuring methods, however, the sliding rubber contact is difficult to relate to the real rail and wheel steel rolling/sliding contact. Errors are easily introduced by the user due to the complex set-up procedure and operator dependency and results are affected by high winds.
More recently developed than these technologies the Ontrak portable railhead tribometer is an example of a next generation railway specific tool to determine friction force available at the railhead. This new approach uses a steel measuring wheel, with adjustable normal force and creep values. 19 During the work reported here railhead friction was measured when trialling a novel on-board low adhesion detection system, 20 with Ontrak tribometer and pendulum measurements being used to validate the onboard system over three railhead friction conditions; high, intermediate and low. The measurements were then compared against previously published field and laboratory friction studies to assess equivalence of measurements in operational field conditions with more closely controllable laboratory tests.
Methodology
Site and context
The testing was carried out at Network Rail’s Rail Innovation and Development Centre (RIDC) site at Tuxford, UK. A 400 m test section was conditioned as described below and a multi-purpose vehicle (MPV, similar to the CargoSprinter freight multiple unit from Windhoff
21
) was driven at 4 different speeds (16, 26, 40 and 60 mph) through the test site, Figure 1. The speeds were chosen to cover a range of operating conditions and also ensure no gear changes were required when driving through the test site. The MPV was held at sufficient distance from the test zone between tests to allow adequate acceleration distance before the upcoming test run. The MPV was driven bi-directionally up and down the test sites. Railhead condition measurements were taken within minutes of the MPV passage, as soon as safe access to the track was available. The test site and vehicle holding locations, with north pointing to top of paper (https://digimap.edina.ac.uk/).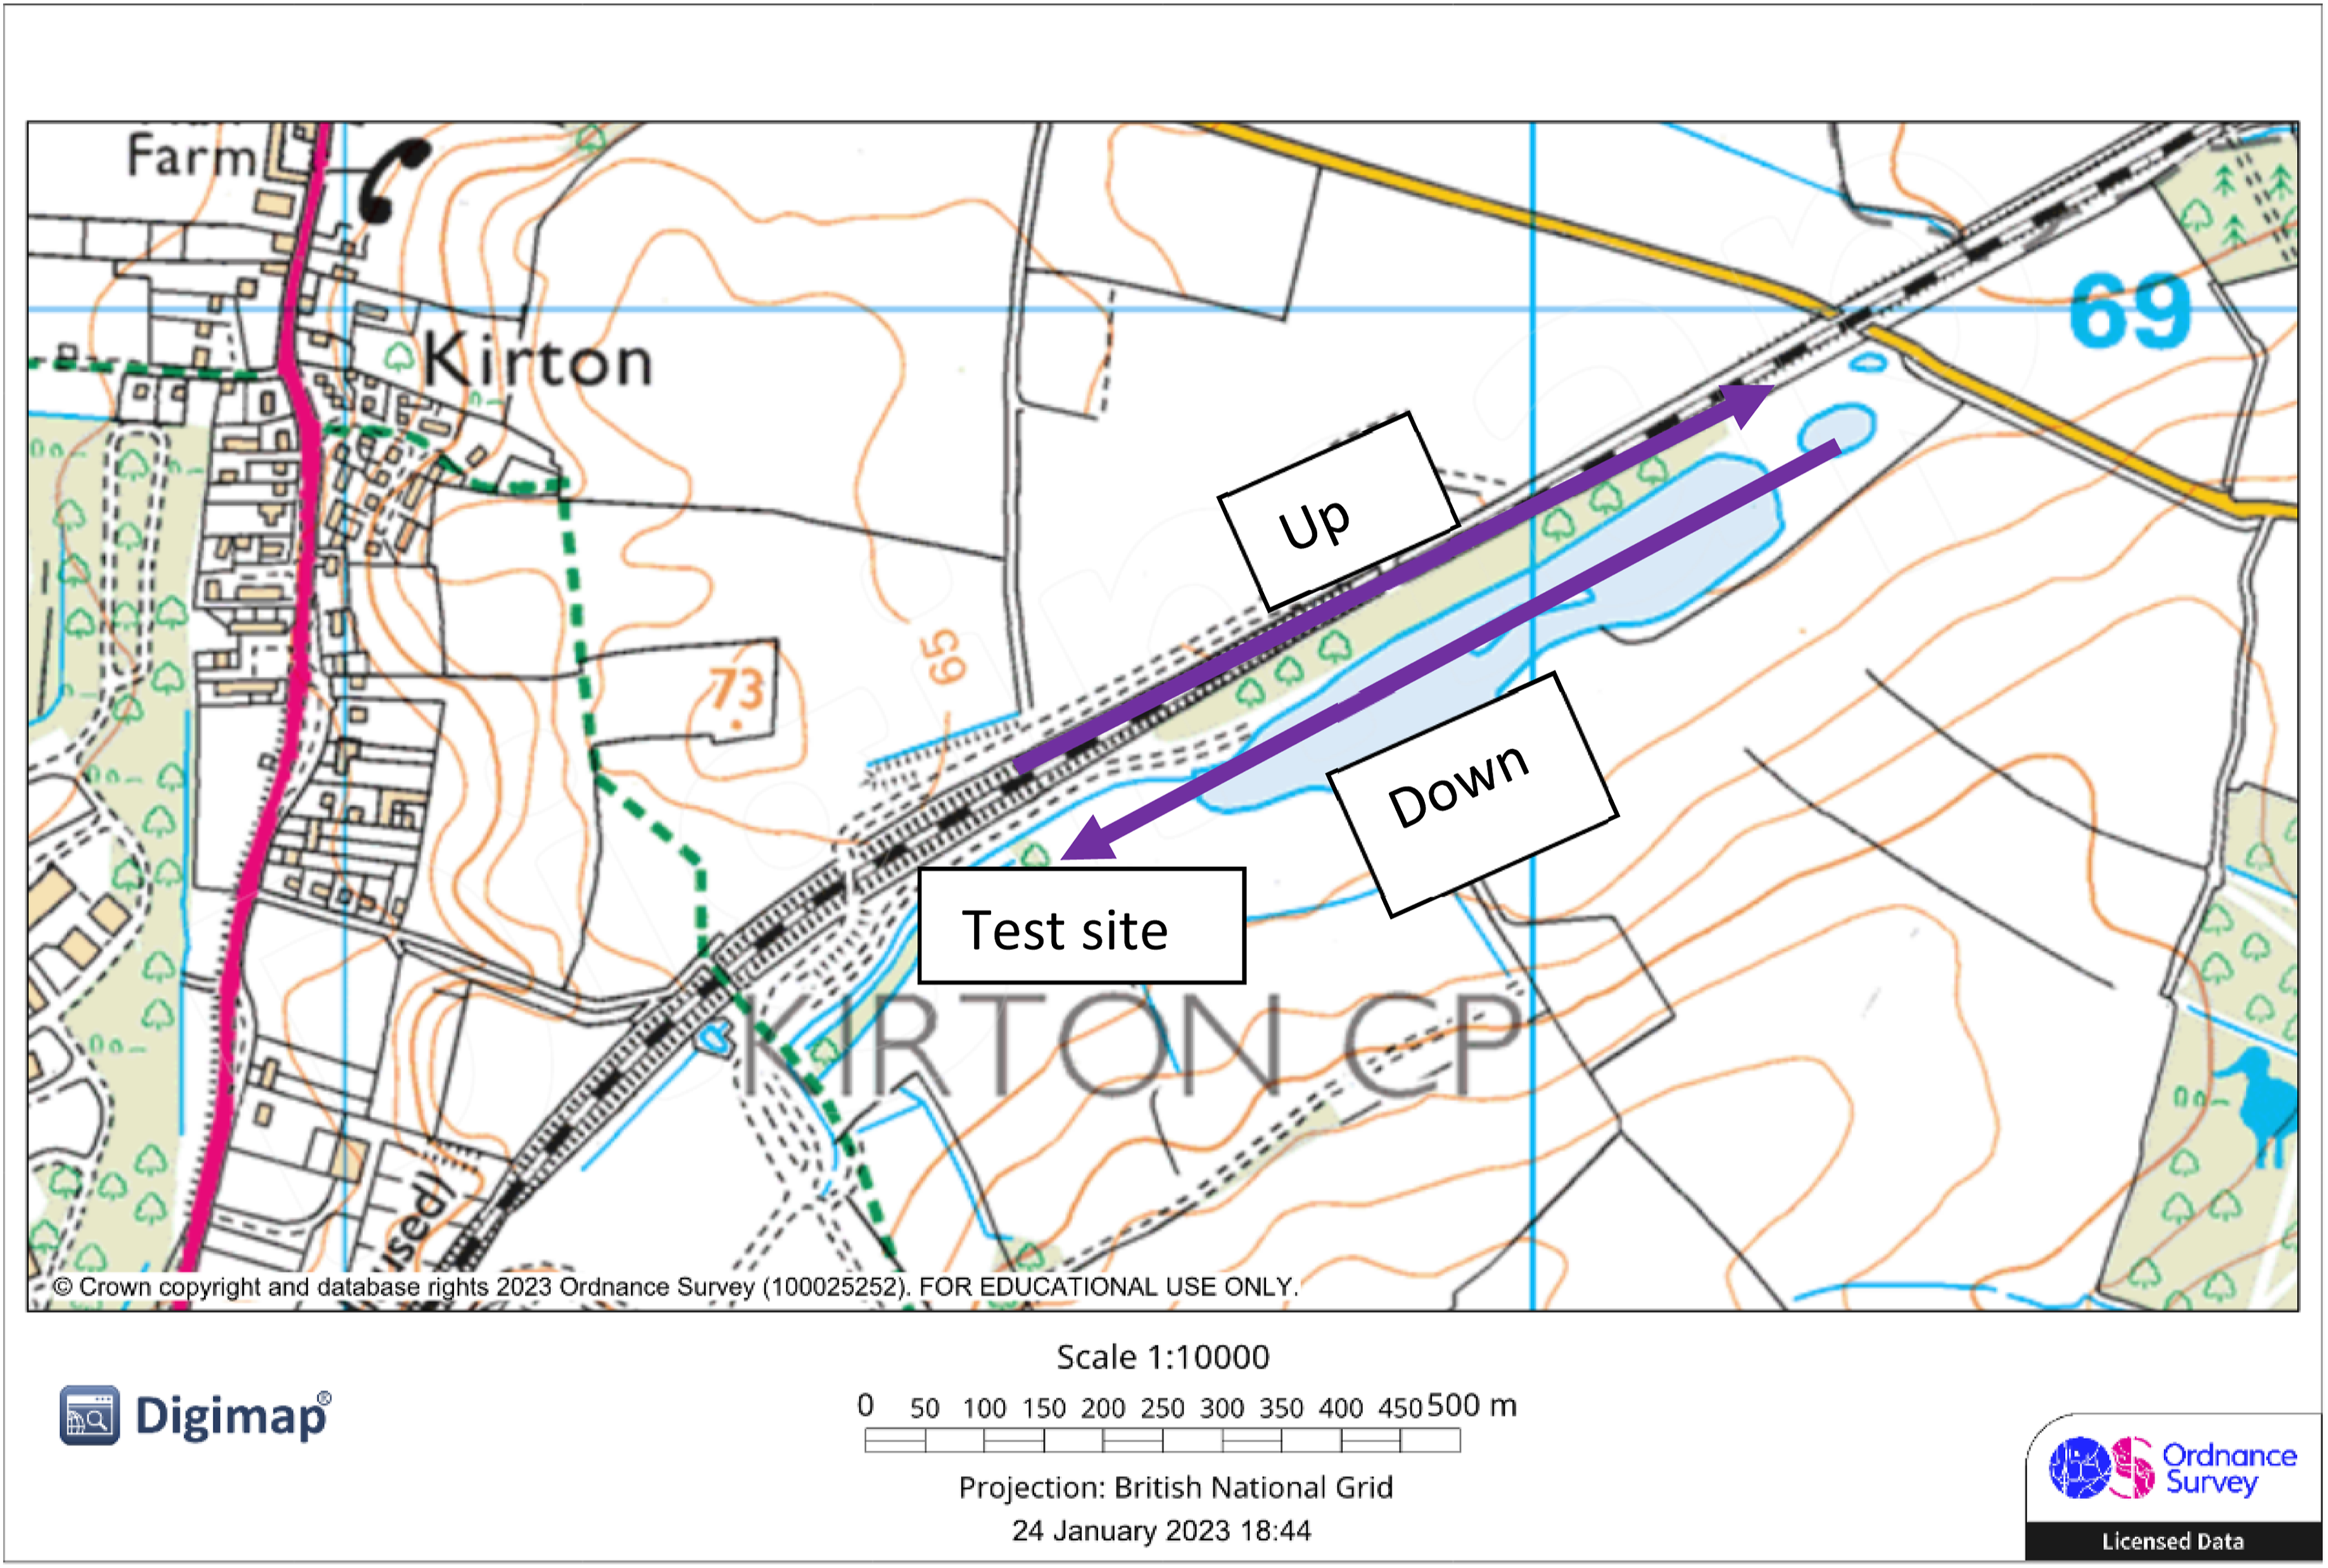
Railhead conditioning
The railhead at the 400 m test site was conditioned to three different friction conditions; high (dry), intermediate (water lubrication) and low (rail covered by moist paper tape as described in brake test standards 22 ). Before live test runs the MPV was driven up and down the test section to clear some of the oxide build-up that naturally occurs overnight when there is no traffic.
Where required the railhead was wetted using a vehicle mounted water pump and containers, through hosing which attached to the MPV using brackets in front of the leading axle to spray in front of the contact patch. The maximum flowrate was 1.2 L/min.
Many methods have been previously used in field trials to replicate low friction. Leaf layers have previously produced very low friction, 23 but they can be inconsistent and affected by environmental conditions such as weather that is too hot or too windy. Paper tape was used during this study, which is an established industry method13,24 used to create repeatable low friction. The tape itself contains cellulose and lignin. The glue component of the tape is acacia gum, a polysaccharide. When mixed with water, polysaccharides can form a hydrogel, previously reported to be a potential mechanism of low friction during leaf fall season. 25 To create a paper tape layer a rail track trolley, equipped with two rolls of gummed paper tape was pushed down the test section. The trolley was fitted with on-board water sprays and rollers, which wetted and pressed the tape onto the railhead. The MPV was then rolled over the tape section 3 times, with no further water spraying, to condition the tape layer. The MPV mounted water applicator was used to wet the tape during vehicle pass.
Measurement equipment
Two friction measuring devices, the Ontrak and the pendulum (Figure 2), were used during the testing and all friction measurements were taken from the railhead running band. The pendulum skid resistance tester was designed for floor health and safety but has seen extensive railway use as a simple method for railhead friction measurements.
16
Once fitted onto the railhead using a wooden base and levelled using a spirit level, the arm is pulled up and clasped. When the arm is released a spring loaded rubber slider (IRHD hardness of 96) makes sliding contact with the railhead and the height reached at the end of the stroke is measured on a scale; higher friction results in more energy lost and a higher slip resistance value (SRV). The Ontrak tribometer (L) and pendulum slip resistance tester (R).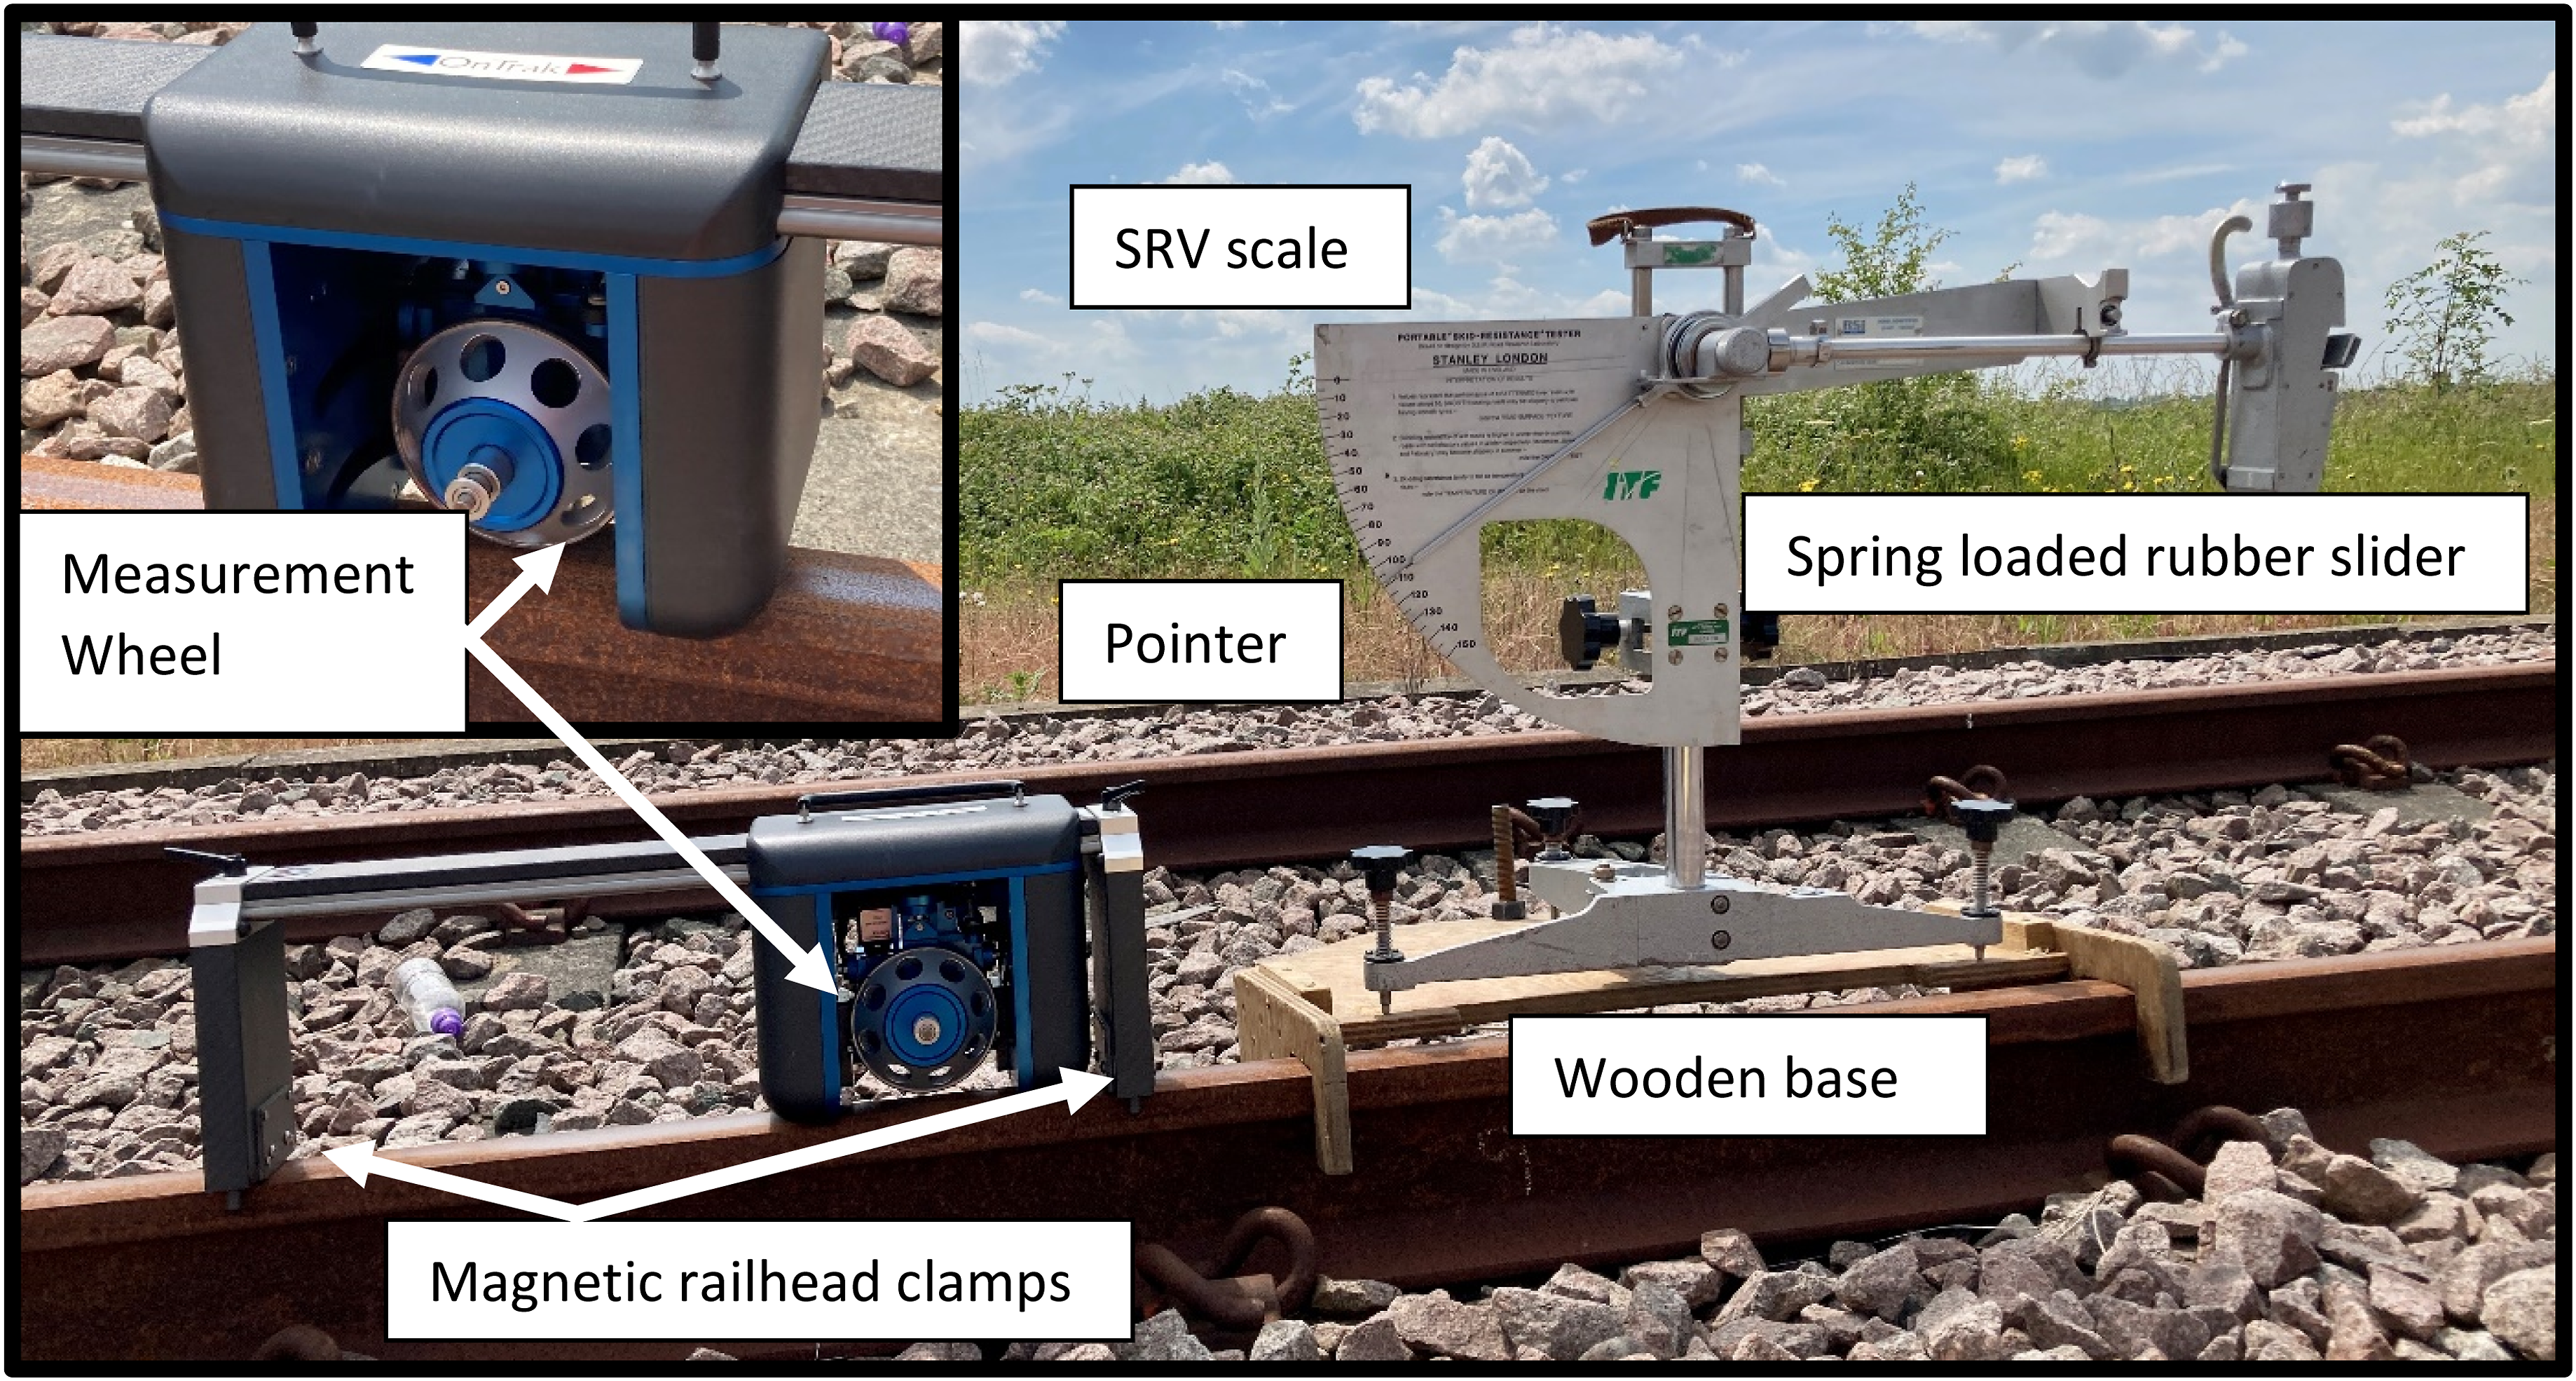
The friction coefficient can be estimated from this SRV value using a relationship developed by British Rail, validated against values from their tribometer-train. 17 It is a sliding rubber on steel contact, but has previously been shown to correlate well to other measurement types.
The Ontrak portable railhead tribometer is a new device that uses more realistic and controllable contact conditions than the pendulum. 19 A loaded steel measuring wheel is driven along the railhead with an angle of attack, producing lateral creep forces. The wheel angle of attack and normal force can be controlled (10-150 mrad and 15-90 N) to provide full creep curves, in contrast to the single values for each condition generated by the pendulum equipment. An angle of attack of 10 mrad has been previously estimated as 1% creep, 19 150 giving 15% creep. Data is downloaded as a .csv file using a wireless interface.
Six measurement sites were marked out to carry out the friction tests on; three on each rail. These were approximately 10 m apart at the easterly end of the test site. Three repeats in exactly the same position (successively) were taken for most of the measurements but this was not always possible due to transient railhead conditions, for instance the railhead water drying out before a repeat could be taken. The same area was used for separate tests, but this was unlikely to be the exact same location due to the small tribometer contact geometry compared to the wheel/rail running band area.
Air temperature and humidity data were measured throughout the day using a RS Pro thermocouple device and a UEI DTH10 temperature and humidity sensor. The railhead temperature was noted using a Unipart Rail magnetic thermometer which was placed on the web of the rail. Railhead images were also taken at the time of each measurement.
Laboratory tests
In addition to the track tests Ontrak measurements were carried out in a laboratory on a 1m section of R260 rail under controlled conditions as a comparison. The piece of rail used had been previously used with the University of Sheffield Full Scale wheel/rail test facility, 26 cleaned using acetone and dried before dry testing to remove any contamination from previous experiments.
For wet conditions, 3 mL water was applied via syringe and distributed evenly over the railhead using a small plastic wiper, with measurements were taken immediately after application.
For paper tape conditions in the laboratory, the railhead was wetted with 3 mL of water and then 800 mm of gummed paper tape was placed on top and rolled over with a steel cylinder so that it adhered to the railhead. 3 mL water was then applied using a syringe to the surface to wet the tape layer before testing was carried out.
Results
The Ontrak tribometer measurements at wheel angles of attack of 10-80 mrad (equivalent to 1-8 % creep, as discussed in previous studies19,27) are shown in Figure 3(a). The difference in friction between the three different railhead conditions is measureable, with the laboratory friction results all higher than the field results, possibly due to differences in third body layer which are discuss later in this paper. The third body layer can encompass a surface chemistry change, debris, liquid, or some combination of these. Swabbing and micro-analysis could be used to explore their exact composition, but here our focus was macro friction effects rather than compositional analysis of the layers. (a) Mean average Ontrak measurements (solid line) and 95% percentile (shading) for different railhead conditions. (b) a density plot of Ontrak friction measurements for lab and field measurements (Dry field 227 measurements, Dry lab 12 measurements, Wet field 32 measurements, Wet lab 12 measurements, Tape field 69 measurements, Tape lab 10 measurements).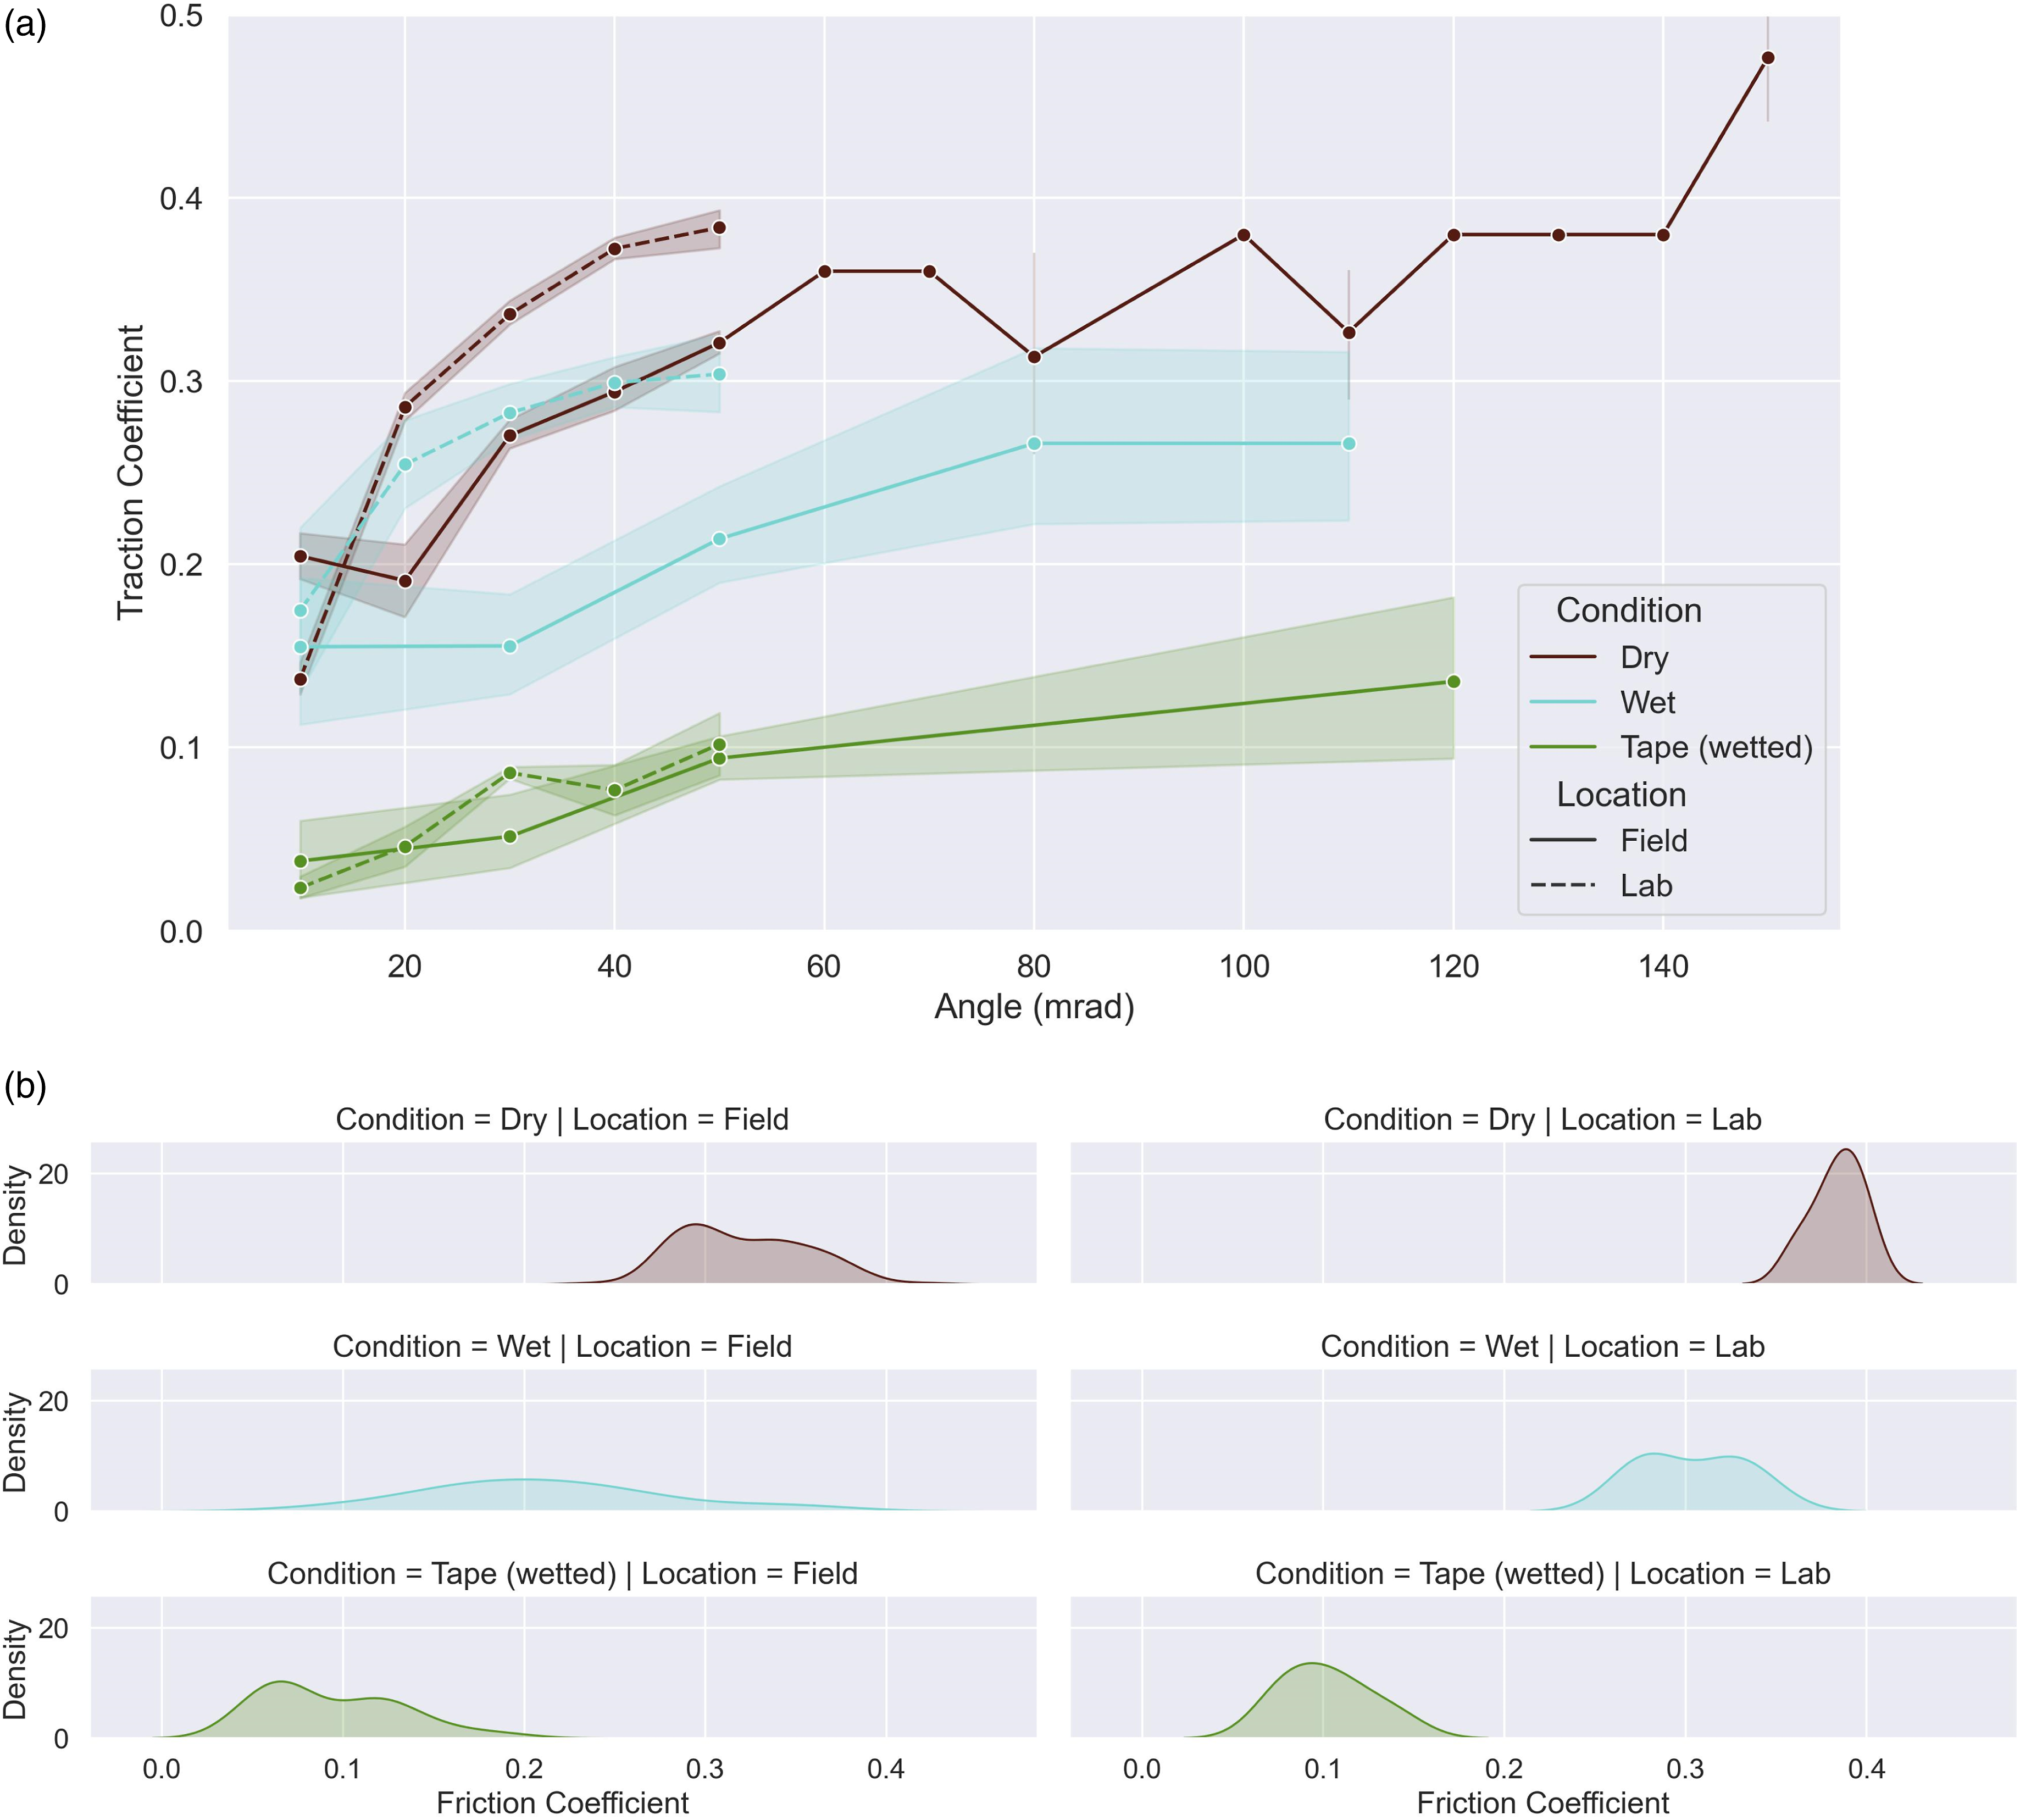
Kernel density plots of Ontrak friction measurements at a normal load of 45 N (480 MPa) and 60 N (530 MPa), angle of attack 50 mrad (5% creep) for both the laboratory and field tests are shown in Figure 3(b). A Scott bandwidth factor of 1 has been used to smooth the histogram and statistical data is shown in Appendix 1. The full dataset is shown in Appendix 2. There was a large friction range measured for the wet meaurements for both field and lab due to the changing amounts of water on the railhead as it is pushed aside by the Ontrak wheel or evaporated. Across the range of speeds used in the field trials it could be visibly seen on the railhead that the railhead was drier at higher vehicle speeds. This was due to a uniform volumetric water flow rate from the train being distributed over greater track lengths, also with higher vehicle wheel velocity and increased airflow both driving water out of the contact. This is reflected in the results shown in Figure 4(a) where results were broken down further into vehicle speed before the measurement. (L) Wet measurements (50 mrad), categorised by vehicle speed prior to measurement. (R) A comparison of Ontrak measurements (50 mrad) and pendulum readings (pendulum converted to equivalent friction coefficient using the British Rail friction level estimation).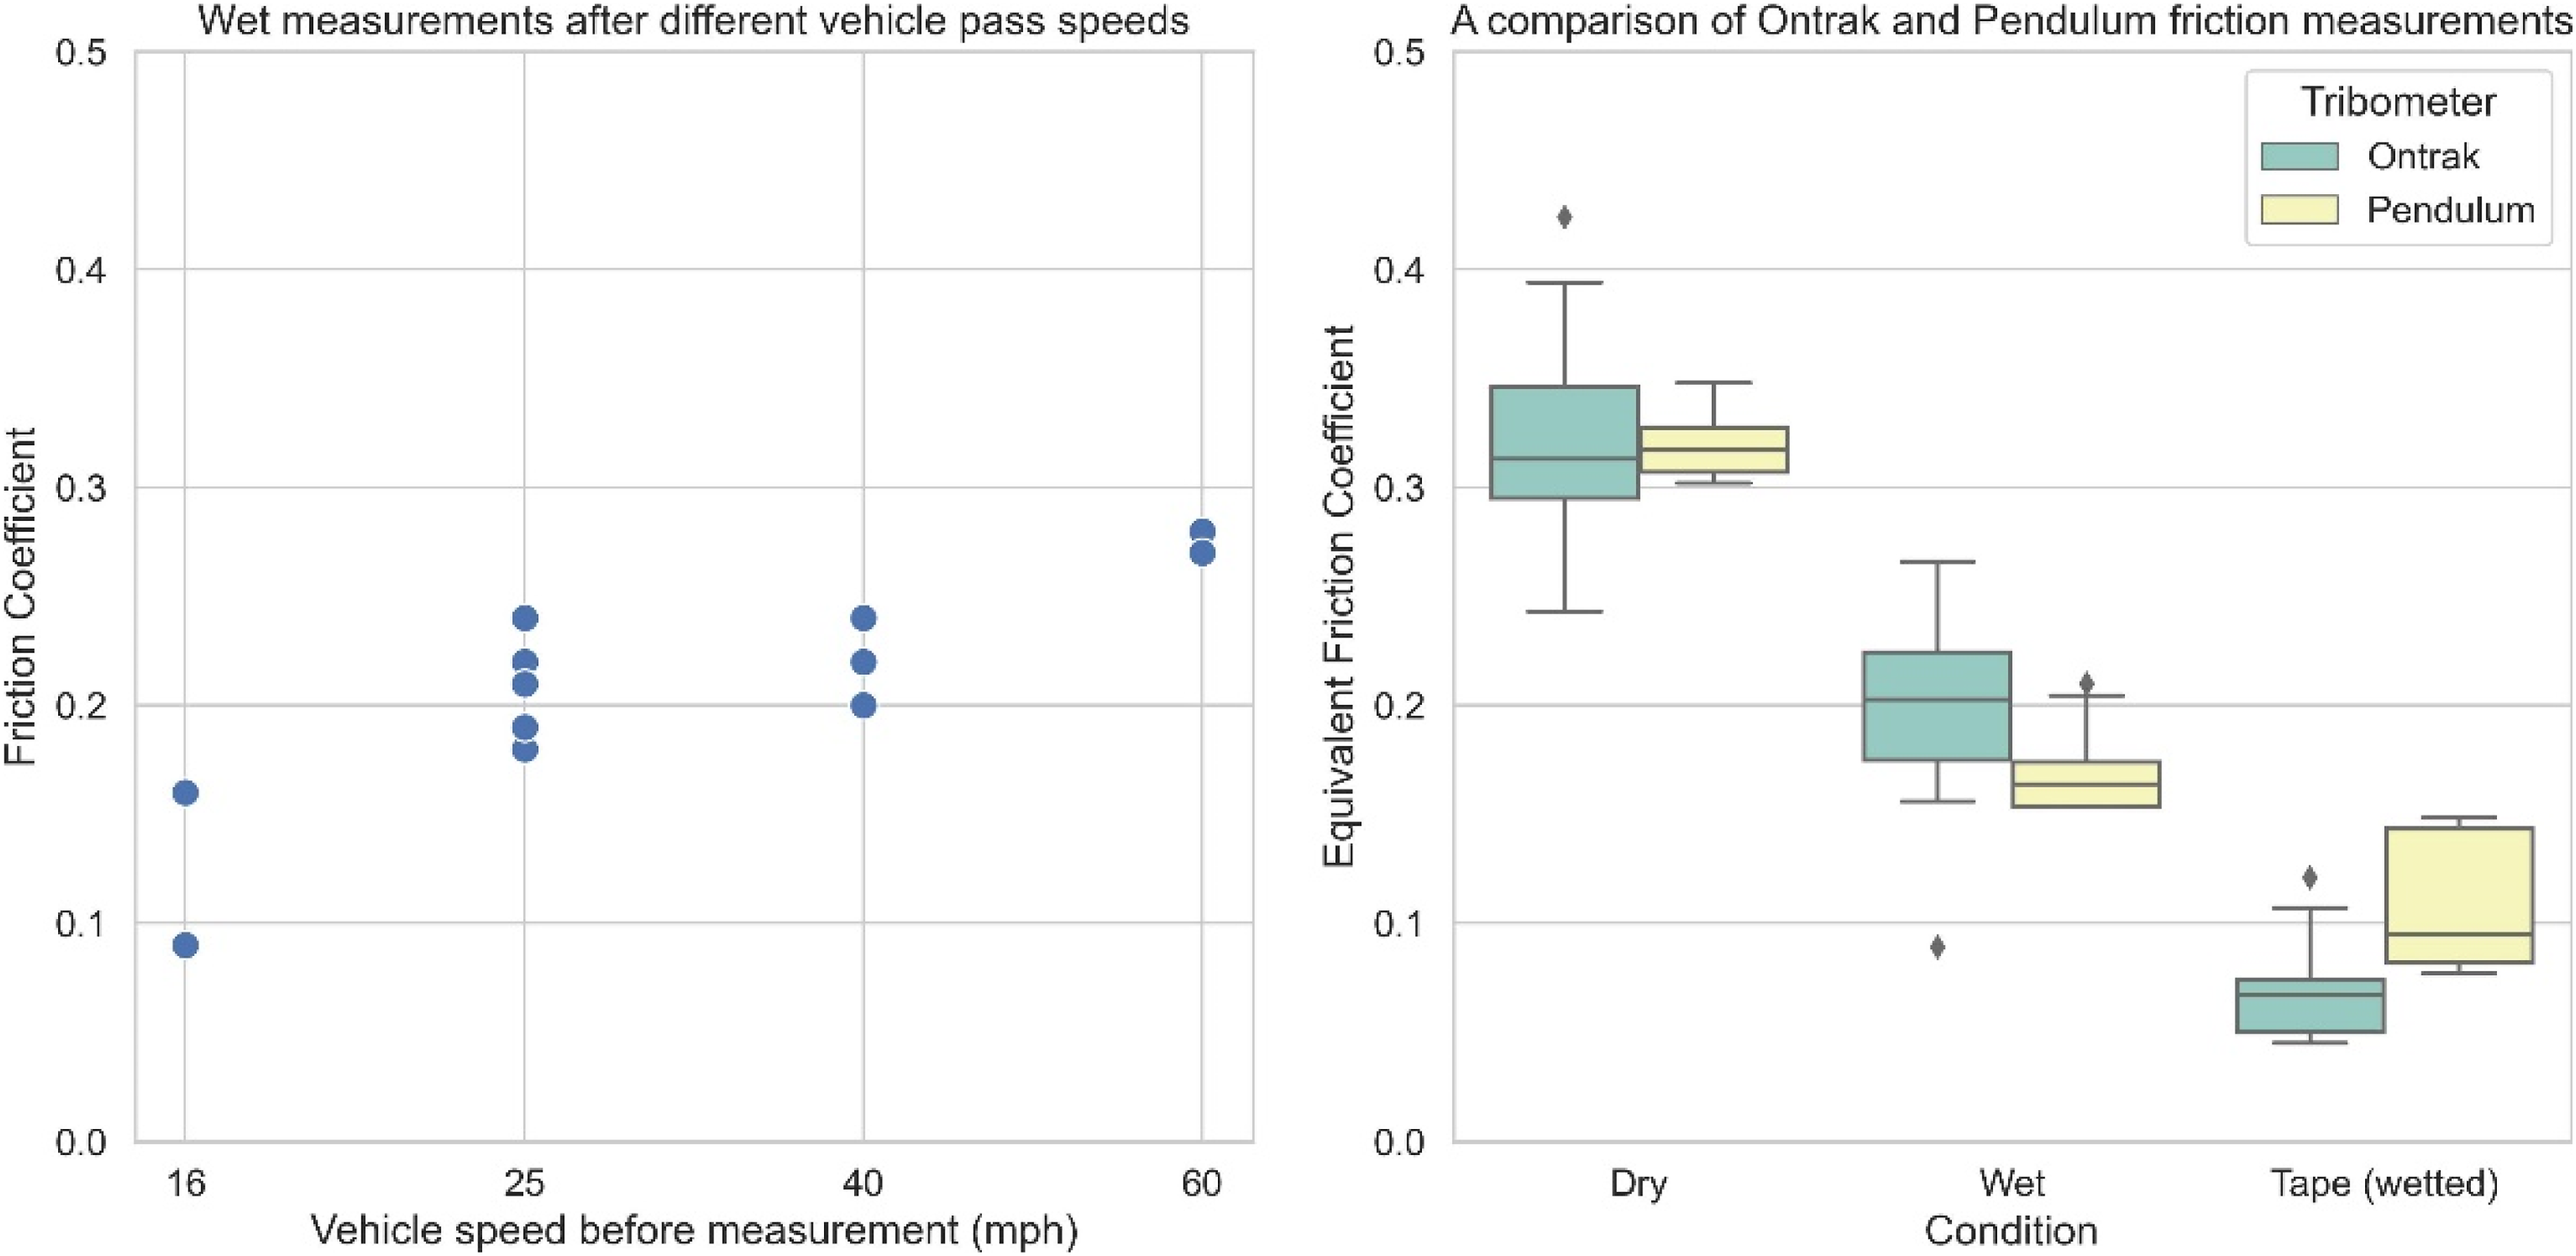
The British rail pendulum/tribometer-train relationship 17 was used to estimate the railhead friction coefficient from the SRV values measured with the pendulum. Although there is variation in the friction values between the Ontrak and pendulum equipment, likely due to their different geometries, materials and dynamics, both devices are able to distinguish between high (dry), intermediate (wet) and low (paper tape) friction. Pendulum equivalent friction coefficients, plotted alongside Ontrak measurements are shown in Figure 4(b).
Discussion and comparison
Friction measurements under real world conditions
The measured friction of different railhead conditions follows the expected pattern for both field and laboratory trials, with dry conditions being highest, followed by water and finally paper tape with the lowest average friction.
The creep curves for dry and wet field tests were lower than the laboratory tests Figure 3. This is to be expected due to friction reduction by the naturally occurring third body layer in installed rails28,29; a build-up of iron oxides and wear particles that are not present to such a degree on rail in the laboratory which does not have wheel passage or changing environmental conditions and oxide generating wet/dry cycles. 30 There was no significant difference in laboratory and field friction coefficients for the paper tape tests, likely because the paper tape layer covers the naturally occurring third body layer.
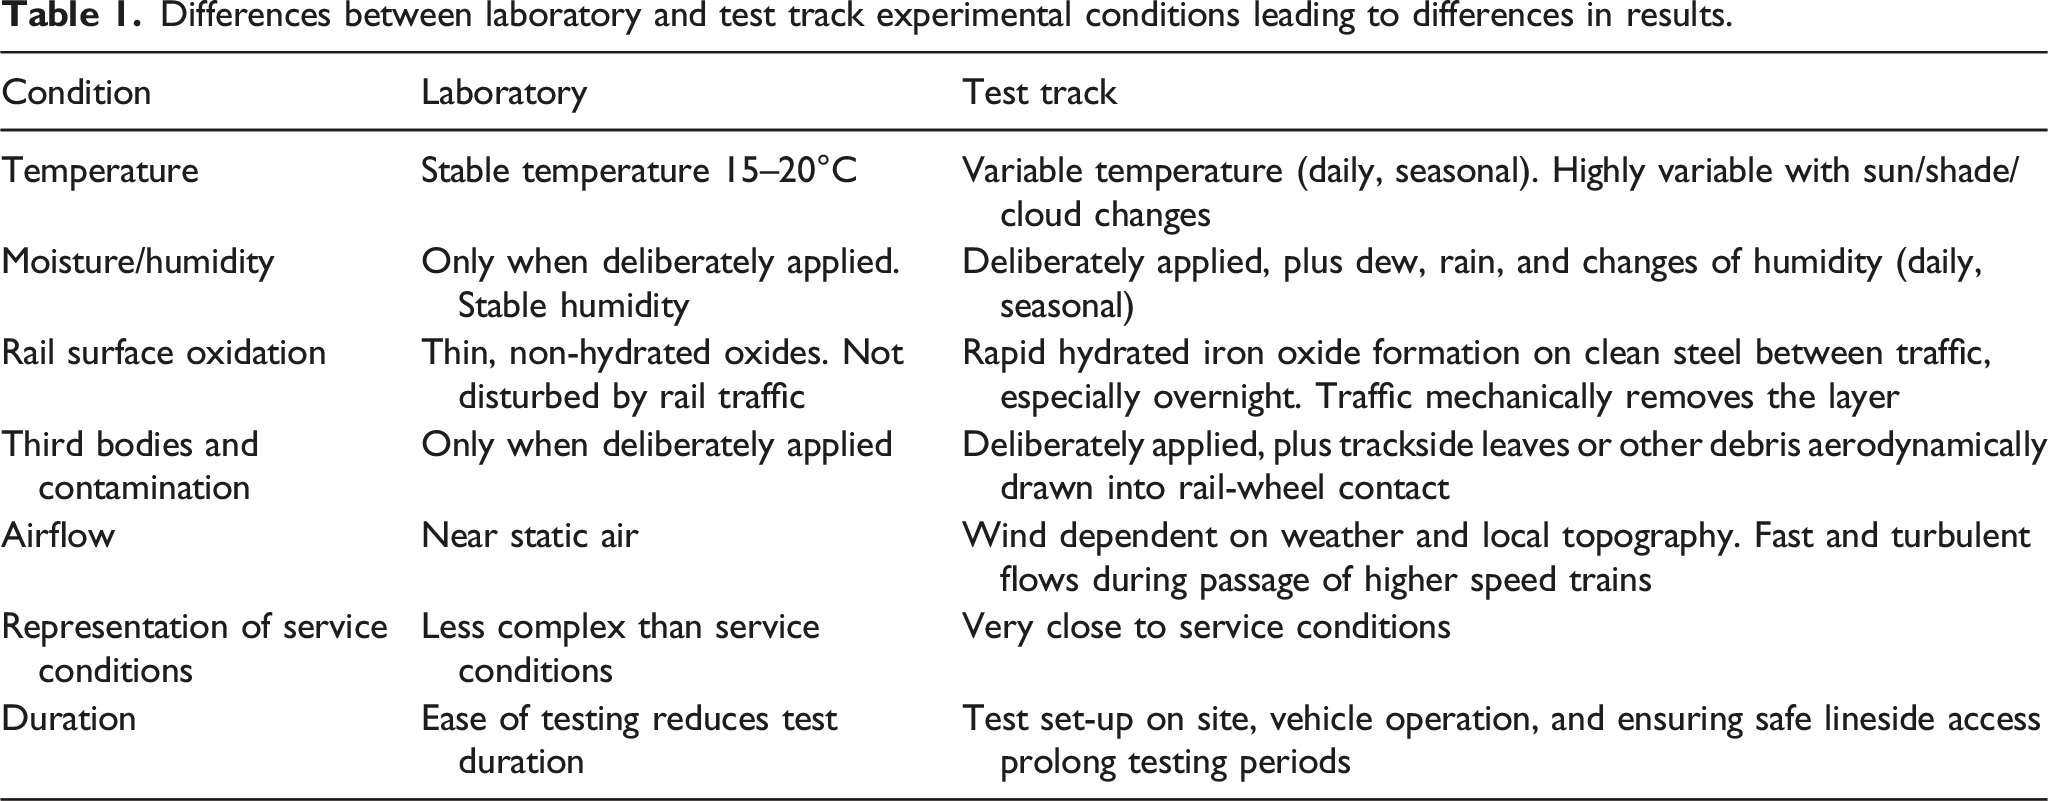
Differences between laboratory and test track experimental conditions leading to differences in results.
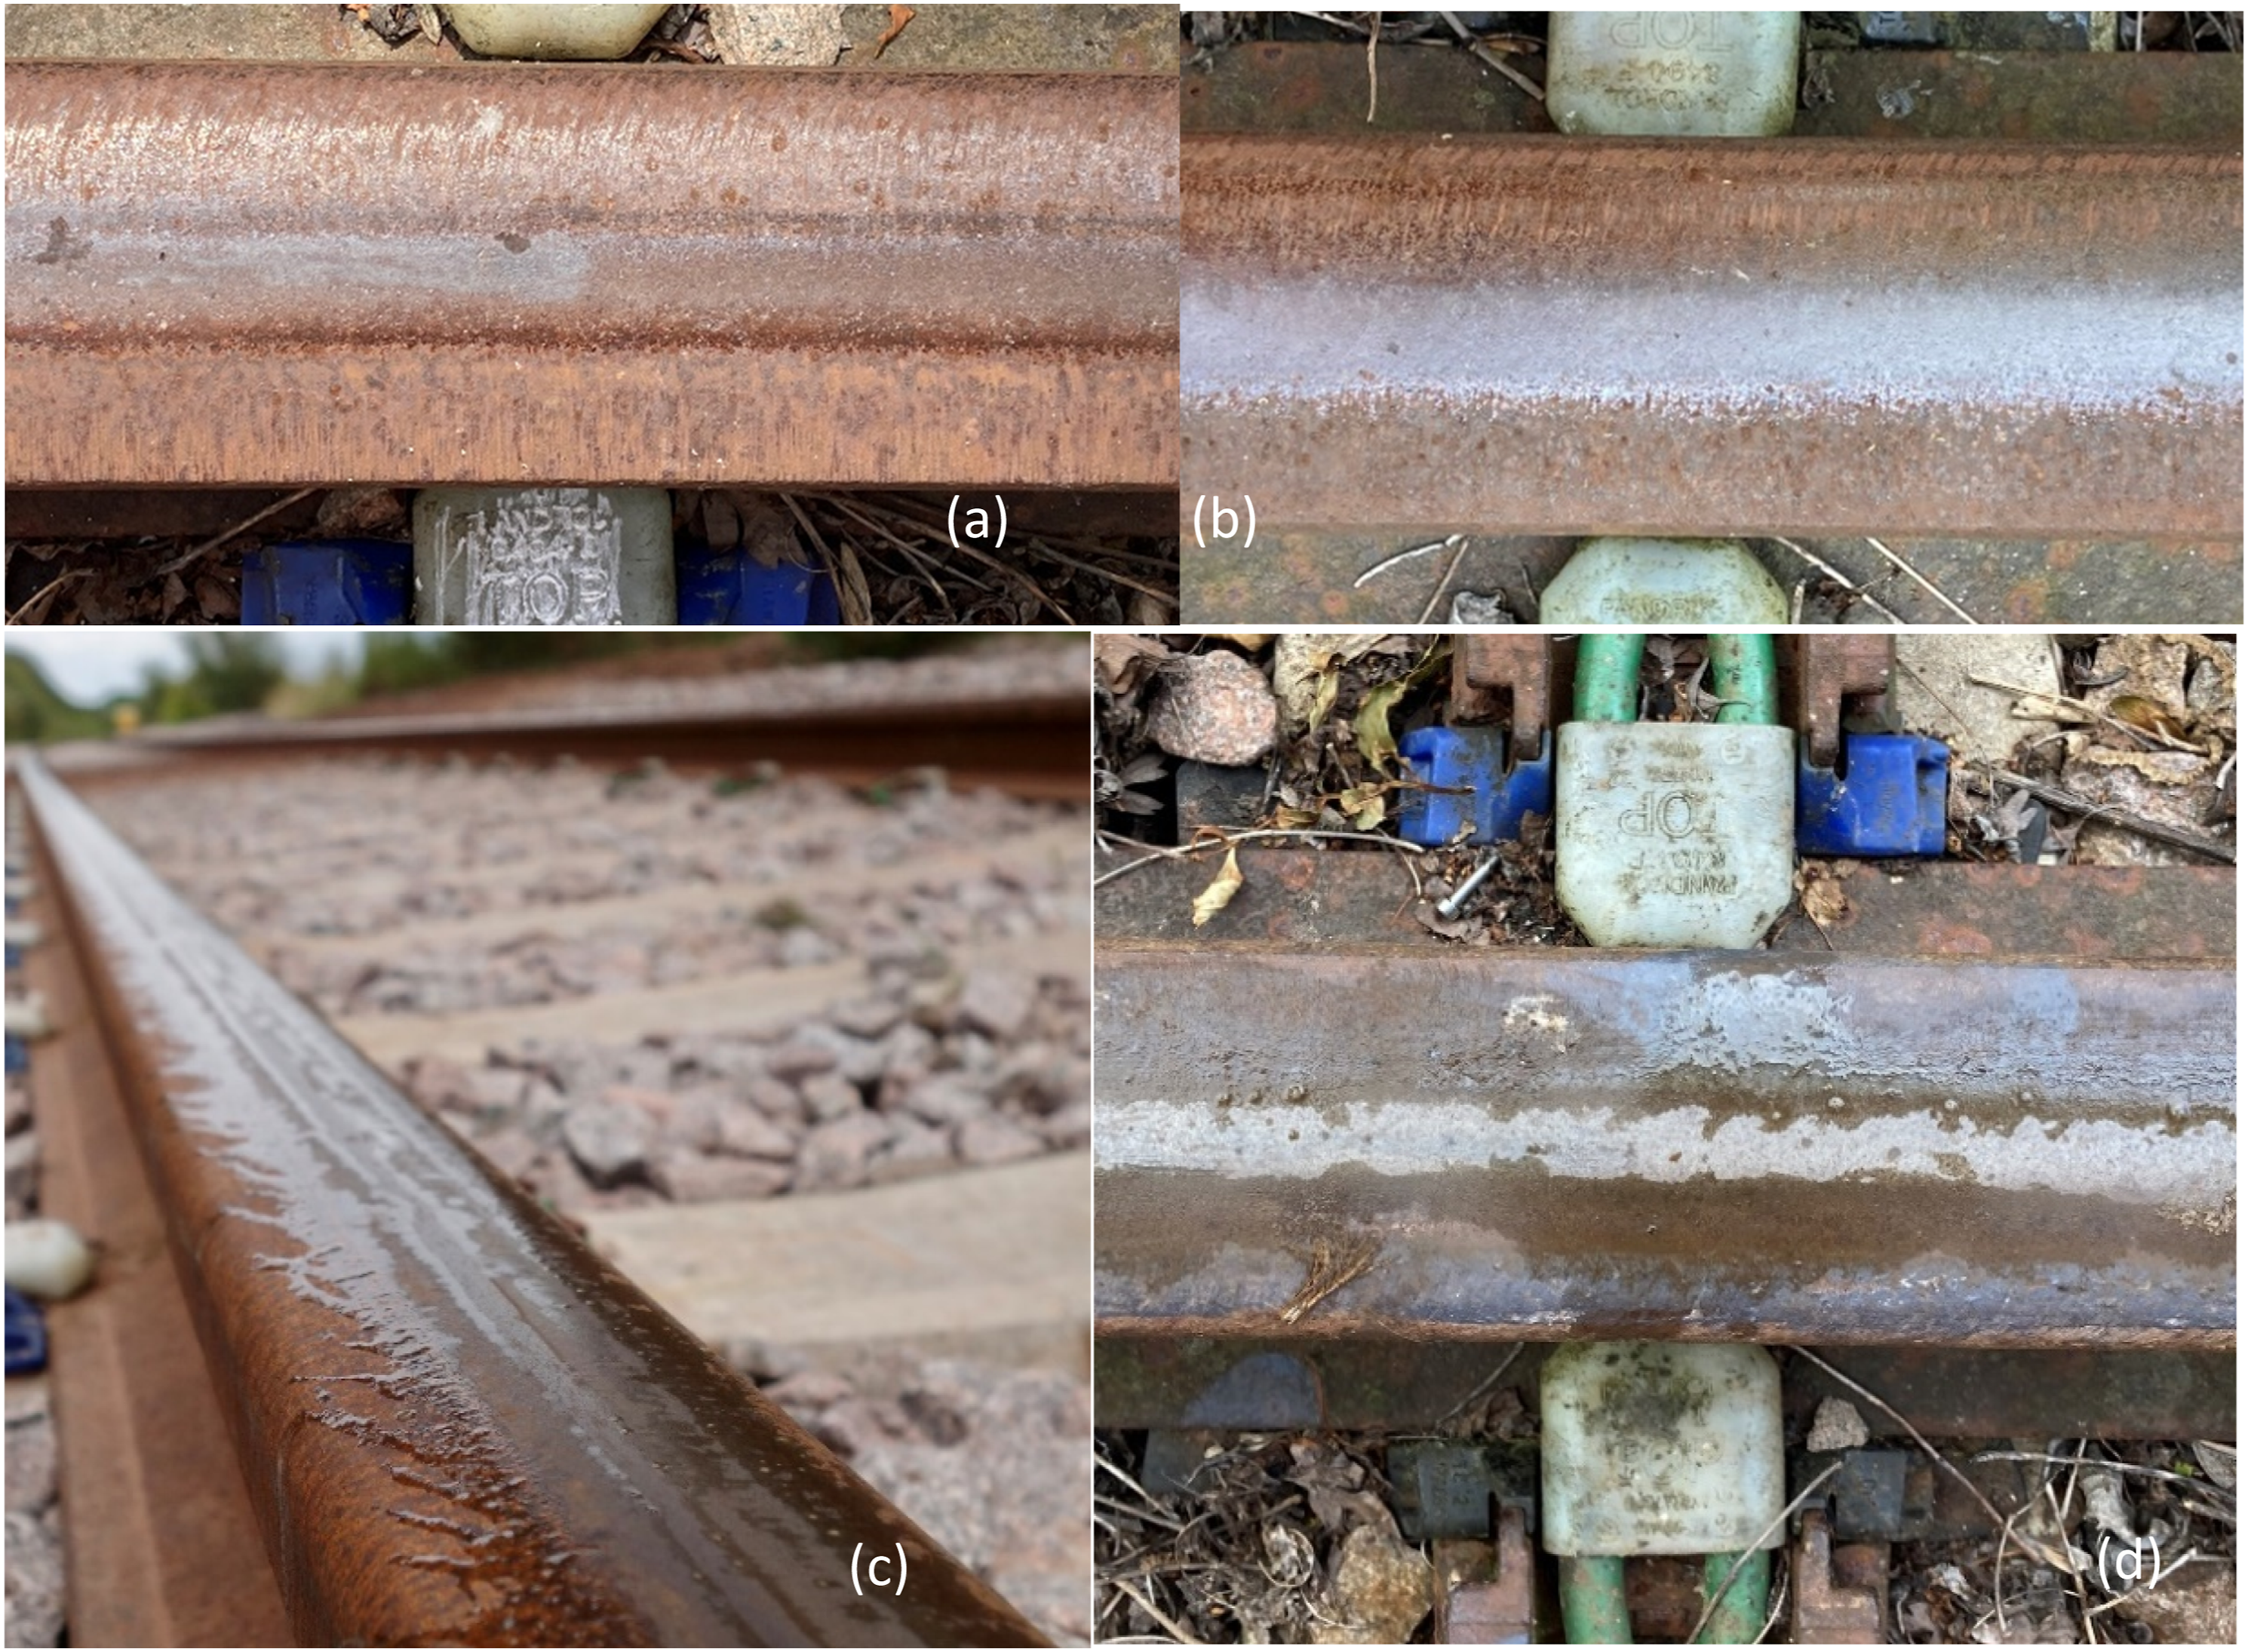
(a) An example of a dry but oxidised railhead (b); an example of a dry, cleaner railhead (c) An example of a wetted railhead (d) An example of a wetted railhead surface with third body layer build-up.
During the wet testing the running band on the rail was often drier and cleaner than the rest of the railhead, with the wheel passage removing liquid and debris, Figure 5(d). A higher friction value may have been measured using the tribometer after a wheel pass due to this drying effect but these measurements may not have reflected the wetter conditions experienced by the leading wheelset. Airflow plays a role in the amount of water dispensed onto the contact band and some sections of this contact band dried faster than others due to differences in initial water coverage, shade from sunlight and wind speed.
Although we undertook measurements at nominally identical locations in each test run, due to the small contact patch of the tribometers relative to rail running band width and necessary removal and re-positioning of the tribometer between train passes we did not attempt to measure the exact same area of rail more than once. For the purposes of this testing this was beneficial, giving an overall picture of railhead condition that the train wheel may experience, rather than a “snapshot” of very small area that the wheel would quickly roll over.
These combined factors and the sensitivity of the Ontrak tribometer to changing railhead conditions mean that the density plot for wet field testing shows a large distribution, but these are variations in real world conditions as opposed to poor measurements of a single condition system.
Another example of friction changes due to a third body layer and the sensitivity of the Ontrak tribometer is that a reduction in friction was observed after a vehicle pass at 60 mph, where lineside debris (such as organic debris and ballast dust) was visibly picked up and deposited on the railhead due to the vehicle airflow at higher speeds. An image of the debris and the resulting friction change is shown in Figure 6. (L) An image of railhead debris deposited after a 60 mph test run; (R) the resulting reduction in friction.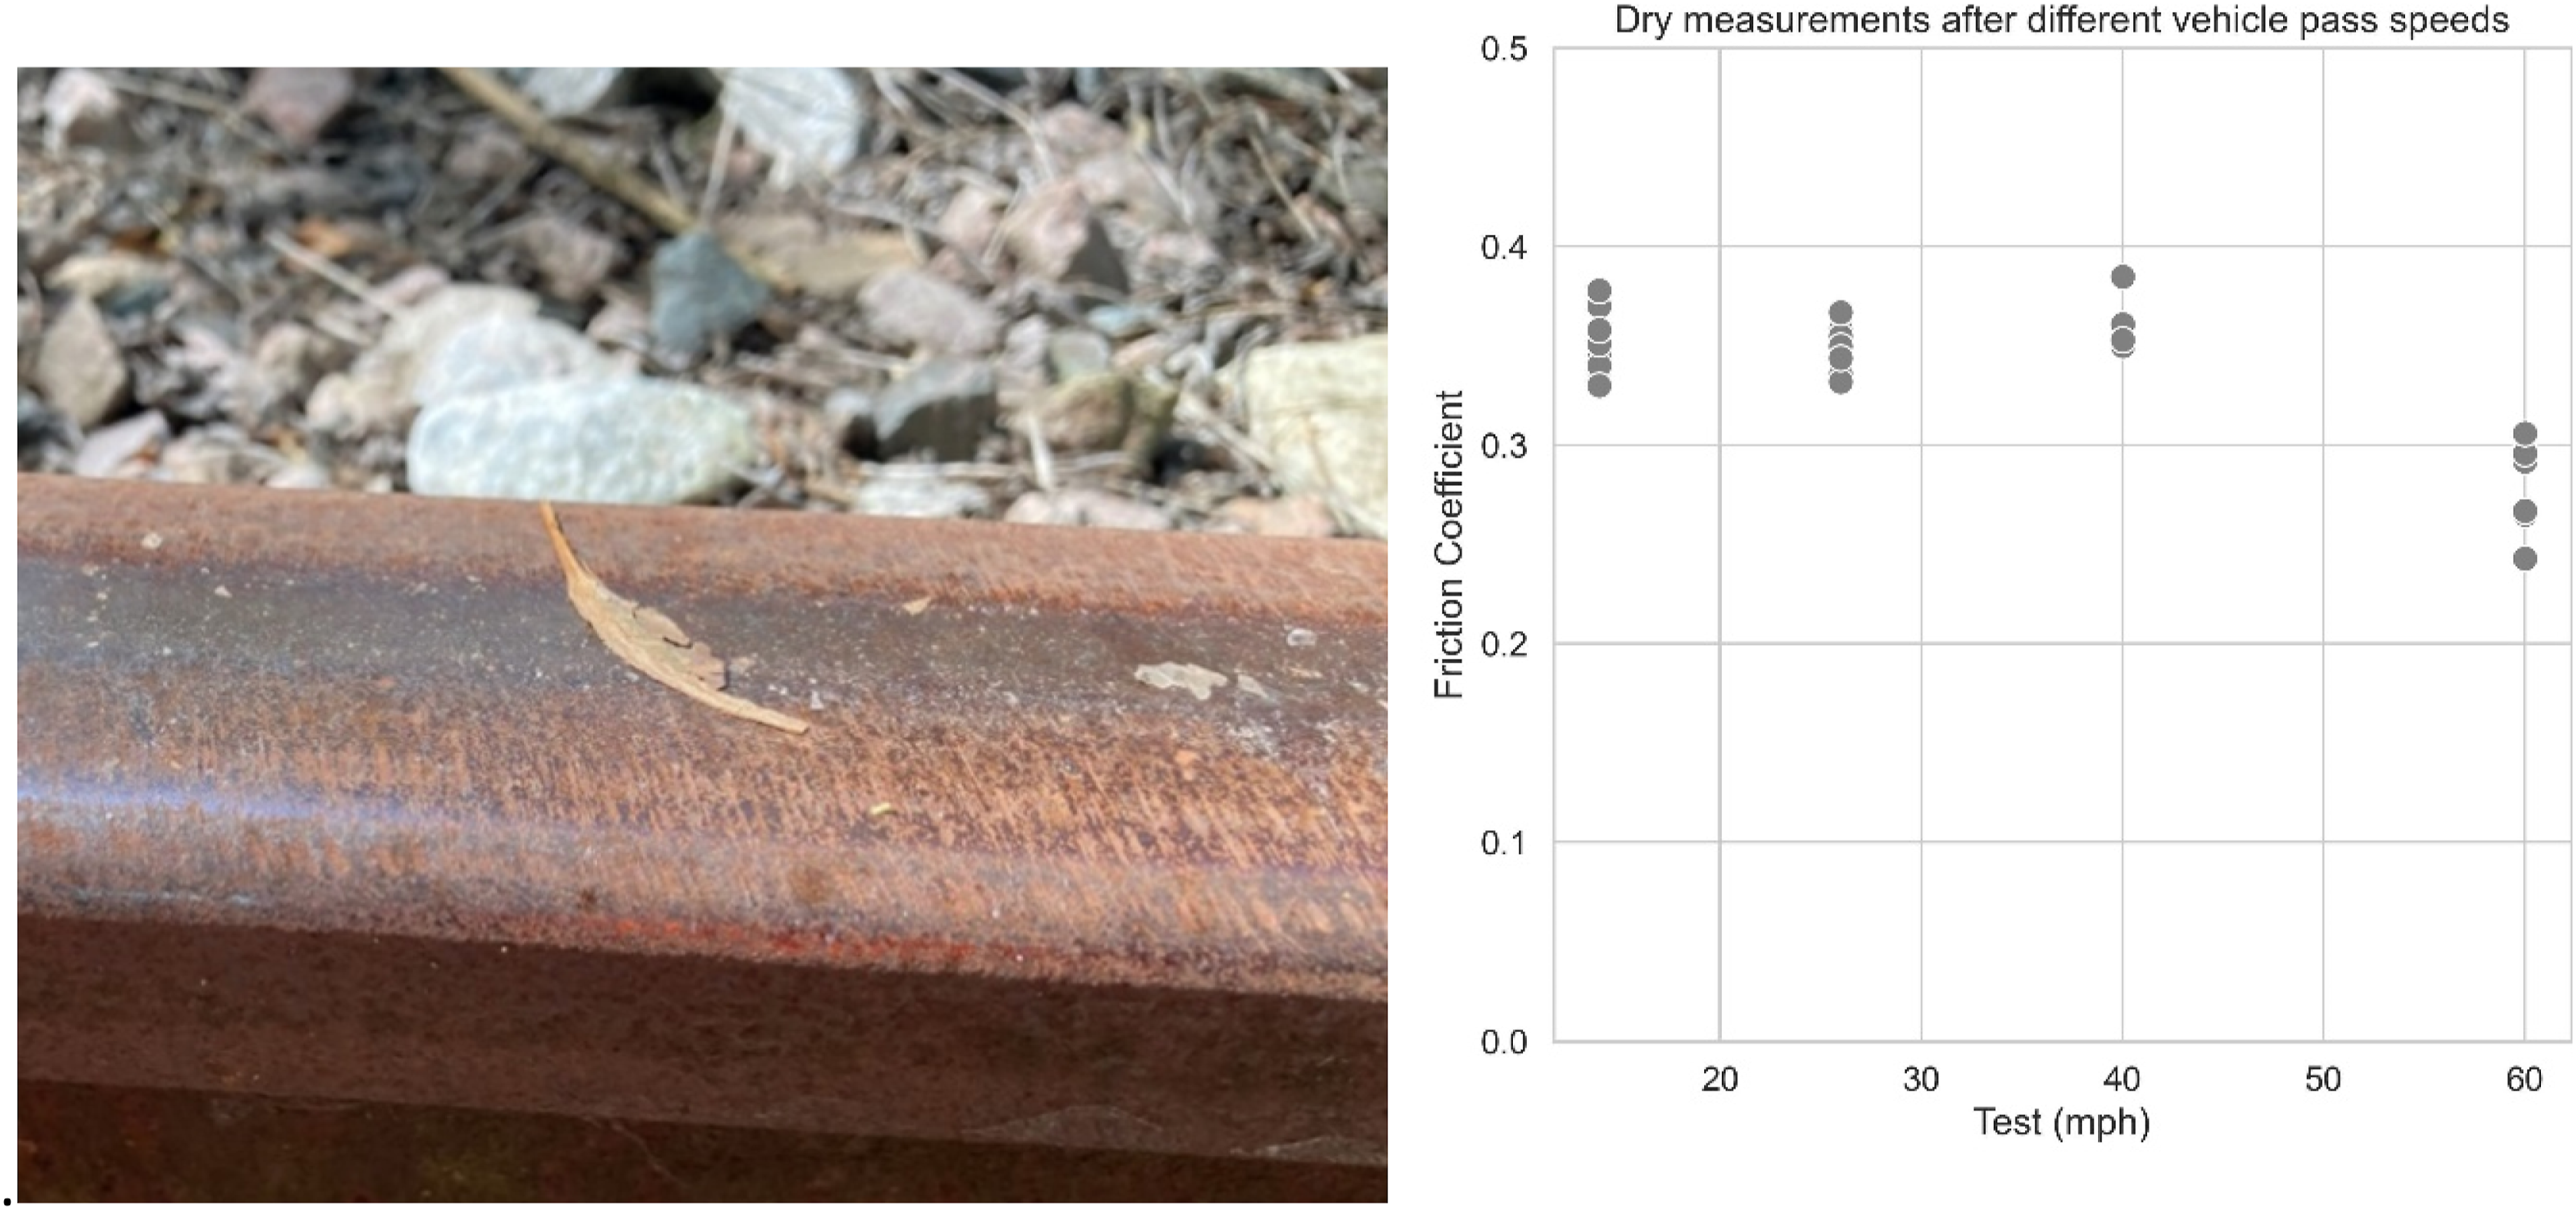
Originally a bimodal distribution was observed for paper tape due to a critical point where friction increased after drying out. Because of this the results were further categorised as “Tape (wetted)”, where the tape was visibly wet during the measurement. This was compared against the drier measurements, labelled as “Tape” in Figure 7. The tape degraded rapidly during testing, breaking up in the running band and eventually being completely removed which meant that friction conditions also changed. Although this is an artefact of the test method rather than a representation of service conditions an alternative test using detergent to reduce friction was found to be unsuccessful in reducing friction as much as was possible with the paper tape approach. (L) Paper tape results after categorising as wetted and non-wetted, (R) An example of a paper tape coated railhead after running in (1), tape worn in and producing low friction (2), tape removed due to wheel passage and rain (3).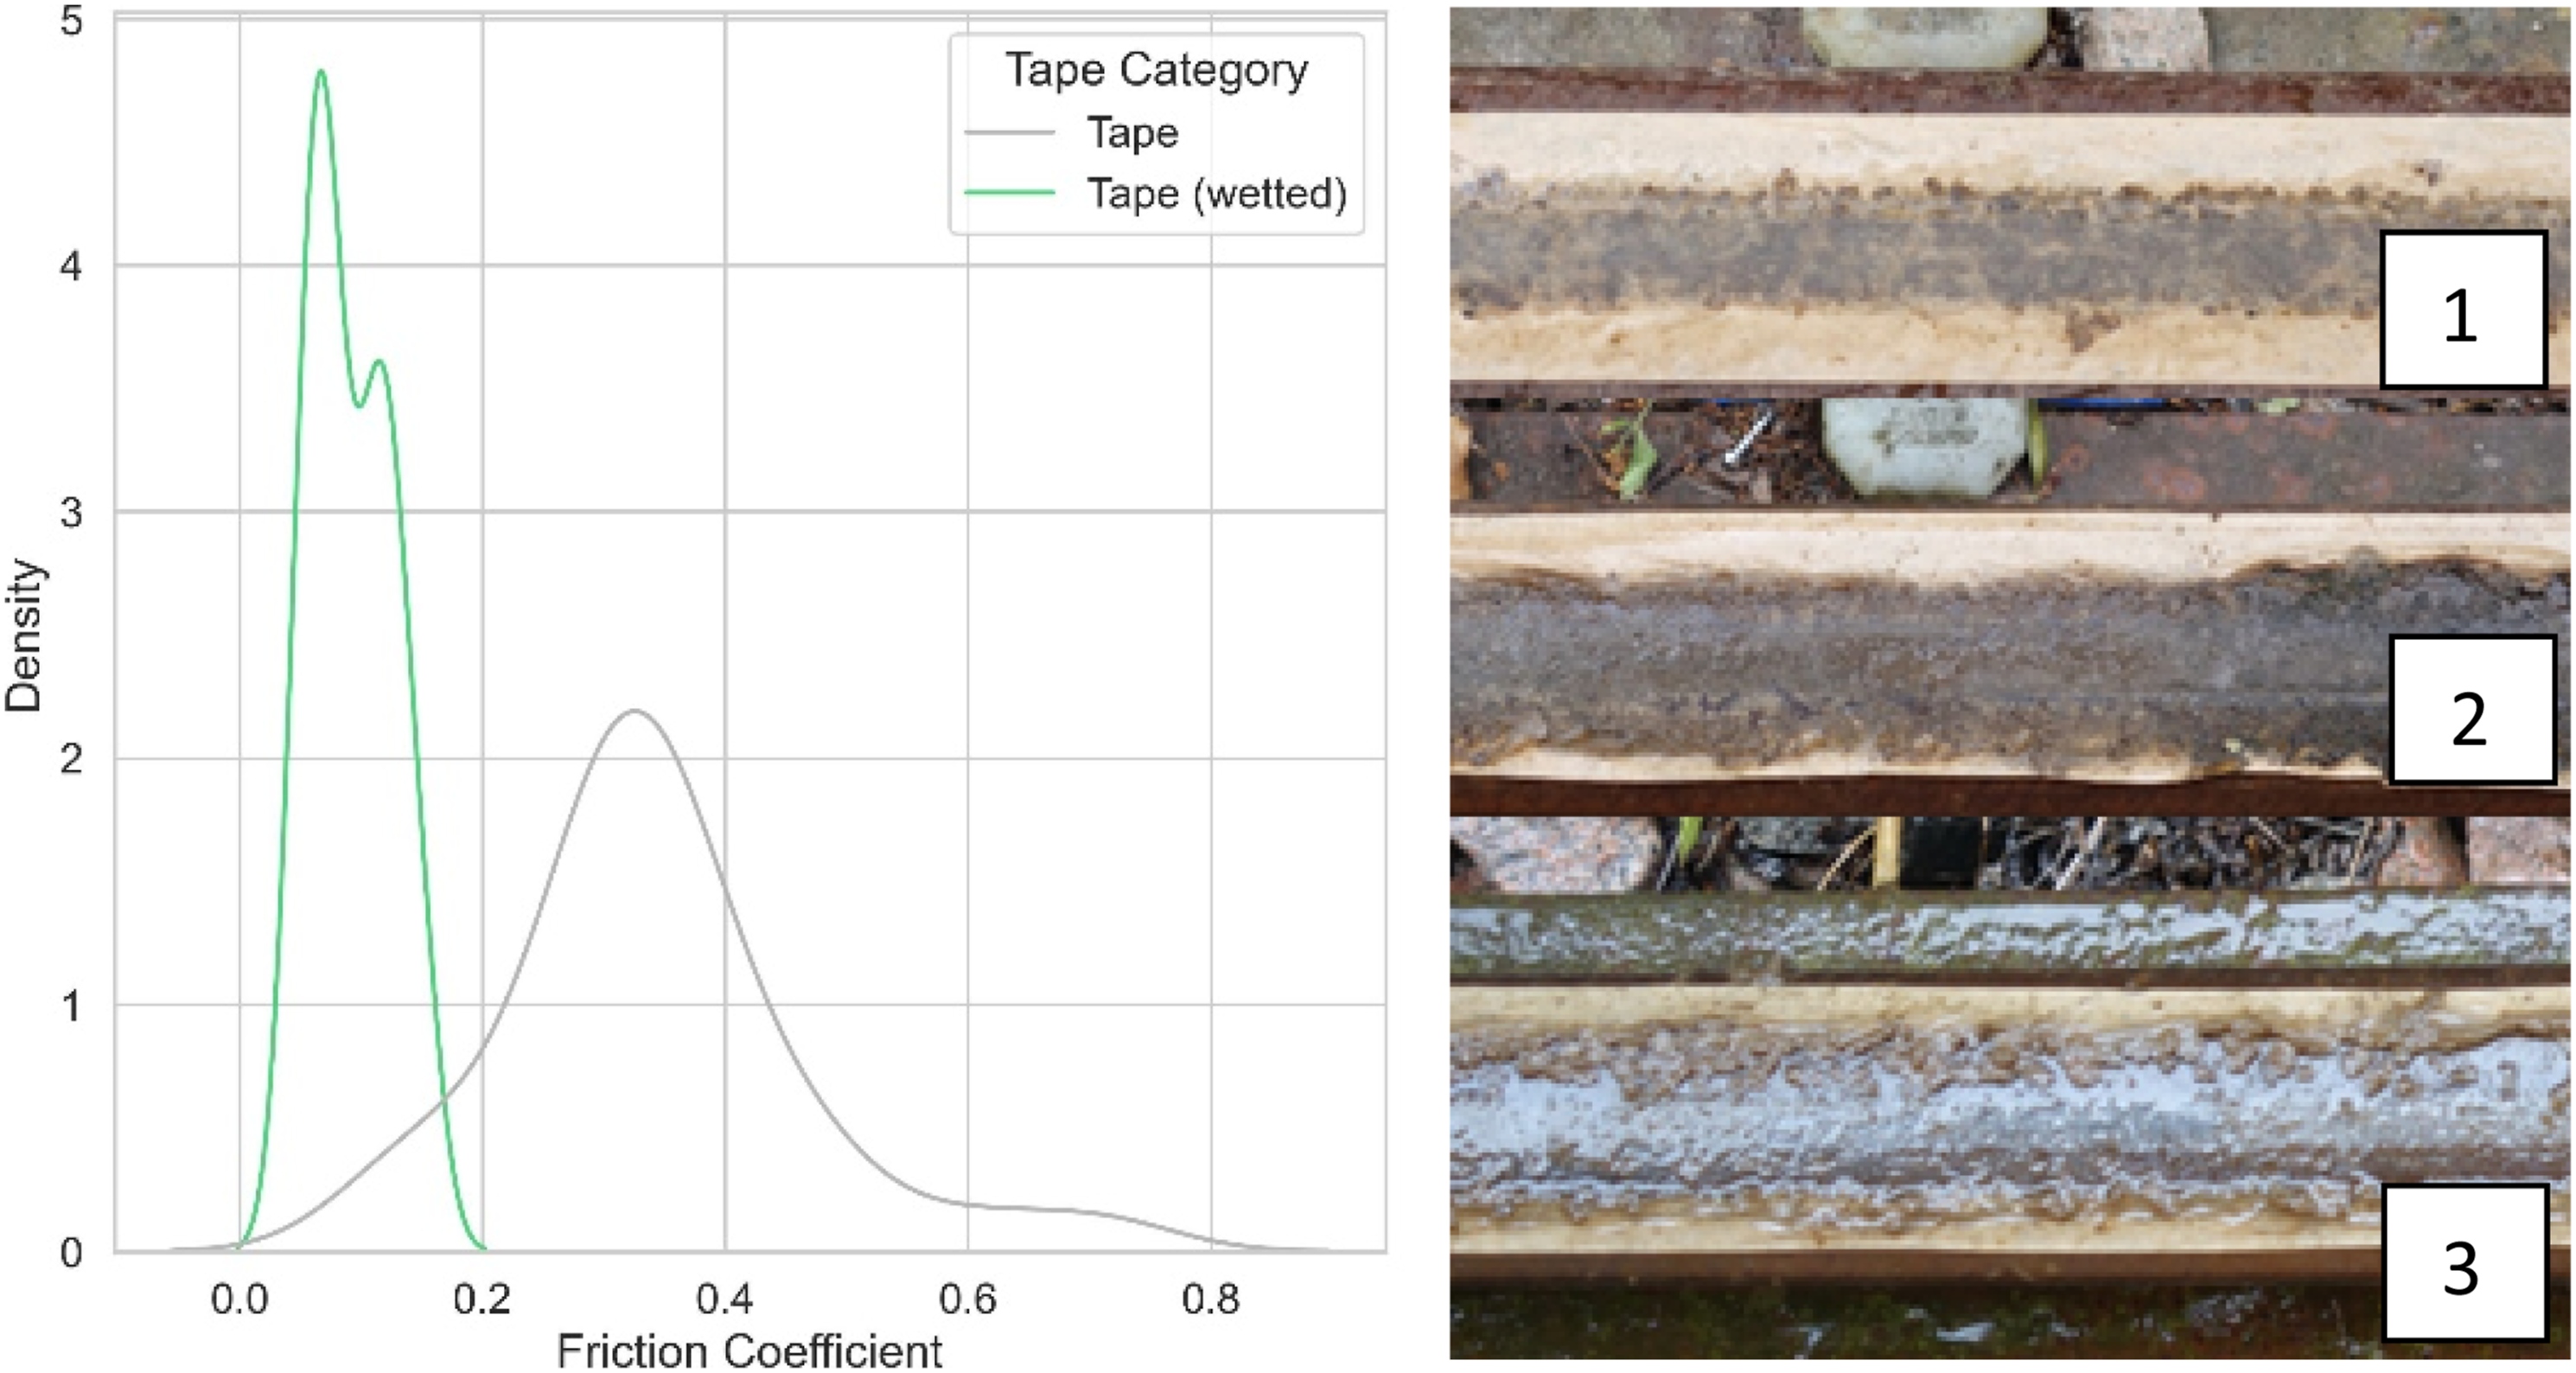
The Ontrak tribometer measurements were taken at a contact pressure of 480-530 MPa, due to device limitations this is at the lower end of the range characteristic of wheel/rail contact. In previous work using this tribometer (using a narrow wheel rim to increase contact pressure 19 ), as well as others on different test rigs, 32 the resultant friction coefficient increases with increasing contact pressure. These studies are for clean, dry conditions. In other full-scale studies the inverse relationship has been found,33,34 this may be due to third body layer effects, but further research should be carried out to verify this.
The absolute values of friction coefficient will vary with contact pressure along with other factors such as contact geometry. Dynamic modelling has been previously successful at estimating this variation and could be used with a dataset such as this in future.
There is good agreement between the Ontrak and Pendulum data collected during this work. Despite the unavoidable variation in environmental and contact conditions when field testing over long time periods, both devices were able to distinguish between the low, intermediate and high friction conditions which were simulated during this testing. Previous work has linked the variability of the friction coefficient with these changing environmental and contact conditions, such as the reduction of friction with increased humidity and variation with temperature 18 and the reduction of friction due to increased third body layer 29
Comparison with other friction studies
Comparison and validation is essential to understand the differences in friction measurements with both varying test equipment and environmental conditions. This section compares the data collected during this study with other sources of friction data, including previous studies using the Ontrak and Pendulum equipment in both field and laboratory.
Due to field testing being expensive and time consuming, there are few studies that show the variation in friction coefficient over extended periods of time. One of the most diverse studies available is the British Rail tribotrain data, a vehicle with an instrumented braked wheelset that measured the UK rail network from the 1970s to 1990s. As far as the authors know, the full dataset is no longer available. However, two of the published histograms for dry and wet values have been digitised and compared against the results of this study.
A kernel density plot of Ontrak “dry” values collected during this work is plotted alongside British Rail tribometer-train friction values collected in “good” weather on the Burton-Birmingham mainline, shown in Figure 8 (L). A similar plot for wet conditions is shown in Figure 8 (R). The paper states “Adhesion varies between 0.04 and 0.55 with the average being approximately 0.3”, wet values are closer to 0.2”.
35
This correlates well to the results of the current study, with an Ontrak median of 0.31 for dry values and 0.20 for wet. The low friction coefficients below 0.15 measured by the British Rail tribotrain could be due to the presence of water, grease or organic layers on the railhead as the tribometer train was running on service tracks to explore real conditions not on a specially prepared test line. (L) Dry Ontrak measurements from this work (331 measurements) plotted with British Rail tribometer-train values (687 measurements), collected in on the Burton-Birmingham mainline; (R) Wet Ontrak measurements collected during this work (44 measurements), plotted against British Rail tribometer-train data under wet conditions (94 measurements).
35
Scott bandwidth factor 1.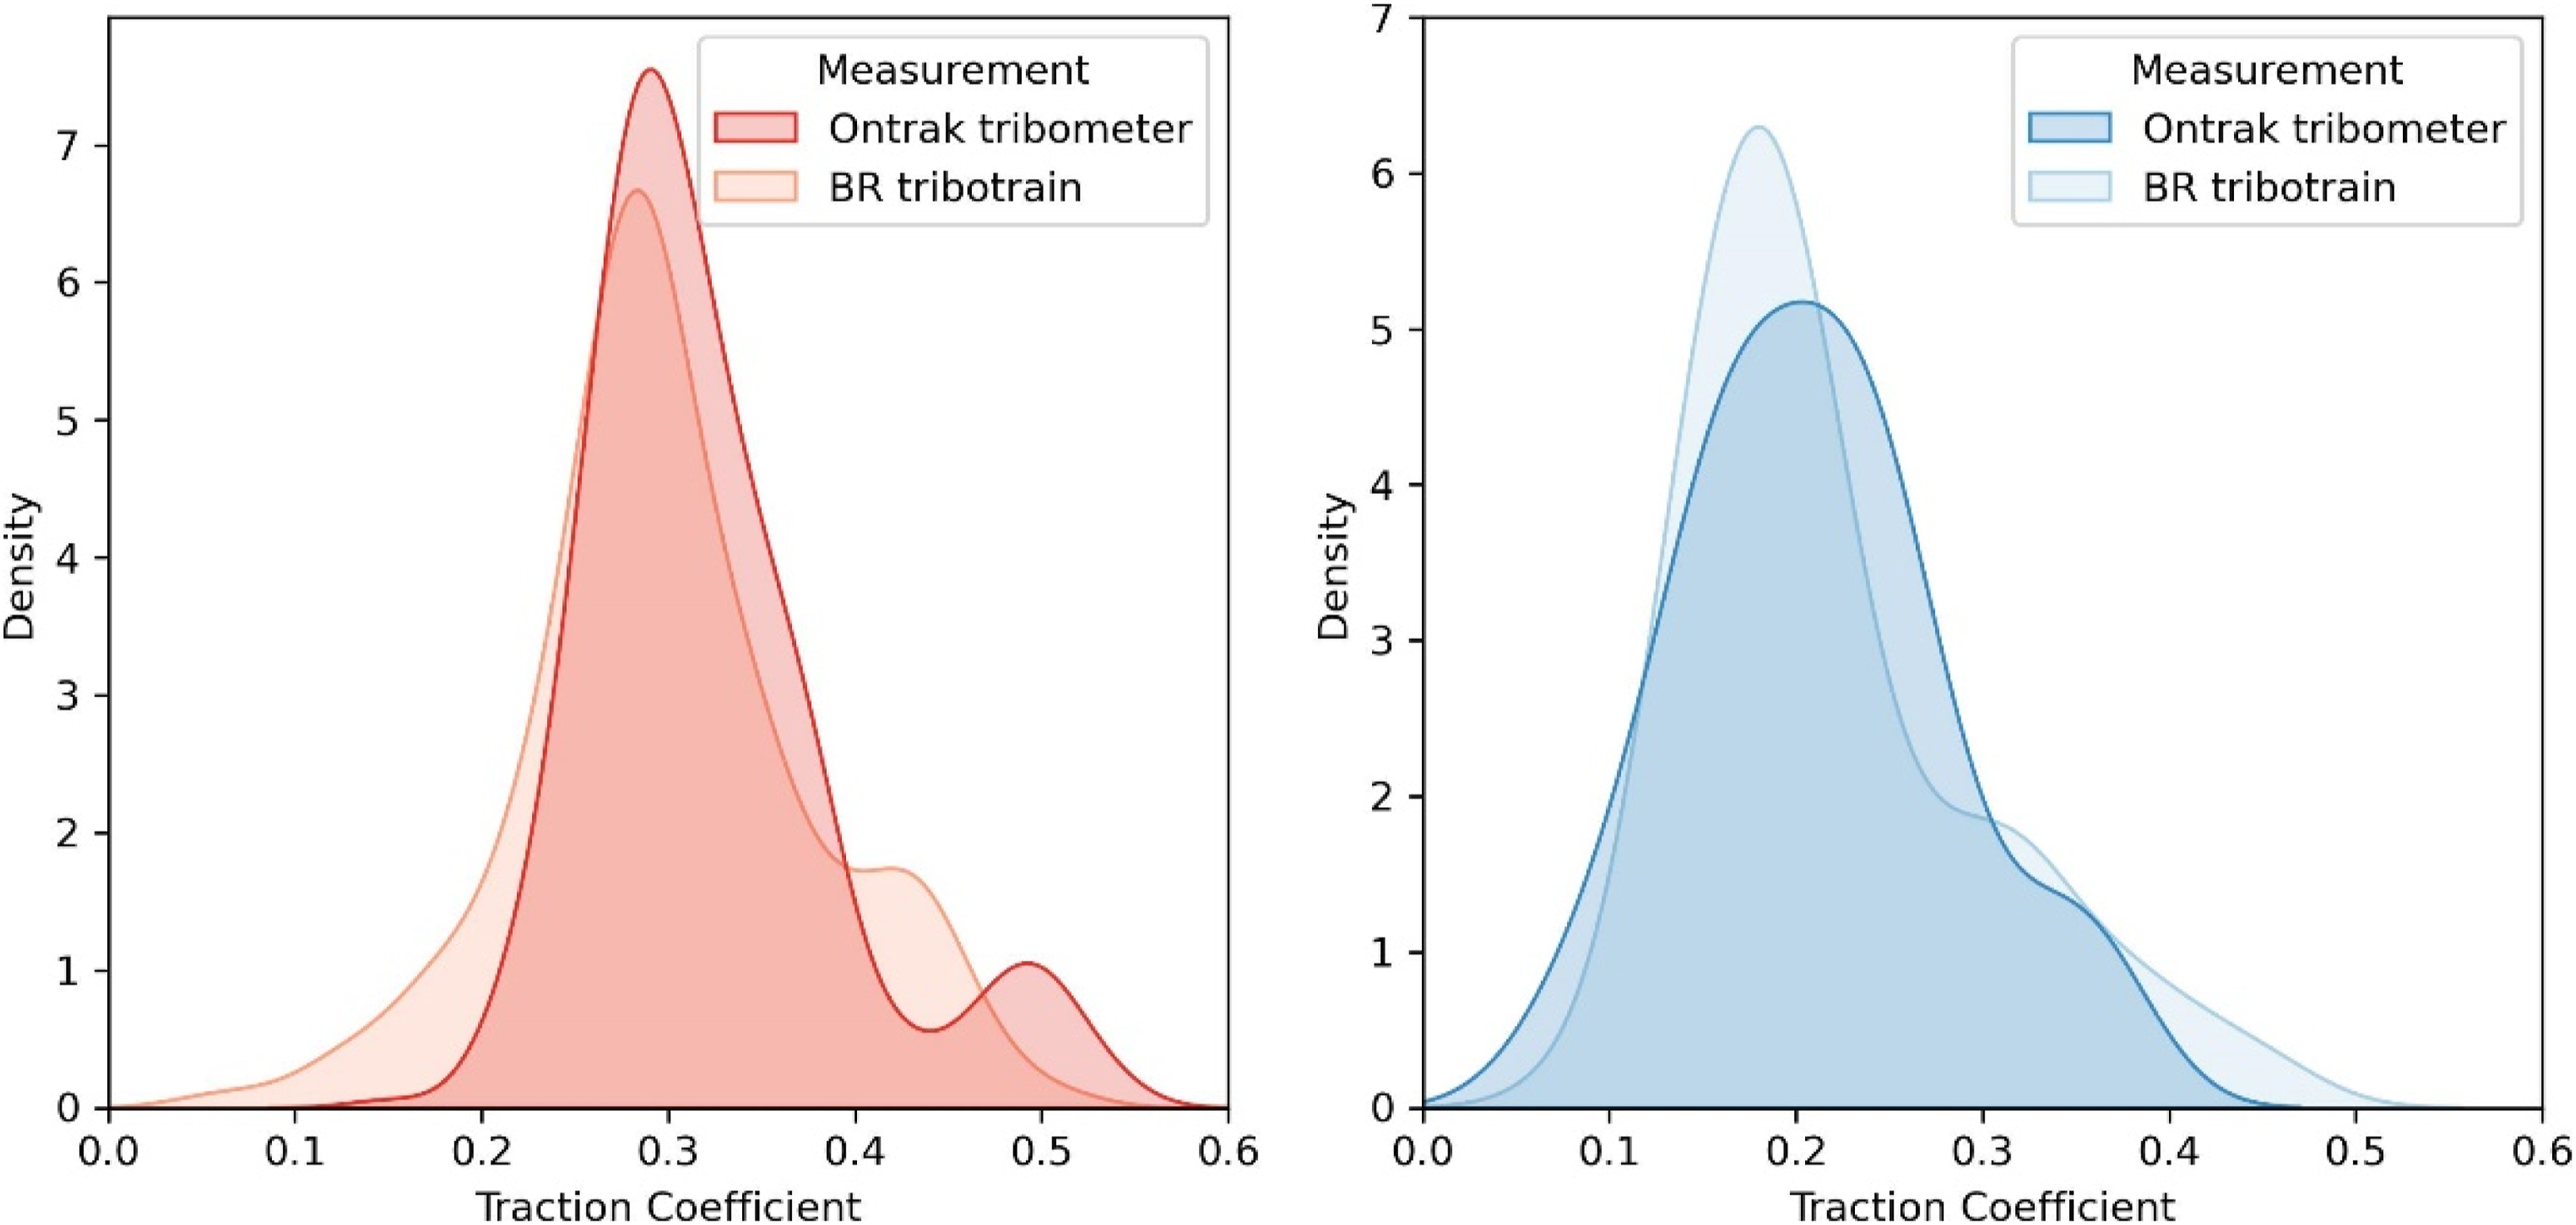
Tribometer measurements have been used previously as a low-cost method to provide input into locomotive/track multibody simulations, to study the effect of locomotive behaviour on wheel 27 and rail 36 damage. This can be used as part of predictive maintenance or for optimising operational conditions to maximise asset life. An extensive review of creep forces 31 highlighted the transient surface conditions and the time and space dependence that may lead to friction variance. The review notes that whilst some models use a steady state view of friction forces, newer models acknowledge that the wheel and rail surface conditions may change over time and for subsequent wheel passes. Operational datasets such as this that capture these transient conditions could be used in future as inputs into these models, for safety (stability, stopping), efficiency (traction) and cost (wear and RCF damage) benefits.
A plot showing typical reported friction coefficient ranges between other laboratory and field measurement equipment is shown in Figure 9, the sources and contact conditions shown in Appendix. Not all contact conditions could be matched for this study, but were obtained as closely as possible and also noted in the table. The data show the Ontrak and pendulum equipment applied on the test track generate friction results comparable to other field based studies. Irregularly used lines such as the one used during this work generally have more railhead debris/thicker third body layers due to fewer wheel passes and therefore a lower friction coefficient that regularly used mainlines,
37
which may explain why the dry values in this study are slightly lower than other Ontrak tribometer studies. A comparison of dry and wet friction ranges between different test rigs. Referenced work is shown in the Appendix.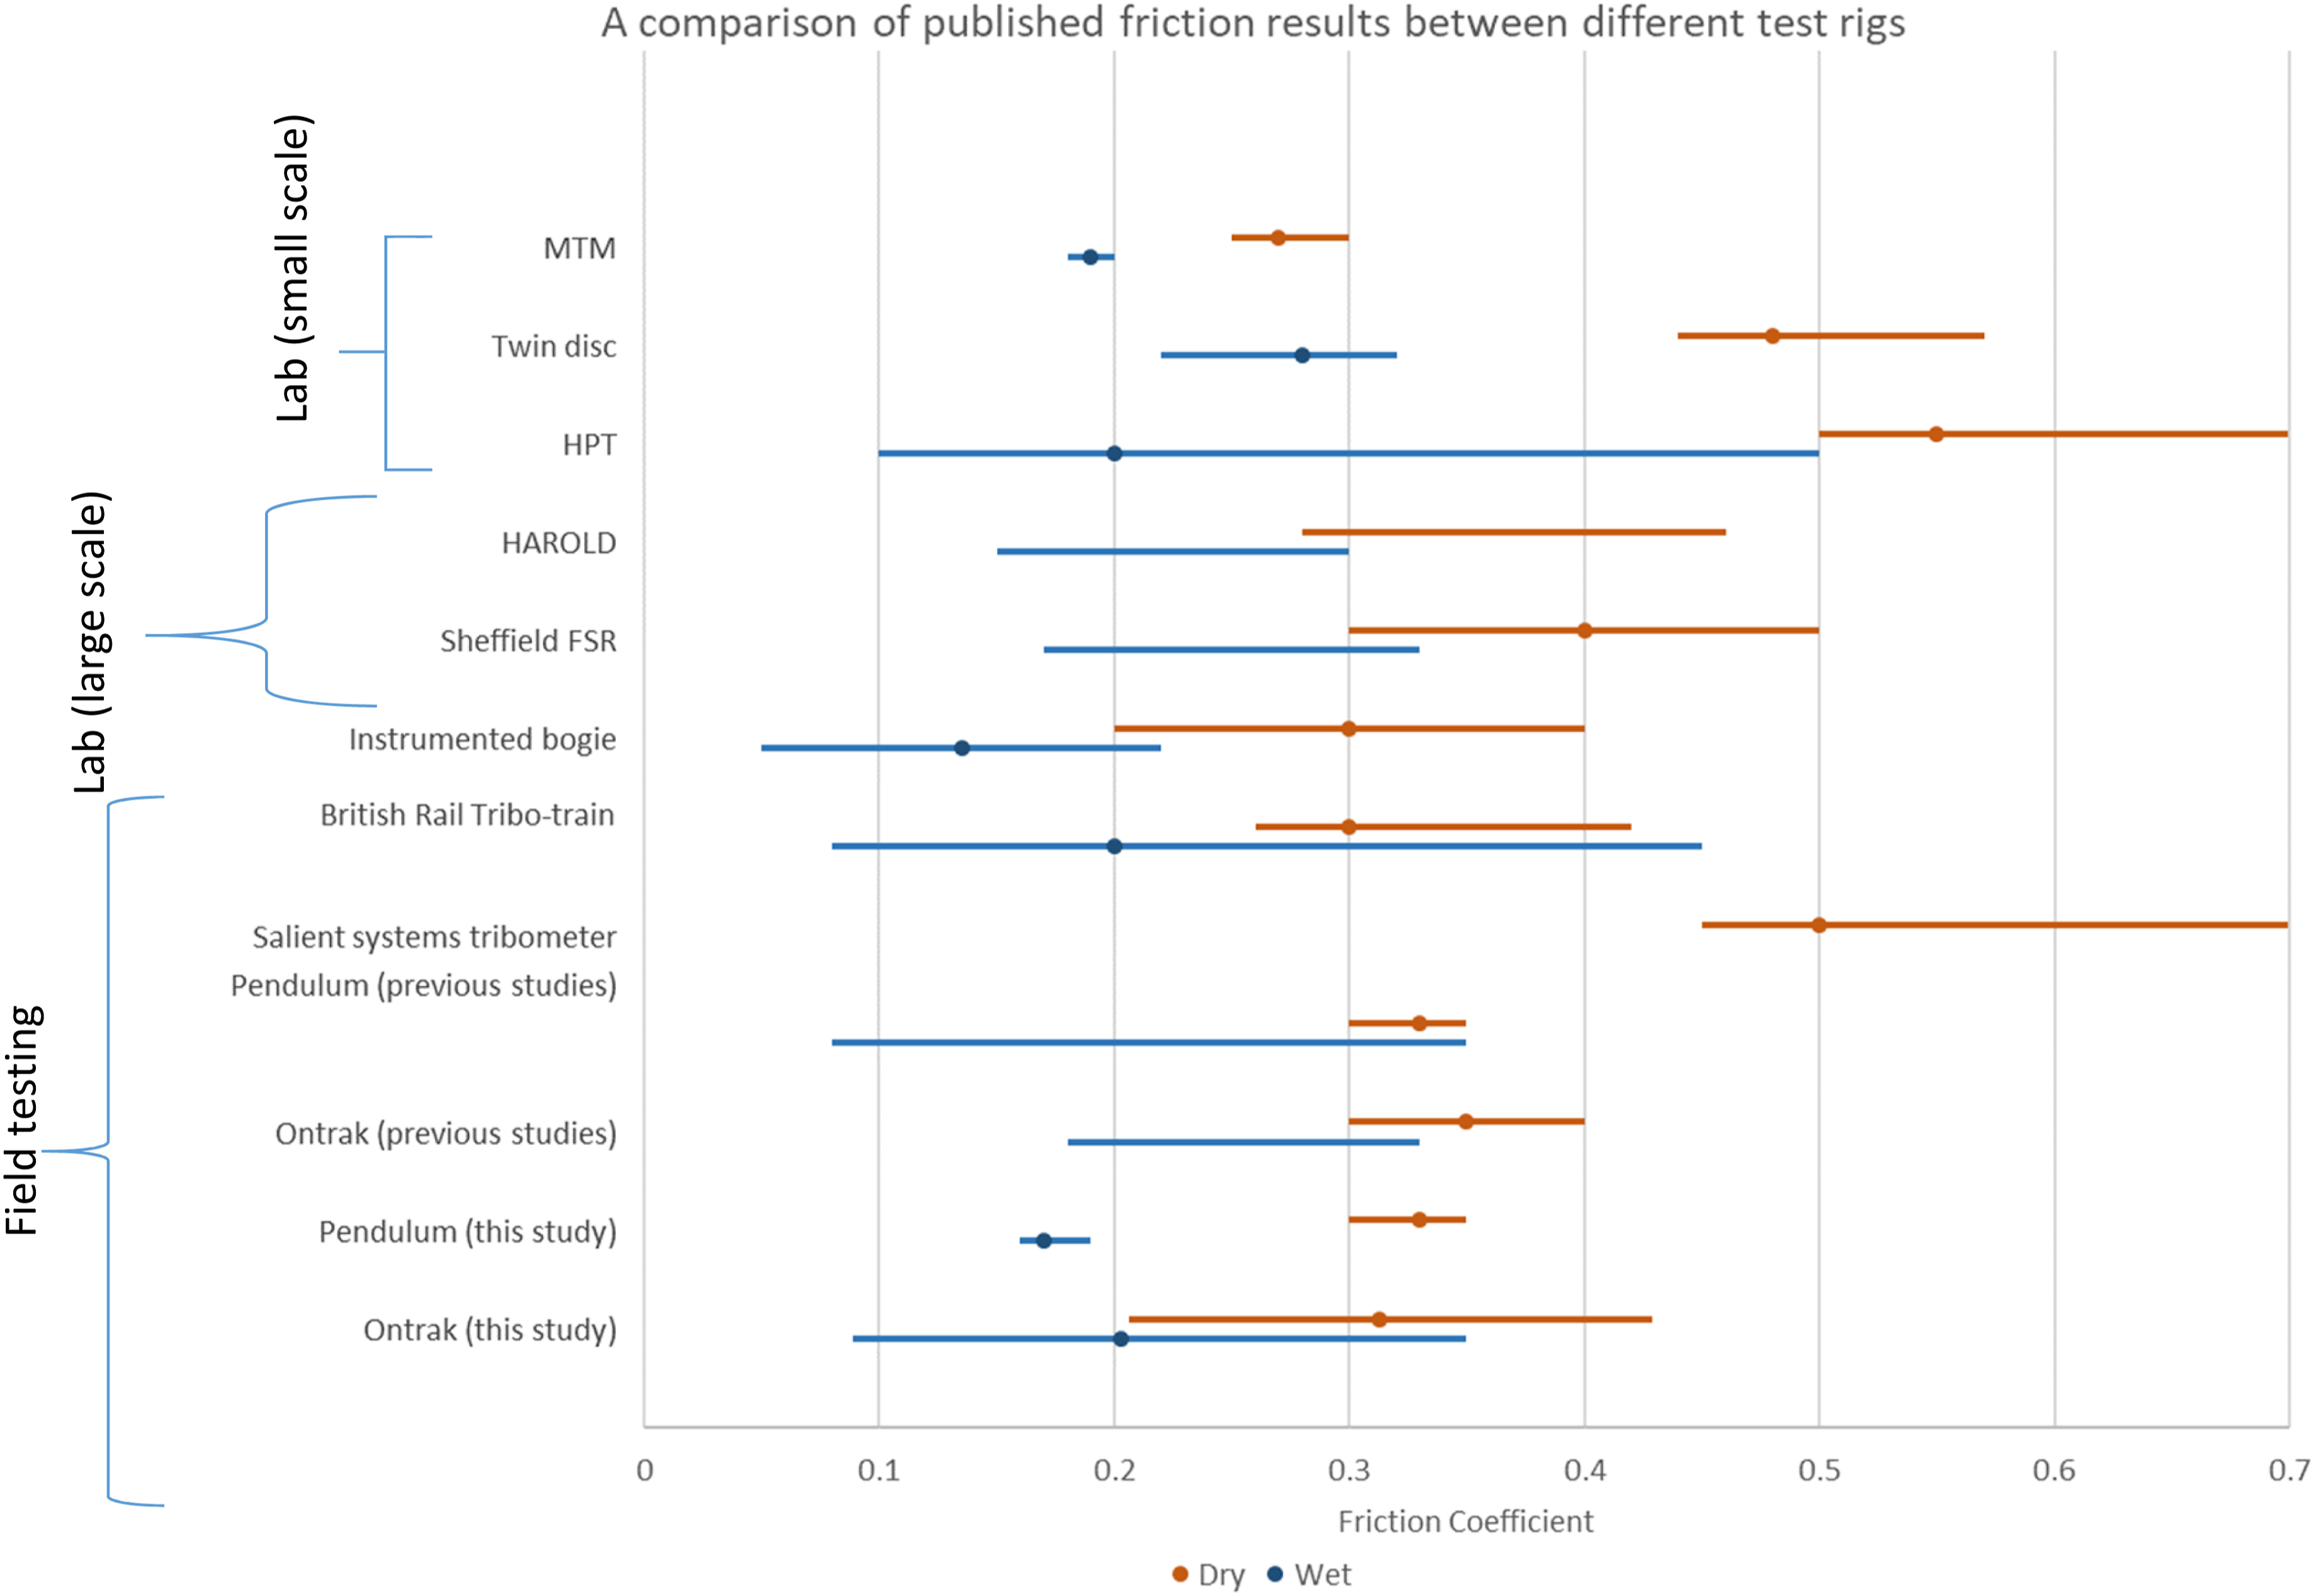
The field studies involving wet conditions often have a particularly large range from wet to dry values due to transient conditions, the top end of the range overlapping with dry values and the ability of water to mix with railhead debris to cause a low friction coefficient below 0.1 under certain conditions. 38 The laboratory based test equipment typically measures a higher friction coefficient than the field based tests, also observed in this study in Figure 3.
Conclusions
Friction conditions for three different railhead conditions using two friction measuring devices were measured at a Network Rail Innovation and Development Centre, in Tuxford, UK. The diverse range of conditions tested over a 4-week period is one of the most extensive trials of the Ontrak tribometer under operational conditions.
Despite the unavoidable variance in field test conditions over a long term study, both the Ontrak and pendulum tribometers were able to distinguish between high, intermediate and low friction conditions. The two devices would be appropriate measurement methods when quantifying the extent or causes of autumn organic contamination or assessing the effectiveness of friction management methods.
The Ontrak mean results correlated well to the pendulum under high and low friction conditions when using British Rail’s SRV/friction coefficient relationship. Future work, using a larger database of pendulum measurements, could be carried out to assess if this relationship could be modified for a better agreement. Under the comparable dry and wet railhead conditions, the Ontrak tribometer results provided good correlation with other reported friction values such as those collected by British Rail’s tribometer train and could be used to validate future friction measurement methods as well as the other use cases identified in the introduction. Friction coefficients during the field tests were lower than the laboratory testing, likely due to the role of the third body layer.
The range of friction conditions shown in these field studies and the associated operational impact on vehicle performance, infrastructure longevity, carbon emissions and passenger safety highlights the importance of friction measurement and management.
Footnotes
Declaration of conflicting interests
The author(s) declared no potential conflicts of interest with respect to the research, authorship, and/or publication of this article.
Funding
The author(s) disclosed receipt of the following financial support for the research, authorship, and/or publication of this article: This work was supported by Network Rail [project number 171518].