
Abstract
Key Performance Indicators, such as station overruns and delay minutes, are used to assess the performance and punctuality of the GB railway. They can be used to quantify the effects of low adhesion, but the majority of previous analysis has been constrained to the autumn season. A Python script has been created in this work to extract 11 years of detailed passenger and freight station overrun data, throughout the entire year. The information gathered includes time and date, location, direction, vehicle type, railhead conditions and subsequent delay minutes caused by the incident. Although the majority of low adhesion related overruns occur in the autumn season due to leaf fall, this work has highlighted the number of low adhesion related issues that occur throughout the year where there are no visible signs of contamination. This work gives an overview of this new dataset and looks at some key trends in the data but the granular detail available means that future case studies could be carried out in specific locations, linked to geographic and meteorological data, to assess when and why low adhesion is occurring. From an operational perspective, the dataset could then be used as a daily updated assessment of the effectiveness of low adhesion mitigation methods.
Keywords
Introduction
Low adhesion issues are well documented in the autumn season, where fallen leaves react with the steel railhead to form a tenacious organic layer that causes low adhesion conditions,1,2 resulting in safety concerns, damage and delays. 3 Low adhesion is also known to occur at other times in the year, for instance due to ice or the wet-rail phenomenon, where a small amount of water can mix with iron oxides or wear debris to form a friction reducing paste on top of the railhead.4,5
Key performance indicators (KPIs) are used amongst the GB rail industry to assess how the seasonal performance of the railway compares to previous years. These are used to highlight any changes in infrastructure, management or timetabling that may be required to work towards a more efficient railway. Using performance analysis to work towards a more efficient railway will become more important as the rail industry tackles increased traffic volumes, higher speeds and the increased likelihood of extreme weather events due to climate change in future.
Station overruns, where a train is unable to stop in time for the station stop, can occur due to inadequate friction and have been previously used as KPIs in assessing trends in low adhesion conditions, but previously available data was limited to the autumn season between October and December.2,6 Previous work has analysed both leaf and non-leaf related incidents and concluded that moisture was an influencing parameter, with an increase in station overruns after light rain and during the morning and evening hours where dew may form on the railhead.2,6
A graph showing the number of three different KPIs (signals passed at danger (SPADs), station overruns and wrong side track circuit failures (WSTCF)) between 2006 and 2016 is show in Figure 1, reproduced from the data presented in the Seasonal Challenge Working Group handbook.
7
WSTCF occur when a non-conductive contamination layer on the railhead (for instance a leaf layer) causes an interruption of the electrical track circuit, the position of the train can no longer be detected which results in signalling issues. The number of leaf fall related SPADs each year is much lower than the number of WSTCFs and station overruns. Autumn leaf fall related KPI data from 2006 to 2016, reproduced from.
7
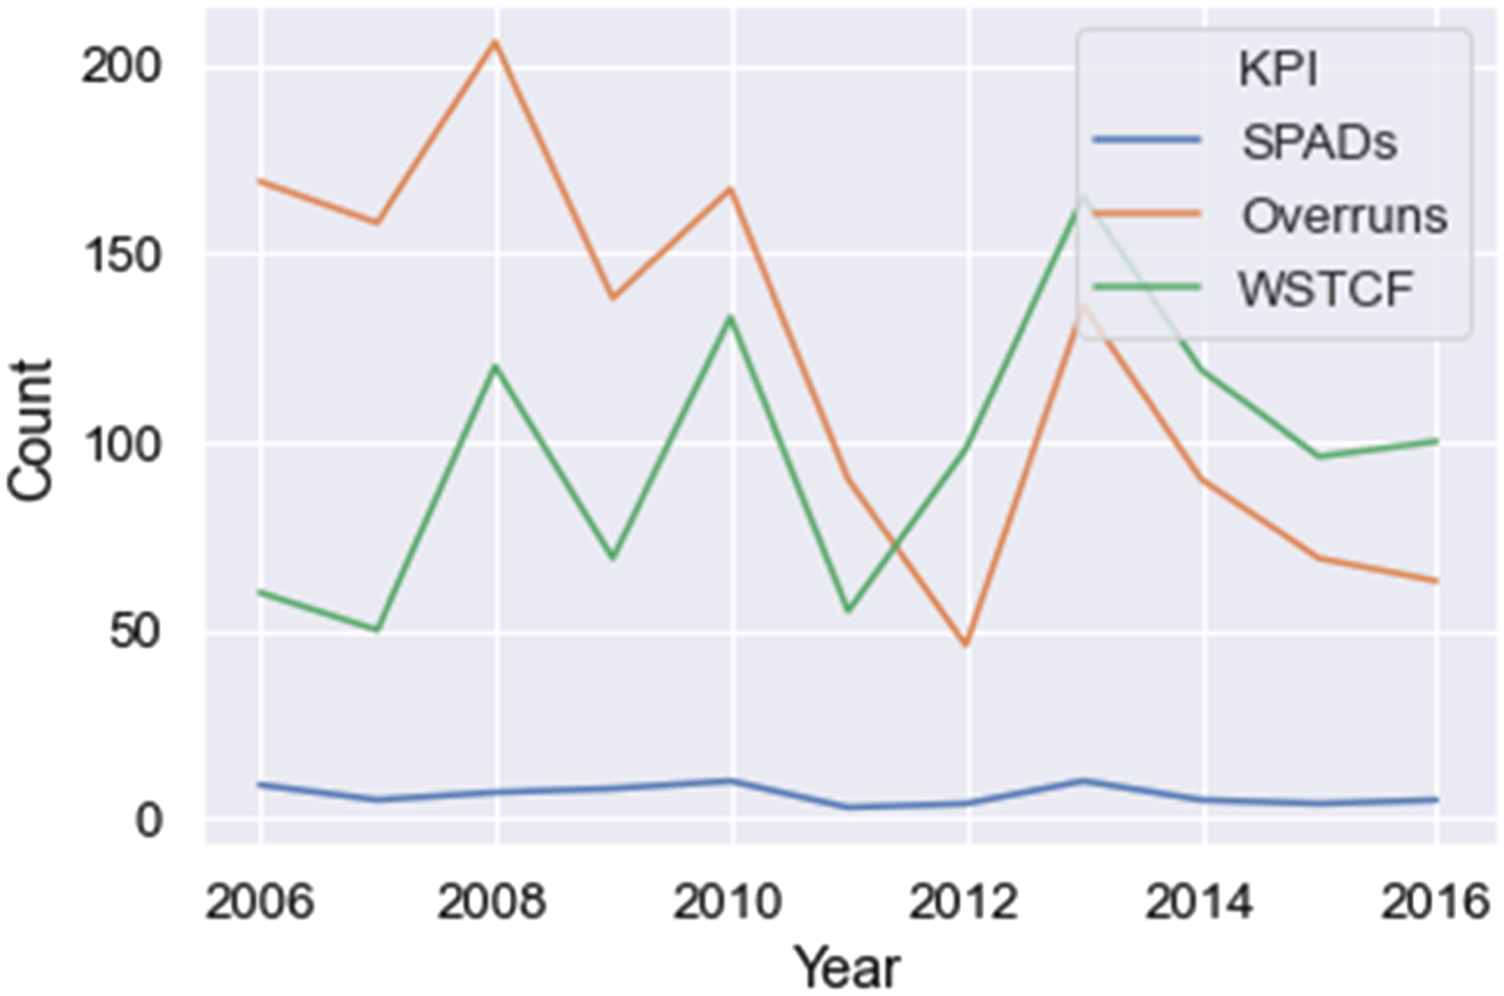
Network Rail National Operations Centre (NOC) daily incident logs are Microsoft Word documents, updated daily by route incident controllers (staff who manage any potential incidents or delays on the railway for each route) and give a picture of the whole network situation. The logs are released daily, all year round, by email to rail industry personnel that require daily briefings. They contain amongst other criteria, lists of incidents such as delay minutes, station overruns and SPADs. They also cover freight trains and document locomotives stalling and “slip to stand” incidents caused by low adhesion.
A method was developed in this work to extract the key pieces of information out of these Microsoft Word documents as a CSV file. The objectives for this data analysis were to provide an overview of this newly available dataset and filter this to assess any trends in low adhesion incidents over the available time period. Information can be extracted to show detailed nationwide data, as well as more granular localised case studies. The benefits of this dataset over previously available data are as follows: • Data is available for the full year and not just limited to autumn season • Dataset can be updated daily after the NOC logs are released, rather than waiting until the end of the season/year for data to be released • Large dataset, beginning in 2007 • Contains information on freight as well as passenger data • Easily linked to geographic co-ordinates • Contains written descriptions of incidents, which are useful for local case studies
It can be particularly difficult to quantify the effects of low adhesion management methods due to the large number of variables that can contribute to low adhesion. The up-to-date, local case studies that this data can provide, compared against a large database of historic incidents, may provide a method to better assess implemented mitigation strategies.
Data collection
Station overruns were initially considered because they are a key performance indicator of low adhesion that occurs regularly (Figure 1) and can be linked to a specific location. Previously, station overrun data has only been available for certain years during the Autumn season2,6 so this is the first time that the full year could be analysed.
Data from 6,253 station overruns were extracted from the NOC data set, from 2007 to 2018. The Word files were initially difficult to work with, as different file types were used (.doc and .docx), key information was buried in text and the layout varied from year to year. Individual files had to be opened separately so it was difficult to compile data. A Python (general purpose programming language) program was first created to convert all the files to .docx and extract the station overruns by searching for keywords in the document titles and extracting the subsequent text, which is included in the supplementary data for this work. Extracted data was in CSV format and contained the following: • An information paragraph describing the station overrun • Train Running System (TRUST) data providing delay minute attribution • Whether leaf contamination was present upon track inspection after the incident • Date and time • Engineer’s line reference (ELR) giving a location
The information paragraph was used to determine vehicle class and searched for the station name. Geopandas (a geospatial data manipulation tool based on the Python programming language) was then used to provide a longitude and latitude for the named station which was plotted onto a railway base map for the UK.
The information paragraph also often contained a brief description of the incident. It appeared that certain re-occurring key words were used to describe low adhesion situations (exceptional or poor adhesion, slippy, slippery, wet-rail, reportable railhead conditions). A search was carried out for these keywords and the incidents that returned a match were designated as “Poor adhesion conditions reported.” Those that did not were designated as “Poor adhesion conditions not reported.” Eight hundred random incidents were assessed manually to validate this, with 4 false reports (2 negative and 2 positive), 0.5% was deemed sufficiently low to assess the remaining data using this method. The driver’s description of the conditions is subjective, but this provides a method to assess whether poor adhesion conditions have been reported outside the autumn season. It also contained information such as whether the incident was on the up or down line, essential for local case studies and understanding the effects of any low adhesion mitigation methods. It was difficult to extract the up/down data using a script, so this had to be done manually for required stations.
The included TRUST data contained the distance of the station overrun. This was recorded using a large number of methods over the years, containing units such as metres, yards, feet, miles and coach/carriage lengths. These were all converted to metres (estimated using a Class 150 carriage length of 19 m).
Pandas, a Python based data analysis tool, and Microsoft Excel, were then used to manipulate the data to extract further information from the descriptive paragraphs. This included, vehicle class and distance of overrun. A flowchart of the data extraction method is shown in Figure 2. The work outlined in the following sections shows examples of how this newly available dataset can be used, assesses any emerging trends in the data and proposes further analysis and operational uses. A flow chart showing the steps taken during data extraction.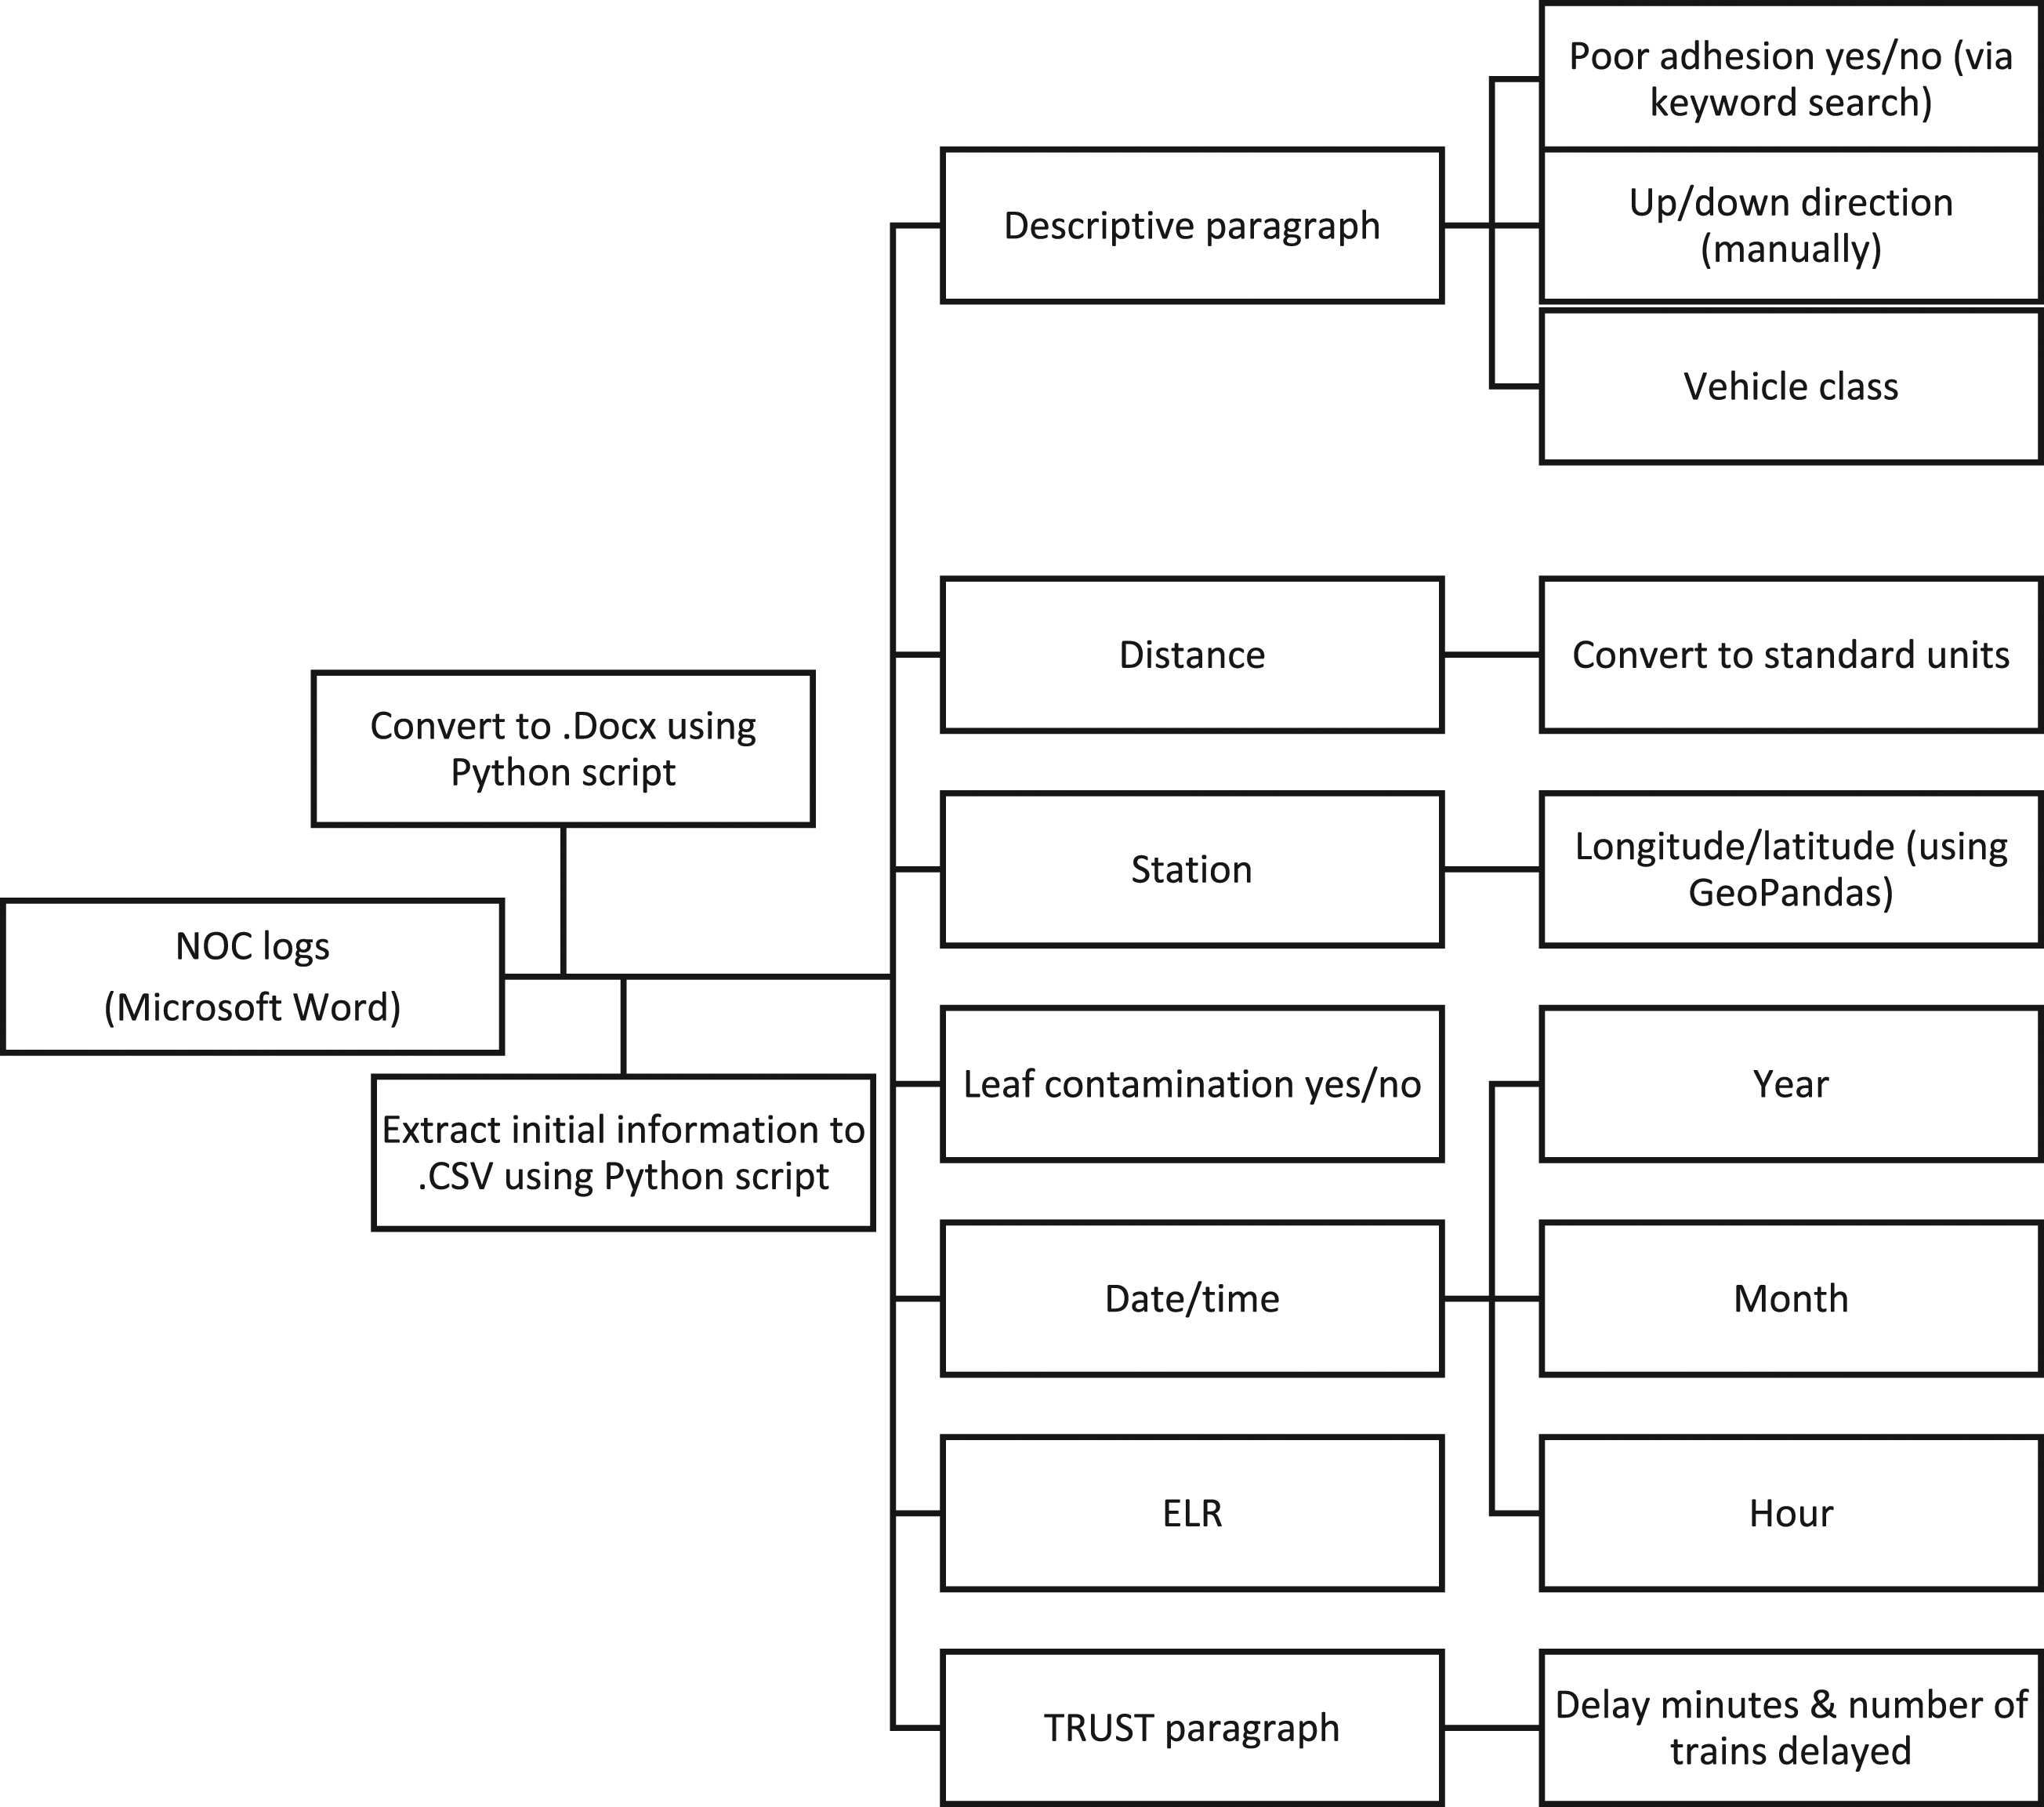
Data analysis
Date and time analysis
Station overruns per year from 2007 to 2018 are shown in Figure 3. The overruns are categorised according to whether there were poor adhesion conditions observed or not (based on the keywords described previously) and whether leaf contamination was found after the incident or not. There is a mean average of 477 overruns per year. Each year of data analysis has many more incidents where low adhesion conditions were reported, compared to where leaf contamination was reported. Breakdown of station overruns per year according to whether poor adhesion conditions or leaf layers were observed or not.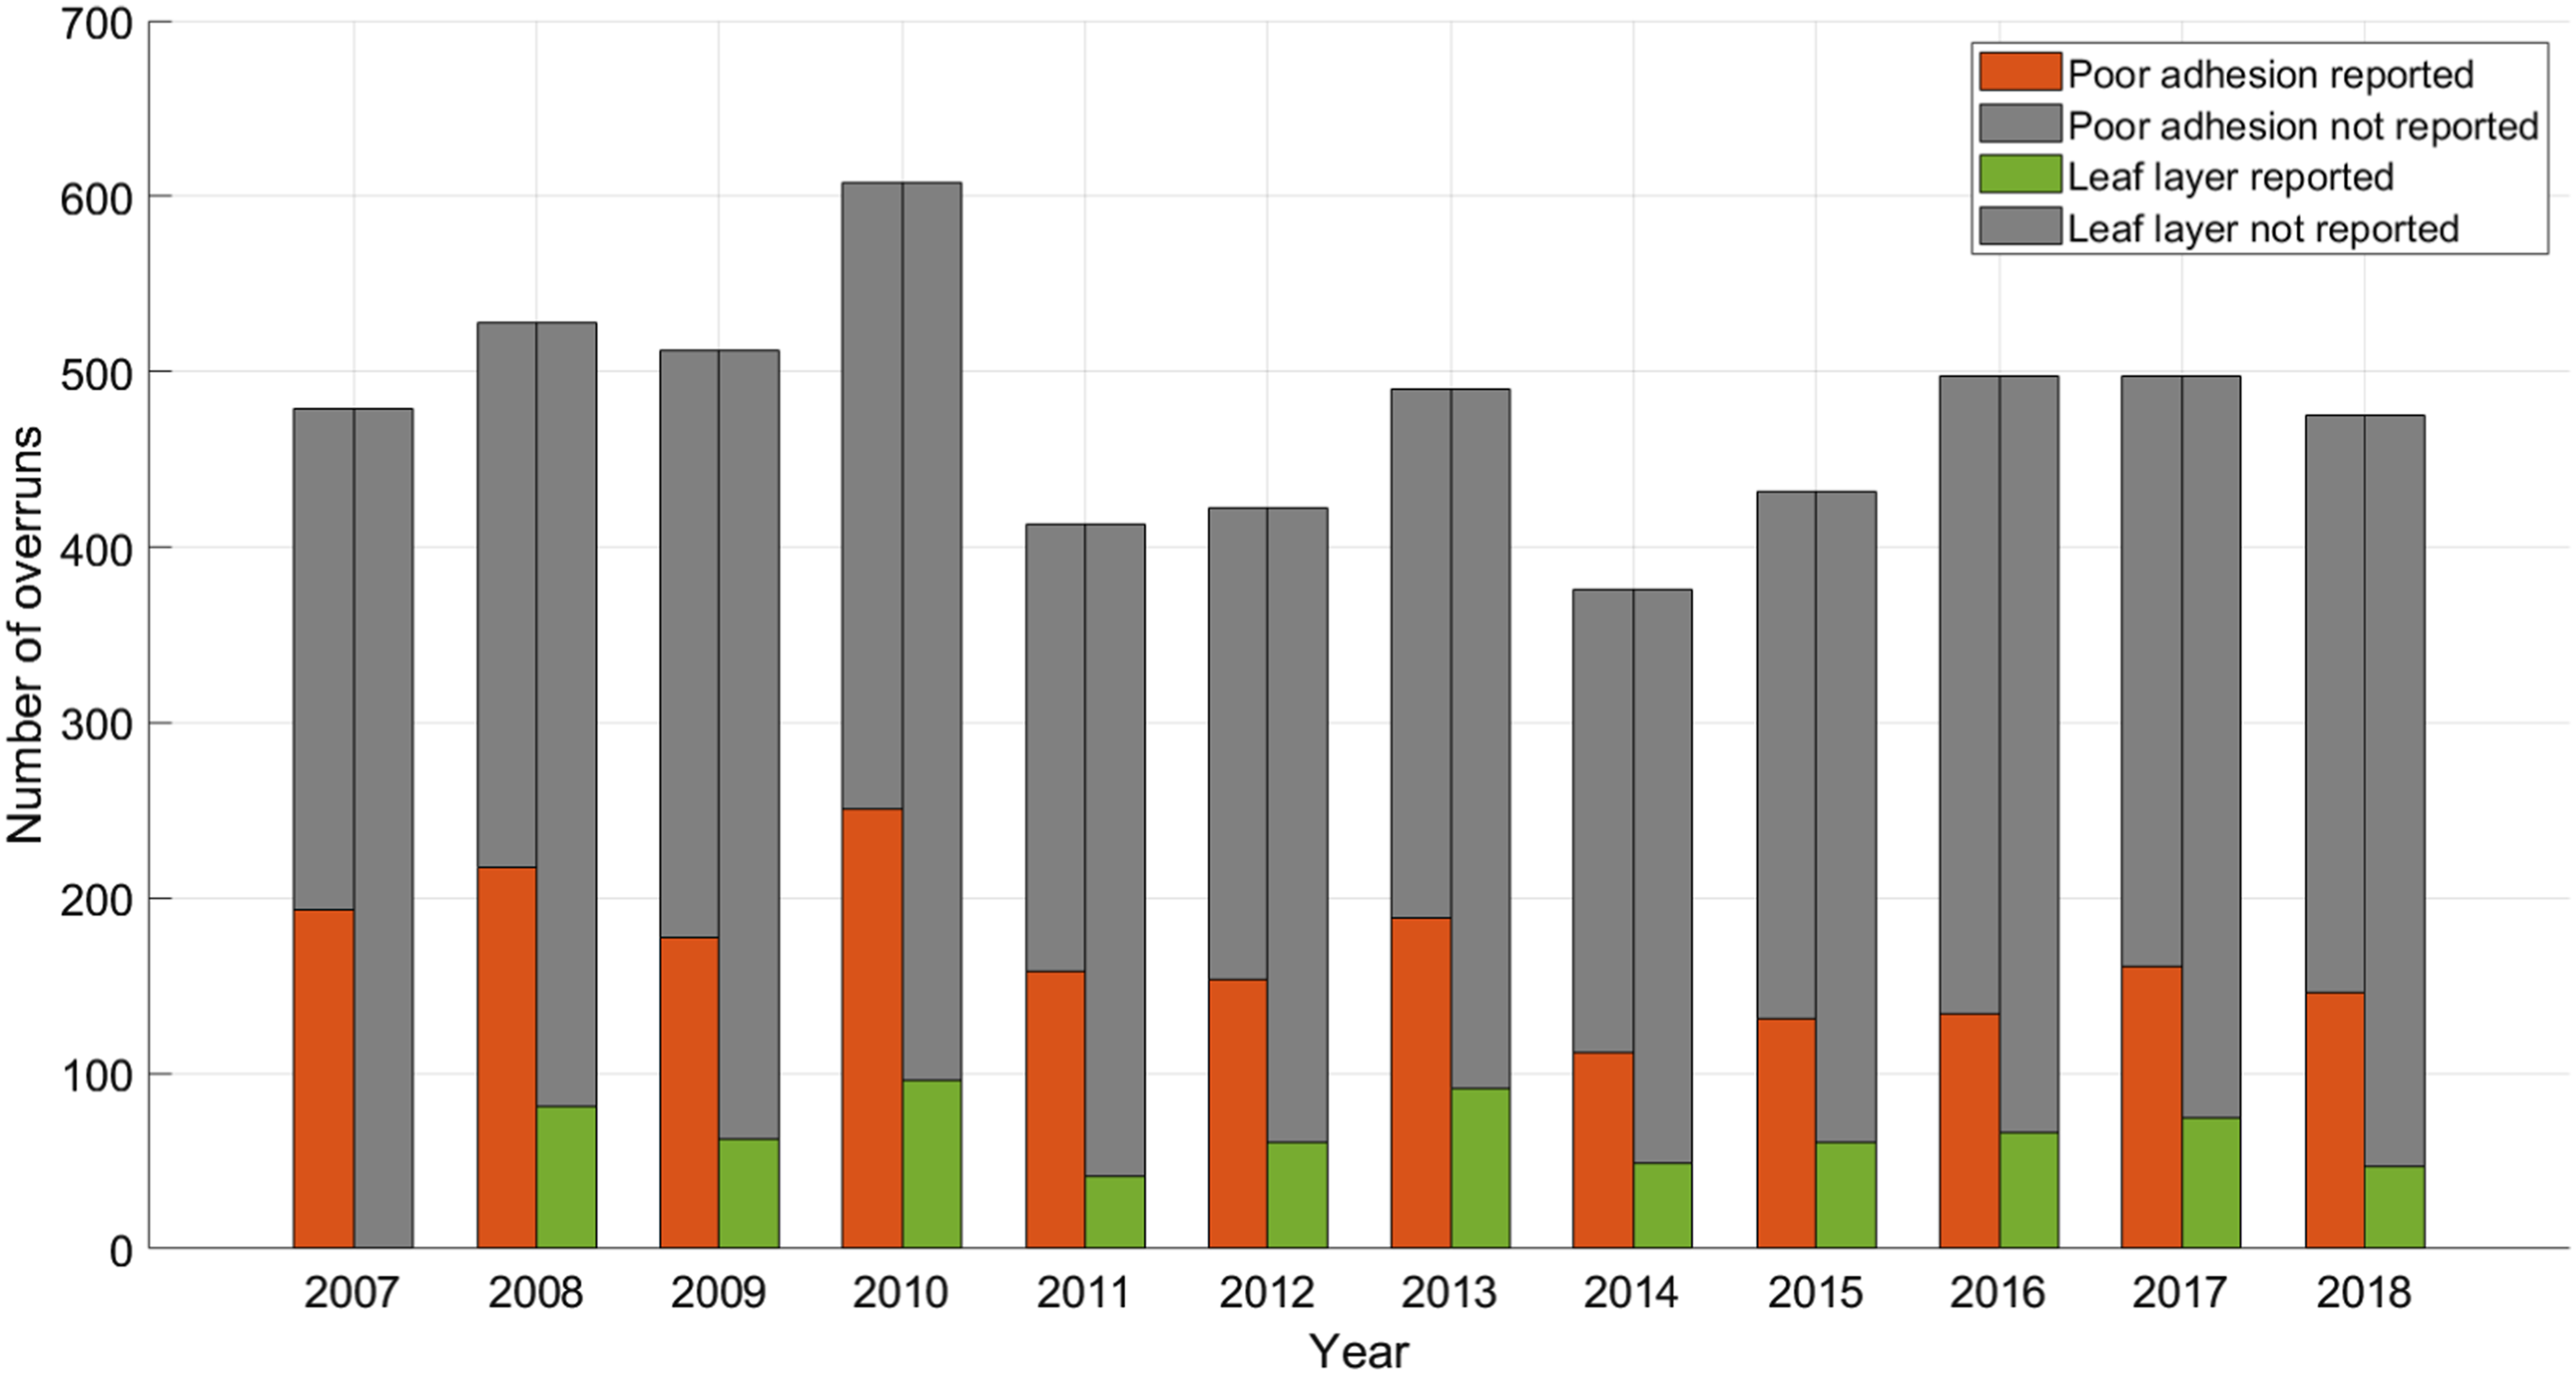
The number of incidents where poor adhesion conditions were reported has fallen in recent years as a proportion of total incidents and a similar pattern is observed for reports of leaf contamination. This may be due to better low adhesion mitigation methods, reporting style, or that the drivers are not informed that low adhesion is occurring due to lack of feedback through the train controls.
No leaf contamination data for 2007 could be collected because it used a different reporting style that could not be extracted using the current Python programme.
The incident numbers were then split by month (see Figure 4). As expected, the autumn months of October, November and December have by far the highest number of overruns and a larger proportion related to low adhesion than the rest of the year. In January and February there are 86 and 70, respectively, overruns where poor adhesion conditions have been noted which may be due to increased rainfall, snow and ice or unreported organic contamination. Station overruns per month (2007–2018).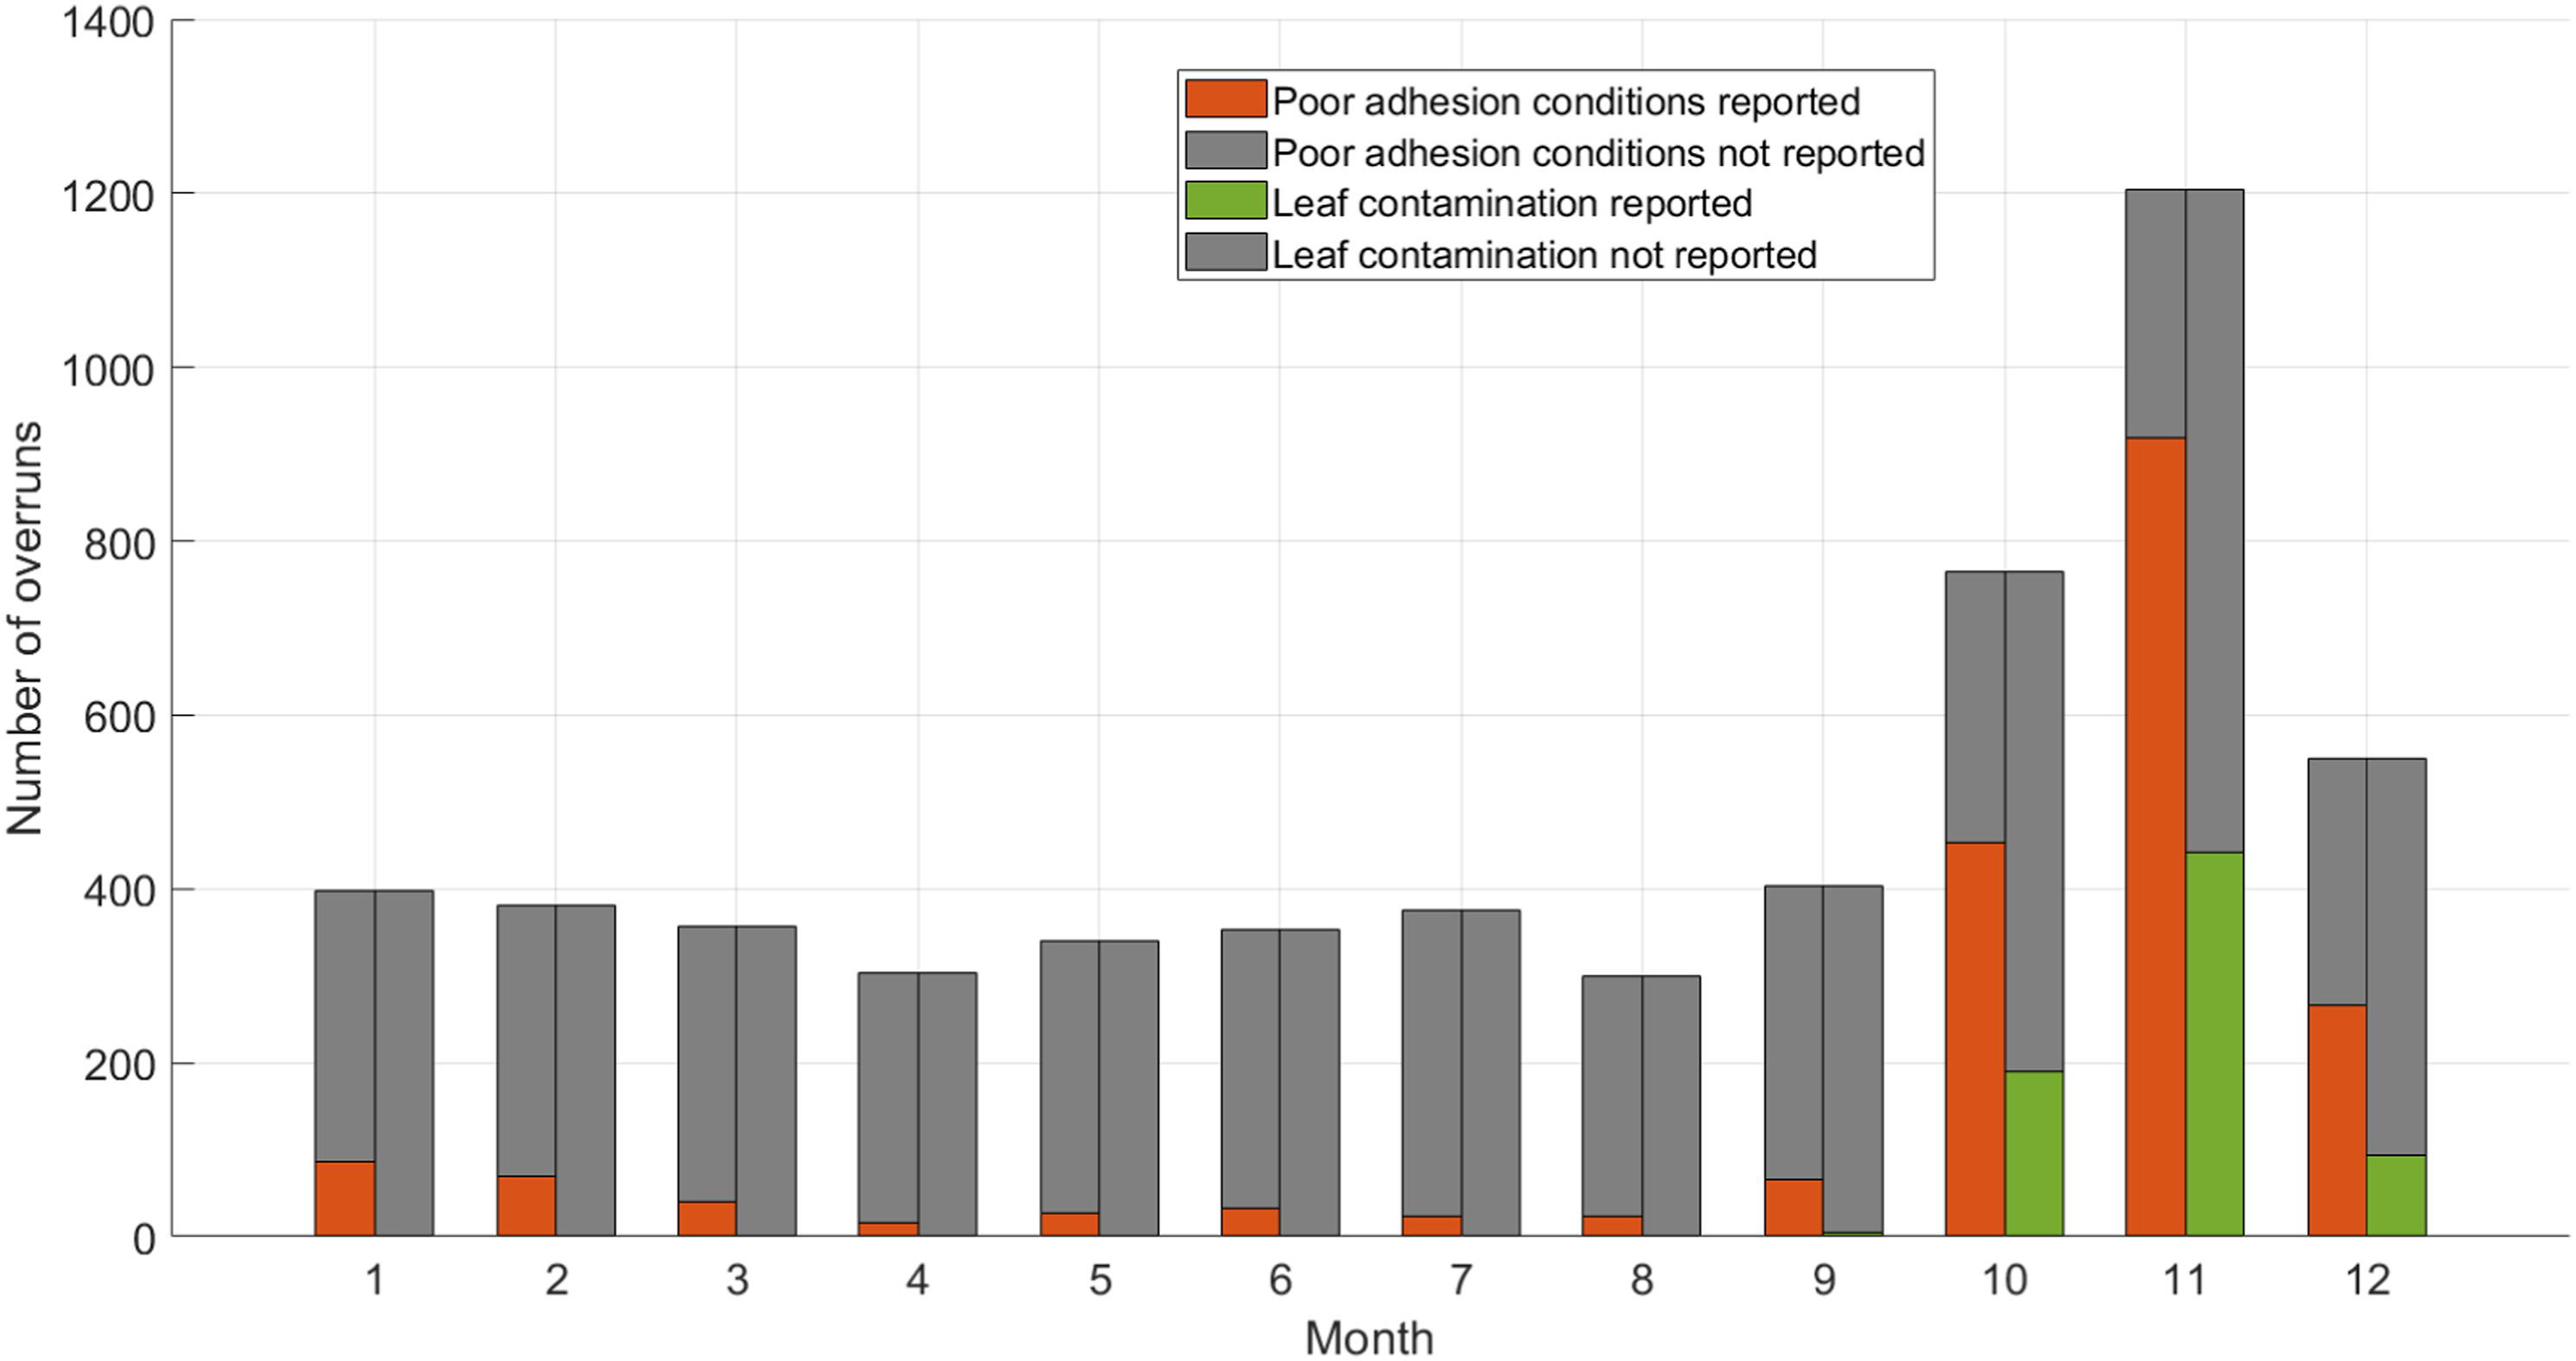
The overruns where low adhesion conditions were not reported remained consistent with an average of 309 overruns per month over the entire dataset. Stated reasons for these include the driver forgetting to stop at the booked stop, misreading the route diagram, late braking, or not seeing the station in poor weather.
Leaf contamination is reported most often in November, but also present after station overruns in October and December. Leaf contamination has a separate section that can be read by the Python program between October and December, but this is not available throughout the rest of the year.
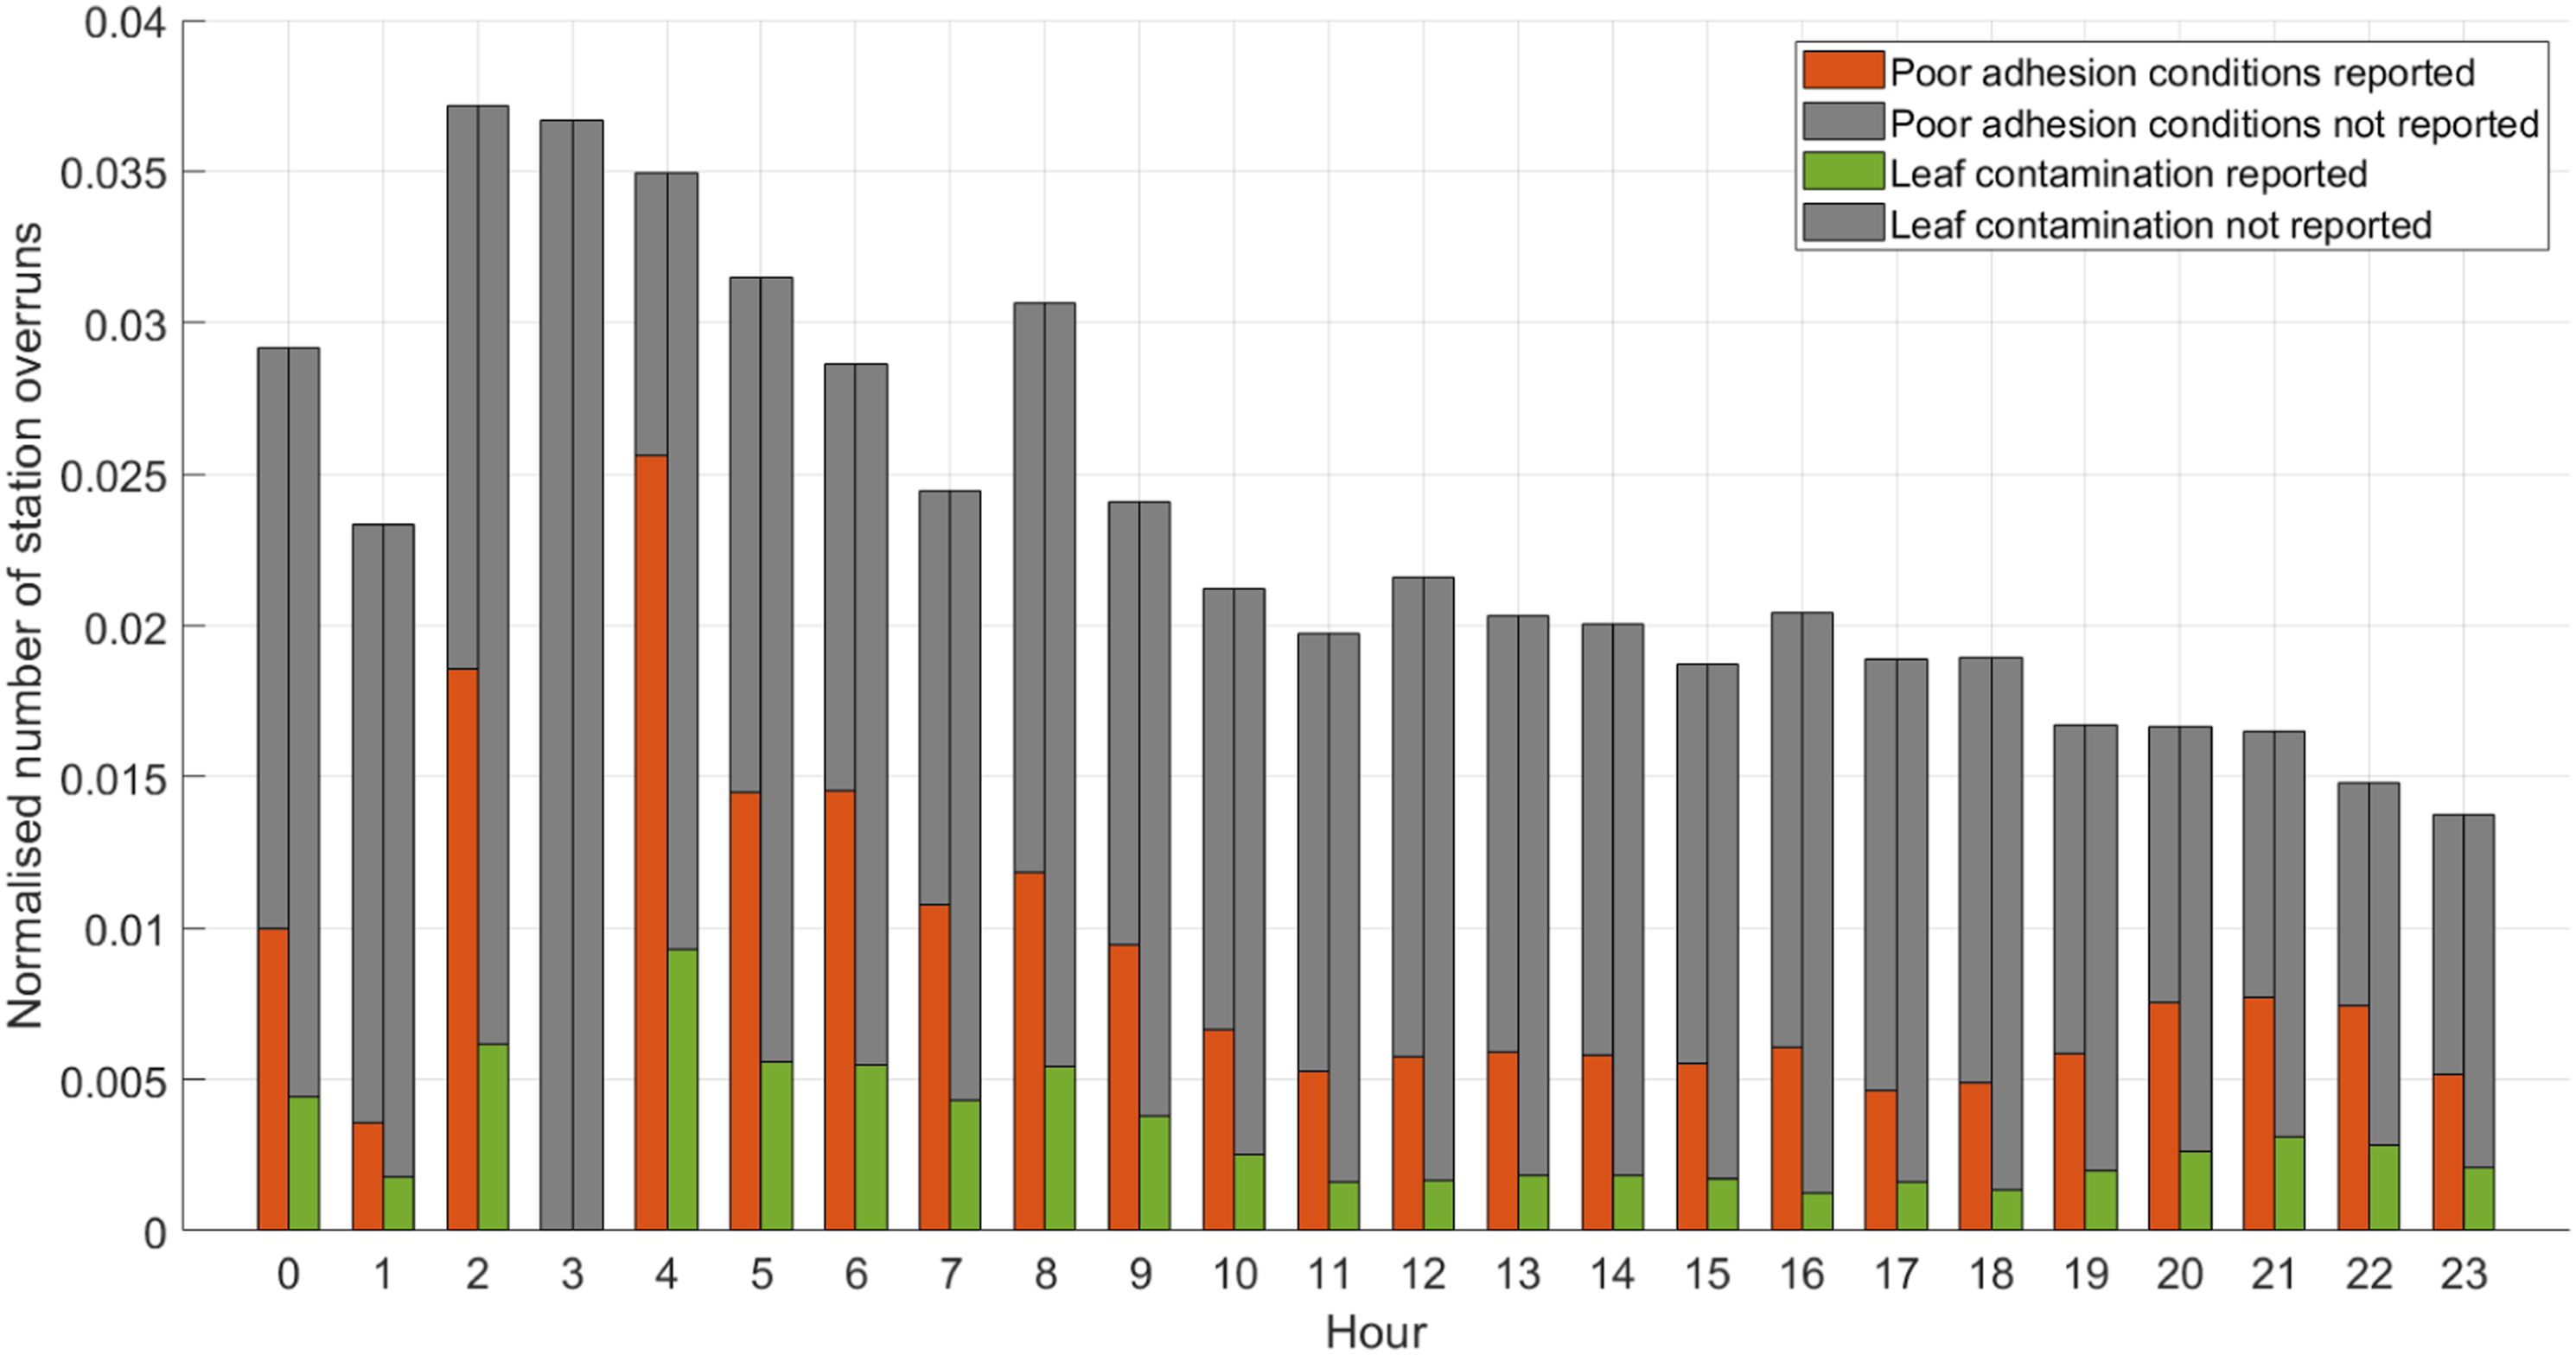
The number of station overruns per hour are plotted in Figure 5. The data in Figure 5 was then normalised by average station stops per hour taken from 2013 data collected in an RSSB project,
8
as shown in Figure 6. The low number of station stops per hour between 00:00 and 05:00 h results in a low numbers of overruns plotting high on the Y axis. The normalisation shows an increase in adhesion related overruns per station stop between 05:00 and 08:00 and 20:00 and 22:00, but not during the evening rush hour at 16:00–18:00, supporting previous observations.
6
This could be caused by moisture on the track due to dew formation, leaf or oxide present on the rail for the first train of the day (due to fewer wheel passes overnight) or wetted rail due to overnight passage of water-jetting maintenance trains that are designed to remove organic contamination during the autumn season. Number of overruns plotted against hour of the day (2007–2018). Number of overruns per hour, normalised by number of station stops per hour (2007–2018).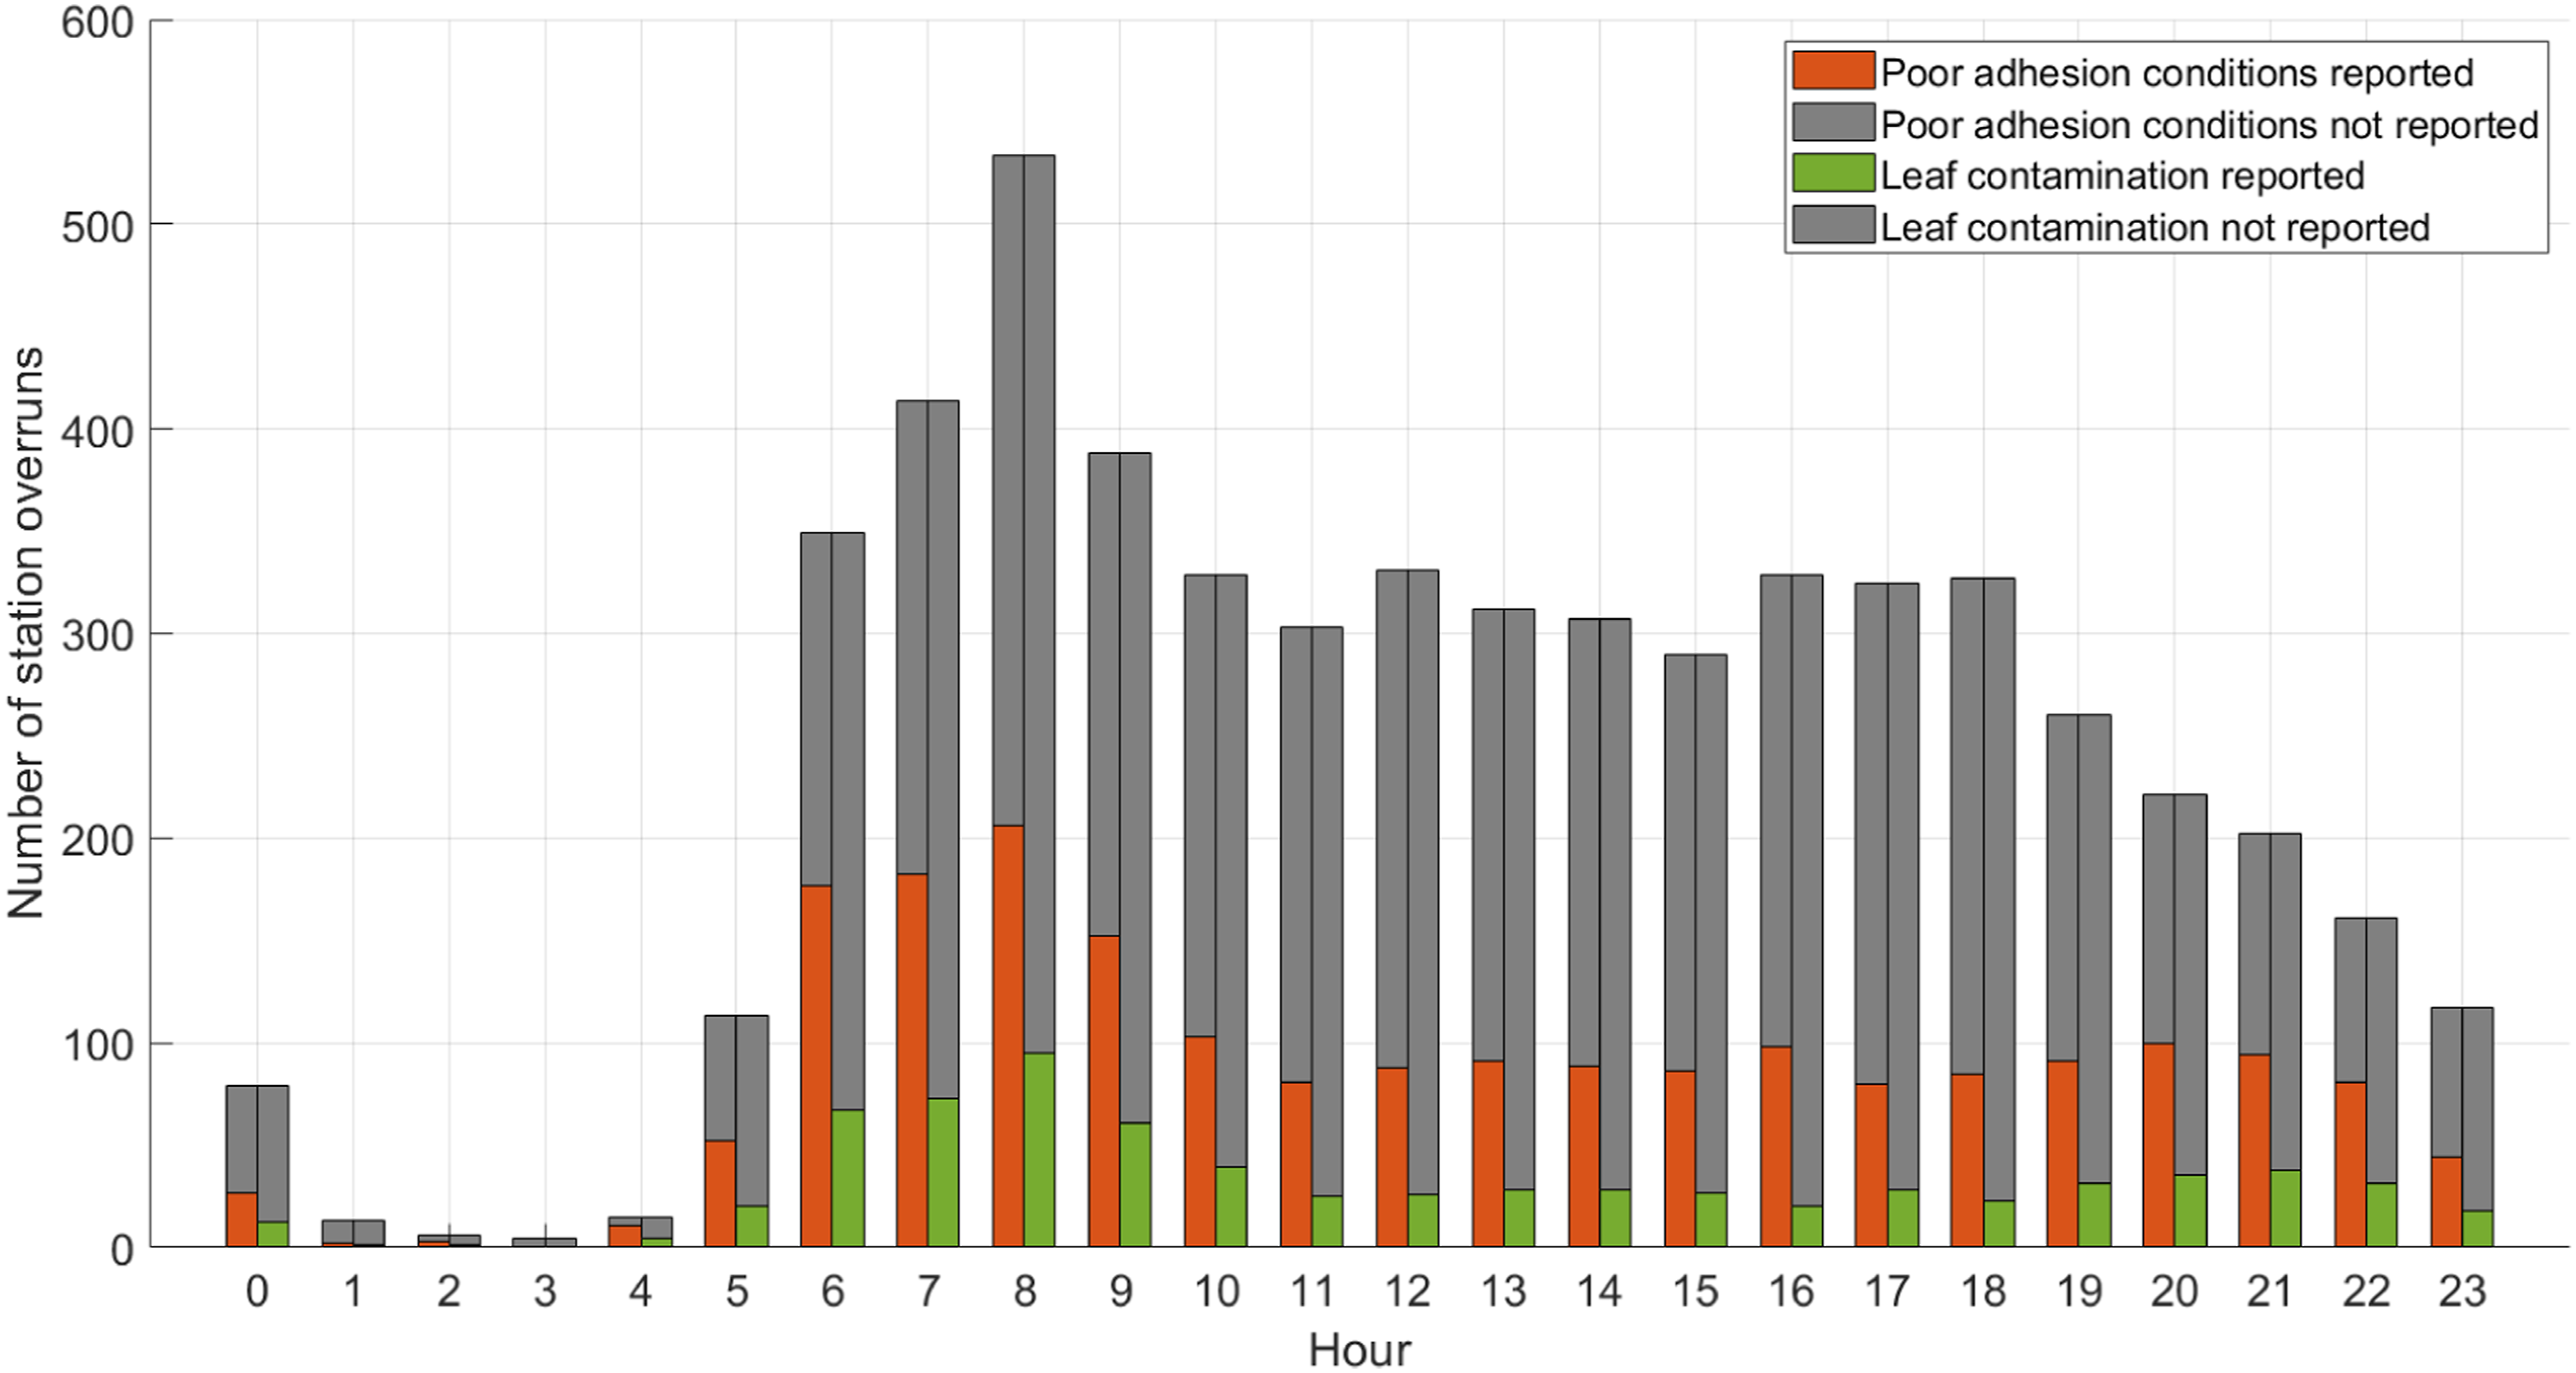
For context, total delay minutes attributed to climate related low adhesion from 2006-2019, from a Network Rail Weather Resilience report are shown in Figure 7.
9
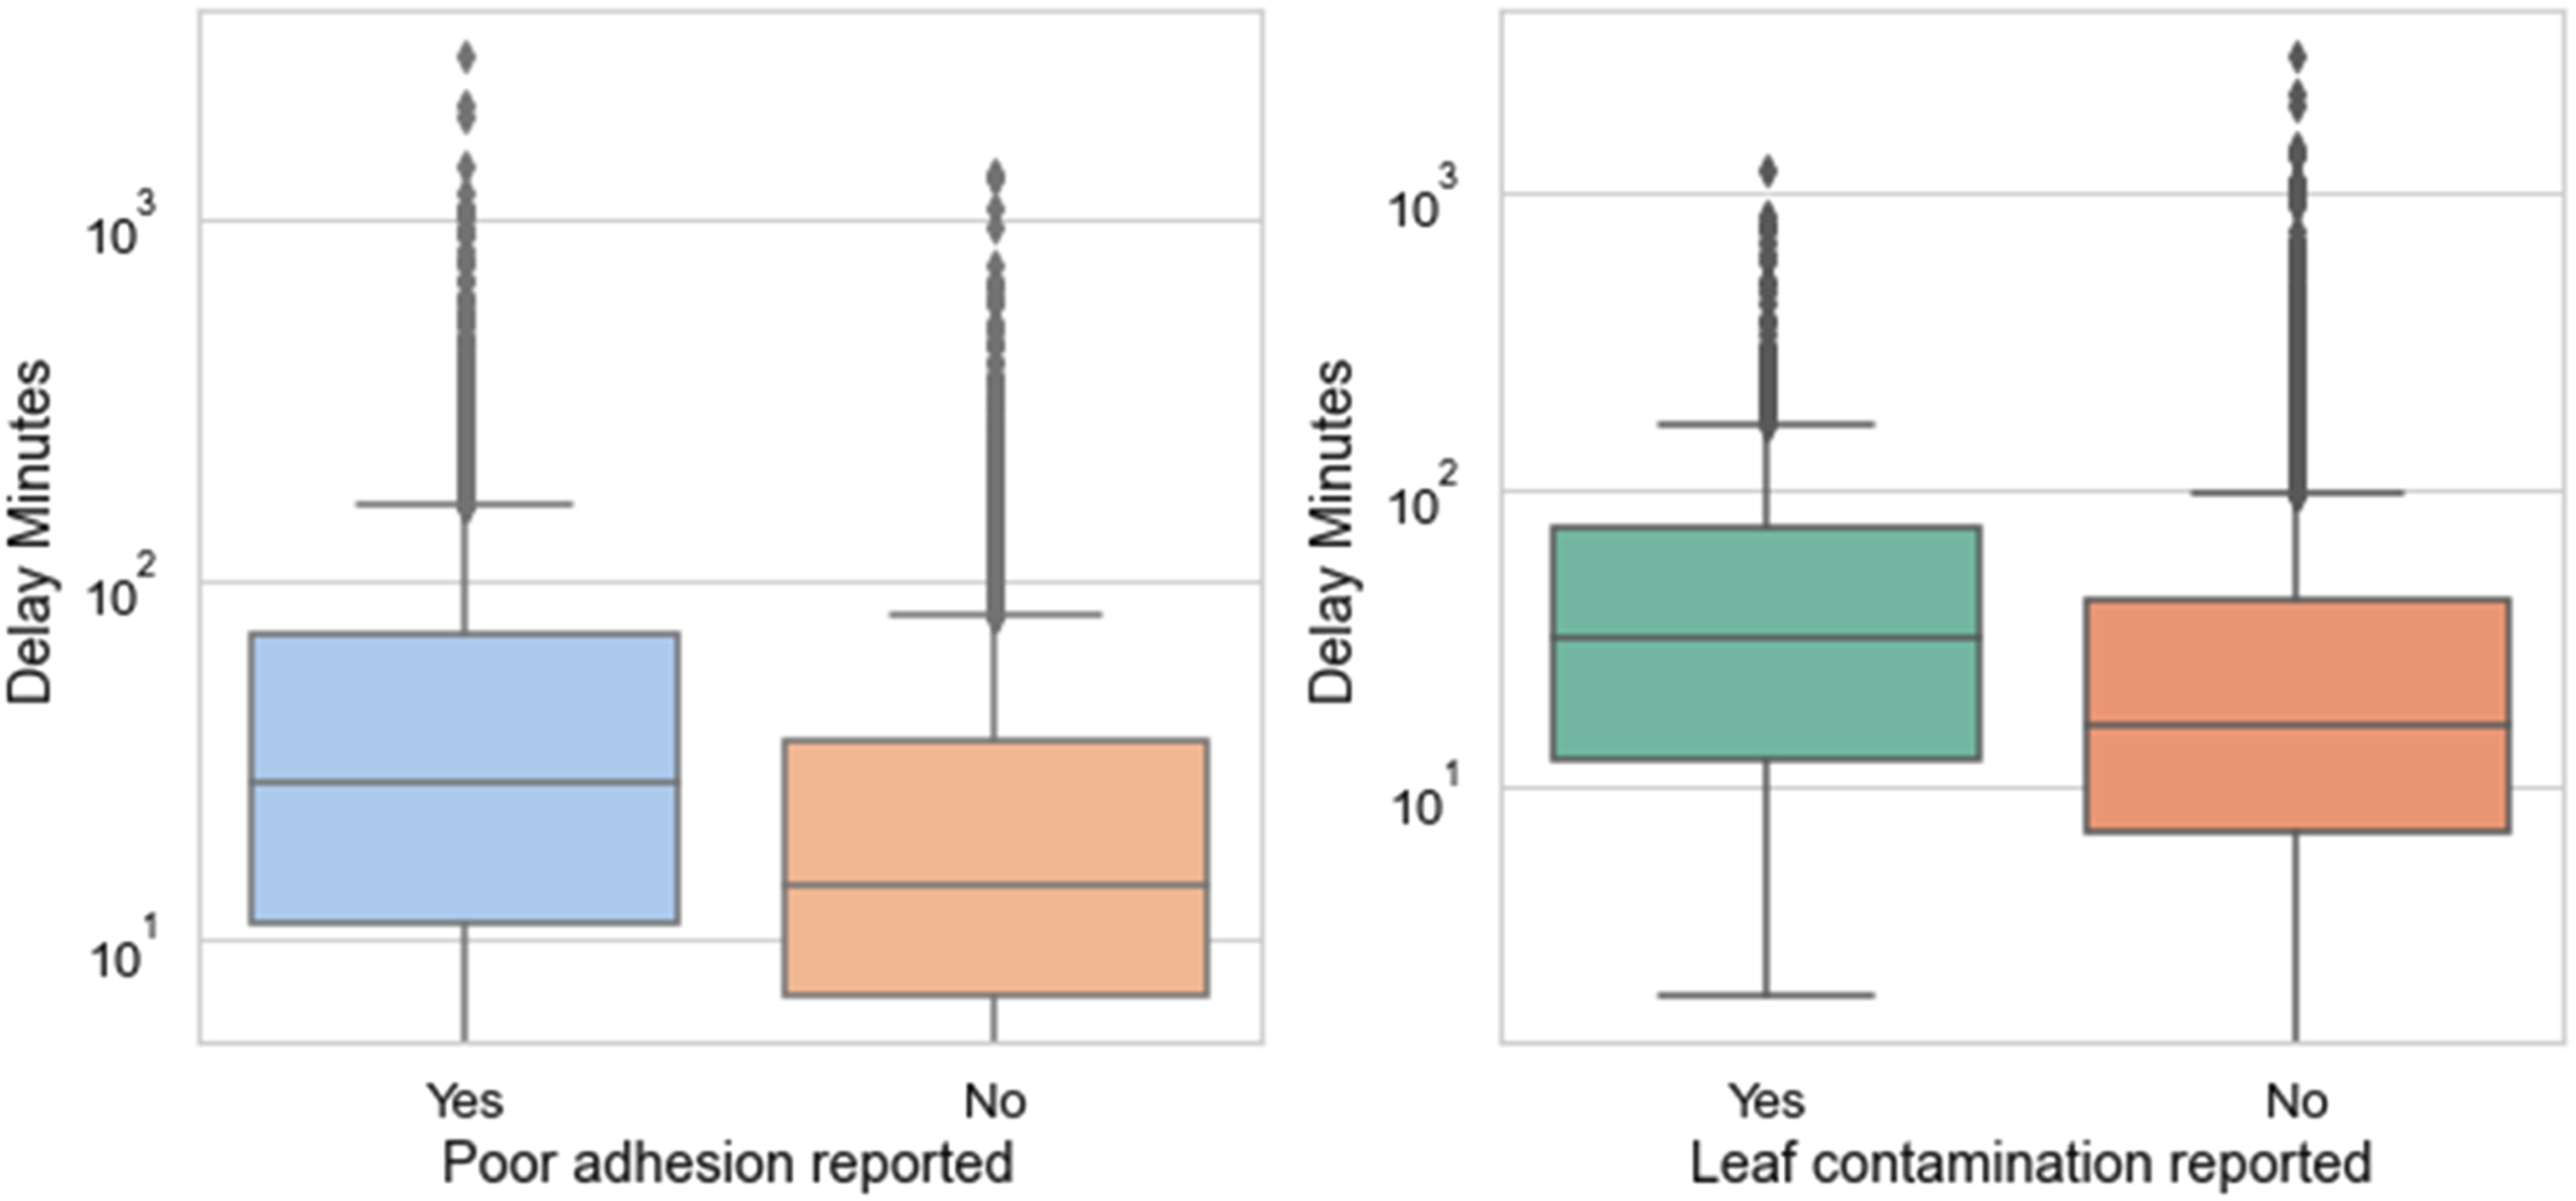
Box plots of station overrun distance from the NOC log report, separated into the previously described categories of poor adhesion conditions and leaf contamination are shown in Figure 8. The central red bar describes the median, whilst the edges of the box show the 25th and 75th percentiles of data. The whiskers show the 95th percentile, whilst the fliers show any outliers beyond this. The median number of delay minutes for an overrun is higher when low adhesion or leaf contamination is reported, compared to incidents where low adhesion did not appear to occur. Delay minutes per year, due to climate related events.
9
Delay minutes per station overrun, split into those where poor adhesion conditions (L) or leaf contamination (R) has been reported.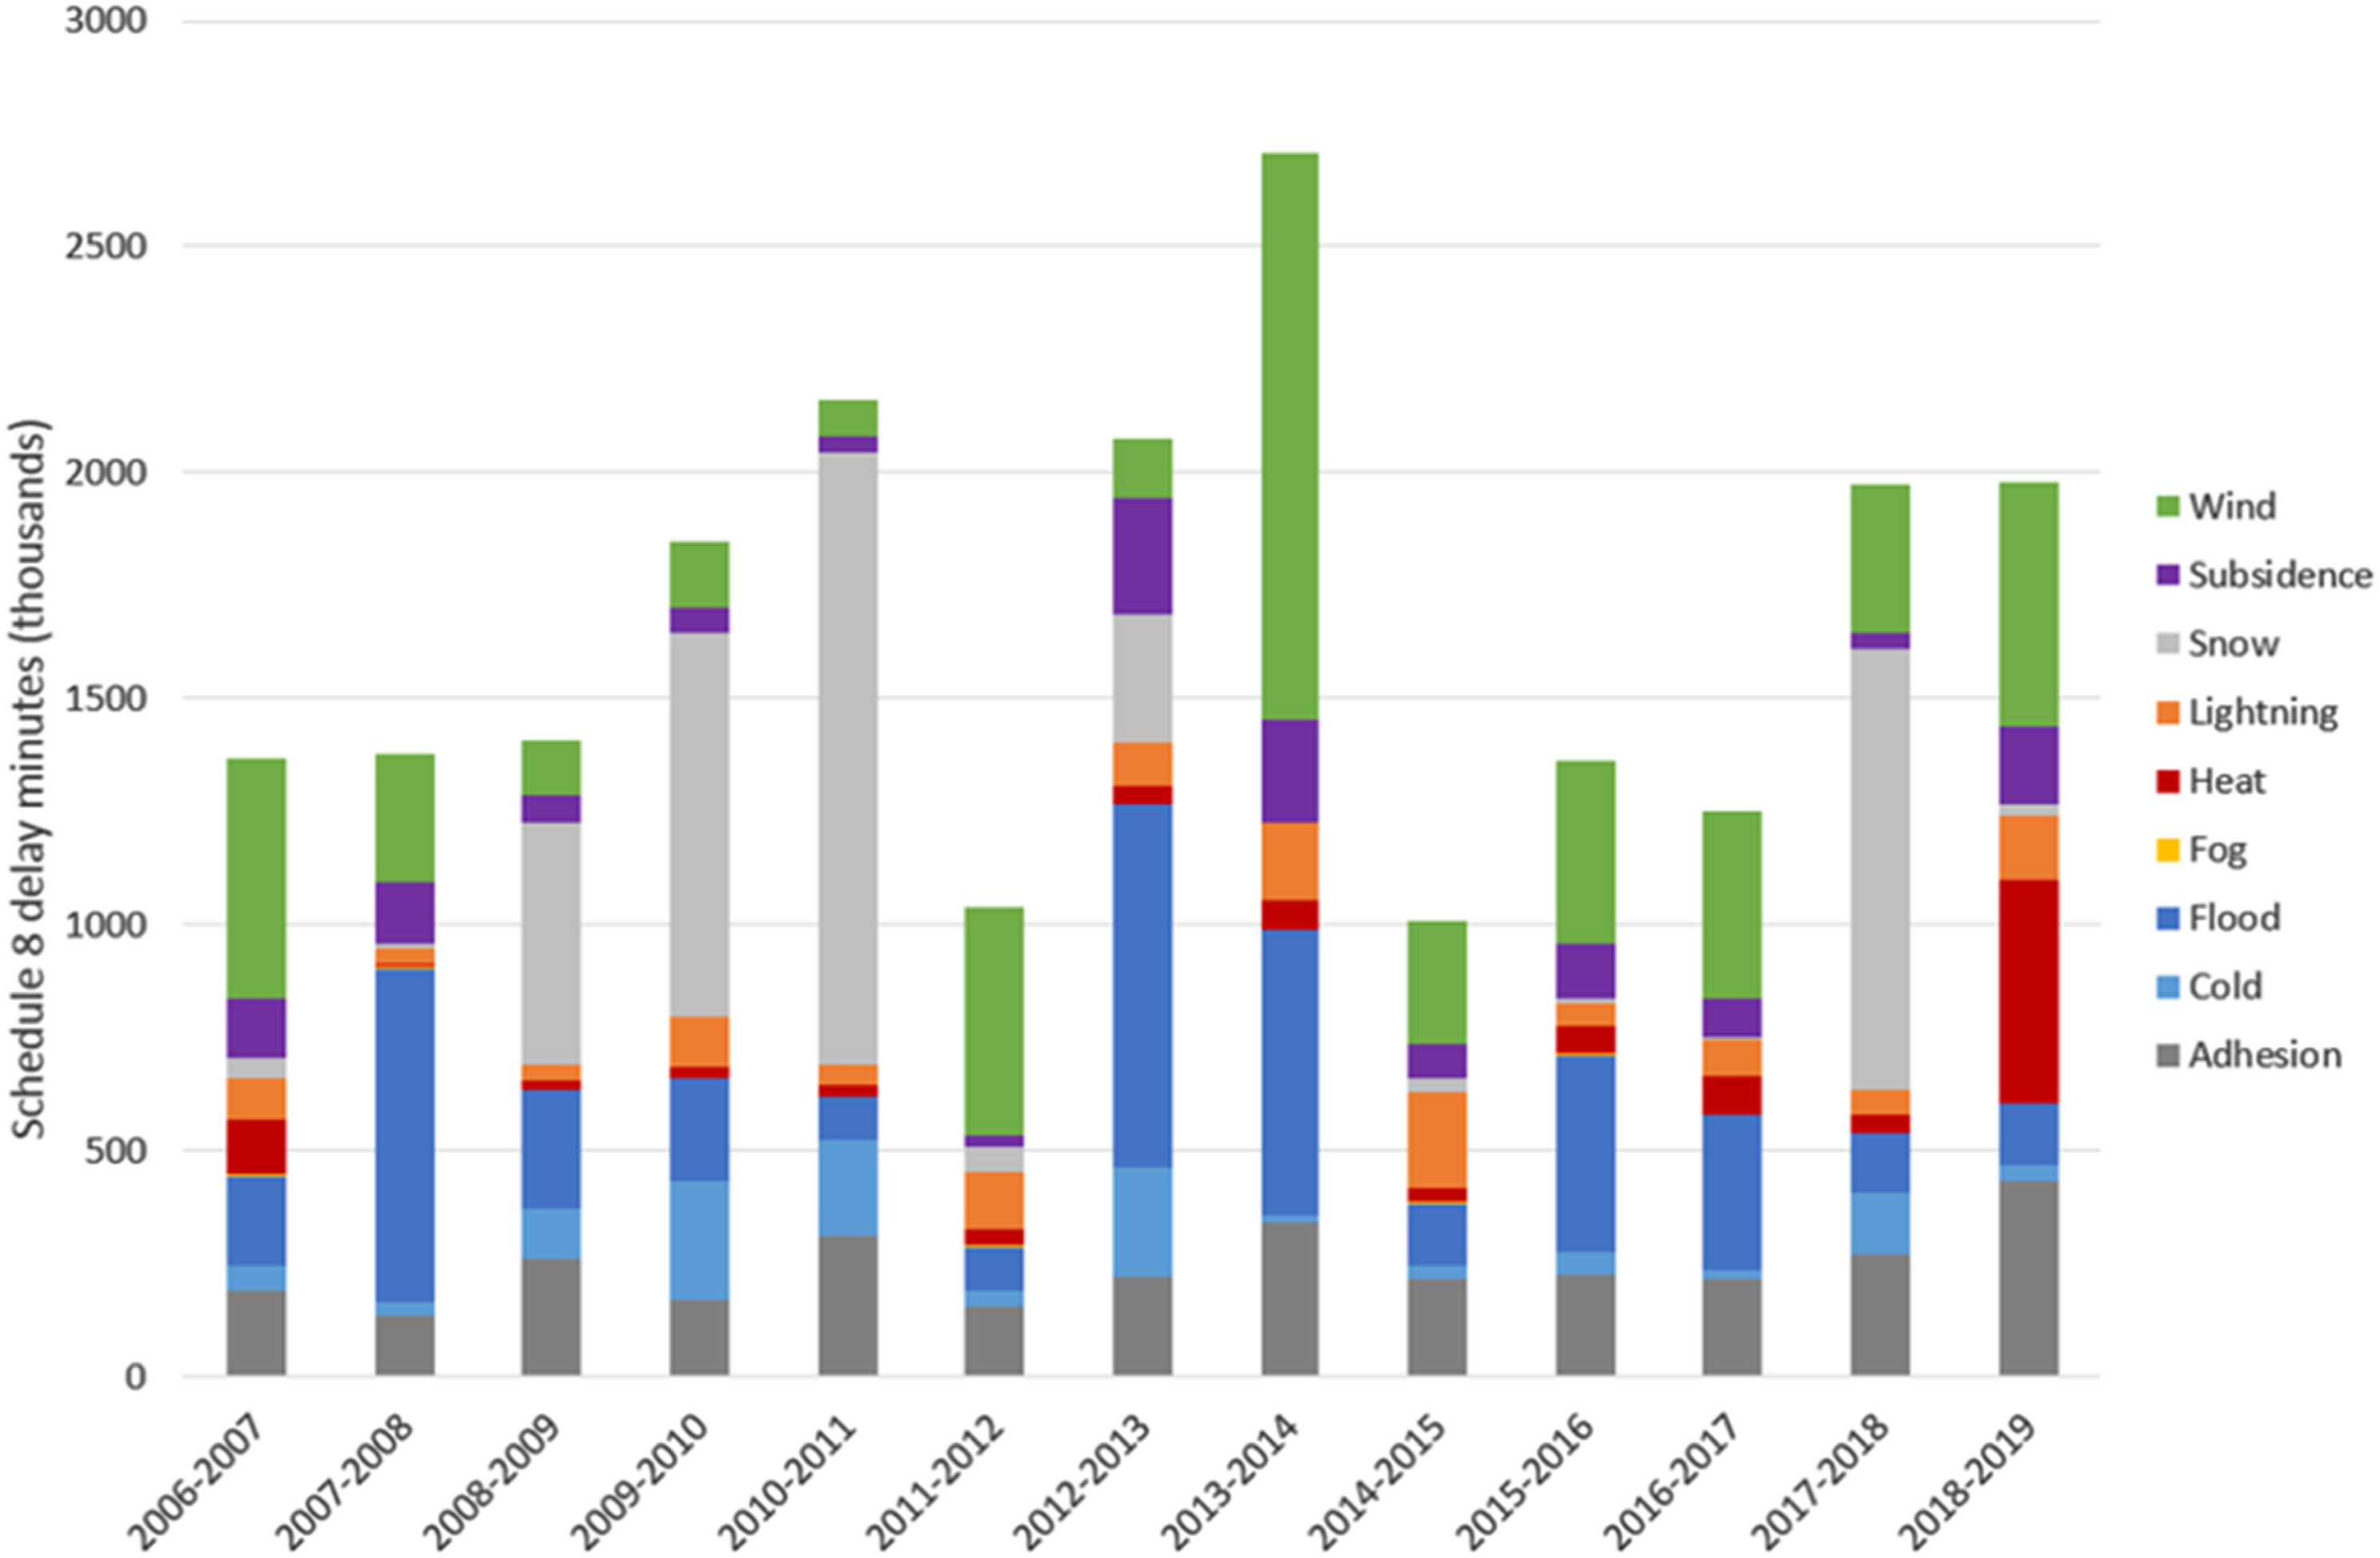
Location analysis
The engineer’s line reference (ELR) code can be used for location analysis, showing the station of overrun as well as the route.
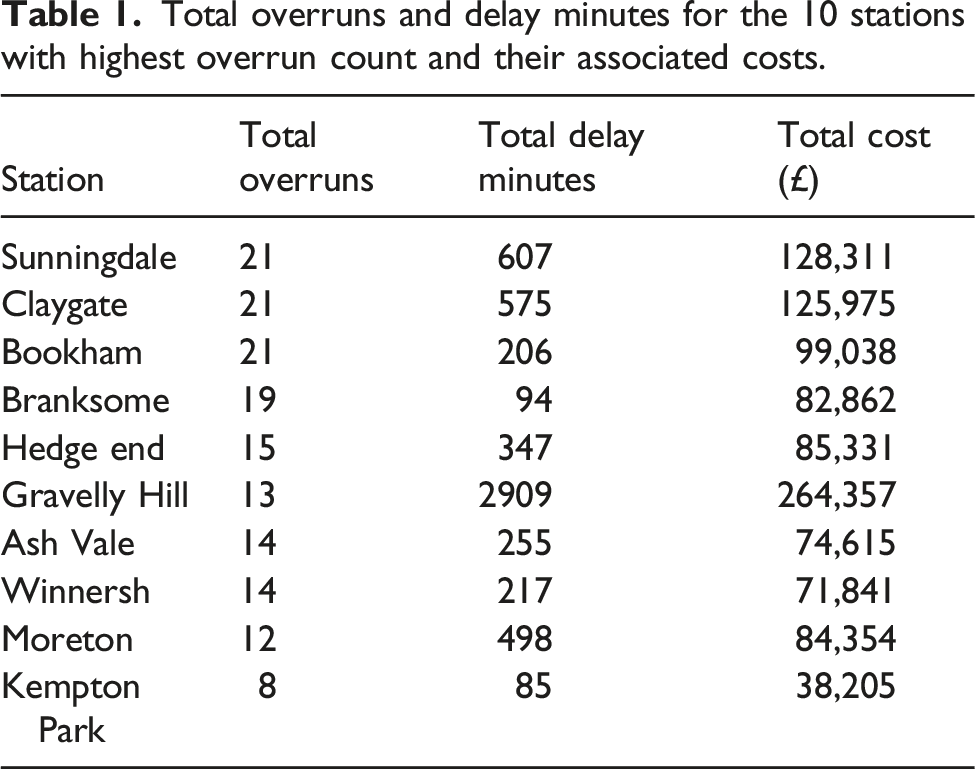
It was found that 25 out of 843 stations (3%), resulted in 14% of station overruns that involved poor adhesion conditions throughout 2007–2018. A heat-map showing station overruns for the 10 stations with highest numbers of overruns over the 11 year period is shown in Figure 9. The estimated cost of total overruns has been approximated by using the RSSB ADHERE report’s approximation of £4000 per overrun,
10
in addition to the average delay minute cost of £73
11
) and shown in Table 1. The 10 stations with the largest number of overruns. Total overruns and delay minutes for the 10 stations with highest overrun count and their associated costs.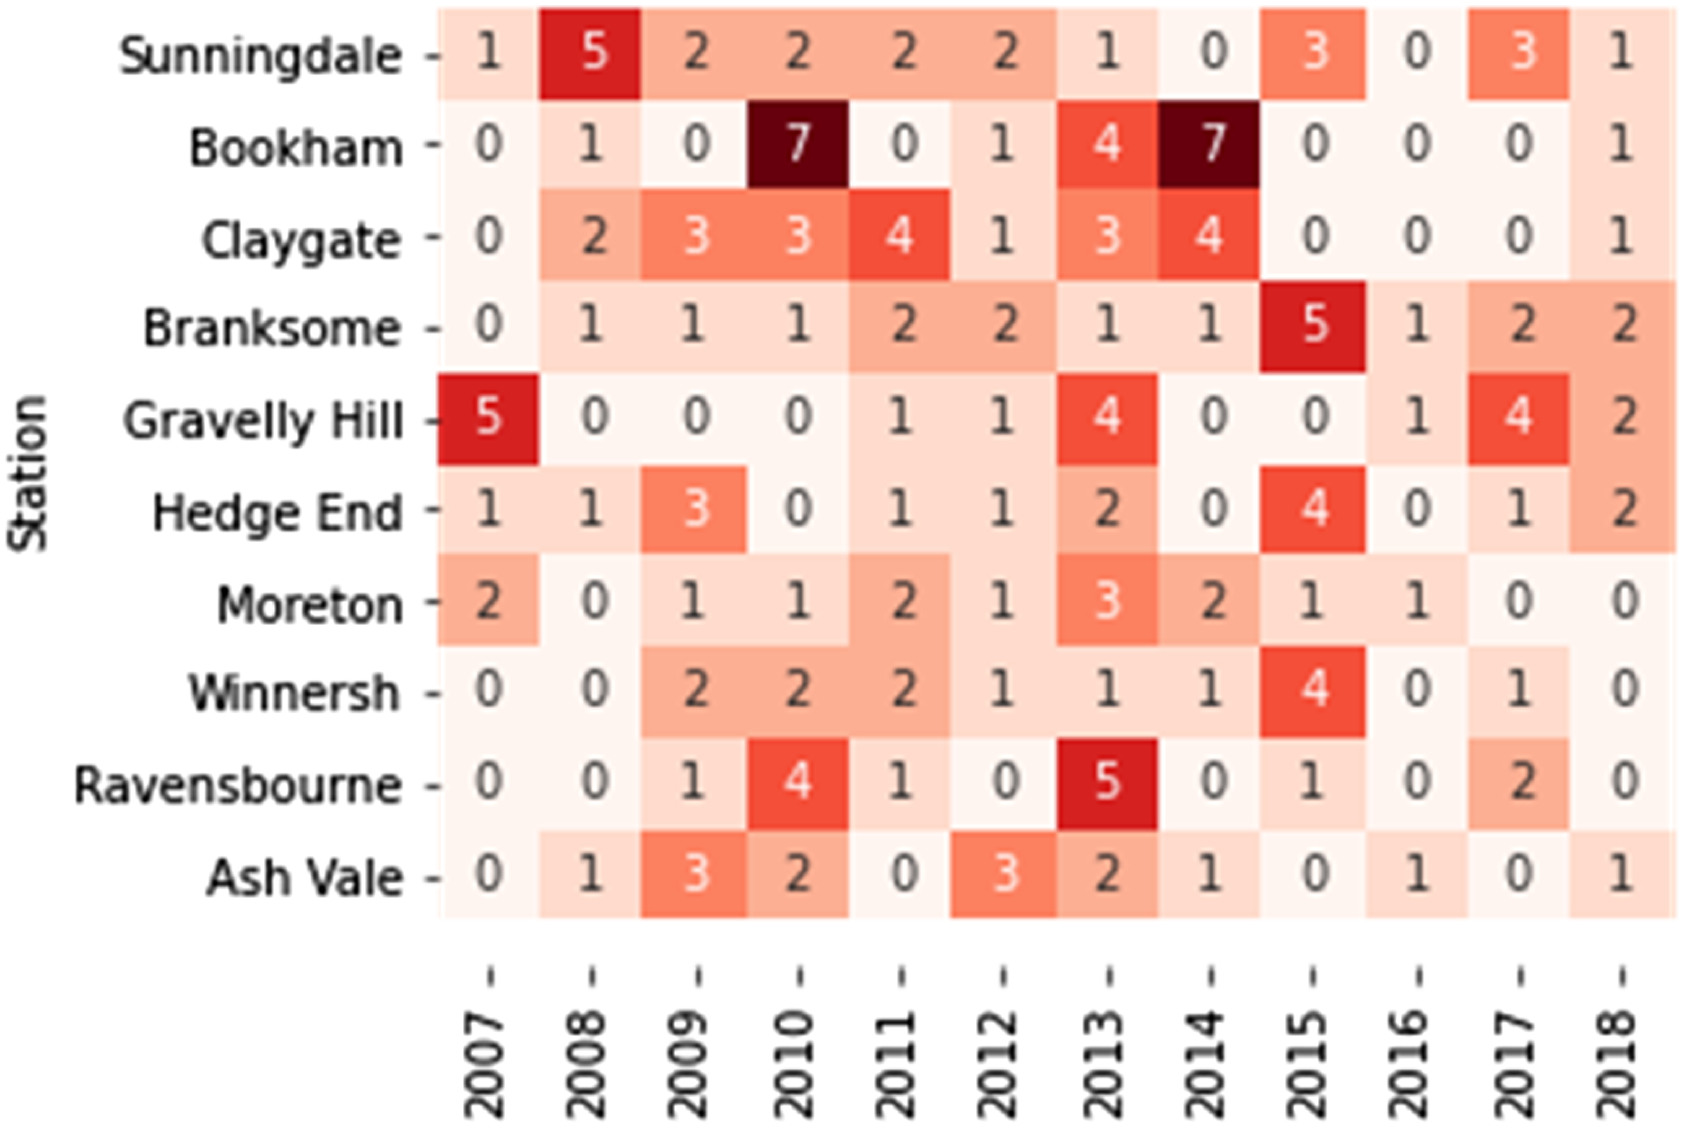
In Figure 10, number of station overruns is plotted against hour of the day, for the 5 stations with highest overrun count. All stations show morning peaks in overruns from 6 to 9, which could be due to accumulated railhead contamination overnight and dew on the railhead. Sunningdale and Branksome have peaks around the evening rush hour at 16–18 h. Claygate and Bookham have evening peaks at 20–22 h, possibly due to dew re-forming on the railhead. These are potential causes, but a larger dataset using a KPI such as delay minutes would be needed for any statistical analysis. Number of station overruns plotted against hour of the day, for the 5 stations with highest overrun count.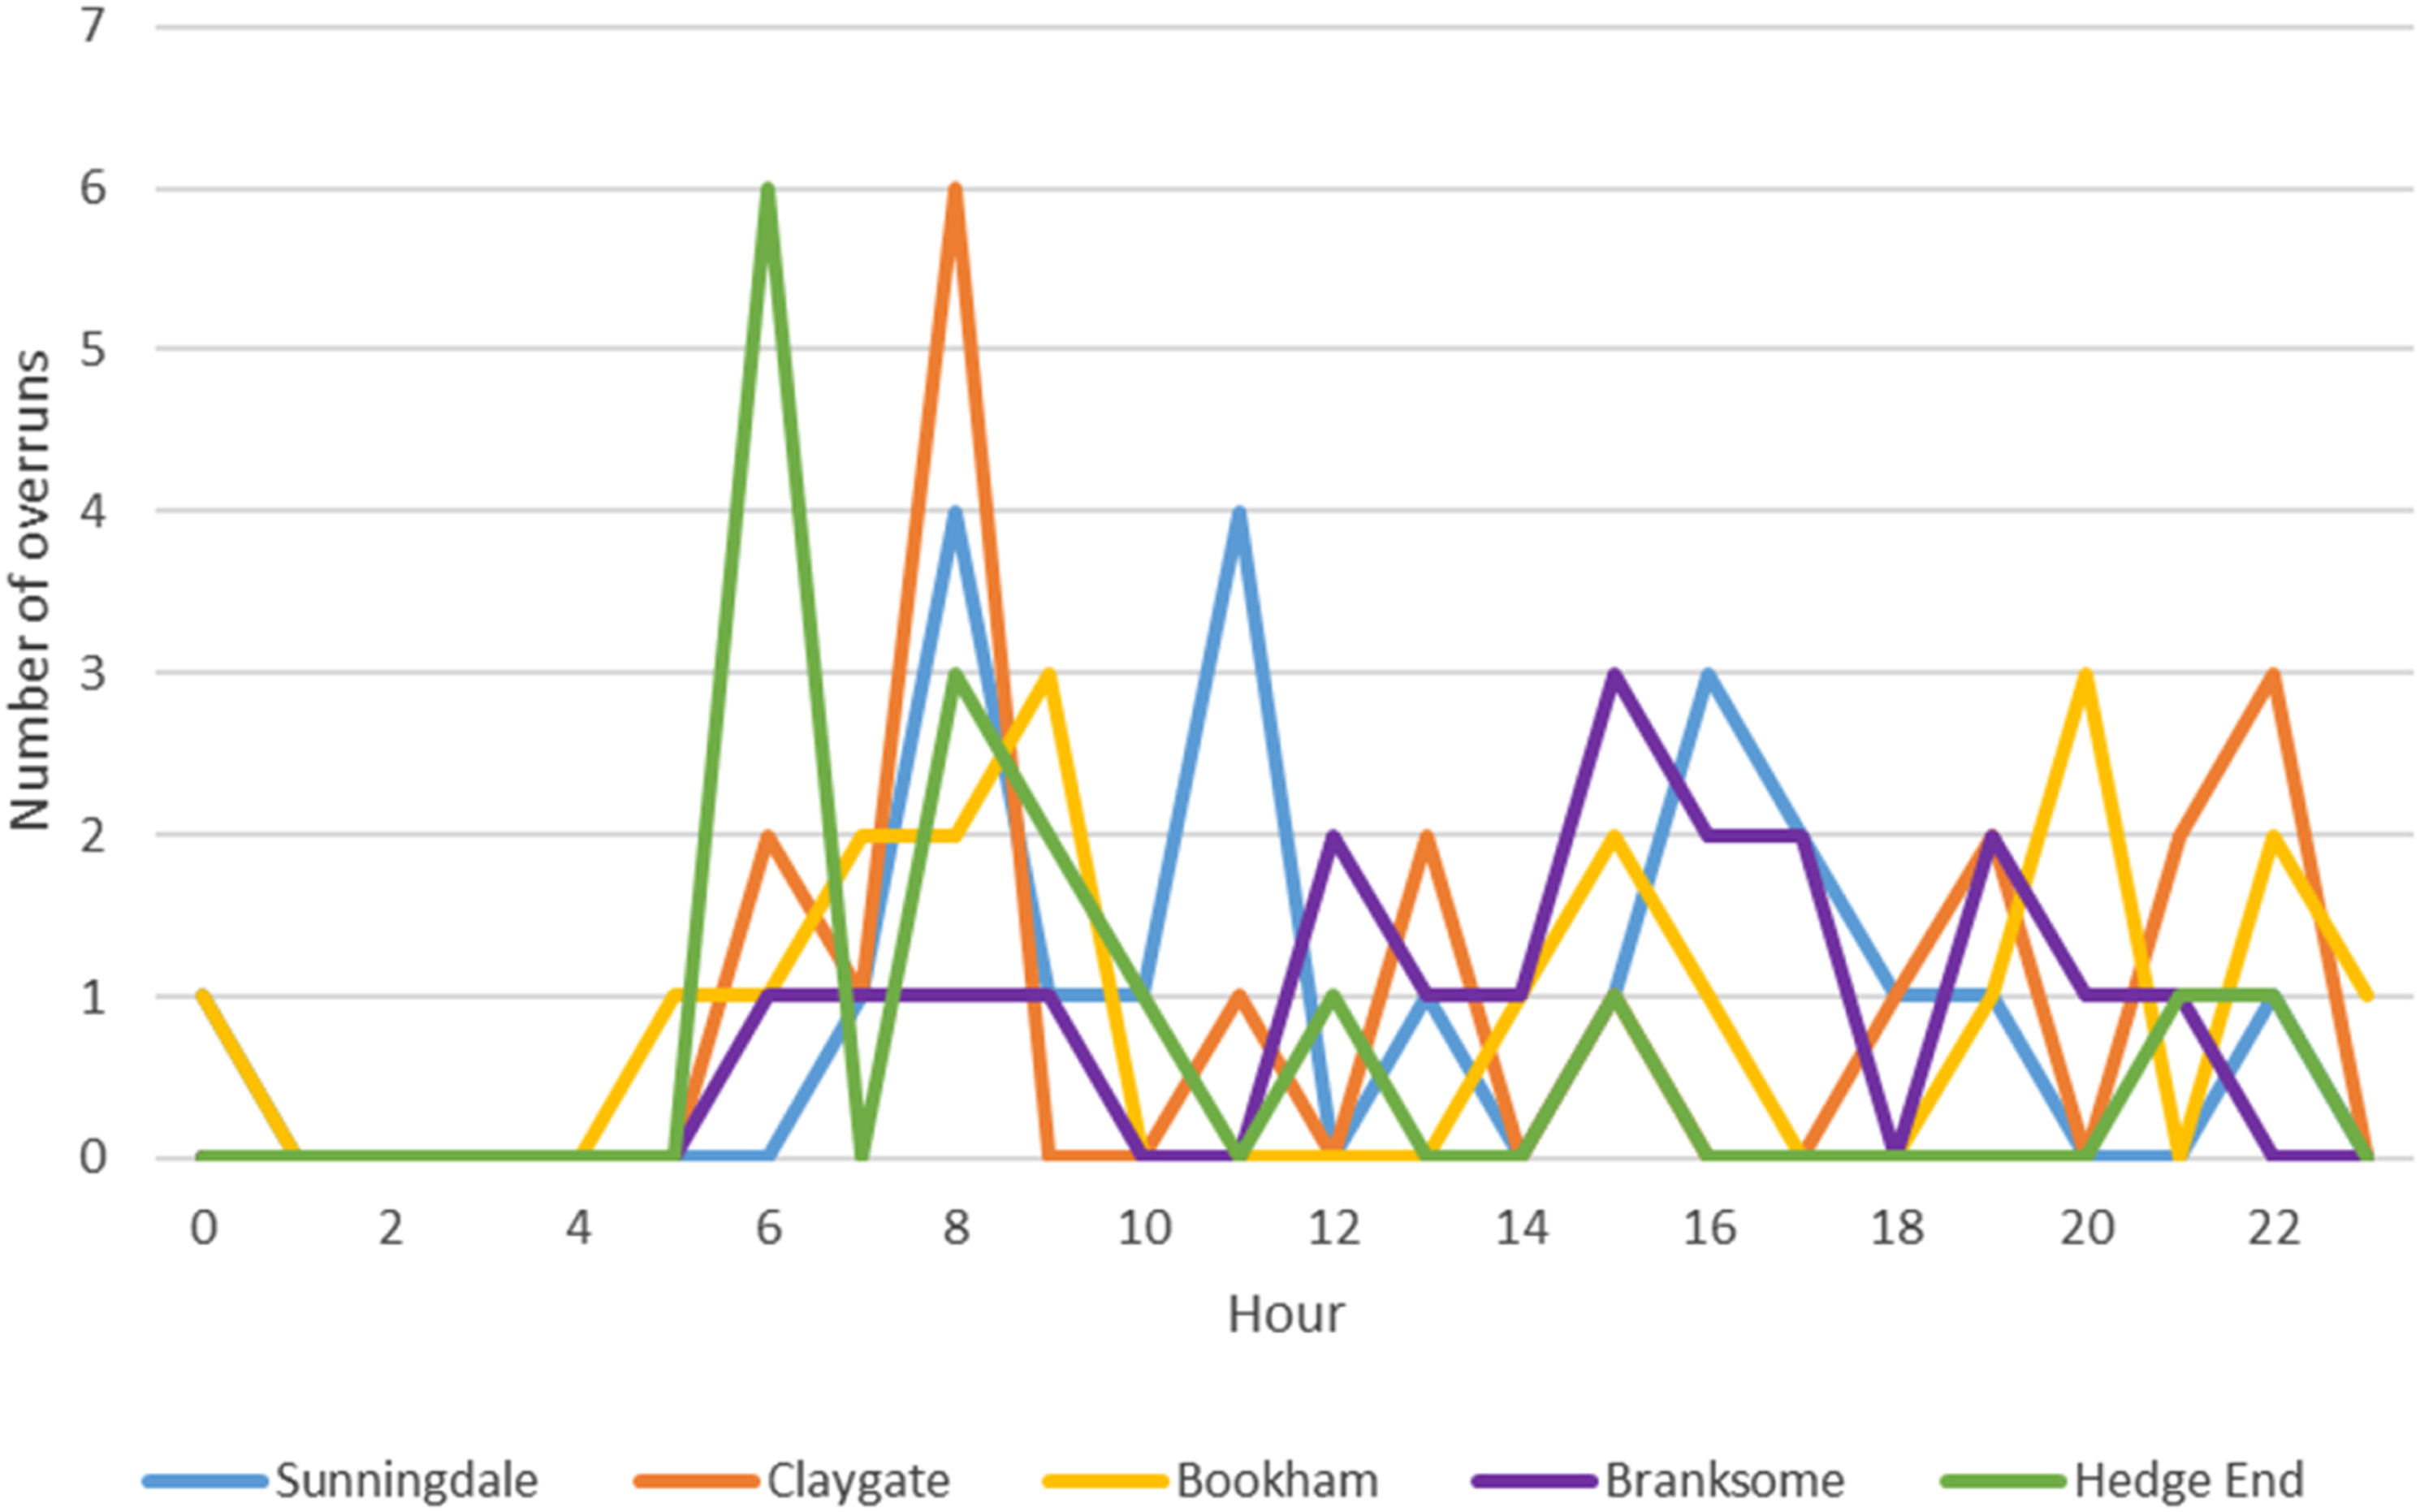
Figure 11 shows the direction of travel (up and down) for each logged overrun that involved poor adhesion, for each of the 5 stations with highest overrun count. All the overruns at Branksome were on the down line (gradient). Hedge End, Claygate and Sunningdale also show a bias towards overruns in one direction. Branksome station is on a gradient, which would make deceleration more difficult in the down direction and explain the high overrun count. Direction of travel during overrun, for the 5 stations with highest overrun count.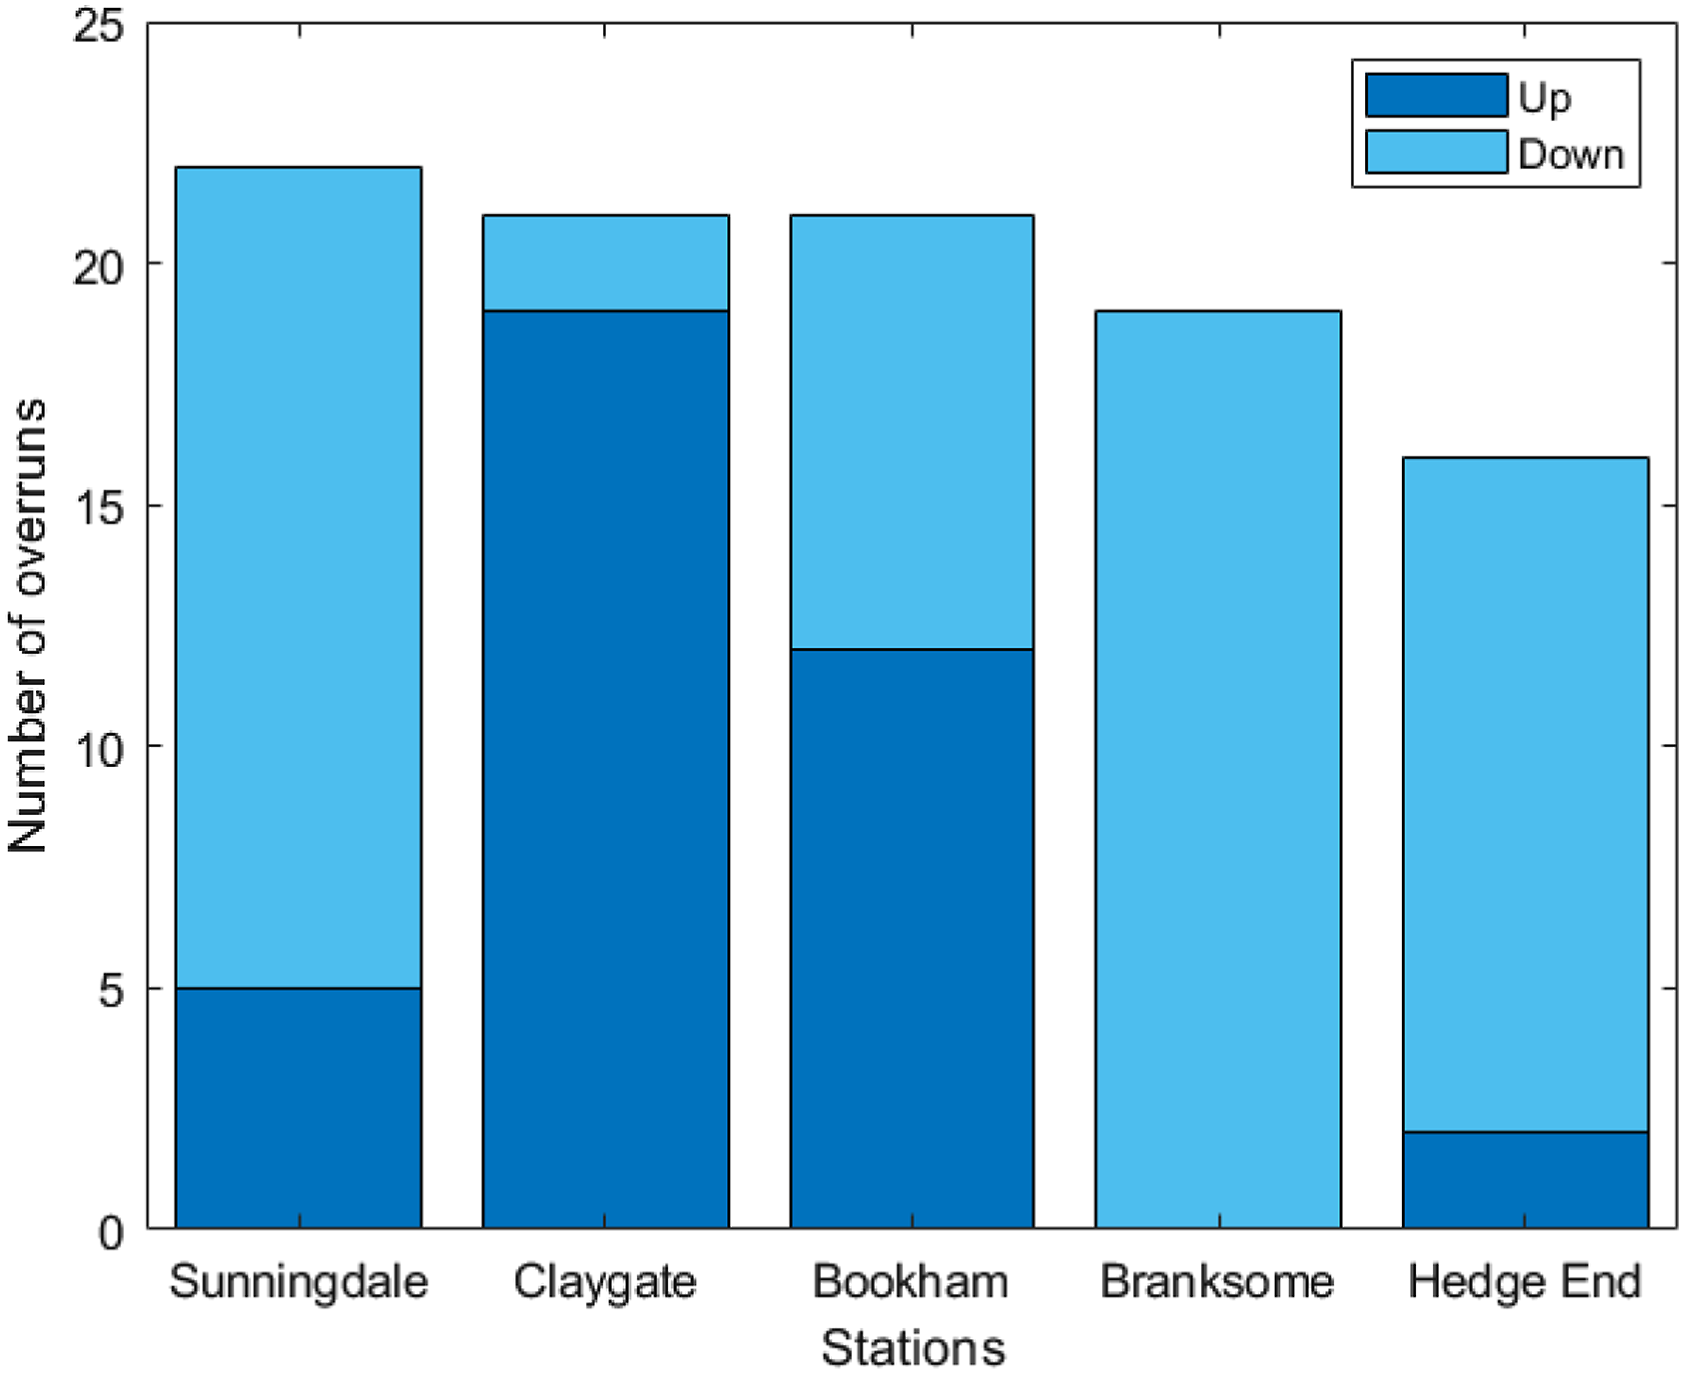
Station overruns across the UK have been plotted using Geopandas and shown on a map in Figures 12 and 13. In Figure 12 coloured hexes are where the keyword search highlighted that leaf contamination was found after the overrun, with a colour bar to show the concentration of incidents in each hex bin. Transparent blue hexes are where a station overrun occurred and no leaf contamination was reported. Station overruns plotted with the UK rail network from 2007 to 2018. Coloured hexes are where leaf contamination was reported after the incident, with a colour bar showing the concentration of incidents in each hex bin. Transparent blue hexes are where a station overrun occurred and no leaf contamination was found. Station overruns plotted with the UK rail network from 2007 to 2018. Coloured hexes are where the keyword search highlighted that poor adhesion conditions had been reported, with a colour bar to show the concentration of incidents in each hex bin. Transparent blue hexes are where a station overrun occurred and poor adhesion was not reported.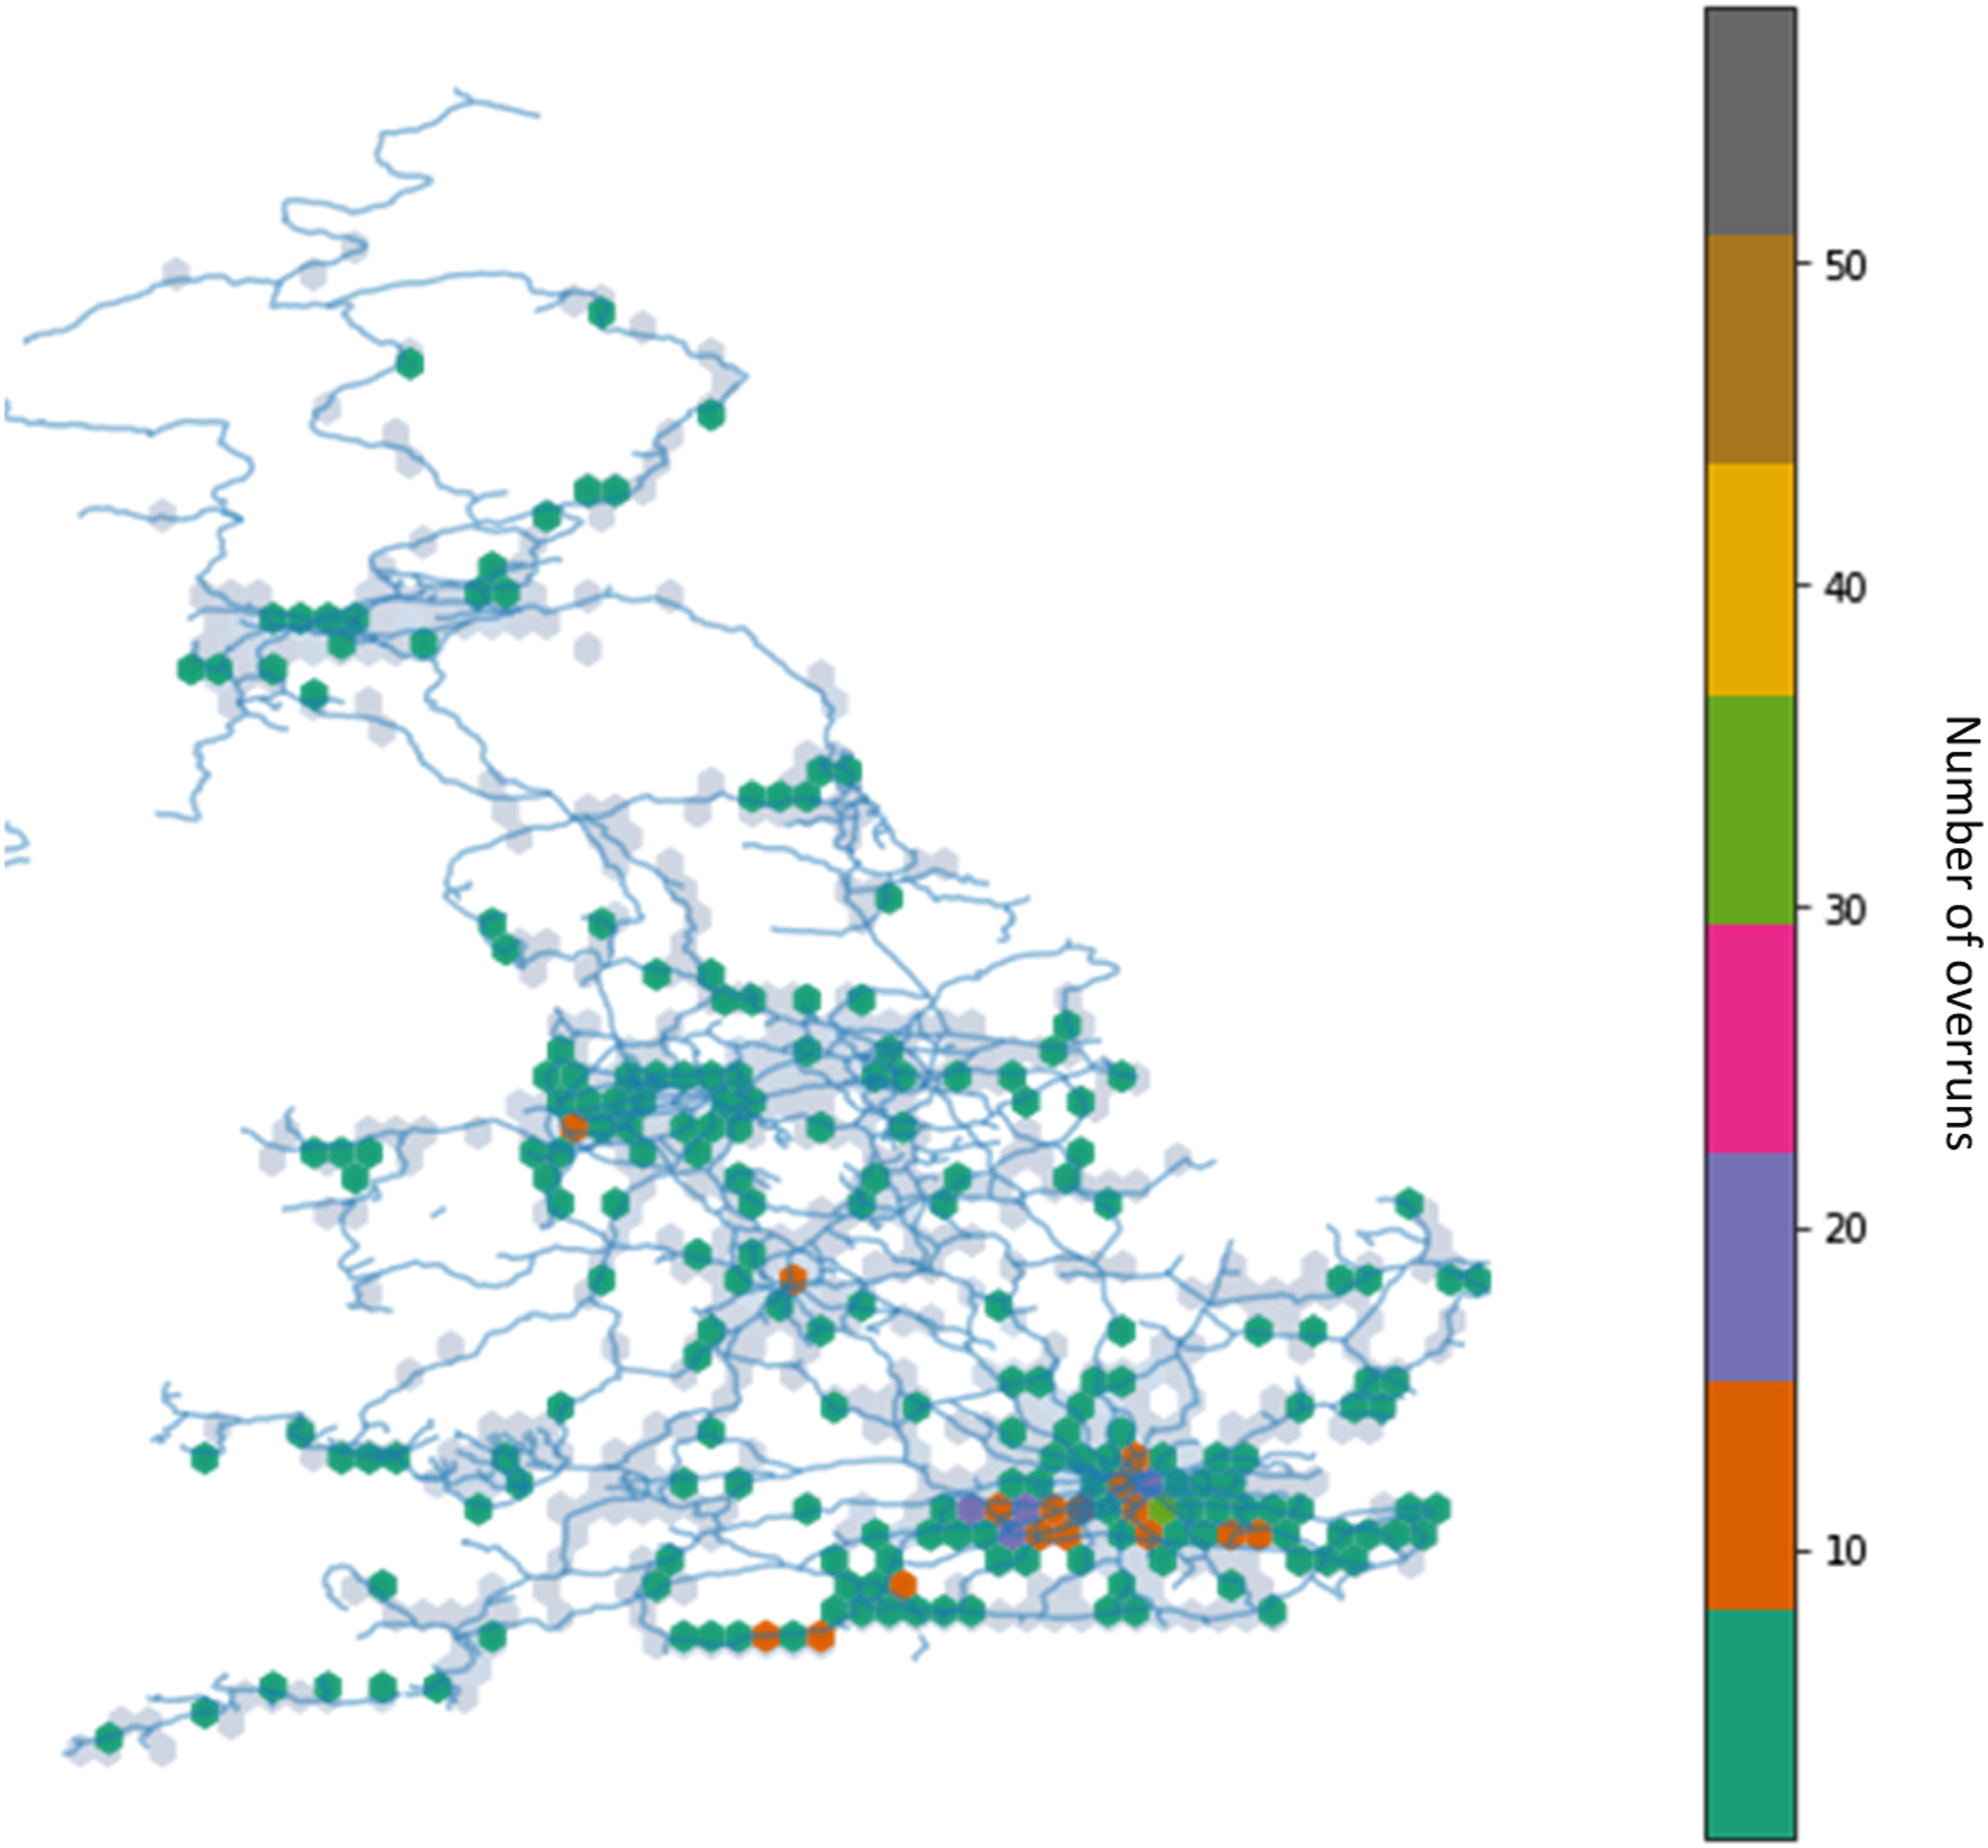
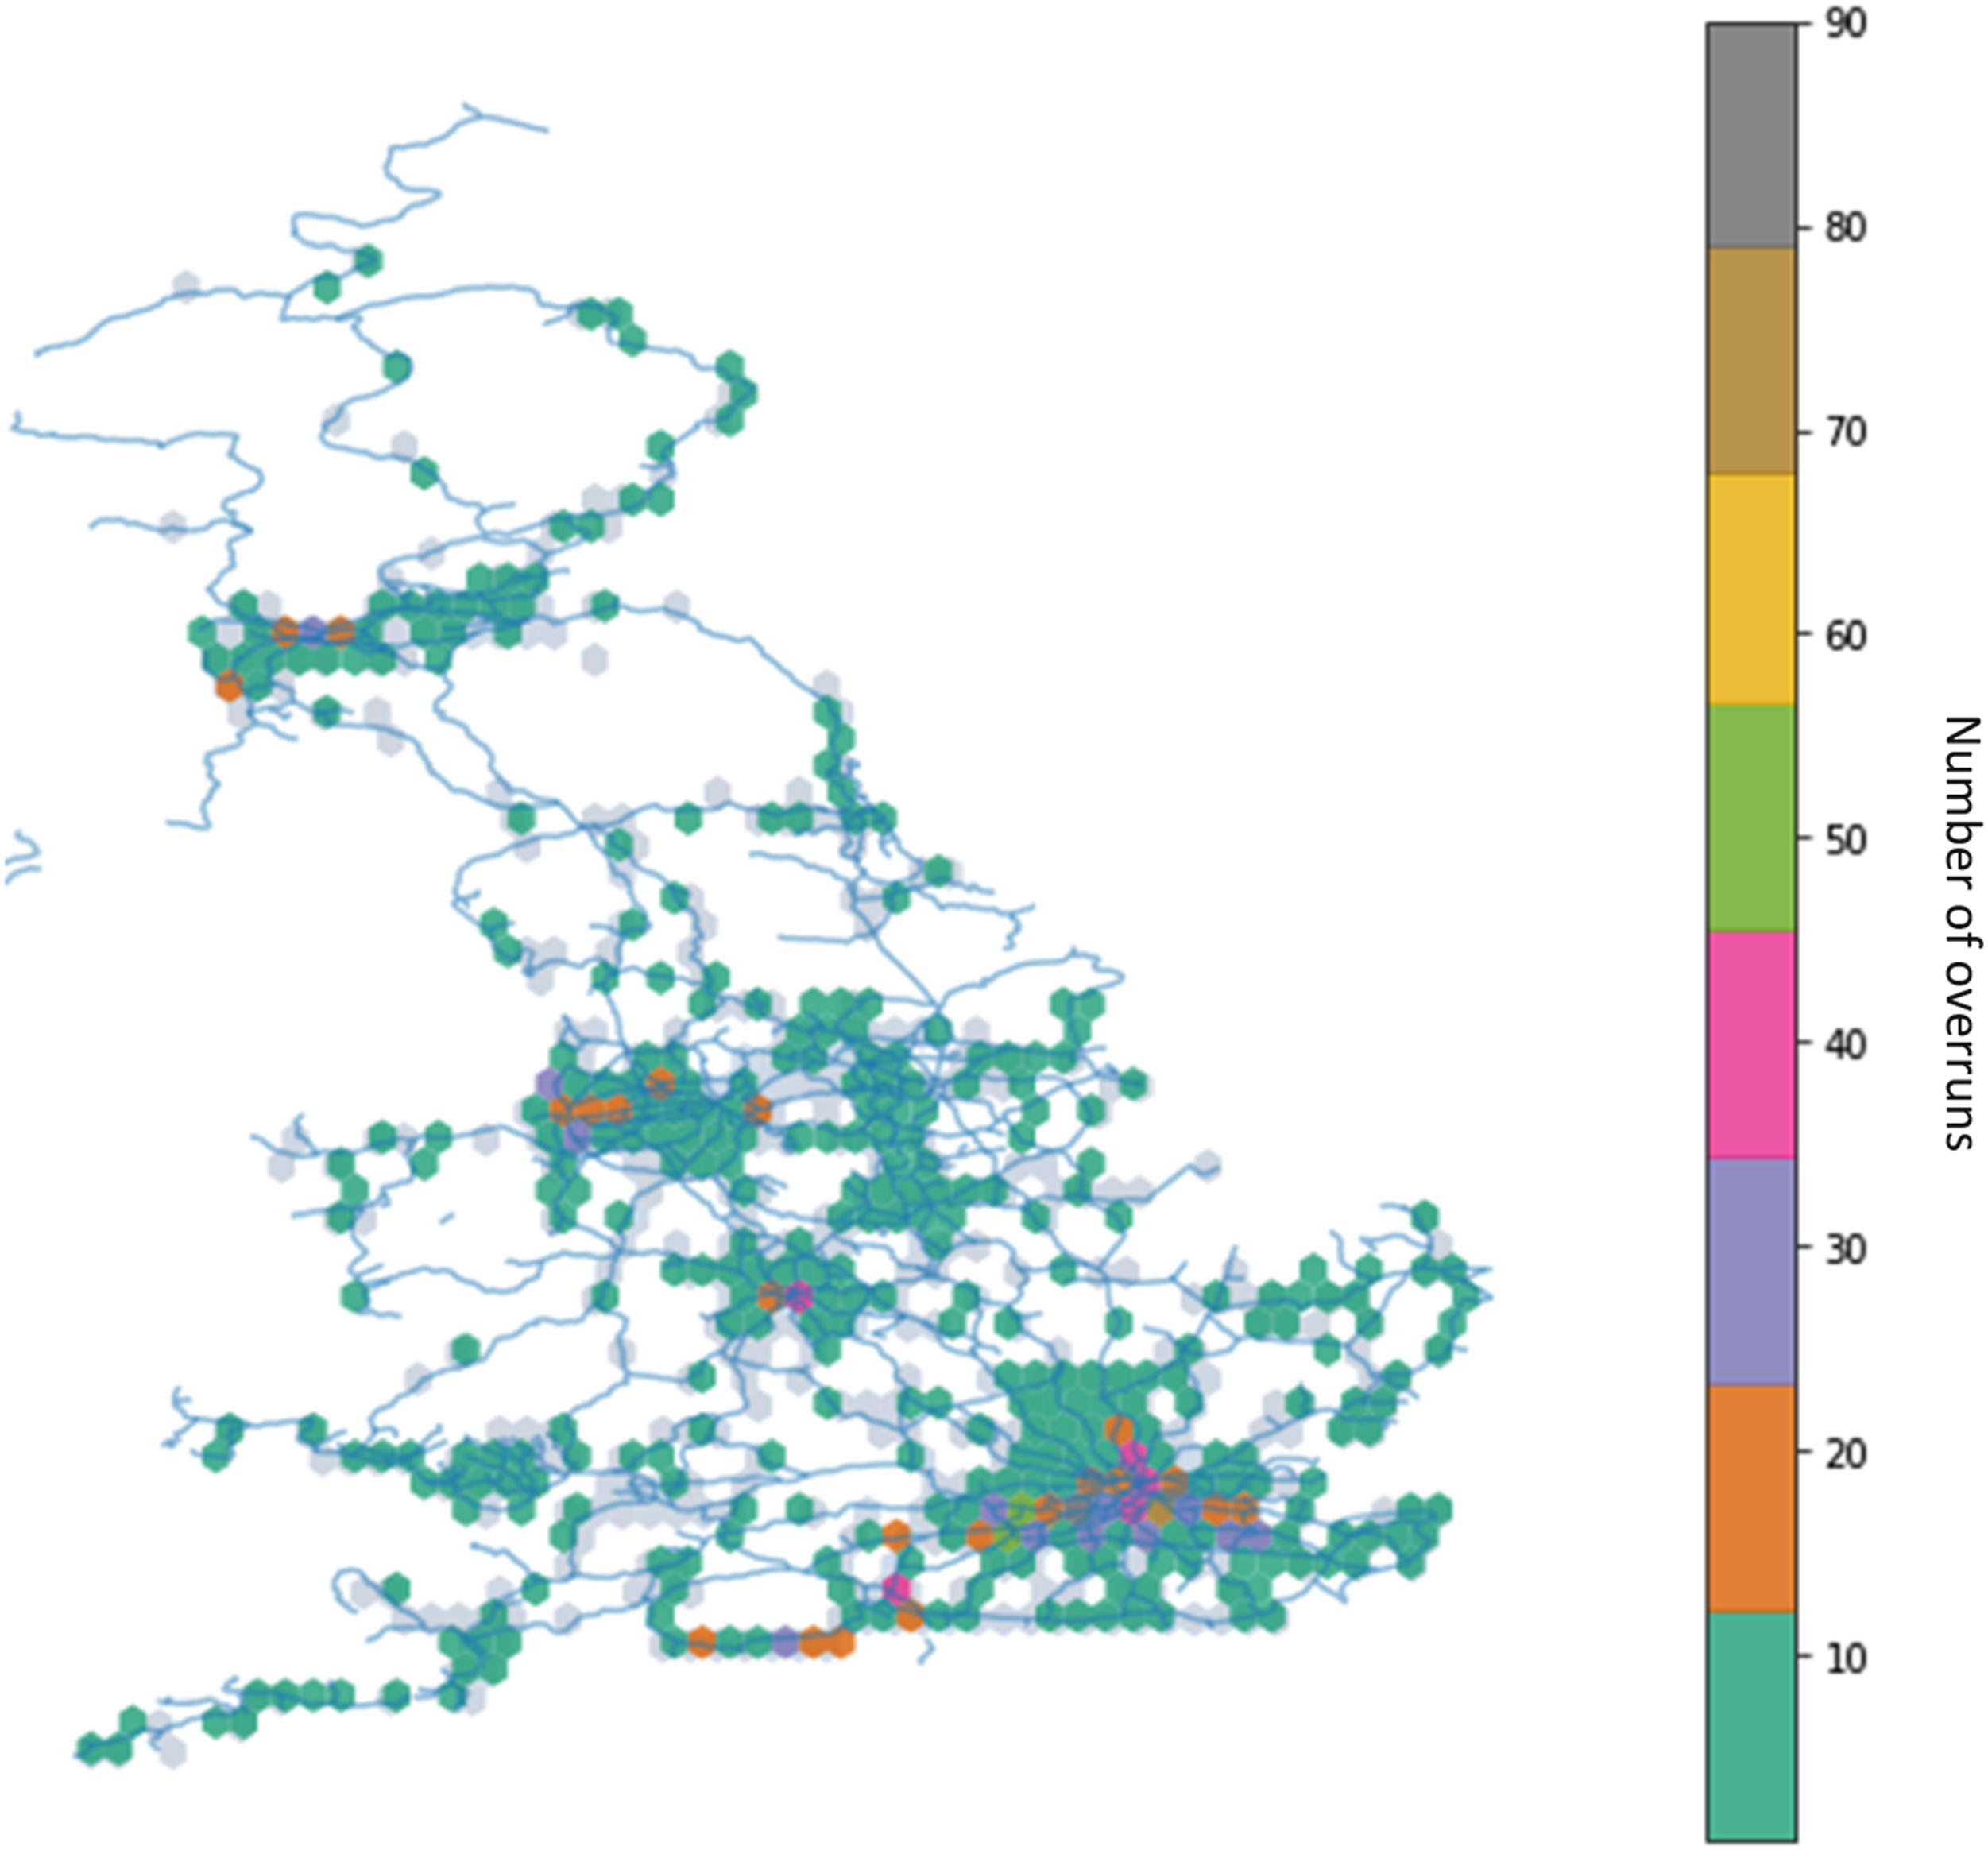
In Figure 13, the coloured hexes represent the areas where poor adhesion was reported after the incident and the transparent hexes are where poor adhesion was not reported. Both maps have similar overrun hotspots, most of which correlate to busy areas with large numbers of station stops. Both figures show how widespread the low adhesion issue is. Although there are some hotspots, less than 10 station overruns have occurred over the data analysis period in the majority of hex bins, station overruns are useful KPI when location low adhesion hotspots but a more regularly occurring KPI such as delay minutes would also be required for a thorough case study analysis. Even in these low adhesion hotspots, the specific site of low adhesion is likely to vary due to the variabilities in the presence of contamination and water.
Vehicle type analysis
The number of overruns where poor adhesion was reported was split by vehicle class. Total overruns per vehicle class are shown in Figure 14 and a heat map of incidents per vehicle class over each year is shown in Figure 17. A similar graph, showing wrong side track circuit failures per vehicle class, is found in RSSB.
12
Number of station overruns where poor adhesion conditions were reported, split between vehicle class between 2007 and 2018.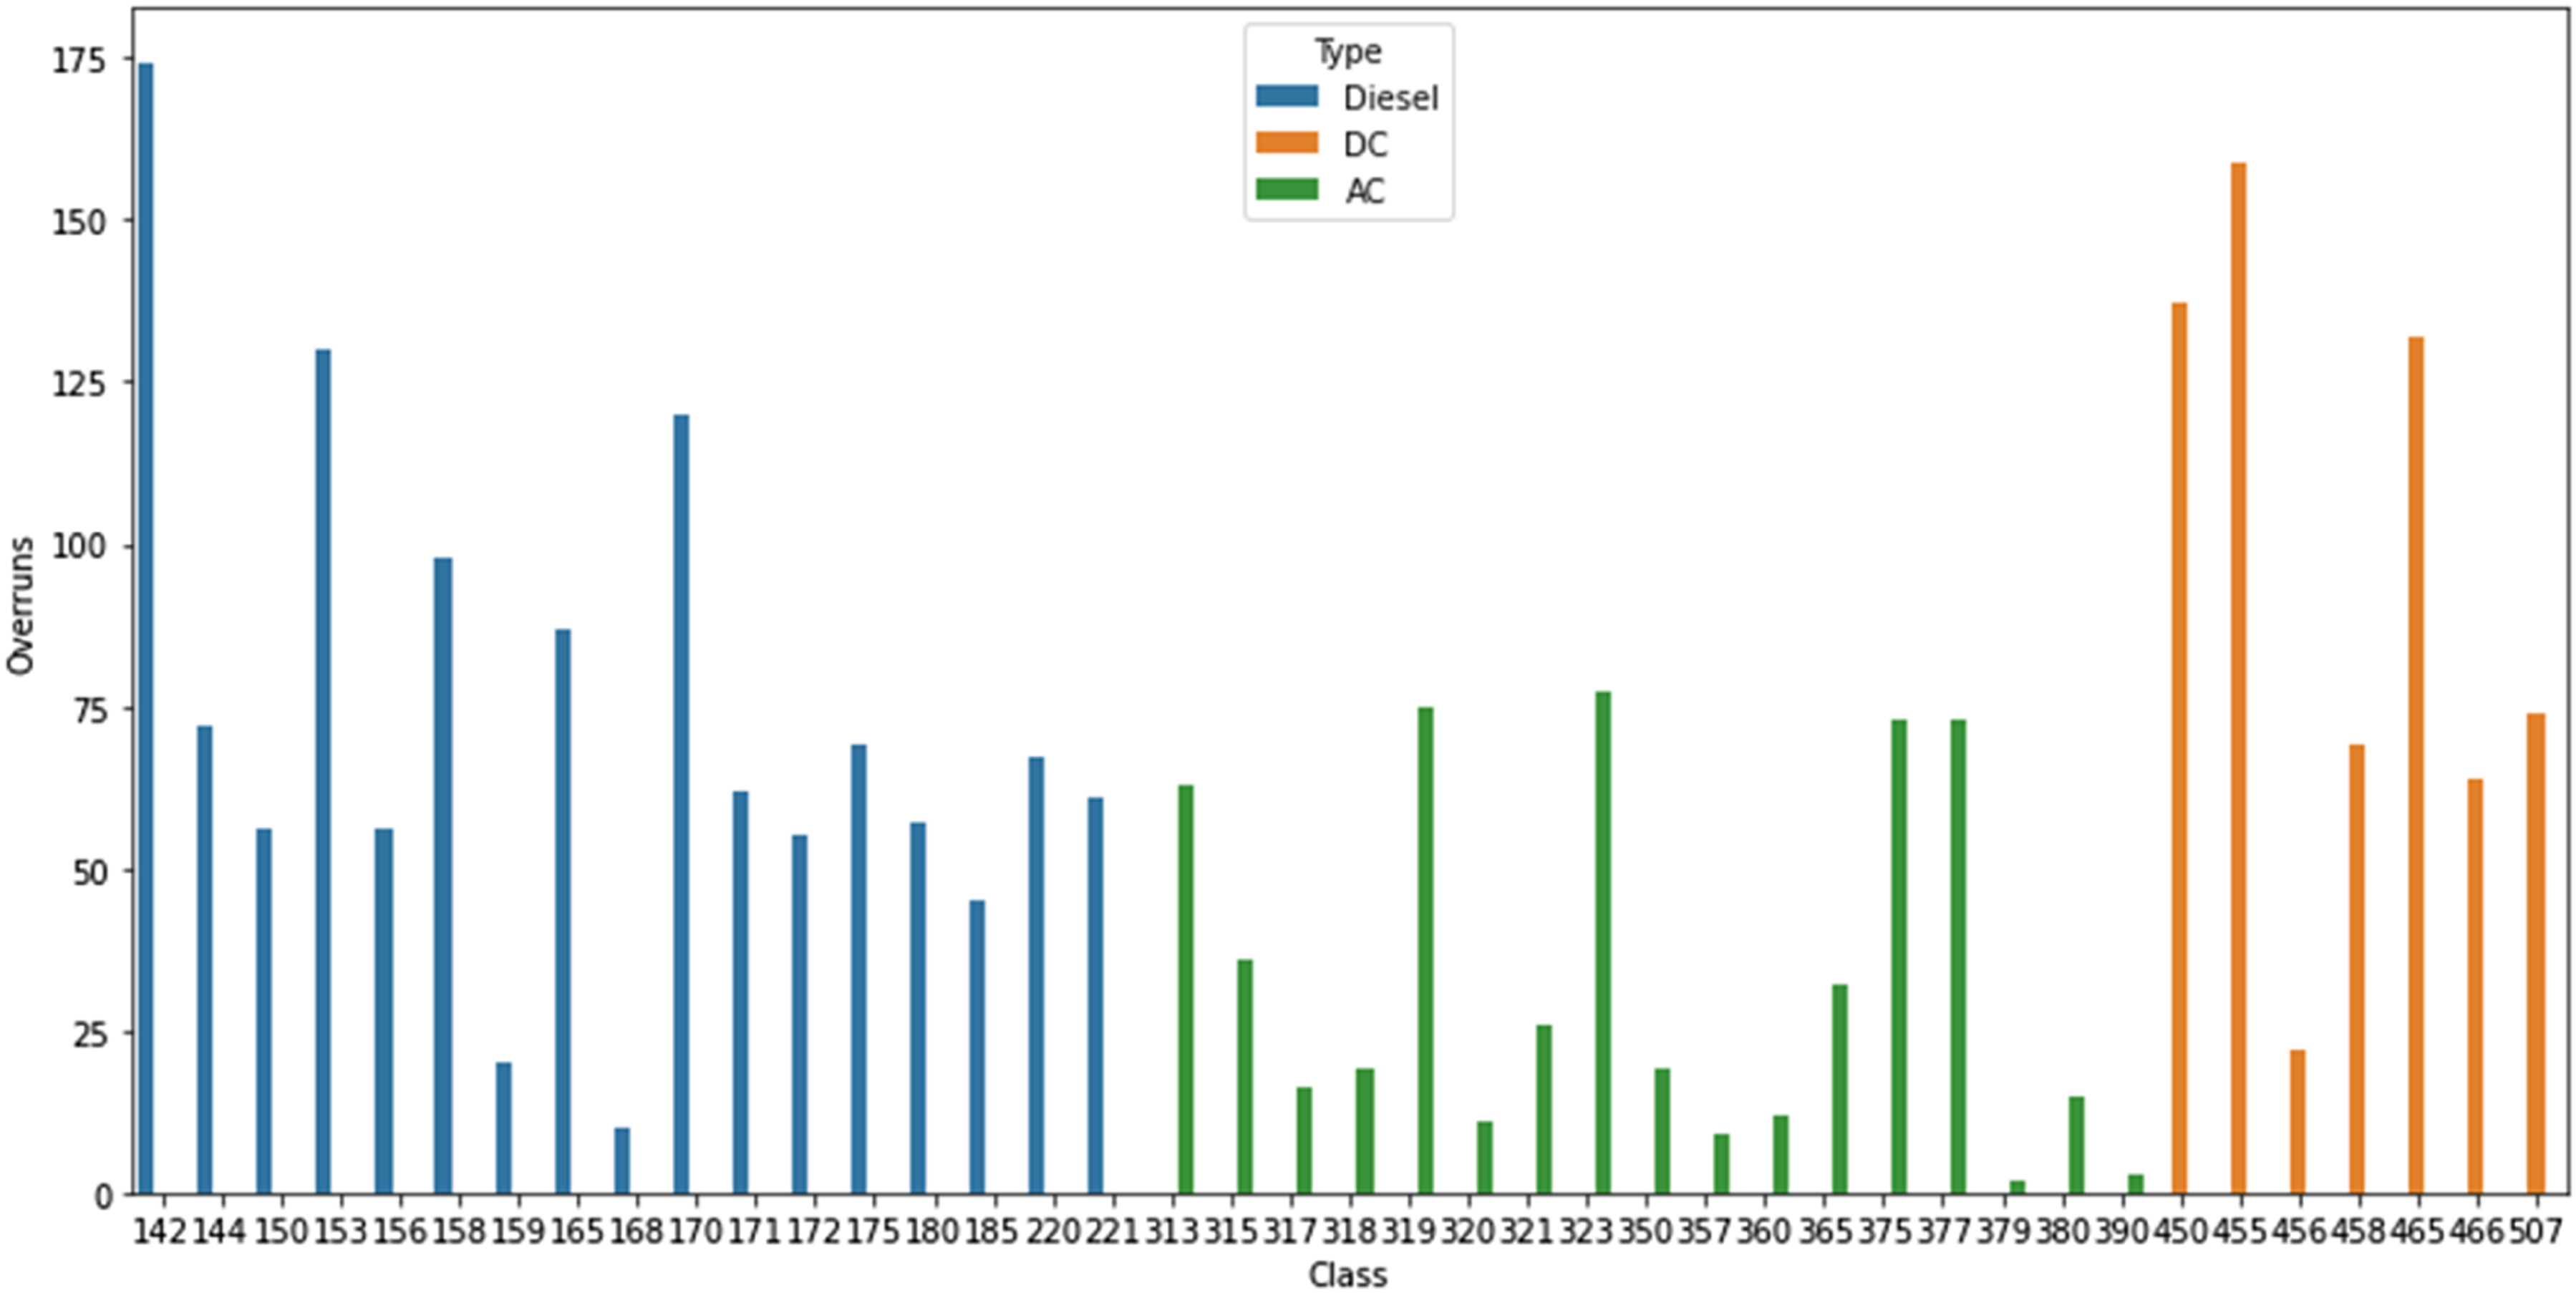
It should be noted that this figure is not normalised, data showing the number of station stops for each vehicle class, alongside knowledge of features such as brake type, weight, number of axles and any WSP, would be required to assess any trends in vehicle type. A heat map of number of incidents for each vehicle class per year is shown in the appendix. In more recent years, Class 170, Class 153 (lightweight and often used on rural lines, may not have wheel slide protection, Class 142 (lightweight) and Class 450 vehicles appear to be causing a higher number of station overruns.
Slip to stand analysis
The NOC daily reports were also searched for “slip to stand” incidents, where a freight vehicle cannot make further progress due to very low wheel and rail adhesion. Vehicles are then stranded until another vehicle can help move them to a depot. There was a far lower number of these in the data set than station overruns, with 83 incidents reported in the NOC logs between 2007 and 2018, but each incident has a large impact on the rail network.
The total number of freight slips to stand per hour is plotted in Figure 15(L) and monthly in Figure 15(R). The hourly graph shows peaks at 0600 and 1700 h. The monthly graph resembles that seen in the station overrun analysis, with an increase in incidents during October and November. Slips to stand per hour (L) and per month (R).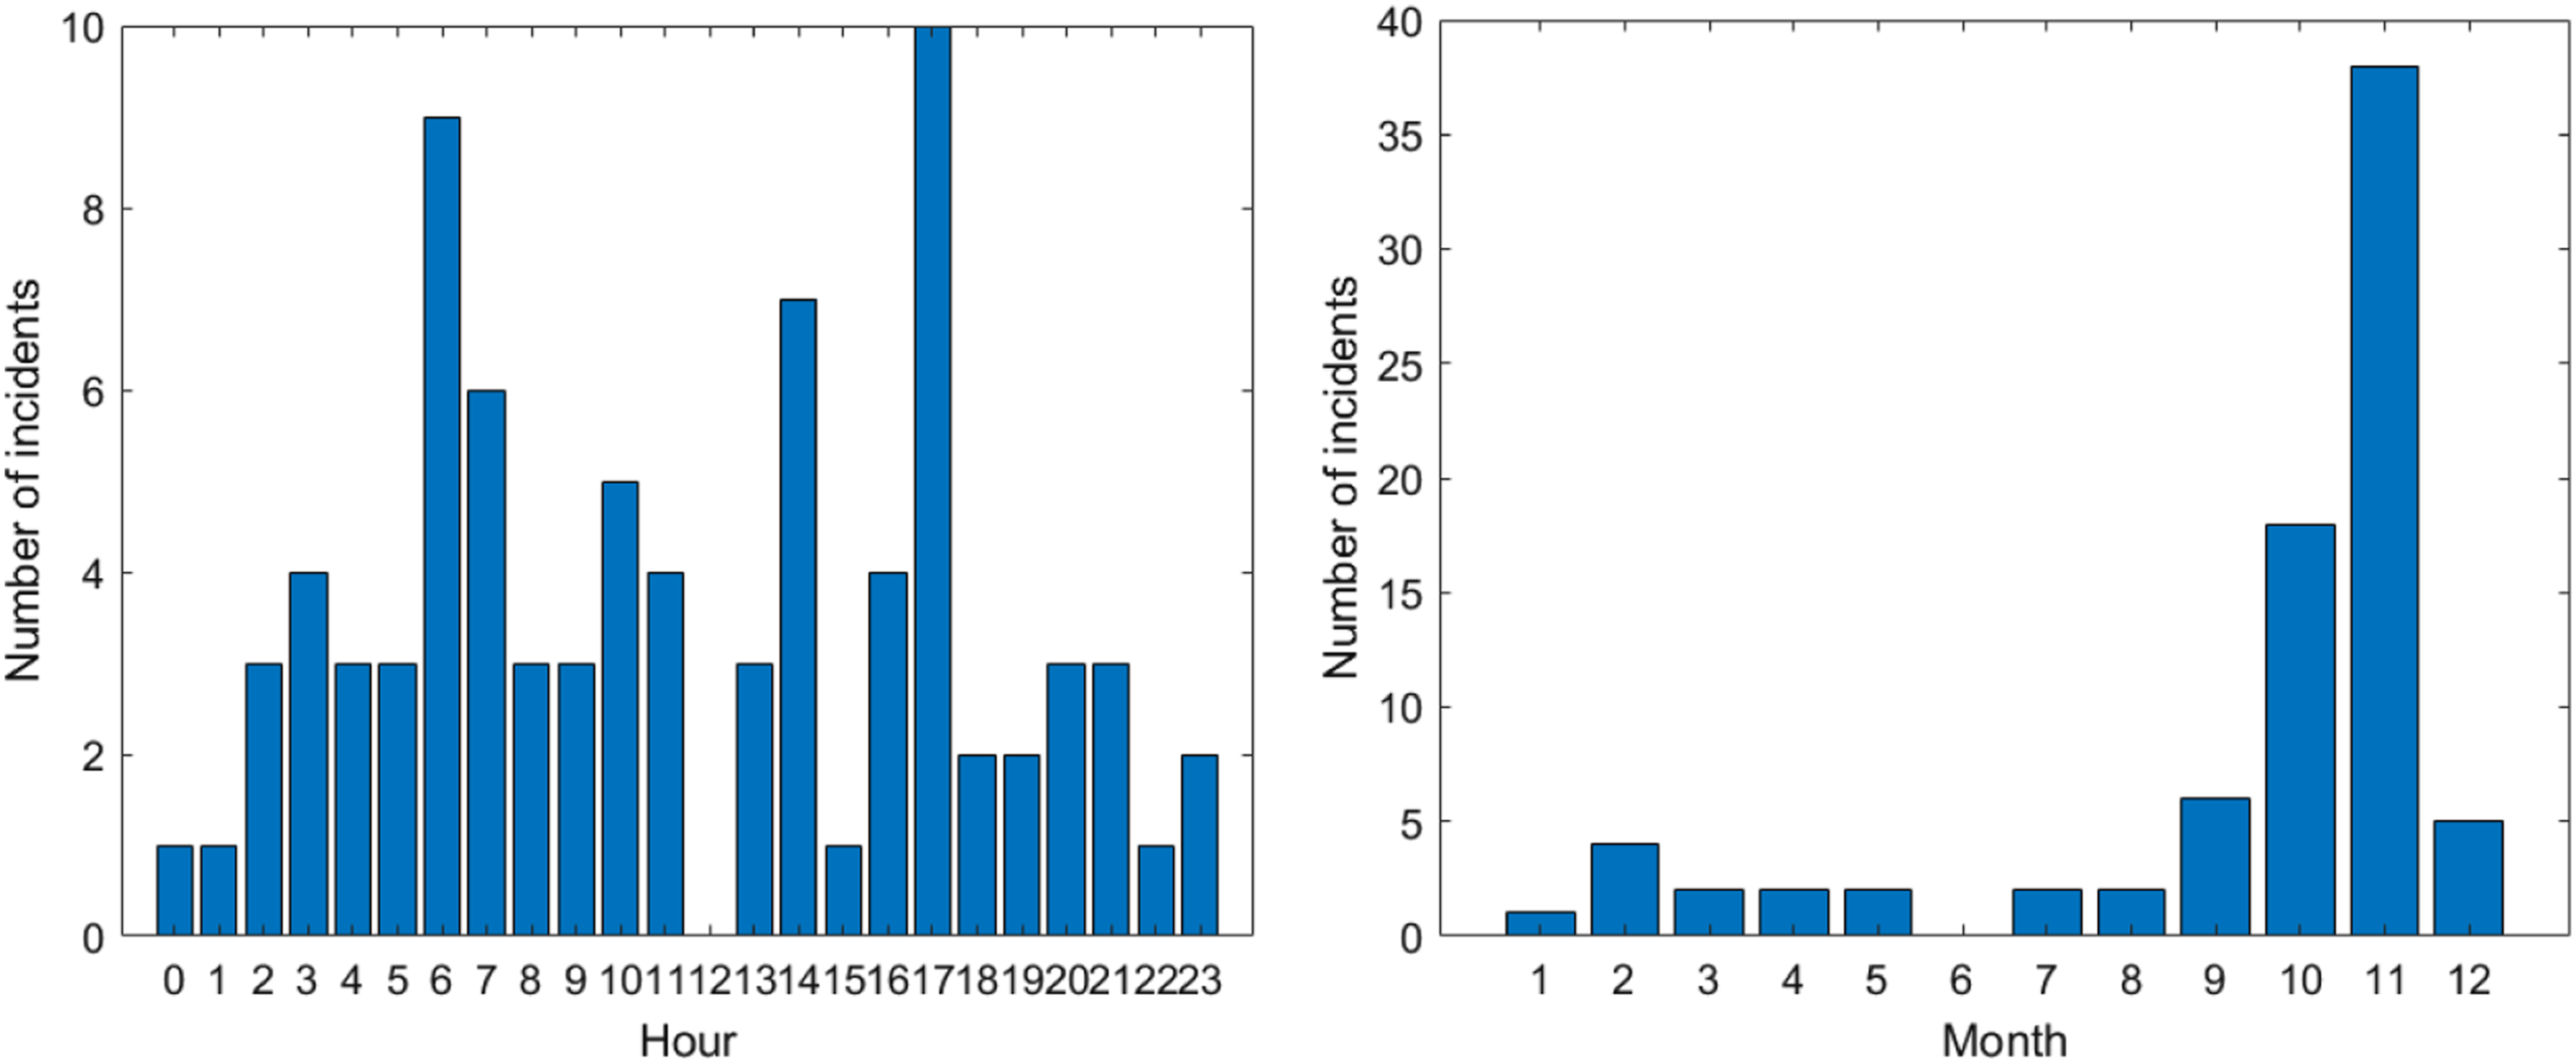
The number of delay minutes for each incident is shown as a boxplot in Figure 16. The median average number of delay minutes per station overrun, where poor adhesion conditions have been reported is 70 with a maximum of 2868 min. The median average delay minutes per slip to stand is 1074, with a maximum of 2902. Number of delay minutes per station overrun and slip to stand.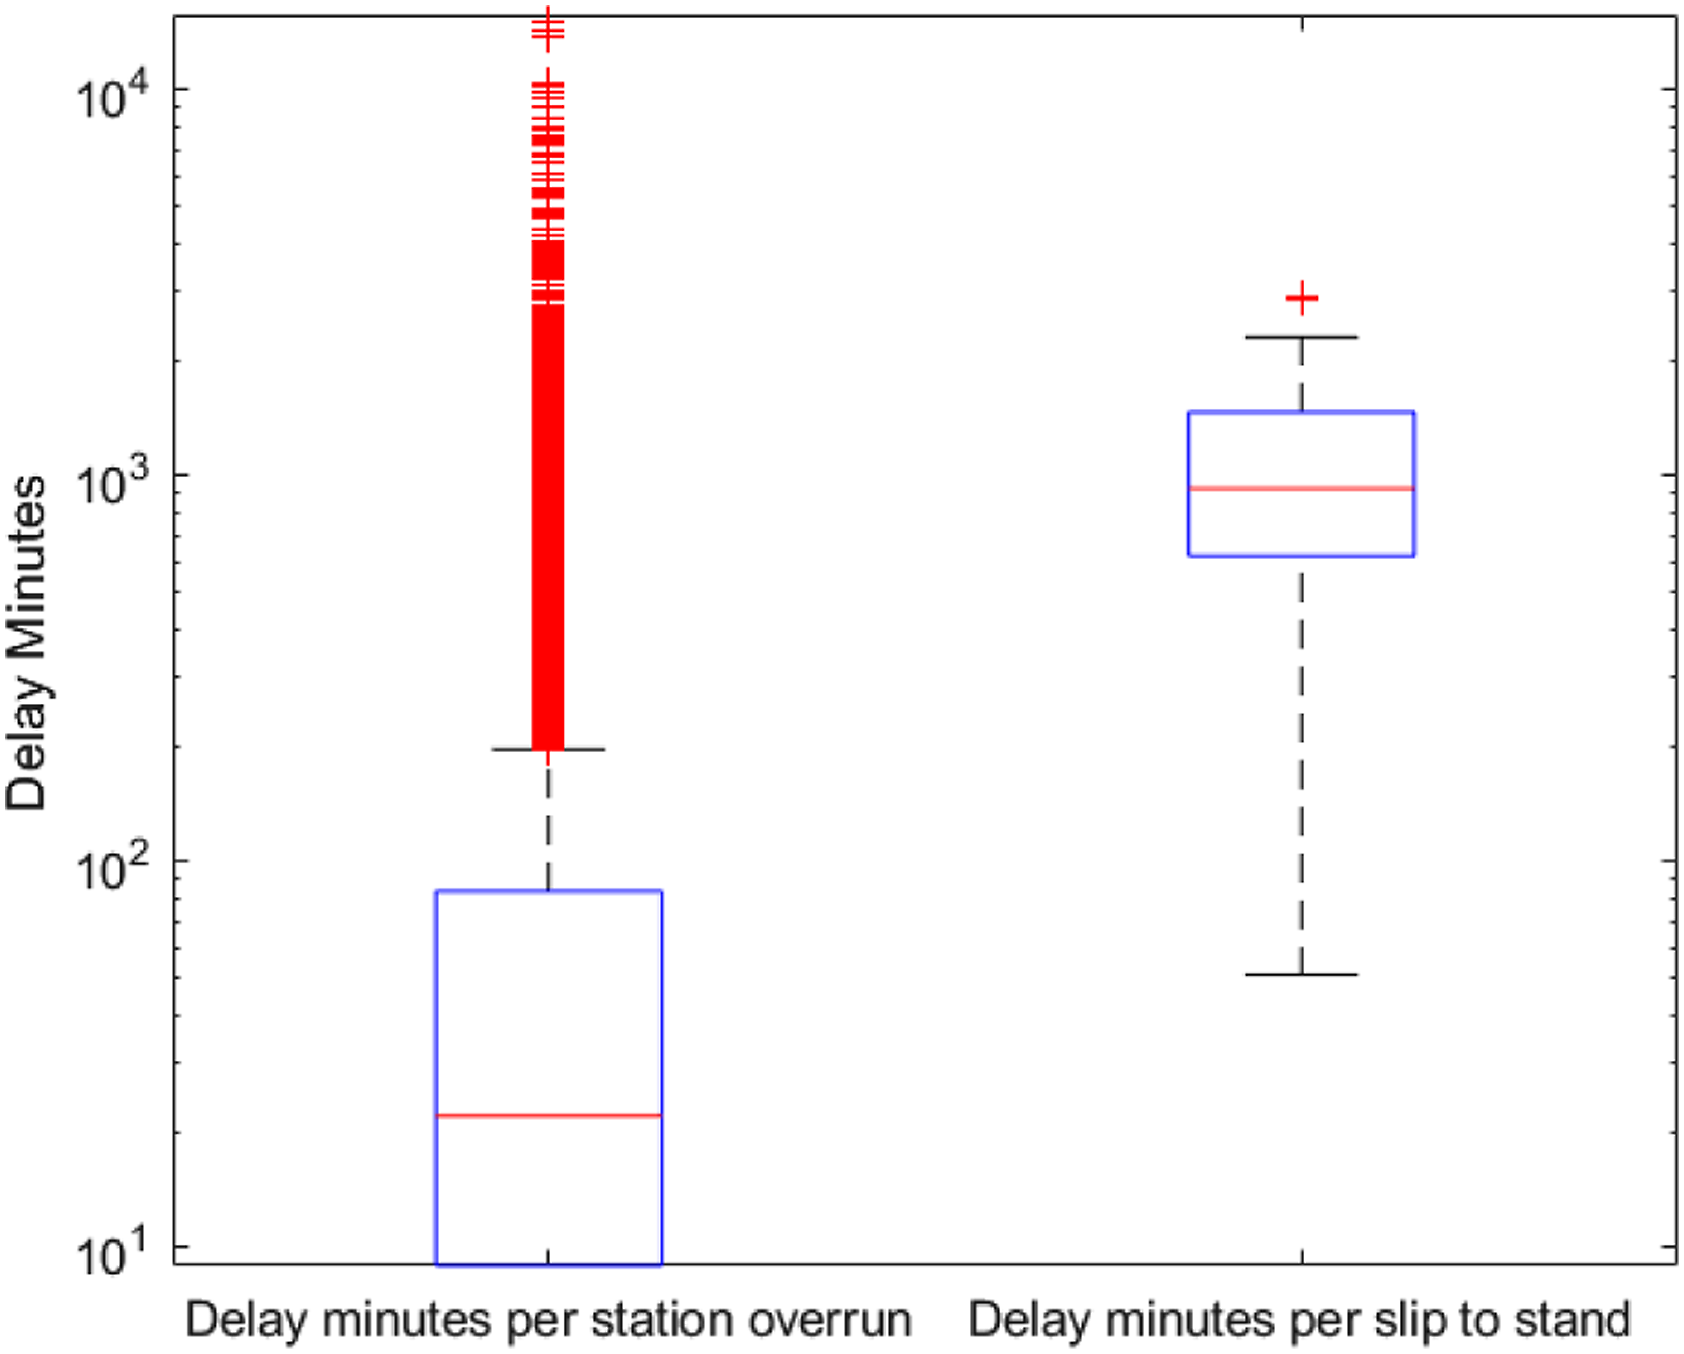
The descriptions for the slip to stand incidents which are provided in this dataset provide interesting details about the low adhesion problem. Sometimes sanders are applied, but do not provide enough traction and the vehicle requires assistance to be towed or pushed back to a station, one case mentioned previous ineffective RHTT treatment. The rail condition is often described, with organic contamination being present for some of the incidents but others describe the appearance of a clean railhead (possibly the wet-rail phenomenon). Low sand levels or all the sand being used during the incident is also mentioned. Some of the descriptions are shown in the appendix.
Discussion
The data has provided some insights into the scale of the low adhesion problem. Notably, the high proportion of overruns related to poor adhesion (not just leaf contamination) that occurs throughout the year as well as during the leaf fall season.
One factor causing this could be that Network Rail only reports leaf contamination in this format during the autumn months of October, November and December. This is the peak leaf fall season but leaves may build up on the railhead outside this, particularly after this peak season if they have already fallen and are blown onto the track by strong winds or the air flow of a passing train.
Organic matter could be present as a thin, transparent film that would not be obvious upon railhead inspection, rather than the more easily visible thick, black railhead contamination that is typically observed. This could also be due to the wet-rail phenomenon, poor adhesion when small amounts of water from dew or light rain mixing with the iron oxides and wear particles that are present on the railhead as the third body layer, an example description of this is shown in the appendix.
This work also shows the high number of station overruns that are not due to low adhesion. This supports a previous report that found that 69% of station overruns were due to human error. 13 Further categorisation of these can be found on RSSB’s Safety Management Intelligence System (SMIS), 14 but the methodology presented in this paper could be used to extract further information on the causes of these overruns in future work.
Potential reasons for some of the station overrun trends are made in this report, but a larger dataset (for instance delay minutes) would be required for statistical analysis on categories such as station and ELR. The GIS work could be expanded with meteorological and topographical data to assess how different weather conditions affect the number of adhesion related KPIs.
The analysis of the freight slip to stand data and the descriptions in the appendix highlight that these incidents do not occur often but have a large impact, averaging far more delay minutes than a station overrun and often requiring additional vehicles to help the stranded train.
Economic cost/benefit analysis are an important tool for determining whether adhesion mitigation methods are economically worthwhile to implement on the railway. When combined with the economic costs for KPIs such as station overruns and delay minutes, available from RSSB’s ADHERE documentation, 10 this dataset could be used to carry out case studies on particular stations, lines or directions. The reduction in adhesion related issues and therefore economic benefits of low adhesion mitigation strategies are often difficult to quantify, but this dataset could provide a method to analyse any changes in KPIs when these mitigation methods are introduced.
The strengths of this dataset, compared to other sources of low adhesion information, is the level of detail contained in the incident description and being updated daily, providing close to real time information on operational and safety indicators. The drawback of the increased detail is that the historic NOC reports are more complex to extract information from and therefore more prone to errors. For the purposes of this paper, the keyword search for example is adequate, but it was time consuming to manually ensure that the dataset was as complete as possible and is flawed if there are spelling mistakes so potentially not yet suitable for widespread industry use. It remains useful for case studies, where a select number of incidents in a particular location can be analysed.
For regular analytics and operational use, the NOC reports would require some key modifications. For instance, separate yes/no box could be used where low adhesion conditions were reported, even if no leaf contamination was observed which would eliminate the need for a keyword search. Alternatively, the more easily useable .CSV based but less detailed RSSB’s Safety Managent Intelligence System (SMIS) is a .CSV based database of station overruns. It could be cross referenced with the NOC reports when further detail of the incident is required for case studies.
Unlike typical industry datasets which are collated and distributed after the year ends, the dataset used in this work could be updated daily after the NOC log is released. This is an example of how data analytics can be moved closer to real time and low adhesion management plans could be adjusted throughout the year in response to changing conditions.
It could also be used to provide quantitative data to monitor the effectiveness of low adhesion mitigation strategies, such as railhead treatment train (RHTT) circuits or traction gel applicator locations, or determine where further mitigation methods are required. If the co-ordinates of TGA locations and RHTT circuits could be obtained, GIS mapping such as that shown in Figures 12 and 13 could be used. It can also be used for other operational uses year-round, such as categorising delay minutes which do not involve low adhesion.
At its most granular level, the graph comparing overruns in the up and down directions in Figure 11 is an example of how a more localised, site specific case study could be carried out in future. The topography, vegetation, lines of sight, weather conditions, traffic volumes and any current low adhesion mitigation methods could be included in this site specific analysis to determine why the incidents occur and how to prevent them.
Conclusions
This work has provided a novel method of using a Python script to produce a daily updated summary of any station overruns that have occurred as well as other pieces of key information that previously been difficult to compile. An overview of the dataset has been reported, suggestions have been made for both future academic studies and operational uses.
One of the advantages of this new dataset and collection method is that it can be updated daily and year round, compared to others that are compiled at the end of the year or only cover the autumn season. This could be developed further to provide data analysis that is much closer to real time, for instance using changes in operational and safety indicators to modify adhesion management strategies throughout the year.
It can be used to study both nationwide trends as well as more granular case studies. The dataset size, covering year-round operational data over 11 years, has not been available previously in this level of detail. This would make it ideal to quantify the effectiveness of low adhesion mitigation methods in future, which has previously been difficult to study.
Although the majority of low adhesion related overrun occur in the autumn season due to leaf fall, this work highlights that low adhesion can occur throughout the year with no visible contamination.
Footnotes
Declaration of conflicting interests
The author(s) declared no potential conflicts of interest with respect to the research, authorship, and/or publication of this article.
Funding
Vehicle class analysis
Number of station overruns where poor adhesion conditions were reported, split between vehicle class between 2007 and 2018.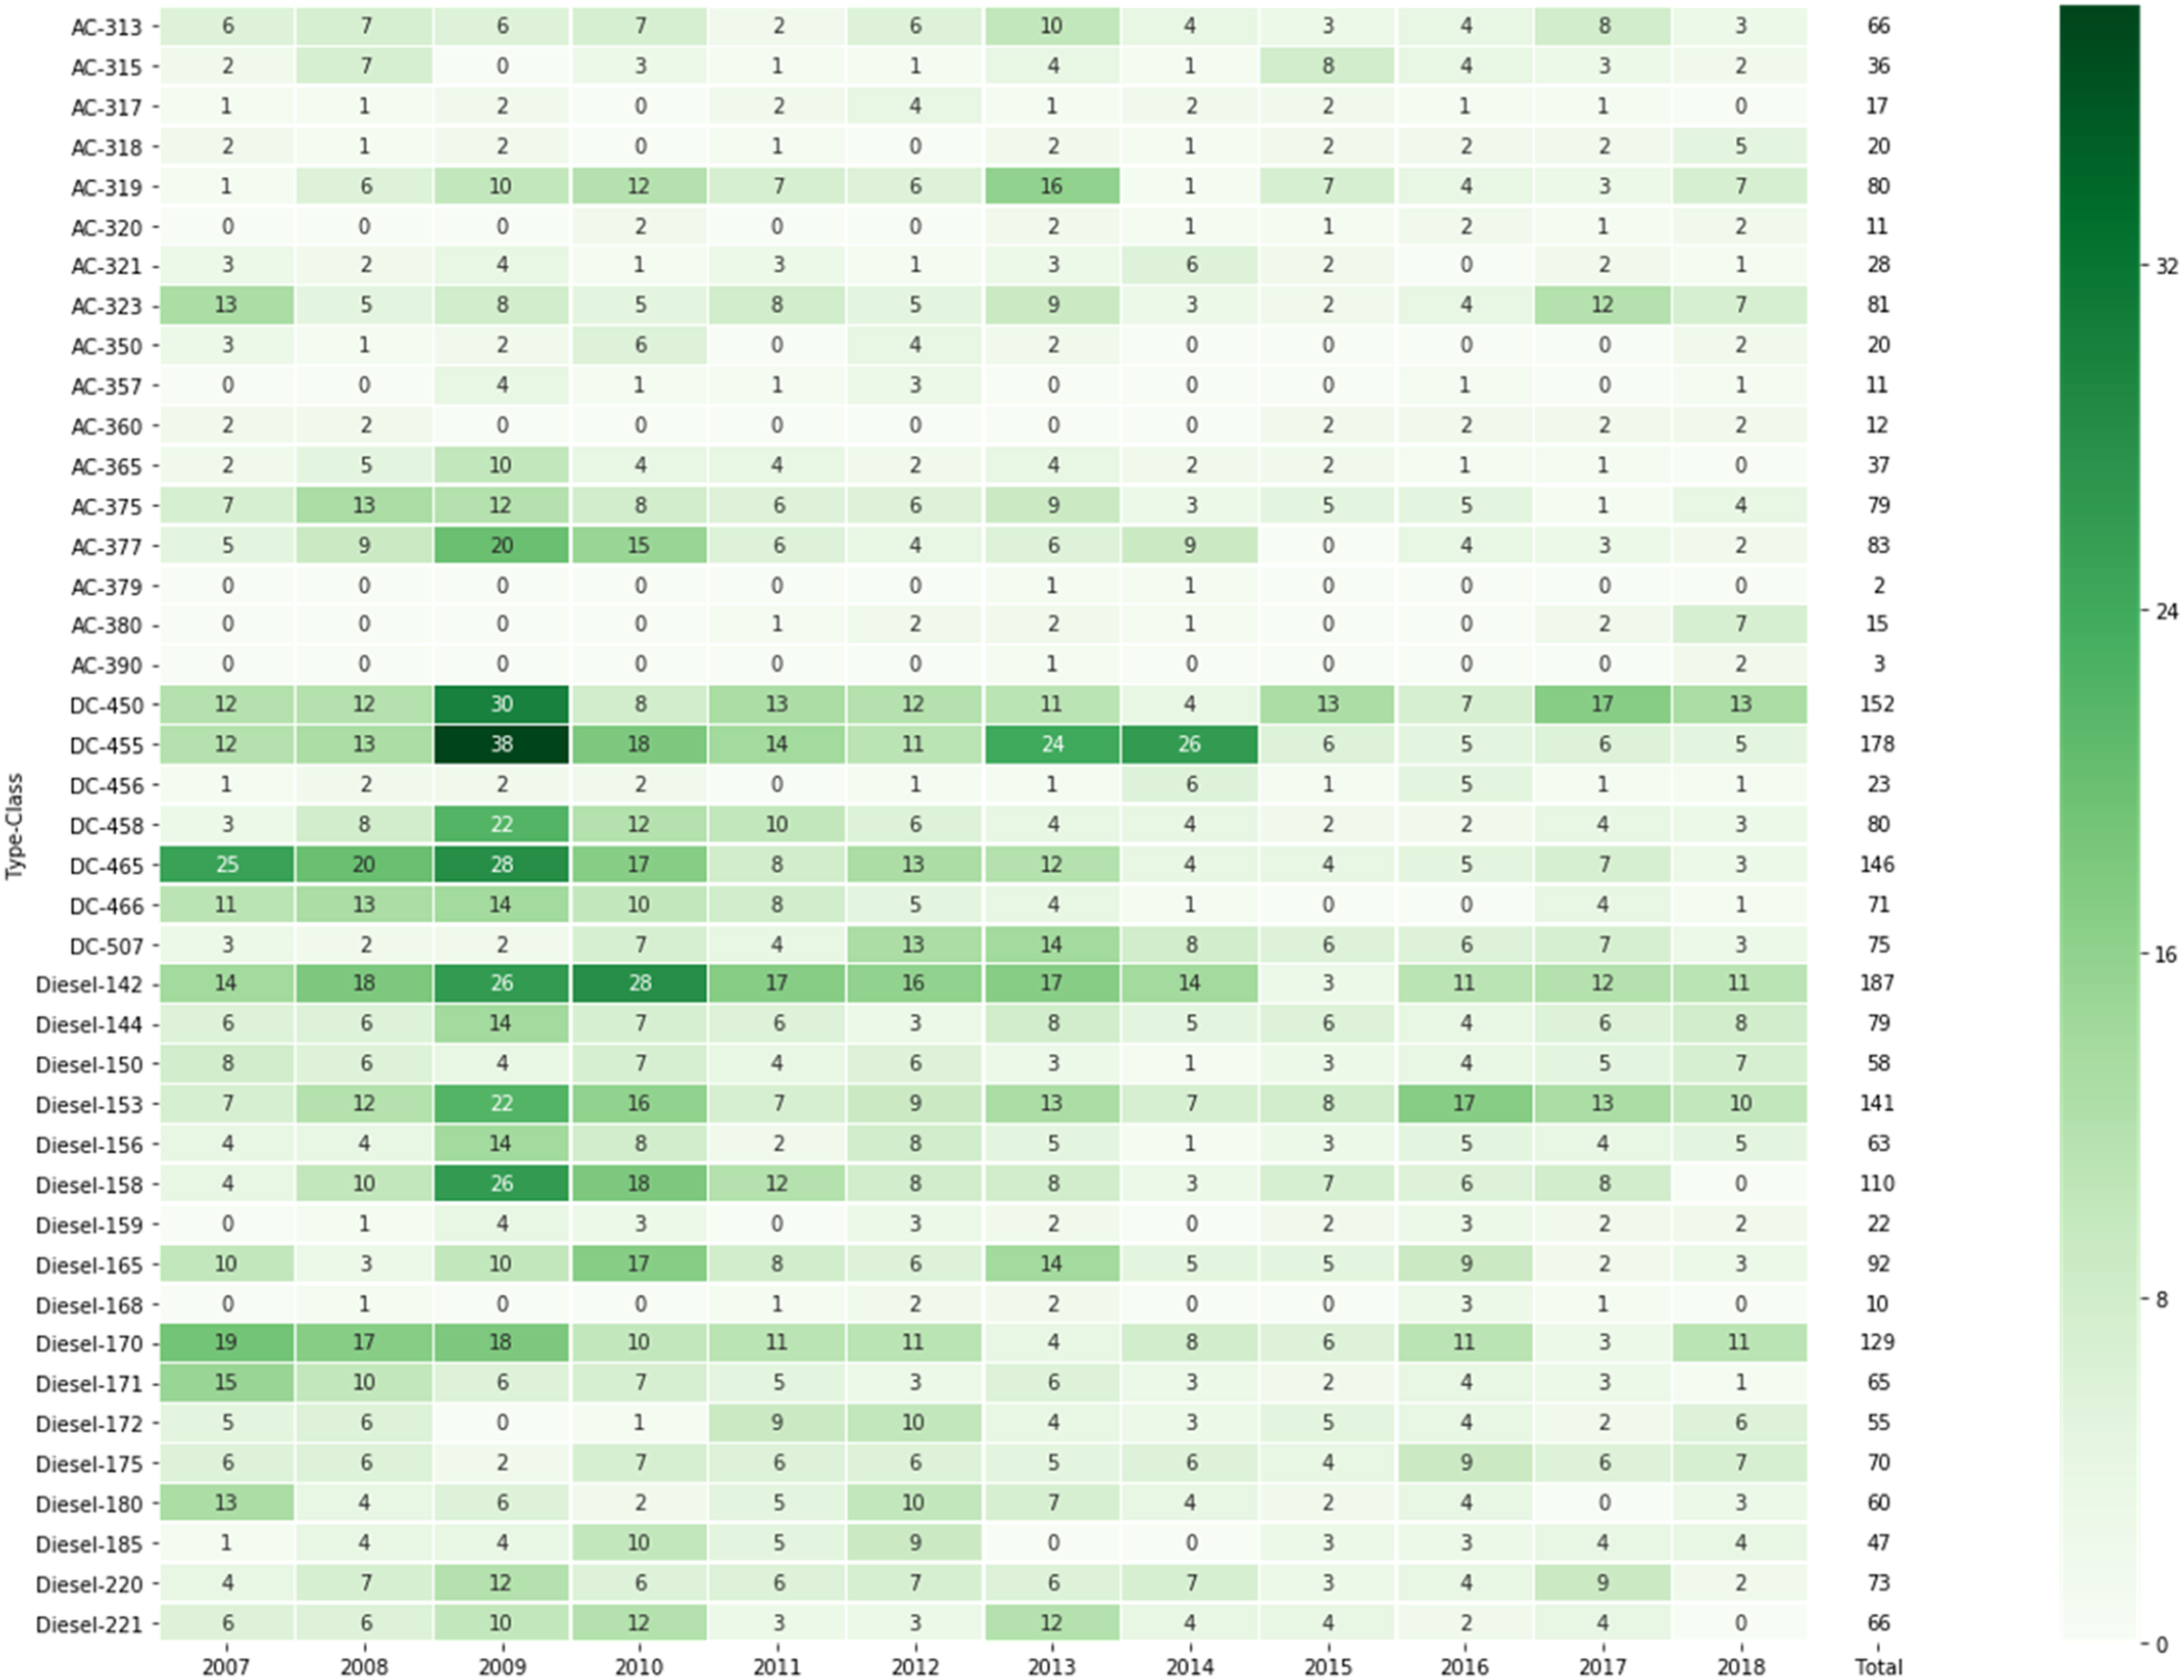
Example Incident descriptions (1) The driver reported unable to gain traction and declared the train a failure at 0850. The route had been treated with water jet and sand by and the Network Rail Mobile Operations Manager reported the railhead was clean, continued forward on its own power from 0920 at 1035 (114 min late). (2) At 1557 the driver reported exceptional railhead conditions between Dee Marsh and Penyffordd, unable to attain a speed greater than 3 mph. Following services also reported difficulties and at 1722, with delays in excess of 120 min/train, passenger services between Wrexham and Bidston were suspended. Arrangements were made for the RHTT to treat the affected section at 30 mph vice the planned 40 mph. However, at 1825 the driver reported that the train had slipped to a stand on the Down Bidston line at Gwersyllt. The driver was able to restart, but was unable to attain a speed greater than 4 mph. P’way equipped with sand joined the train, with additional sandite conveyed by road to Penyffordd. At 2030 the train slipped to a stand south of Penyffordd station. P/way applied sand ahead of the train, but heavy rain in the area washed the sand off the railhead. The driver arrived at the station at 2250 and then waited for additional P’Way resources attend. The P’Way arrived on site at 0050 and sanded the railhead, the driver attempted to restart at 0120, but travelled only a short distance before coming to a stand at 0135. The driver declared the train a failure at 0215 and assisting locomotives from Shrewsbury arrived at Penyffordd at 0235. The assisting locomotives were attached to the rear of the train at 0240, arriving at destination at 0312, 511 min late. (3) At 1730 the driver reported that the train had slipped to a stand on departing from Colchester. The driver reported that sand had been applied but was still unable to gain enough traction on the rising gradient. The driver changed ends and returned to Colchester, arriving at 1815, where the train terminated. The train then worked as a passenger service back to Norwich. The Mobile Operations Manager attended and reported no evidence of contamination on the railhead, which was reported to be clean and shiny. (4) 0624 the driver reported that the train had slipped to a stand due to exceptional railhead conditions on the Single line in the vicinity of the 45 milepost at Annbank. The driver walked ahead of the disabled train and applied sand to the railheads, reporting at 0644 that they had successfully restarted the train. After further stops to apply sand to the railhead, the train cleared the gradient and passed Mauchline Junction at 0845, 209 min late. The driver reported that the locomotive sanders were operating, but that the railheads were icy. (5) At 1114 the driver stated that the overrun was due to poor railhead conditions. The driver was fit to continue. The Network Rail MOM attended and at 1153 reported that the railhead was slightly rusty. A swab test was undertaken.