
Abstract
The characteristics of vehicle shock absorbers have a major significance regarding vehicle dynamics, thus affecting vehicle ride comfort, handling and safety. Although much research focuses particularly on the hydraulic damping properties of this vital suspension component, friction properties are not considered in great detail. However, for driving scenarios of low excitation and velocity of the shock absorber due to moderate roughness of the road, the friction force generated by the shock absorbers and the remaining components is particularly important regarding the transfer of vibration from the road to the passenger. Hence, this study investigates the sensitivity of shock absorber friction to various parameters in the quasi-static domain. The effects of side force, temperature, excitation amplitude and waveform are determined for multiple shock absorbers. The results show no significant influence of the amplitude and waveform used in the conducted tests. Contrarily, the friction force strongly depends on the side force, which represents the variable load perpendicular to the shock absorber’s main axis arising during various driving events for MacPherson suspensions. An increased temperature reduces the side force effect.
Introduction
In order to efficiently predict and investigate passenger vehicle behaviour, especially regarding its vertical dynamics, it is strictly necessary to determine the diverse properties of the suspension components. Therefore, the existing phenomena and effect mechanisms in the suspension need to be well understood. Besides stiffness and damping properties being commonly considered, friction properties need to be taken into account as well. On the other hand, the number of studies dealing in detail with the effects and importance of suspension friction properties in the context of vertical dynamics is rather limited. 1
In a previous study of Deubel and Prokop, 1 the front suspension friction of a mid-size car was investigated for various load cases, resembling abstracted load situations as occurring during real road driving scenarios. In the investigated MacPherson suspension concept, the equipped shock absorbers (SA) are assembled together with the springs in the form of struts. Because of this specific concept, the twin-tube SA is subject to a varying amount of side load at the strut’s top mount, largely depending on suspension geometry and the load present at the tyre contact patch. This results in a varying amount of friction, which is therefore specific to a certain driving scenario. Consequently, the SA friction is of relevant interest and considered a key element in order to analyse the total suspension friction, arising from SAs, elastomer bearings and ball joints. The friction of the SA itself originates from three pairwise interacting elements2–4– the load-independent part resulting primarily from the oil seal/piston rod, which can be seen as the basic friction value of the SA, and the load-dependent elements of piston rod/rod guidance (bearing) and piston/inner cylinder.
The effect of SA friction in terms of vehicle vertical dynamics was partially investigated in different studies.5–7 Wünsche et al. 5 performed cleat driving tests on a middle-class vehicle with a Mac-Pherson front suspension. They demonstrated the effect of a specialised side load spring in order to reduce the shock absorber side load and thus SA friction, which resulted in 50% less acceleration transmitted from the wheel to the top mount (chassis). Manger 6 highlighted the friction effect by gradually decreasing the excitation amplitude of the wheels on a full vehicle test rig, making friction increasingly dominant compared to other suspension properties. In consequence, the body’s vertical acceleration increased over a wide frequency range.
This emphasises the relevance of improving the understanding of SA friction force, particularly for MacPherson suspension systems, and its subsequent effect on vertical dynamics.
As one step towards this end, this study investigates at first essential influences on the quasi-static SA friction in the range of low velocity. The resulting knowledge can be used to improve understanding the friction situation on subsystem (suspension) level or to extend the friction modelling by implementing potential effect mechanisms as needed. Besides the load effect (side force), the study presented herein addresses the friction sensitivity to three other parameters: excitation amplitude plus waveform, and temperature.
In the context of this study, the type of friction investigated is primarily quasi-static, that is, determined in gross sliding condition under harmonic excitation (sine, triangular) at low velocity, up to 1 mm/s. This value is widely used to assign a basic friction level to the suspension or its components1,2,6,8 and is calculated from the hysteresis width of the force-displacement-graph (see Figure 8 in section ‘Shock absorber friction measurements’).
Section ‘Existing studies investigating shock absorber friction’ elaborates further on the test methodologies and outcomes of various SA friction studies and indicates potential lacks thereof. Then the quasi-static SA friction protocol used in this study and the results are presented in section ‘Shock absorber friction measurements’.
Existing studies investigating shock absorber friction
For discussing the characteristics of SA friction, firstly a clear distinction is needed regarding the static and dynamic friction properties. The latter are present at higher operational velocities and include both, stationary and transient characteristics. In contrast static friction, sometimes termed stiction, is represented by a break-away force that is needed to initiate gross sliding out of a resting position.
However, this must be distinguished from ‘quasi-static’ friction as investigated in this study, since the determination of real static friction presupposes explicit phases of resting before motion begins, and thus differs from the test methods described later.
A typically used signal constitutes a triangular ramp out of the resting position. Some studies9,10 used a specific test set-up, in which a position controlled ramp at constant velocity is applied to one object that is linked to another by static friction. The latter is connected to a spring of constant spring rate. As long as the static friction force is higher than the increasing spring force, no gross relative motion between the two partners takes place and the spring compresses accordingly. From the maximum spring force at the moment of the initiated sliding process, the break-away force is obtained. Körner and Mayer 11 performed in their study an alternative procedure, wherein a position controlled ramp with a certain target velocity was applied to a SA out of a resting position. At the time of initiated motion, they found a varying friction force compared to the friction force at constant target velocity representing the quasi-static domain.
Further research2,4,12 also focused on another aspect: the break-away force in the reversal points of a harmonic excitation of SAs. In the reversals, motion is at least briefly suspended. However, using the term ‘break-away force’ in this case can be misleading, as it is rather assigned originally to a force needed to initiate motion out of a resting position, which exists at best for a short moment during reciprocating motion. Hence, the phenomenon addressed hereafter could be termed more suitably ‘force in the reversal points of reciprocating motion’. This force is sometimes, but not necessarily always, larger than the quasi-static friction force in sliding conditions, as illustrated exemplarily in Figure 8 of section ‘Shock absorber friction measurements’. On this, Kato and Sasaki 13 investigated the friction behaviour between the SA cylinder and the piston band by using simplified sliding specimens (steel disc and copper ball) on a tribotester, adding various hydraulic fluids as used in SAs. The tests were performed at a 5 Hz sine wave at amplitudes between 0.1 and 2.0 mm. For one specific oil, there were no peaks or force levels in the reversal points of the force-displacement hysteresis exceeding quasi-static sliding friction. For others, significantly higher force levels occurred immediately before the motion began again and/or immediately before the motion was suspended.
One of the early works providing experimental data on SA friction is the study of Kölsch, 2 dealing with the implementation of Coulomb friction in vehicle simulations. For this purpose, he determined quasi-static SA friction depending on side load using a specific test layout. Kölsch found the friction coefficient of the pairing piston rod/rod guidance to be linearly decreasing with increasing side load. Thus, an approximately linear/degressive increase of the friction force with the increasing side force was obtained. He also observed force peaks in the reversal points of the oscillatory motion (1 mm/s, 75 mm amplitude, waveform not specified) to be approx. 20% higher than the quasi-static sliding friction force.
In the study of Komori et al., 14 the friction characteristics of magneto-rheological dampers were investigated. In one scenario of side force application, a degressively increasing force value with increasing load could be observed, which indicates a decreasing friction coefficient as stated by Kölsch. Tests were performed in a quasi-static manner (0.1 mm/s, 5 mm amplitude, triangular waveform). Another interesting outcome worth mentioning addressed the issue of durability, insofar as the friction force decreased after 200 h of sliding time.
Kruse and Zimmermann 4 addressed the impact of side force and inner pressure on the quasi-static friction force of a twin-tube SA (2 mm/s, 25 mm amplitude, sine waveform). The relationship of side force and friction force was linear, determined from three side force steps. Compared to quasi-static friction, they found remarkably higher friction forces of approximately 30 %–60 % in the reversal points (extracted from Figure 7 of that publication). However, this was only in cases of significant side force (600 N or higher), although the variation of side force (0/600/1400 N) was quite limited. Contrarily, without side force, the friction force values were highly similar. In case of higher velocity (20 Hz, 1 m/s), performed on a specimen without any fluids and valves, the force at the reversal points exceeded the quasi-static friction force as well. They further stated the friction force in the reversal points to strongly originate from the friction pair piston rod/rod guidance, but no explanation was provided.
Two studies of Körner and Mayer11,12 investigated the dynamic friction behaviour using a modified valve-free mono-tube SA without any side forces. For high-frequency excitation (up to 90 Hz and up to 0.5 mm amplitude, sine waveform), no significant increase of the force in the reversal points was obtained. In another test scenario, motion was initiated out of the resting position in a triangular mode. Here, the break-away force became apparent, becoming stronger the higher the target velocity. But in the quasi-static range (0.1 and 1 mm/s) the effect appeared to be rather small. Furthermore, the influence of the oil seal on the friction was analysed. Results showed that a decreasing inner pressure decreased the friction force in sliding conditions as well as the break-away force, which was explained by the decreasing pressure of the oil seal on the piston rod. The results thus confirmed previous findings of Kruse and Zimmermann 4 on the effect of inner pressure.
Further experiments also dealt with the stationary characteristics of dynamic friction,3,11 which is however not in the focus of this research paper.
In another study, Herzog and Augsburg 15 examined the friction of the various contact elements of the SA separately, while the contact of the piston rod/guidance contributed most.
Evaluating the literature, it becomes evident that quasi-static SA friction was rarely investigated yet, while the effect of the side force was predominantly addressed. Some work also dealt particularly with the dynamic attributes of friction. Therefore, further insights on the quasi-static friction properties of SAs are presented in this study.
Shock absorber friction measurements
Specimen and instrumentation
For this study, in total six SAs were examined. They constitute two specimen as used in the front axle of a Volkswagen Scirocco III (‘Sci-1/-2’) and four specimen as used in a Volkswagen Passat B8 (‘Pas-1/-2/-3/-4’), each of the same specification.
The quasi-static friction was investigated on the hydropulser test rig of the Institute of Automobile Engineering, which is depicted in Figure 1(a). The test rig is used to determine static and dynamic properties (up to 100 Hz at 0.5 mm) of various suspension components, for example elastomer bushings or SAs. A total maximum stroke of 250 mm can be realised in vertical axis and the maximum speed is 2 m/s. A preloading in one axis perpendicular to the excitation axis (z) can be realised by a pneumatic actuator of up to 1.5 kN force, which is measured by a load cell.
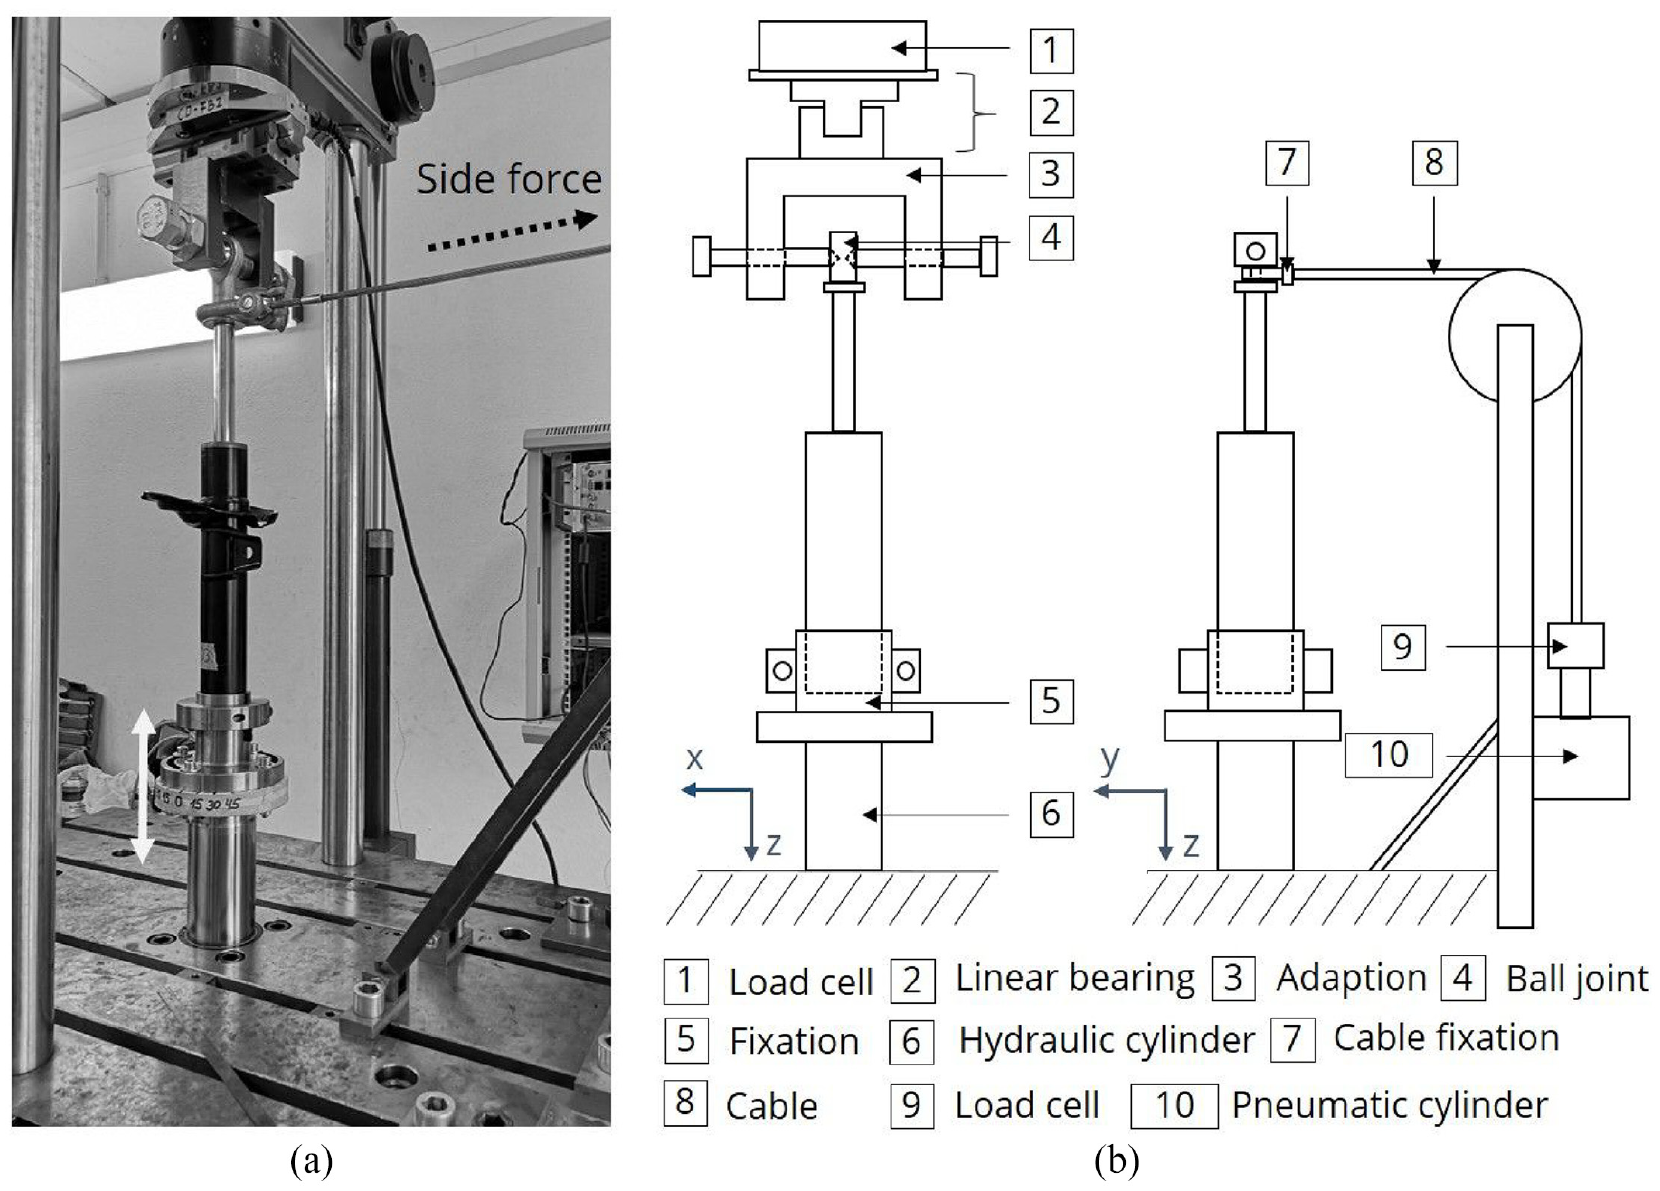
Hydropulser test rig for investigating shock absorber friction (a) and schematic overview (b).
Side forces up to 1 kN were applied in this study. To provide a simple illustration, this can be compared to a medium cornering event of approx. 3000 N tyre lateral force of the Volkswagen Scirocco. The actual relation of tyre forces and moments and the SA side force depends however strongly on the deflection state of the suspension and the spring, which is typically designed to reduce the amount of side force.5,16–19
Test layout and procedure
As evident from Figure 1, the SA was mounted in a specific manner. This set-up was developed and previously presented in the study of Deubel et al. 16 and used therein for the corresponding strut assembly. The focus was on representing the mounting and load situation of the SA accurately with regard to its implementation as a strut in a MacPherson front suspension. It was proven as most realistic to connect the SA’s bottom rigidly to the test rig, and to allow a degree of freedom in the direction of the applied force on the upper end. While the SA cylinder moves vertically during compression and decompression, the piston rod remains in a constant vertical position. Hence, the angle of side force application remains constant. The free end is realised by a linear bearing (2) in connection with a ball joint (4) in order to allow rotation while the piston rod is bent in direction of the applied side force (7, 8). The joint’s ball is centred and fixed, aiming to minimise tension perpendicular to the shock absorber (x-direction). Therefore, this test set-up is advantageous even for tests without any side force, as it allows a nearly tension-free mounting of the shock absorber in the horizontal plane. This is particularly important for accurate friction measurements or other kinds of measurements in which small forces are expected.
Measurements for both, strut assemblies and SAs, can be performed in the same manner with respect to side force application.
In the course of conducting this study, this mounting routine was refined with regard to reproducibility. For that purpose, the SAs were each mounted and demounted 15 times, and the friction was recorded for each run, as shown in Figure 2(a). For each repetition, the goal was to mount the specimen as tension-free as possible. The influence of the mounting is clearly visible, in such a form that higher friction values tend to represent a less adequate mounting, while lower values correspond to a rather tension-free mounting. From this test series, the minimum value of each SA constitutes the theoretical reference value for ongoing tests. Thus, each day after performing a specific warm-up procedure (see below) and before the real test series started, the mounting state was checked in an iterative process of mounting, friction force determination (with reduced cycle count), and comparison to the reference value. This was performed until the reference was reached within a tolerance of a few percent, and the mounting was then regarded as valid.
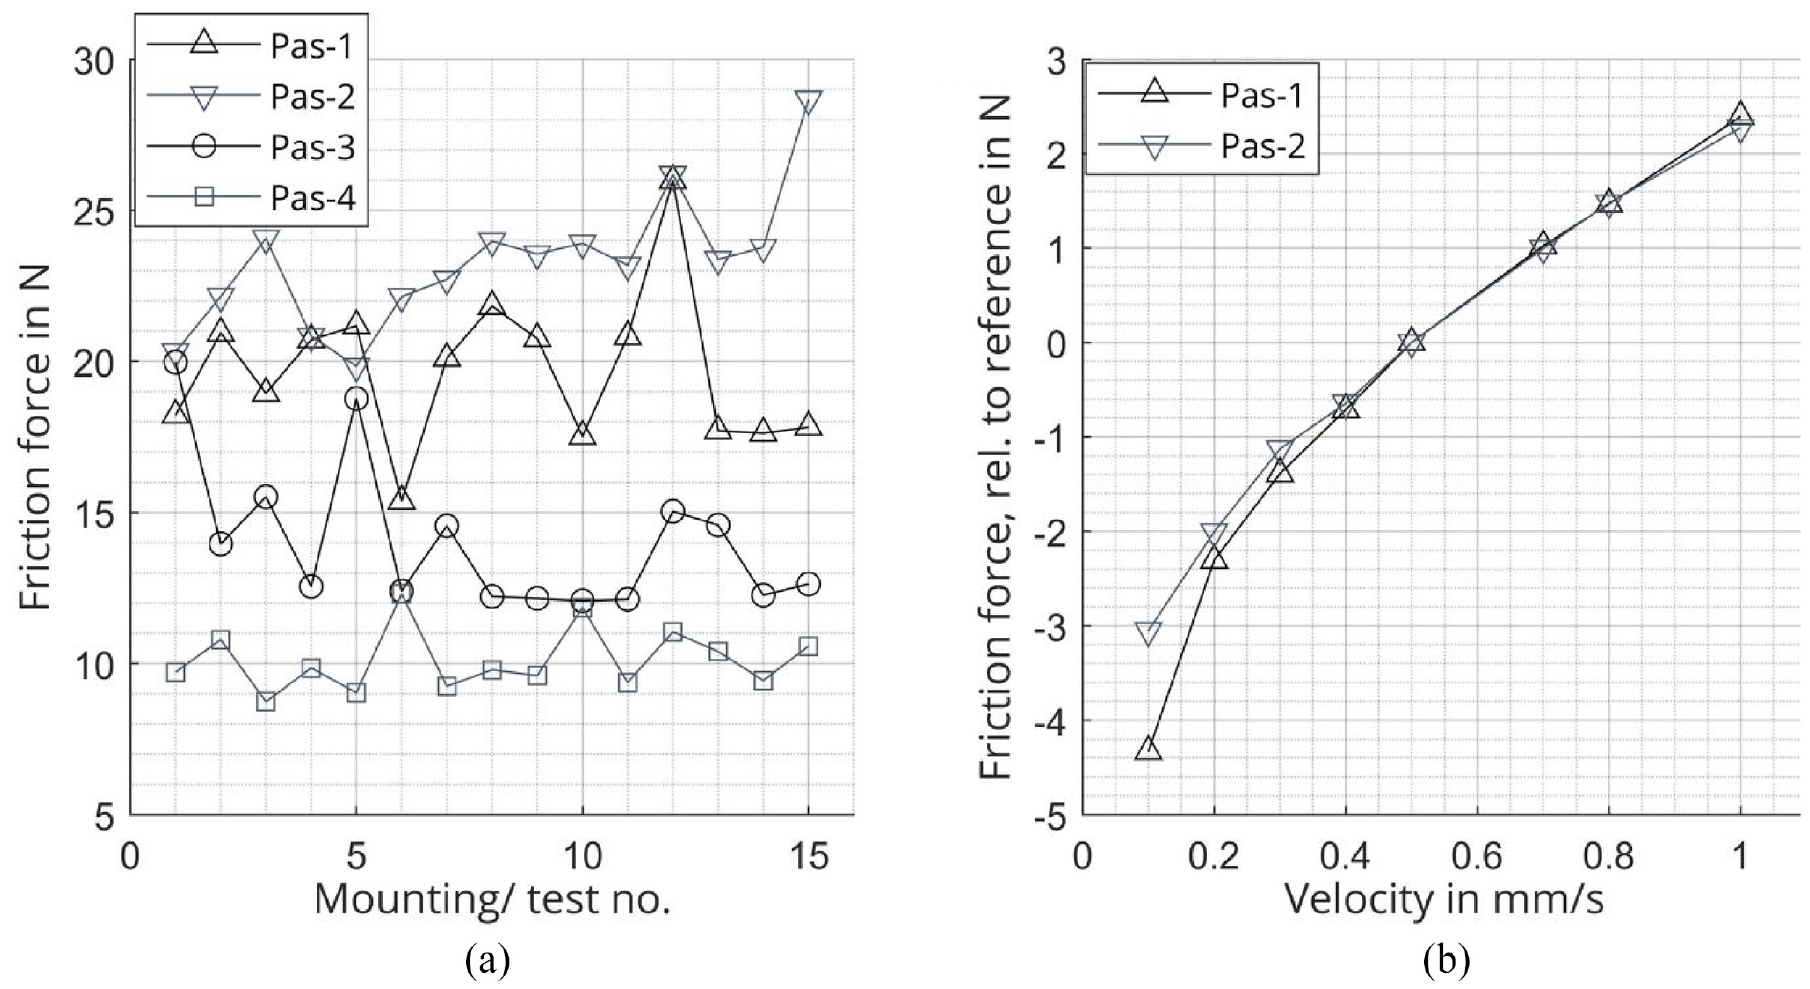
Test series regarding mounting (a) and velocity variation (b).
Regarding the test procedure, all tests, except for the amplitude variation or if stated otherwise, were performed with a low vertical amplitude (3–5 mm), for which friction might be particularly important next to damping. Excitation was performed around a certain deflection level (see below) in a triangular/ramp waveform as a standard, characterised by constant velocity; or in a sine waveform if stated explicitly. The velocity was kept in the quasi-static region (0.5 mm/s) to limit the SA’s hydraulic damping properties and to primarily measure the friction of the previously defined contacts. As tests of the Passat SAs with a low velocity variation from 0.1 to 1.0 mm/s in Figure 2(b) show, a velocity of 0.5 mm/s provides a good compromise of time consumption and the elimination of damping.
The determined friction characterises half the hysteresis height of the force-displacement relationship, determined at the passing of the design level (indicated by the zero-crossing), see also Figure 8. No differentiation was made regarding the direction of the motion (compression or decompression). The SAs were mounted at a specific deflection state, corresponding to previously determined theoretical design levels of the corresponding vehicles. For the Passat and Scirocco SAs, these were 118 and 108 mm respectively, each measured from top of the cylinder housing to the beginning of the piston rod’s screw threads.
In order to further increase test reproducibility and comparability, a certain methodology was followed. The tests regarding the investigated influences were performed block-wise on the course of a single day. A warm-up procedure consisting of 100 cycles at low frequency and amplitude higher than the standard was performed each time before the SAs were tested for the first time on a day. The appropriate mounting of the SA was checked as described above. The temperature close to the bottom of the SAs was recorded and was in a close range, varying within each test series by 2 °C–3 °C (typically) or 4 °C (maximum).
Each measurement consisted of 10 cycles, of which the friction was determined as an average value. The standard deviation (SD) of the tests presented in this study was typically below 1 N (Figure 3). Only for higher amplitudes (≥20 mm) performed, the cycle number was decreased to five. Each parameter-defined test was itself preconditioned by the same, while only the friction determined from the last repetition was used for the final analysis, aiming to represent the desired steady-state best.
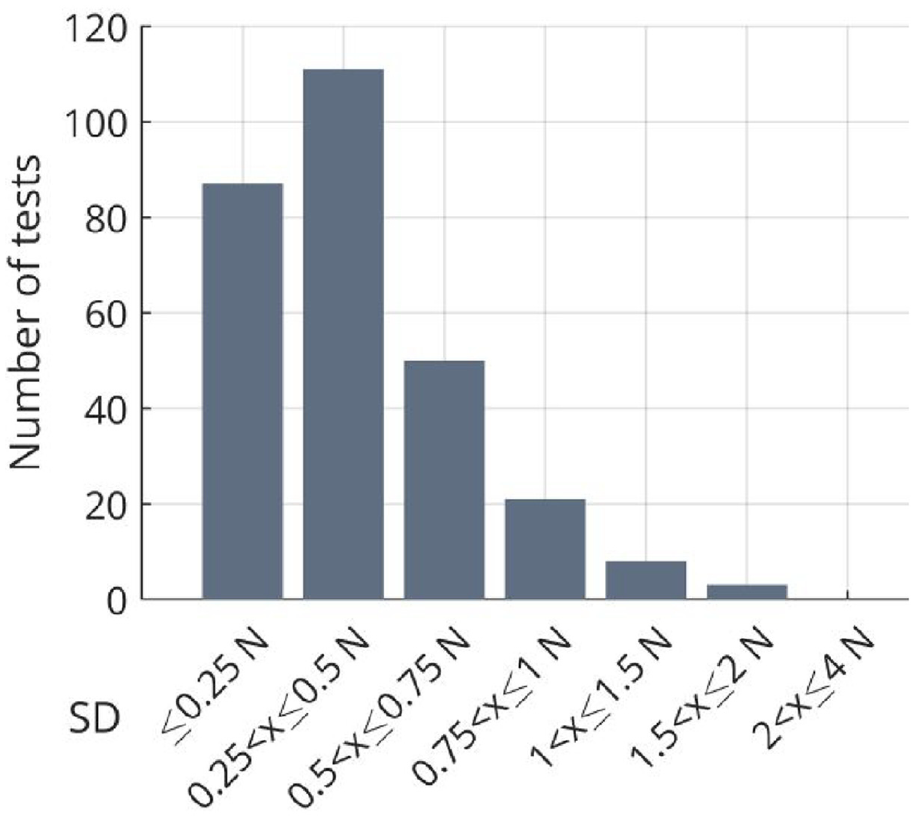
Standard deviation of the presented tests (280).
The sample rate was set to 32 Hz and the signals were low-pass filtered with a cut-off frequency 0.5 or 1.0 Hz (for the 5 or 3 mm amplitude tests respectively) before post-processing them.
Sensitivity analysis
In Figures 4 to 7 an overview of the performed parameter variations is provided. In general, there are noticeable differences of the determined friction forces among the various samples of the same SA. Since particular caution was given designing the aforementioned robust test method, the obtained differences are assumed to represent deviations of the sample’s properties originating from the manufacturing process. Differences were likewise observed for other properties, such as hydraulic damping of various SAs.
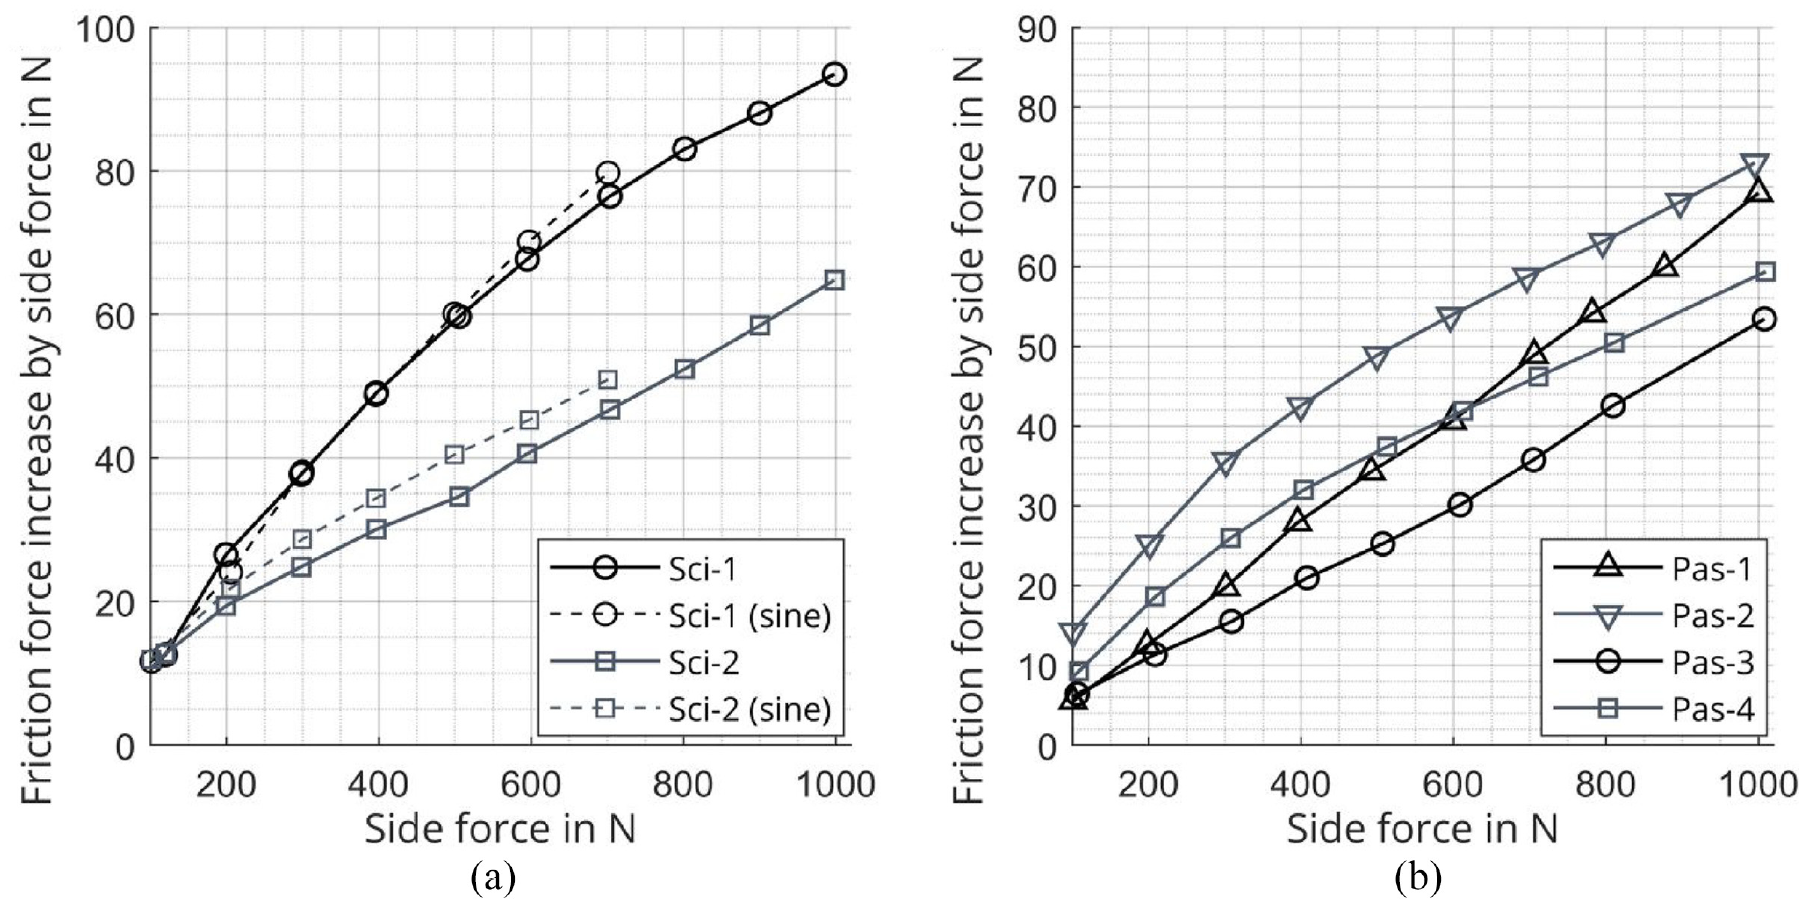
Side force variation of the VW Scirocco (a) and VW Passat (b) shock absorbers.
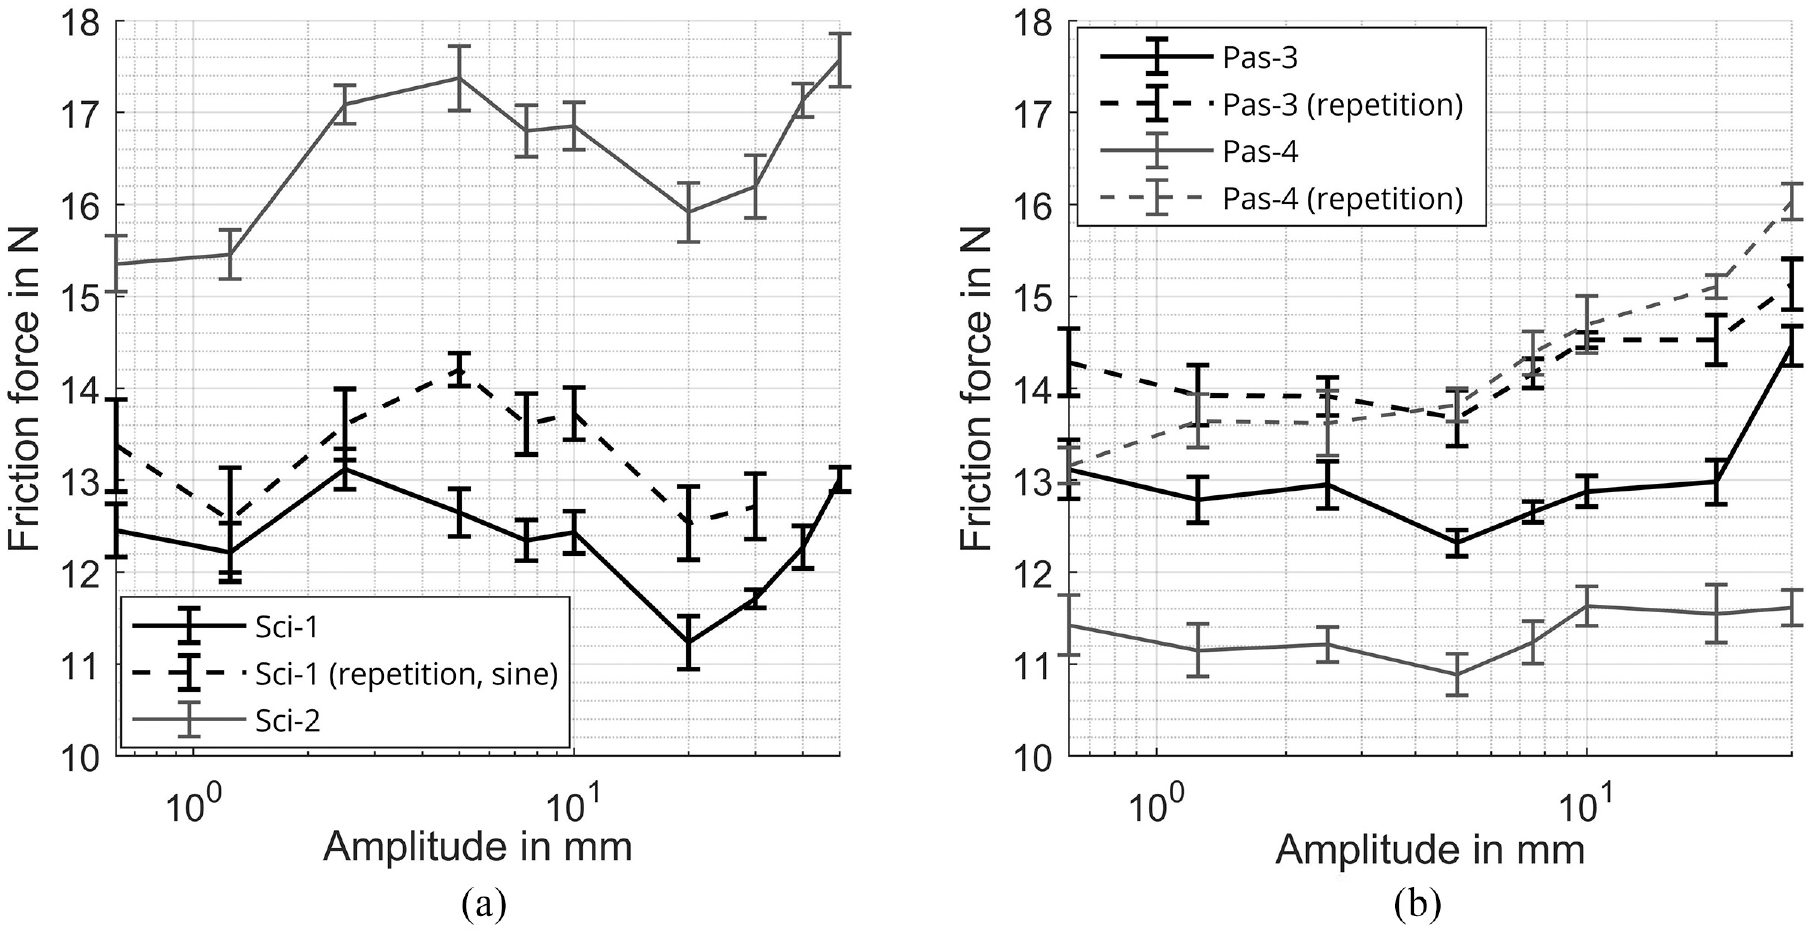
Amplitude variation of the VW Scirocco (a) and VW Passat (b) shock absorbers.
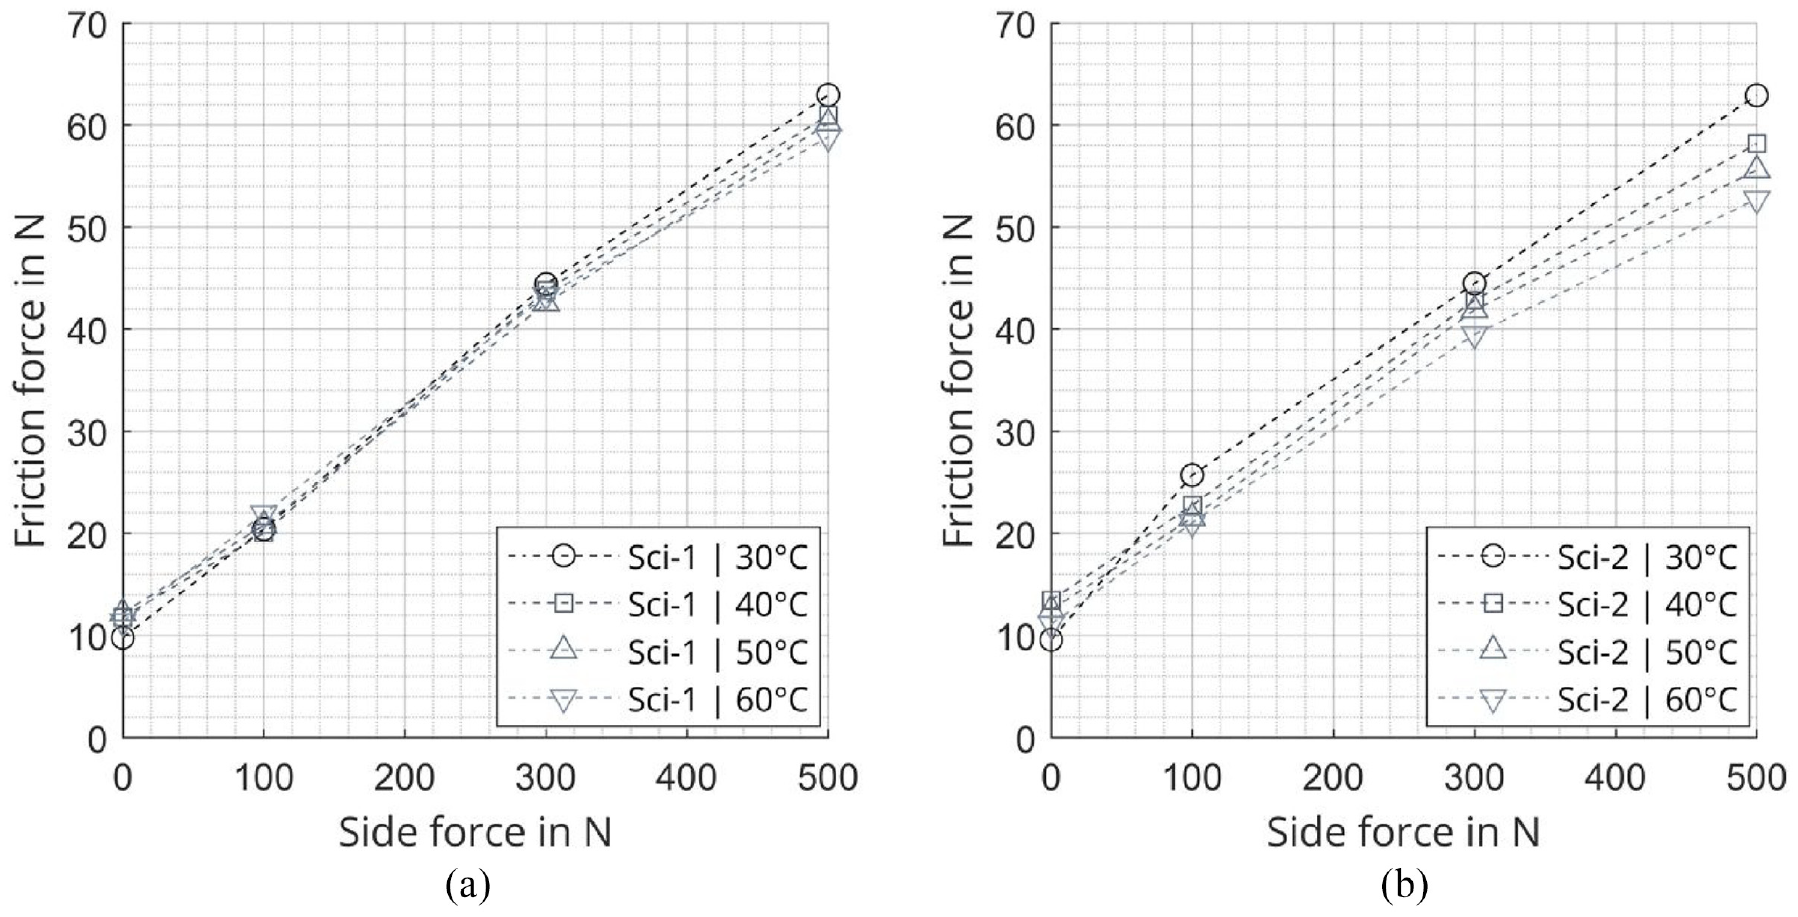
Temperature variation of the VW Scirocco shock absorbers ‘Sci-1’ (a) and ‘Sci-2’ (b).
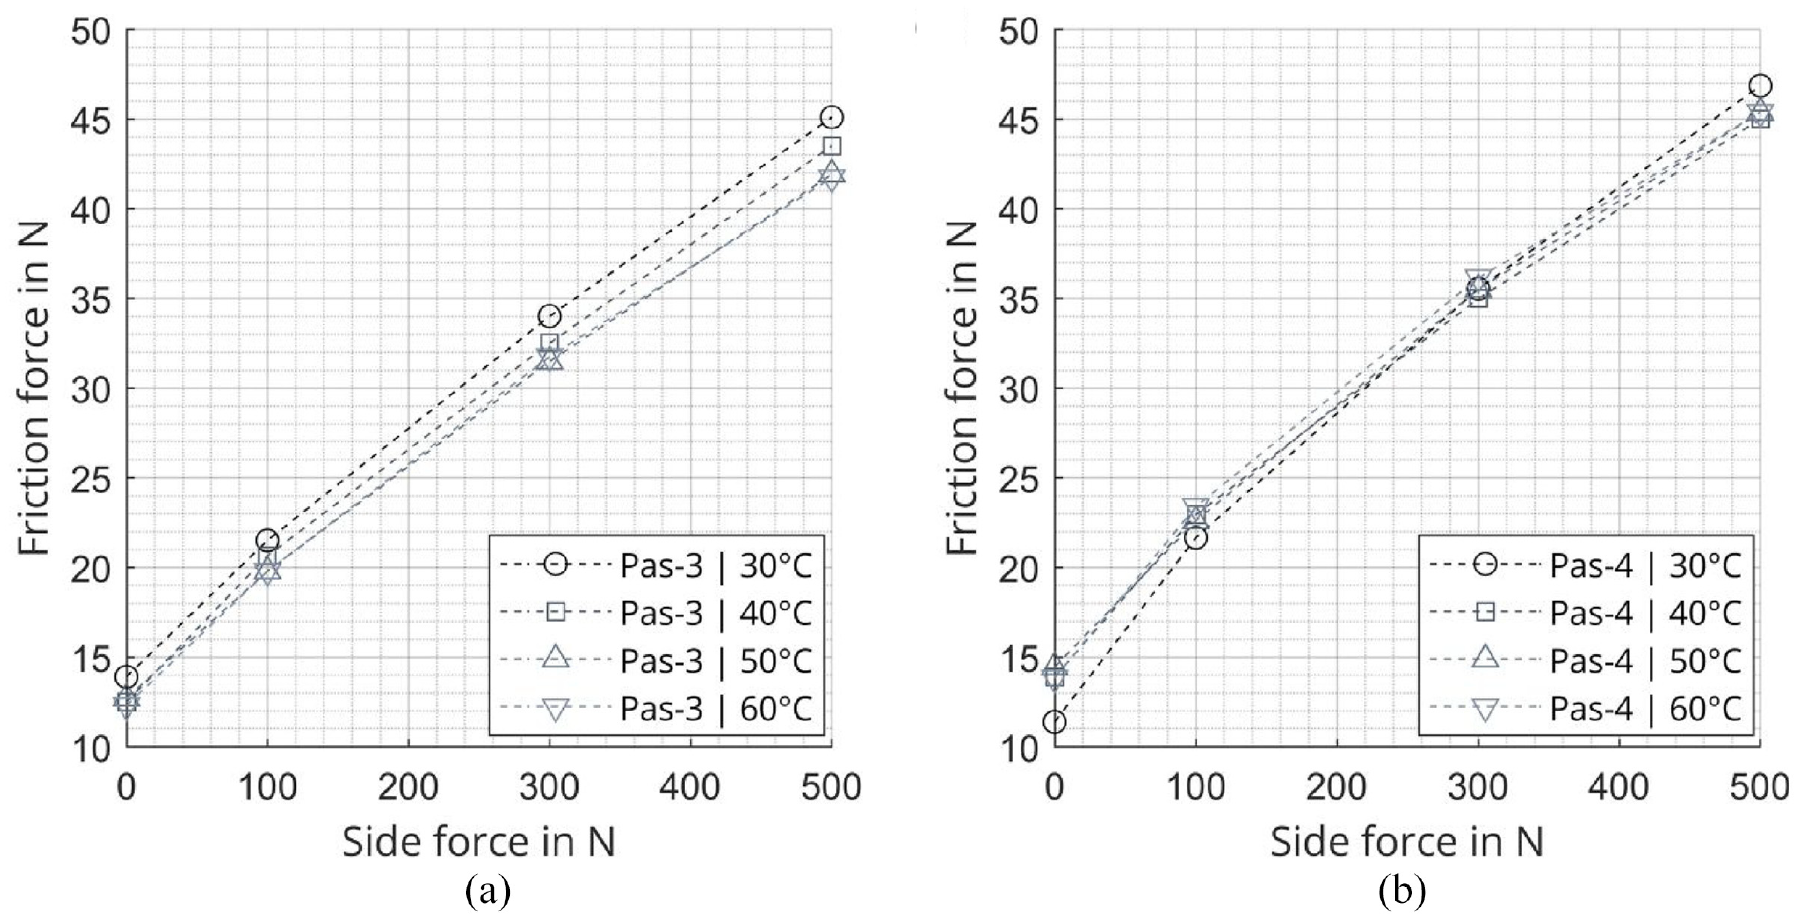
Temperature variation of the VW Passat shock absorbers ‘Pas-3’ (a) and ‘Pas-4’ (b).
Side force
From the graphs in Figure 4, clearly an approximately linear relationship of the side force and the friction force, through the intermediary of the normal contact forces at the elements piston rod/rod bearing and piston/cylinder, becomes visible. The relationship is nearly linear only for the SAs ‘Sci-2’, ‘Pas-1’ and ‘Pas-3’, while the results of the other SAs show a rather degressive increase of friction force the higher the side force. The results therefore indicate linearly decreasing friction coefficients, as stated in the study of Kölsch. 2 Following his proceeding, the coefficients were calculated using the least-squares approach for parameter estimation, which is explained in detail in the literature.20,21 The approach is to find a set of parameters in order to minimise the error between the measured friction and the calculated friction for the given test series.
For this, the calculated friction force
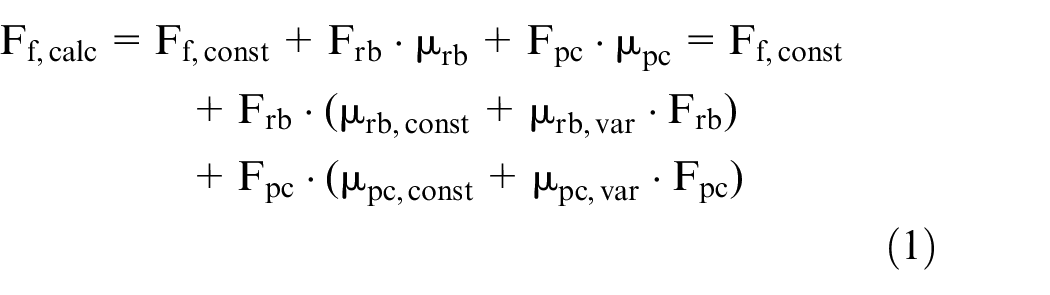
The error E made between the calculated and experimental friction force
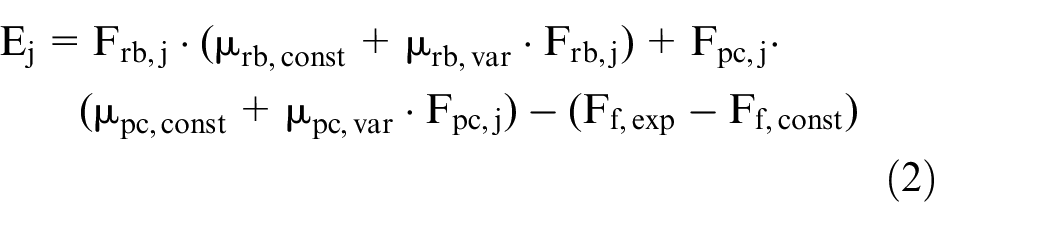
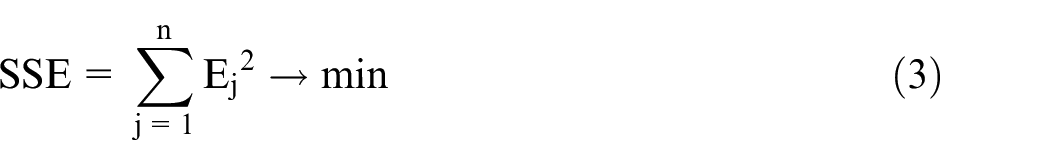
The demand for the sum of squared errors SSE to be minimised leads to a linear system of equations for the unknown parameters
For the Scirocco SAs the geometric properties are known, which makes it possible to calculate the inner forces


As a consequence of the geometric boundary conditions, the normal forces at the contact piston rod/bearing are generally much higher compared to the contact piston/cylinder. Together with the higher friction coefficient, this makes the pair piston rod/bearing potentially the main source of friction force compared to the pair piston/cylinder under side force. While the load independent friction (i.e. without side force) is very similar with approximately 10–15 N for all the shock absorbers (see also Figures 6 and 7), the data demonstrate that their increase by side force is clearly not, as indicated by the friction coefficients as well.
For the side force variation of the Scirocco, the signal form (sine/triangular) was varied as well. There is a very good accordance between the two test series regarding slope, and only a small offset for ‘Sci-2’ exists. The results show no clear dependence of the quasi-static friction on the waveform, which can be seen from the amplitude variation (Figure 5) too. The target velocity during slow sine oscillation is gradually reached, thus dynamic friction effects (e.g. friction lag) are not taking place. Since gross sliding is active, friction for hydrodynamic contacts is primarily a function of velocity, 9 which equals in both cases. Minor differences at the zero-crossing of position (and therefore in the calculated hysteresis height) may arise from larger differences of the force-displacement relationship at the reversal points.
The friction force at the reversal points was determined for the test series ‘side force/triangular’. Mean hysteresis curves of the 10 cycles were created from unfiltered signals and are depicted in Figure 8. The appearance of the hysteresis close to the reversal points changes under the influence of side force. The force peaks right after the motion reversals increase the higher the side force. Right after the reversal points and the characteristic maxima in the areas (2/4), a lower force (recess) is visible compared to the force at zero-crossing for the Scirocco SAs, while for the Passat SAs the force rather gradually decreases.
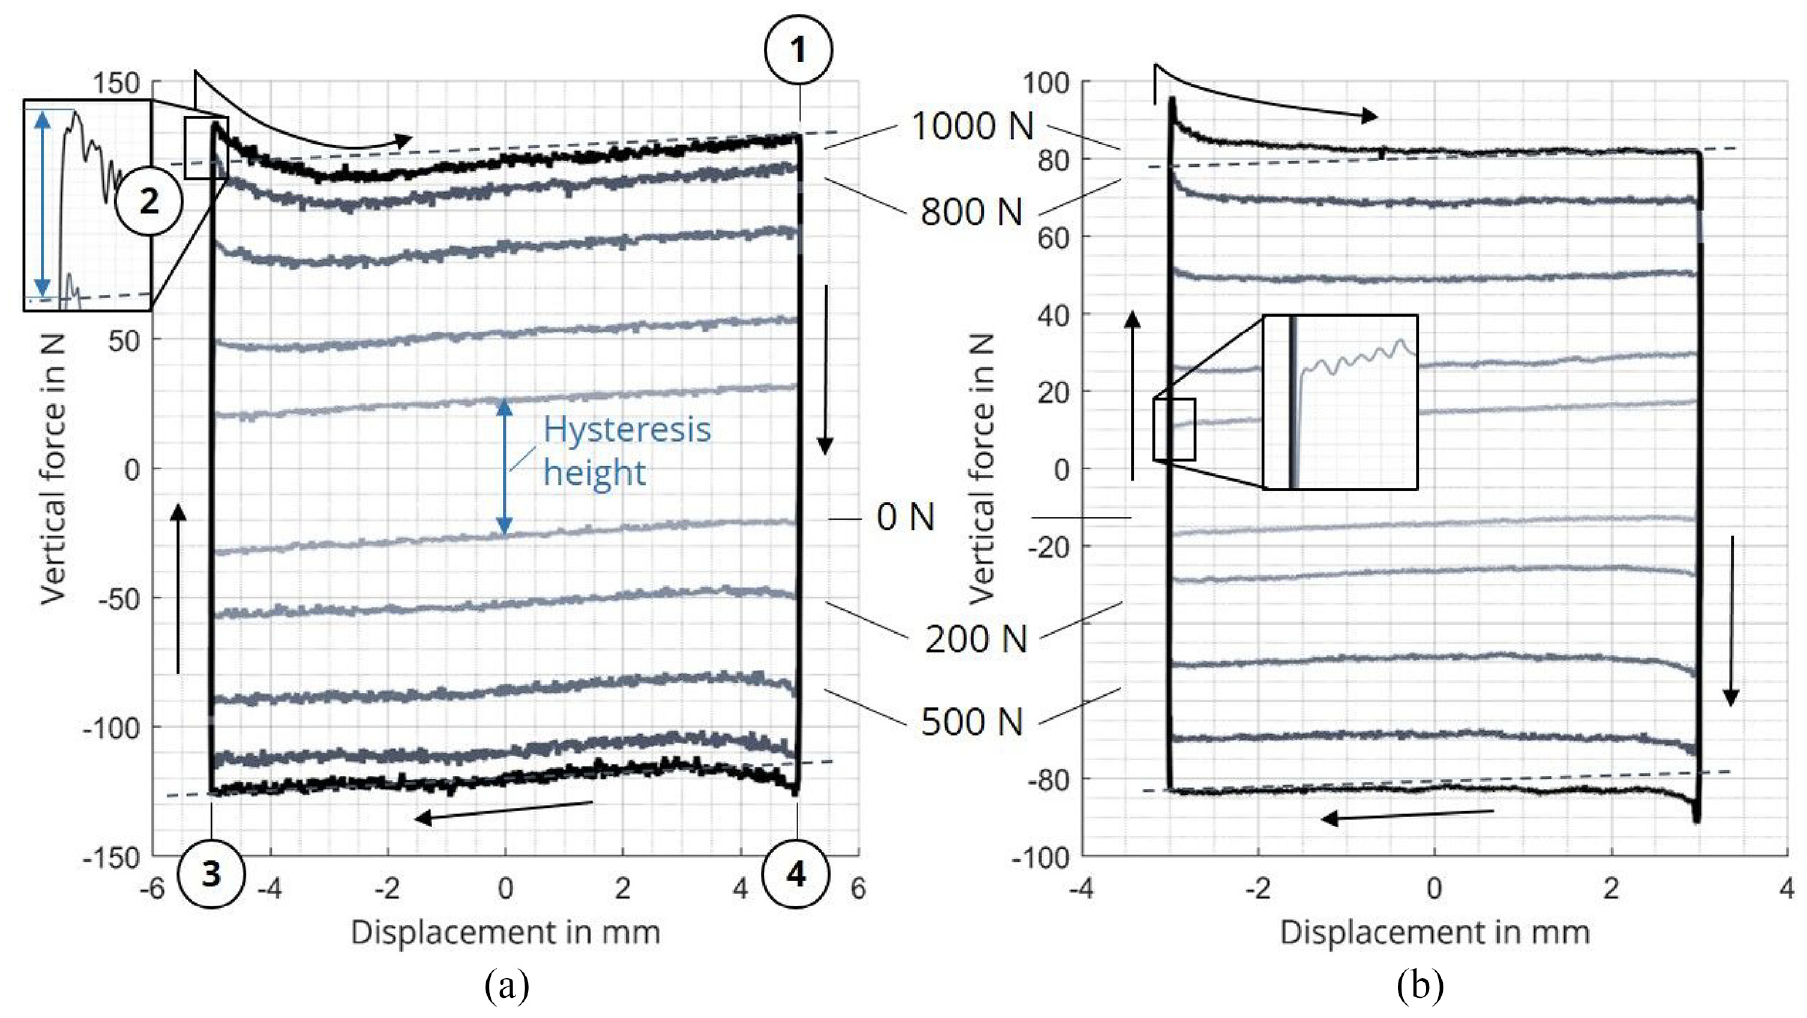
Hysteresis appearance depending on side force for the shock absorbers ‘Sci-1’ (a) and ‘Pas-1’ (b).
To illustrate this, the gas stiffness, represented by the gas force regression line, is considered and visualised (dashed). Hereto, the gas force was determined from a 20 mm test (without side force) in the range of ±5 mm around zero-crossing, in order to avoid undesired influence of the reversal points. This was performed for the compression and decompression strokes separately. Starting from the points (1/3), the regression was drawn, representing the theoretical force evolution depending on displacement because of the gas stiffness, thus neglecting the effects of friction. With that aid, the after-maximum force drop below the quasi-static friction level becomes apparent for the Scirocco SAs.
To calculate the reversal point force, the respective peak force values in the areas (2/4) of Figure 8 were determined first. However, due to the inclination of the hysteresis, they needed to be corrected. The theoretical force at the reversal points (2/4), taking into account the inclination, was provided by the before-mentioned gas force regression. The difference between the peak value and the corresponding value on the regression line at the same displacement (see detail at area 2) was added to the obtained peak forces, thus considering the hysteresis inclination. Analogously to the quasi-static friction, the mean value of each set of the two reversal point forces was used and no differentiation regarding the direction of motion was made.
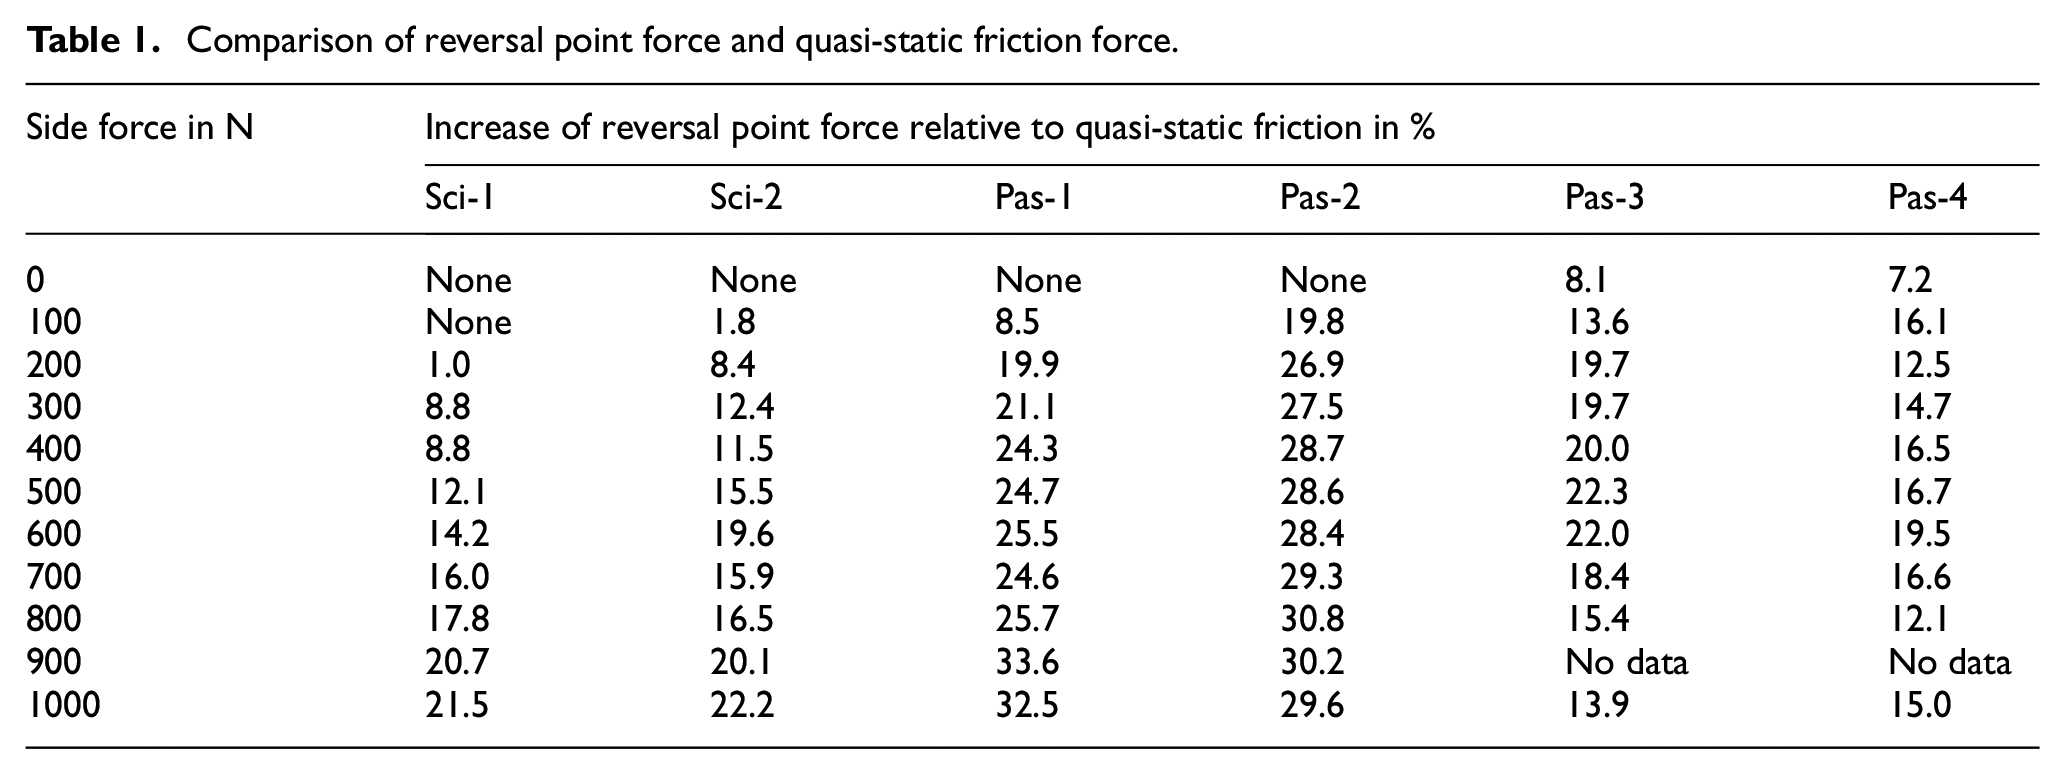
The calculated values are listed in Table 1. Contrarily to the determination of the quasi-static friction, the available repetitions of each parameter-varied test were used (meaning also including the first or preconditioning run). For example, if two tests at one side force level were performed, the ratio of the reversal point force to the quasi-static friction force was firstly determined individually, and averaged afterwards, thus becoming more representative of the respective side force level. The forces or ratios calculated by this method showed less stability than calculating the quasi-static friction.
Comparison of reversal point force and quasi-static friction force.
One potential reason is the rather transient character of the hysteresis in the motion reversals compared to the more steady-state character at zero-crossing. Secondly, the temperature during the tests was not perfectly identical, as stated before, which could potentially affect the gas stiffness. However, from the hysteresis inclination obtained from the temperature variation series, the data shows only a minor change in gas stiffness over the course of 30°C temperature spread. With respect to the temperature deviation within the side force variation series (<3°C) the gas stiffness is effectively constant.
The excess of friction force tends to increase with side force, as shown in the study of Kruse and Zimmermann. 4 The excess of the specimens ‘Pas-1’ and ‘Pas-2’ is especially high. The relative increase predominantly takes place starting from zero side force to 500 N side force and is clearly not linear, while afterwards the increase rather saturates. On the other side, for smaller side forces, the force can be even lower than the quasi-static friction, which can be observed exemplarily for ‘Pas-1’ by the rather rounded than spiky edges of the hysteresis. See also the details of Figure 8(b).
In overall perspective, the results provide a good overview on the potential break-away force needed to overcome stiction (by means of the calculated reversal point force), which exceeds the quasi-static (sliding) friction force by approximately 10%–30% at considerable side forces. This range therefore matches the estimation of 20% provided by Kölsch. 2
The hysteresis appearance for the series ‘side force/sine’ was significantly less affected by side force, and overshoots in the reversals appeared slightly at side forces of 500 N or higher. Due to increased noise in the reversals, a calculation was regarded as not useful.
Amplitude
The amplitude dependence visualised in Figure 5 was performed from 0.625 to 50 mm. For the Scirocco SAs, in the area of moderate amplitude (2.5–10 mm) a relatively constant friction force is obtained. Both for smaller and higher amplitudes, the friction drops followed by an increase in the region of very high amplitudes. Regarding the Passat SAs, the results suggest slightly higher friction levels for smaller and especially for higher amplitudes compared to the standard (3 mm). Interestingly, the characteristic curve form applies similarly for the two SAs and two repetitions. This is the case also within the Scirocco SAs, confirming a good reproducibility of the tests.
Regarding the low amplitude region, Kato and Sasaki 13 investigated friction in a simplified tribotester scenario on materials typically as used in SAs for 2 and 0.1 mm amplitude. They stated a strong influence of the oil composition on the friction properties. For decreasing amplitudes, they found both decreasing and increasing friction levels, as well as rather constant levels.
Furthermore, the standard deviation of the tests should be considered (see bars in Figure 5), as well as the absolute scale in which the friction force changes (less than 3 N).
Therefore, regarding the region of moderate amplitudes up to 10 mm, constant sliding friction can be defined as a good approximation. This region is of high interest regarding friction, as for higher amplitudes, the velocity and therefore hydraulic damping gain more and more relevance.
From an overall perspective, it becomes evident that the amplitude, particularly in direct comparison to the side force effect, constitutes a minor influence.
This conclusion is provided for the SAs tested herein, but testing other SA types could lead to different results regarding amplitude variation; thus further study is encouraged.
Temperature
In order to investigate the effect of varying temperatures on the quasi-static friction, an insulated heat chamber (Figure 9) was used. By applying a simple controller set-up, the temperature in the chamber was controlled to a certain target value (30°C/40°C/50°C/60°C) within a range of ±1°C. The temperature in the chamber was measured by a sensor located at the SA’s lower cylinder part. After reaching the target temperature, the same was held for 30 min in order to allow a homogeneous temperature distribution in the chamber and the specimen’s temperature adjustment to the chamber temperature. The test series started afterwards.
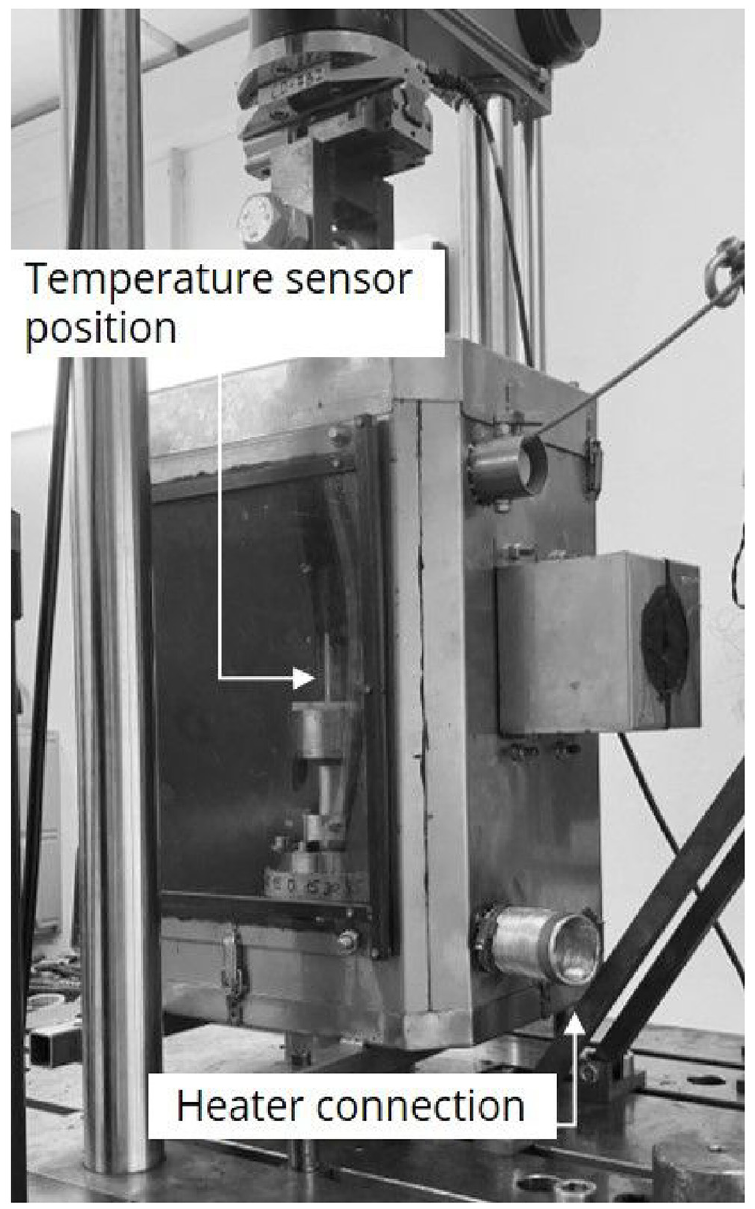
Heat chamber.
As Figures 6 and 7 illustrate, the effect of the side force is weakened by increasing the temperature, even if not evenly for all specimens and all the temperature levels tested. Without side force, there is no clear trend to be seen, and the friction values spread within a range of approximately 3 N.
Table 2 provides the regression parameters (slopes) of the friction by side force depending on temperature (neglecting the friction value at zero side force). For the Scirocco SAs the effect of side force steadily decreases, while the Passat SAs reach a plateau at 40 °C or 50 °C, respectively. On this temperature effect, no studies are available in the context of SAs, while some studies investigated lubricated steel contacts, indicating both increasing or decreasing friction coefficients with increasing temperature.22–25 Thus, no definite explanation can be provided, as long as precise information on the materials, oil specification and especially the state and properties of the sliding regime are unknown.
Impact of side force depending on temperature.
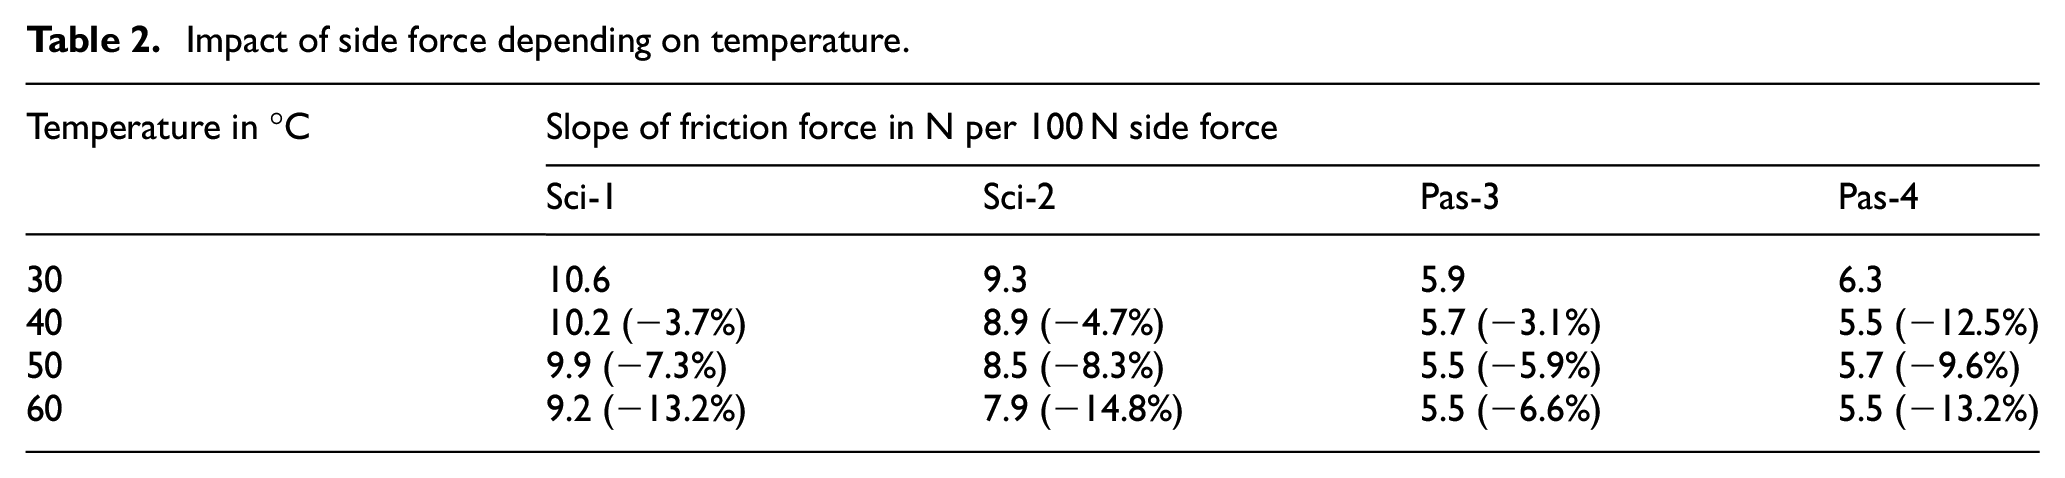
Summarising, the temperature should be considered as affecting the strength of the side force. However, the deviation caused is rather moderate with regard to the increase of friction force caused by the side force itself.
Conclusion
This research paper presents a sensitivity study on the quasi-static friction of six MacPherson shock absorbers, examined in sliding conditions at low velocity (0.5 mm/s). A specific test layout is used to represent the load and mounting situation realistically. This allows determining the actual friction state because of the present side load on the shock absorber’s top mount, which is characteristic for this kind of suspension. The test procedure, consisting of a specific mounting routine, warm-up and multiple repetitions plus test cycles per varied parameter, shows to provide sufficient boundary conditions in order to investigate steady-state (stationary) sliding friction on the hydropulser test rig.
The study shows a major impact of the side force, as it directly affects the contact forces at the friction elements piston rod/bearing and piston/inner cylinder. The friction increase can be regarded as linear in approximation but is actually slightly degressive for three of the six shock absorbers in the tested side force range. An increase of the specimen temperature shows to weaken the side force effect, while with regard to the side force itself, the effect is rather limited.
As a secondary focus, the force at the reversal points is investigated, and the present friction exceeds the quasi-static sliding friction if a side force is applied. For all specimens, the force overshoot increases strongly with increasing side force. This effect is only significantly visible for a triangular excitation mode, but not for the sine waveform. However, if static friction is the primary focus, it is recommended to use specific test set-ups that include a definite motion out of a resting position with a clearly defined resting time, instead of investigating the reversal points of the reciprocating motion.
Regarding the amplitude variation, no relevant effect in direct comparison to the much higher impact of side force is observed. A recommendation is thus provided to regard the shock absorber sliding friction at low velocity as independent of amplitude for the purpose of simplification. The sliding friction is also shown to be independent of the waveform (triangular or sine) and is thus of secondary importance for this kind of investigation.
The findings of this study aid in linking the side force at the shock absorber’s top mount (e.g. determined from a simulation) with the actual friction state, which is the focus of future research. Thus, the actual shock absorber friction can be determined for various driving manoeuvres, for example, during cornering or braking. This driving event-specific variable character should be implemented into a vehicle simulation in order to study the friction effect on ride comfort and vehicle safety depending on the scenario from a more realistic perspective. Finally, based on this broader view, the shock absorber design process with regard to friction properties can be enhanced as needed.
Enlarging the presented results, the friction properties at higher velocities, focusing on the interrelation of the side load and friction, will be investigated in the frame of future studies.
Footnotes
Appendix
Declaration of conflicting interests
The author(s) declared no potential conflicts of interest with respect to the research, authorship, and/or publication of this article.
Funding
The author(s) received no financial support for the research, authorship, and/or publication of this article.