
Abstract
Friction in vehicle suspensions is an important property for modeling vertical dynamics. Conventionally, suspension friction is modeled with a simple Dahl friction model in full vehicle simulation models. However, this approach appears to be insufficient for investigations involving degraded shock absorbers or semi-active damping systems. At high shock absorber excitation velocities, the suspension friction is overshadowed by the fluid force of the shock absorbers. When investigating the effect of degraded shock absorbers due to oil and gas loss on the driving dynamics of passenger cars, the correct representation of suspension friction is particularly important, since the masking effect of the hydraulic force is absent for these conditions. This work therefore presents a phenomenological mathematical model of suspension friction, which takes into account the dependencies of suspension friction on the deflection velocity of the vehicle shock absorbers, the oil level of the vehicle shock absorbers and the horizontal forces on the wheel carriers. To parameterize the model, measurements of a MacPherson axle and a fixed beam axle as well as of various vehicle shock absorbers are analyzed. To validate the model approach, a test vehicle with identical axles is used to perform single obstacle crossings at 8 km/h and sinusoidal steering at 50 km/h for the intact vehicle and for oil-empty front axle shock absorbers and oil-empty rear axle shock absorbers. The driving tests are simulated using a mathematical, characteristic curve-based five-mass full vehicle model. The simulation results show that the presented friction model is necessary to obtain a high level of accordance between the simulation and experimental investigation of driving maneuvers with degraded shock absorbers. If the suspension friction for the vehicle with oil-empty rear axle shock absorbers is modeled using a Dahl friction model considering only nominal conditions, that is neglecting the aforementioned impacts on the amount of friction, a root-mean-square error that is 65 times higher is calculated.
Introduction
Suspension friction is an important chassis property that influences ride comfort and driving dynamics. 1 It has a dominant effect on the vertical characteristics of vehicle suspension, particularly under low hydraulic shock absorber forces, which may occur due to low deflection velocity or semi-active damping systems. If a vehicle shock absorber loses oil, the masking fluid friction force of the shock absorber is reduced to zero. 2 An oil-empty shock absorber therefore no longer causes a fluid friction force, which conceals the characteristics of the shock absorber friction.
Degraded shock absorbers affect the safety-critical driving dynamics of passenger cars. 3 Degraded shock absorbers extend the braking distance of vehicles and reduce the maximum transmittable lateral forces of vehicle axles.4–6 The most common degradation mechanism of vehicle shock absorbers is the loss of oil and gas due to leaks in the seals between the piston rod and the shock absorber housing. 7 Oil and gas loss from vehicle shock absorbers is related to the mileage and age of passenger cars. 8 The average age of cars has been rising continuously for years. In Germany, the average age of registered passenger cars rose linearly from 3 years in 1960 to over 10 years in 2024. 9 This indicates an increasing relevance of degraded vehicle components in terms of road safety.
In order to reduce the negative effect of degraded shock absorbers in the vehicle field, mandatory suspension damping inspections may be introduced, in order to detect vehicles with degraded suspension damping as part of the periodic technical inspection. Studies show that the introduction of periodic technical inspections relate with a positive effect on road safety in various countries.10–12 Shock absorber inspection methods are usually based on expensive test rigs.13–16 Low cost inspection methods on the basis of bump crossing at low speed are therefore in development and have the potential to detect degraded suspension damping with high specificity and sensitivity.17,18 Full vehicle simulations are utilized to develop these methods. Full vehicle models can also be used to investigate the effect of degraded suspension damping on safety-critical vehicle dynamics, which allows estimations of the effect of a mandatory suspension damping inspection on road safety.
High-quality suspension friction models are therefore required to correctly represent the full vehicle characteristics with degraded suspension damping. If the vehicle shock absorbers do not contain oil, the suspension friction is the dominant characteristic of the energy dissipation for relative movement between the wheel and the body and in the scope of full vehicle simulation is usually modeled with a Dahl friction element.19,20 Angrick investigated the suspension friction of a multi-link axle and characterizes a linear dependency for suspension friction increasing with (excitation) amplitude. 21 Deubel identifies a strong dependency between applied horizontal forces and suspension friction on the basis of experiments with a MacPherson axle. 22 In his subsequent research, he investigated shock absorber friction under the influence of lateral forces including the dependency with the shock absorber oil level. 23 He found that the friction force of a shock absorber increases with increasing lateral force and decreasing oil level. Furthermore, he observed a dependency between shock absorber friction and deflection velocity. 24
The aim for this work is to develop a phenomenological, mathematical suspension friction model that is applicable to full vehicle simulations for investigating the effect of degraded shock absorbers on passenger car driving dynamics and for developing new methods of suspension damping inspection. A phenomenological suspension friction model is derived from the test rig measurements of vehicle axles and shock absorbers. This paper presents experiments on friction forces of a fixed beam axle under the influence of horizontal forces, which has not been reported in the literature before. The model is then integrated into a mathematical, characteristic-based five-mass full vehicle model. The suspension friction model phenomenologically takes the shock absorber deflection velocities, the horizontal suspension forces and the oil level of the shock absorbers into account. Test drives of slow bump crossings and sinusoidal steering at 50 km/h are conducted with a test vehicle with intact and oil-empty shock absorbers on both the front and rear axles. The driving tests are utilized for validation of the full vehicle model. Varying model approaches are compared with each other.
Materials and methods
Driving maneuvers for validation of the full vehicle model are slow speed bump crossings at approximately 8 km/h and sinusoidal steering at 50 km/h. The maneuvers are conducted with the Volkswagen Passat B8 presented at the test environment for slow speed bump crossings in Figure 1. Driving tests were conducted with intact vehicle shock absorbers, two oil-empty front axle shock absorbers and two oil-empty rear axle shock absorbers.
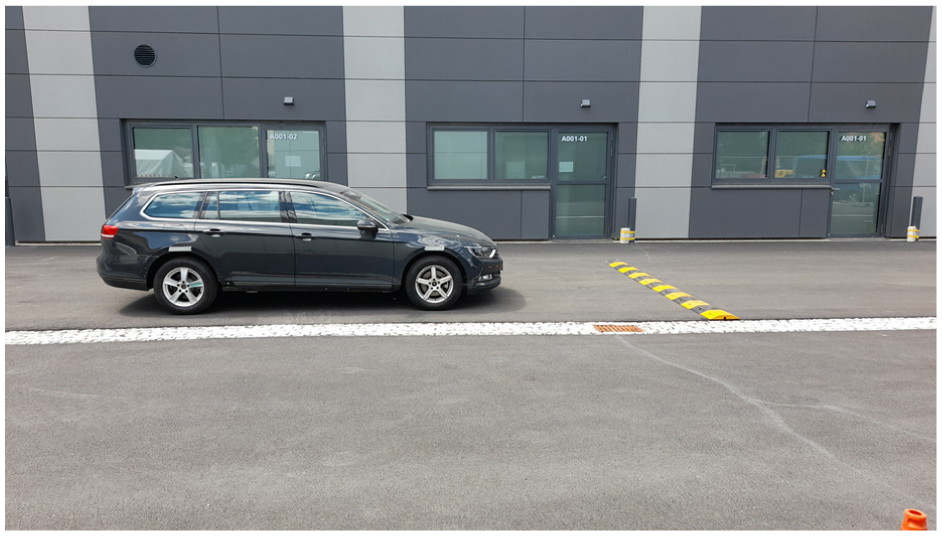
Test vehicle crossing a speed bump at low speed.
Four main factors influencing suspension friction were identified in the literature, which were initially investigated using test rig measurements. These factors are horizontal suspension forces, deflection of the axle, deflection velocity of the shock absorbers and oil level of the shock absorbers.
The effect of horizontal suspension forces on the vertical suspension friction of MacPherson axles was investigated and described by Deubel. 22 His measurements were conducted with a front axle identical to the one of the test vehicle used in this paper. Deubel’s measurement results are utilized for the parameterization of the suspension model.
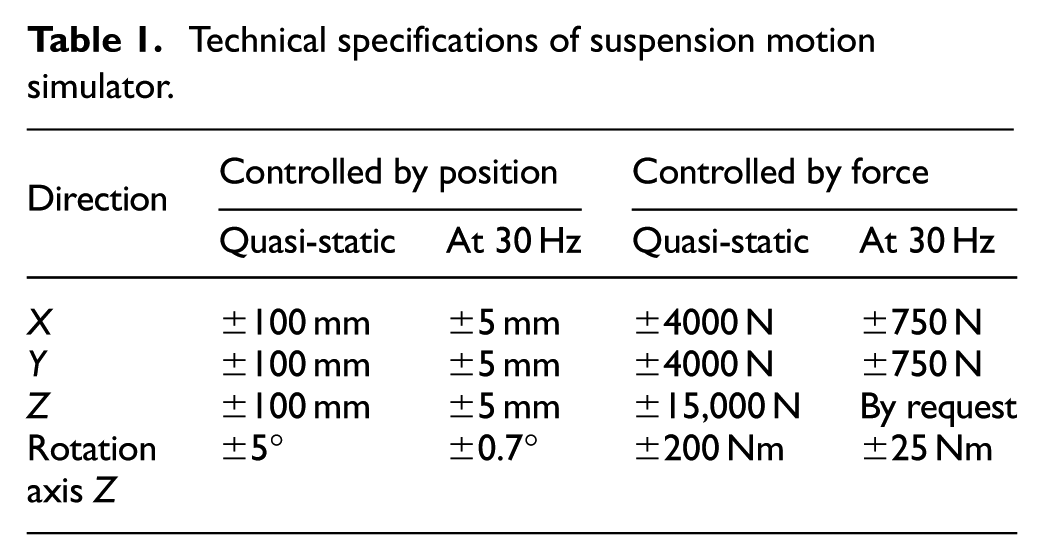
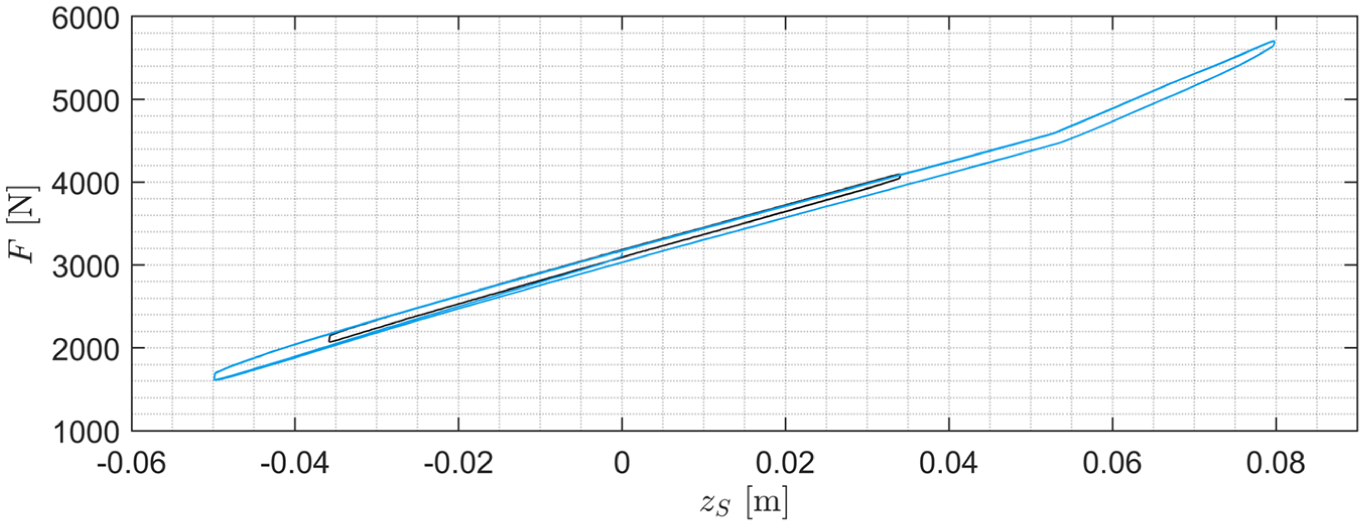
Parameterization of the rear axle is accomplished through measurements on the Suspension Motion Simulator with a vehicle similar to the vehicle used for driving tests in this paper by means of mass and mass distribution and identical by means of the rear axle design. The measurements were conducted in accordance with Deubel’s investigations. 22 The vehicle body was rigidly connected to the test rig for measurements, during which the wheel carriers are directly excited through a wheel replacement system that forms a rigid connection to the actuated platforms of the test rig as illustrated in Figure 2. Friction measurements of the axle were carried out in the vertical direction with an amplitude of 5 mm and a constant velocity of 1 mm/s while simultaneously applying quasi-static horizontal forces in the x and y directions. Table 1 summarizes the relevant properties of the test rig.
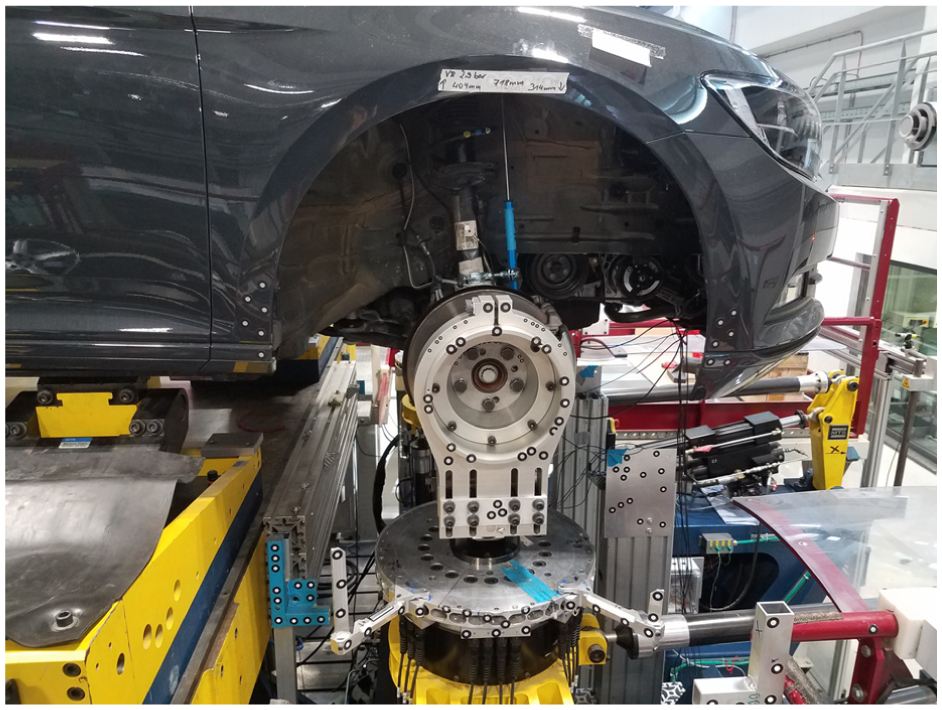
Suspension motion simulator with test vehicle and wheel replacement system.
Technical specifications of suspension motion simulator.
To investigate the shock absorber characteristics, test rig measurements were conducted on a 1-axis hydropulser. Figure 3 shows the test rig with one of the test vehicle’s rear axle shock absorbers. It is capable of generating excitations up to a maximum frequency of 100 Hz. The maximum force of the test rig is 50 kN and it has a 250 mm vertical range of motion. All vehicle shock absorbers used in the road test were measured on the 1-axis hydropulser. For the purpose of clarity, only results of one shock absorber per axle at one condition are presented in this study.
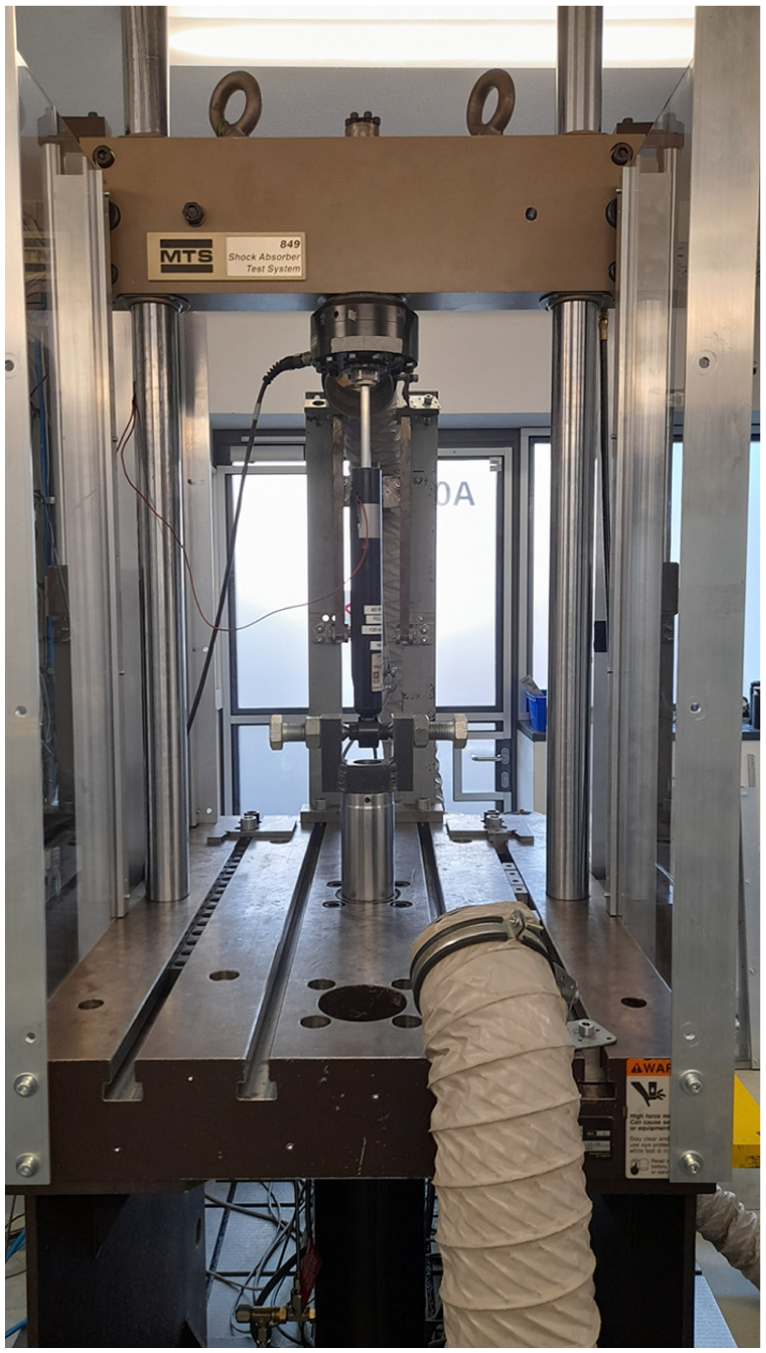
1-axis hydropulser with rear axle shock absorber.
Force-velocity characteristics of all shock absorbers were recorded through a test procedure with various excitation frequencies and friction measurements were carried out by applying a ramp signal at 1 mm/s velocity. The shock absorbers were preconditioned for the friction measurements and attention was paid to ensuring a side force-free measurement setup. The measurement procedure is based on the investigations by Deubel. 24
Test rig measurements
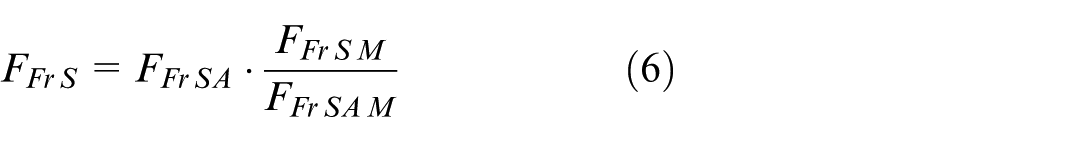
This section presents the measurement results for parameterization of the suspension friction model. Deubel previously conducted the necessary measurements for the front axle and described his measuring procedure in detail. 19 He applies a slow linear vertical motion to the wheels at various horizontal loads with a speed of 1 mm/s and an amplitude of 5 mm, so that the motion excitation follows a ramp profile. Half of the measured hysteresis width of force over vertical travel at 0 mm deflection corresponds to the suspension friction. The front axles average friction force with no horizontal force was measured at 60 N. The procedure is applied to the rear axle in the frame of this paper with the result of an average friction force of 43 N for the rear axle when no horizontal loads are applied. Measured results of front and rear axle under longitudinal and lateral force are illustrated in Figure 4, where the ordinates represent a scaling factor of the measured friction force, that is defined to be 1 when no horizontal forces are applied. It appears that suspension friction at the front axle is affected by both longitudinal and lateral forces, whereas friction at the rear axle is affected by lateral force and shows no significant dependency with longitudinal force.
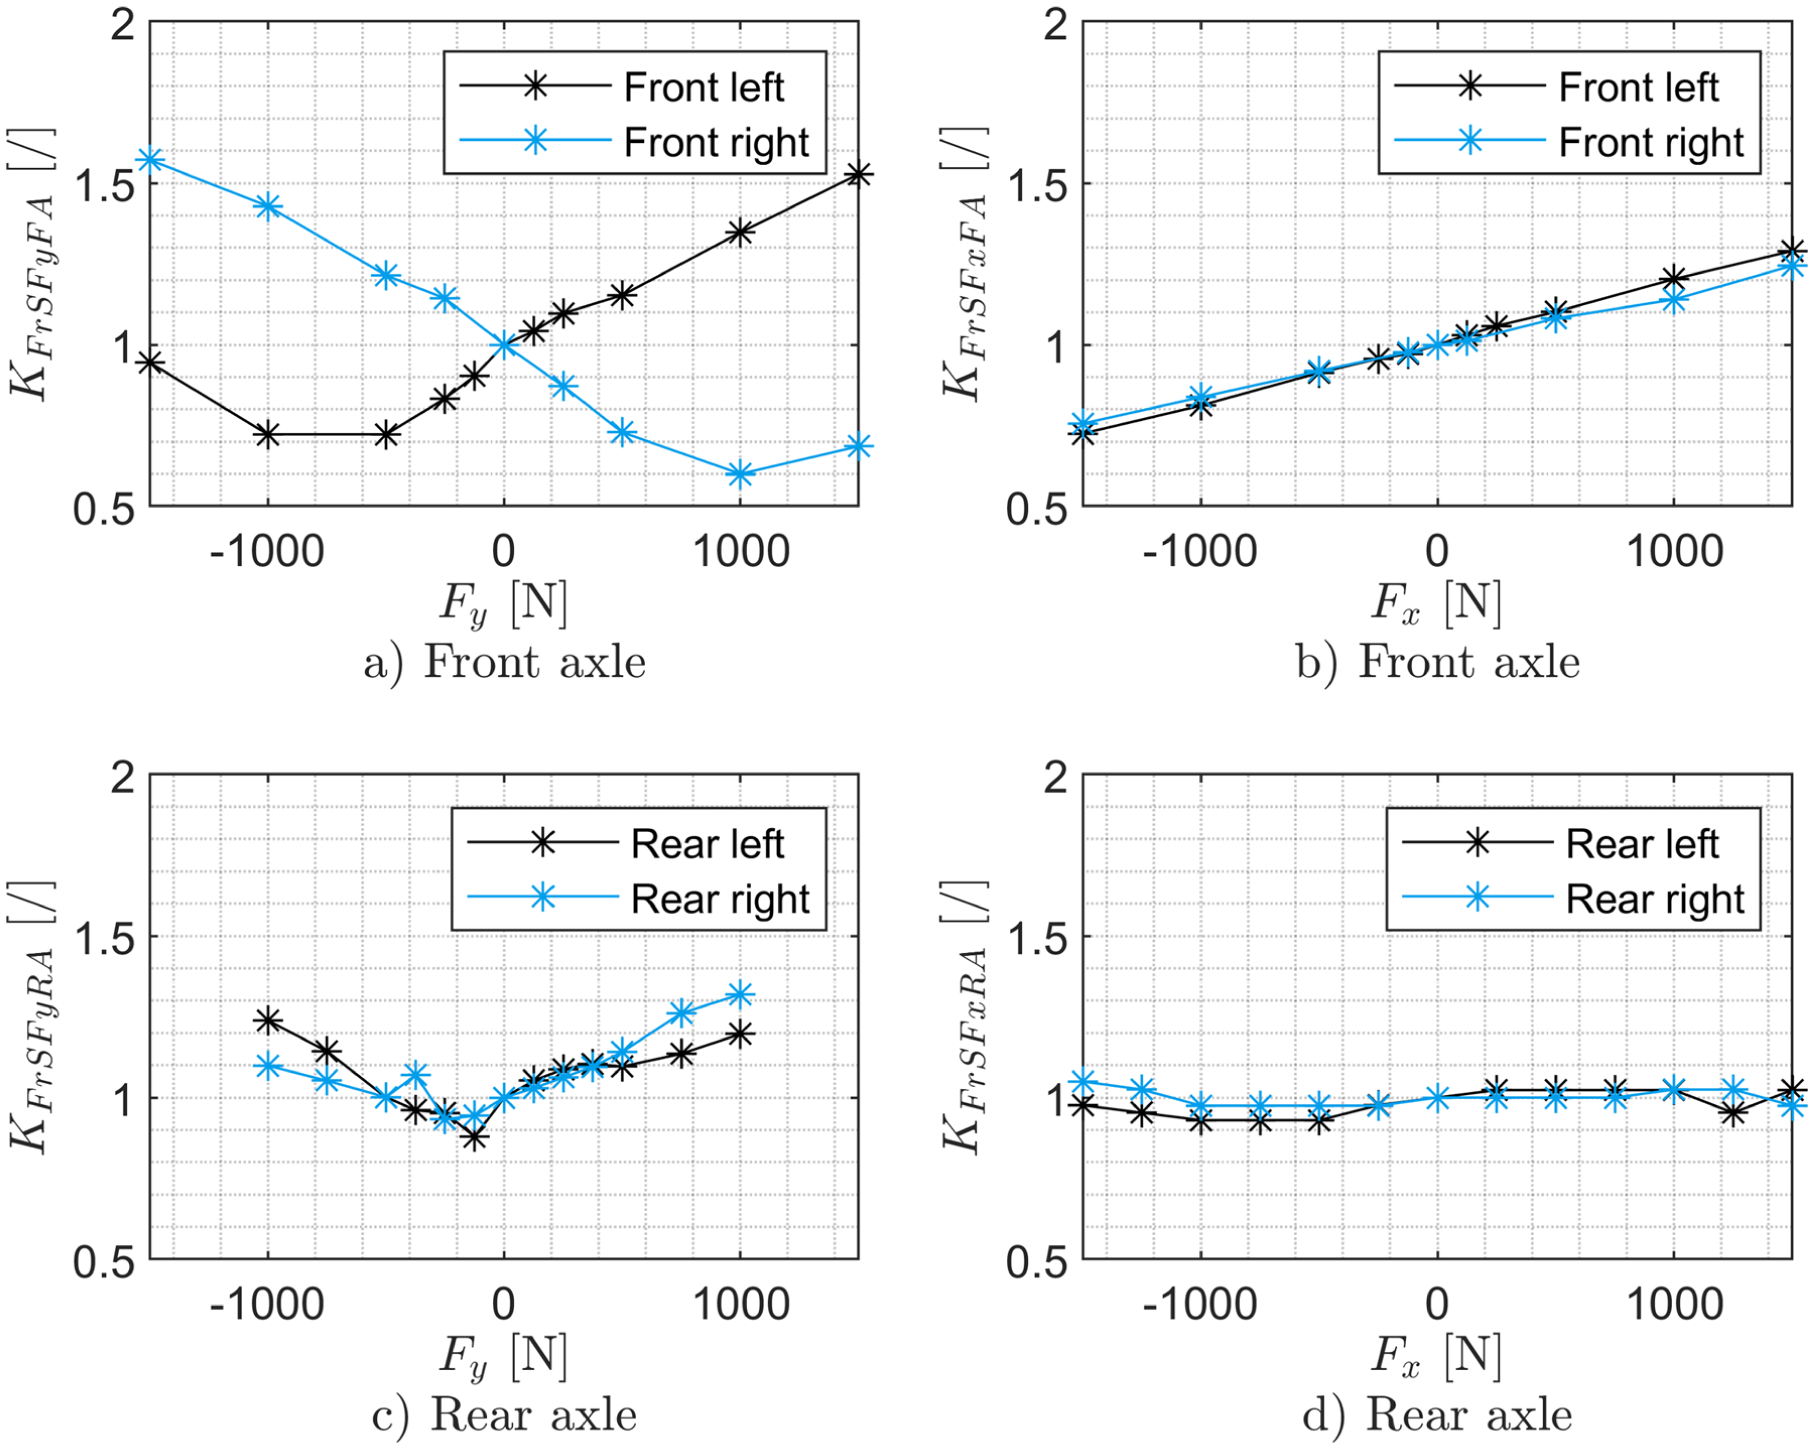
Measured effect of the horizontal suspension forces on the vertical suspension friction for a MacPherson axle ((a, b) front axle, adapted from Deubel and Prokop 22 ) and a fixed beam axle ((c, d) rear axle).
Angrick describes that the suspension friction of a multi-link axle is also dependent on the deflection amplitude during the friction measurements and increases linearly with the amplitude.21,25 Therefore, friction forces of the rear axle were determined with two additional excitation amplitudes at a range of −35 to +35 mm and −50 to 80 mm with an otherwise unchanged test procedure. Figure 5 shows the hysteresis of these measurements. The smaller of the two amplitudes has an average friction force of 43 N and the larger one of 65 N, so larger deflections come with increased friction forces. Studies by Deubel show that the friction force of vehicle shock absorbers does not show any significant dependence on the deflection amplitude. 24 The friction of a shock absorber increases by a maximum of 2 N when the deflection amplitude is increased from ±30 to ±50 mm. One possible explanation for the increased suspension friction at large deflection amplitudes could be the larger deflection of the elastomer mounts. Studies show that the stiffness of elastomer mounts transitions into a progressive range due to large deflections, and that the friction of the elastomers also increases.26–28 Furthermore, elastomers exhibit relaxation behavior after a single large deflection, which could explain the increased suspension friction over the entire deflection range. 29
Force-displacement diagram of the friction measurements of the rear axle with wheel replacement system and two different deflection ranges.
Test rig measurements of the test vehicles’ shock absorbers during the road tests were conducted to investigate the dependencies between shock absorber deflection velocity and oil level. Figure 6 shows the force-velocity characteristics of the front and rear axle shock absorbers as well as the force-displacement characteristics of the friction measurements for the test vehicles shock absorbers. Sinusoidal oscillations of the shock absorbers with 17 different maximum deflection velocities were measured to synthesize the force-velocity characteristics. It becomes evident that the oil-empty shock absorbers generate significantly lower forces compared to the intact shock absorbers. This confirms the hypothesis of high shock absorber velocities masking the effect of suspension friction in case of intact shock absorbers. Only for low shock absorber velocities or degraded shock absorbers is the effect of shock absorber friction and thus suspension friction dominant.
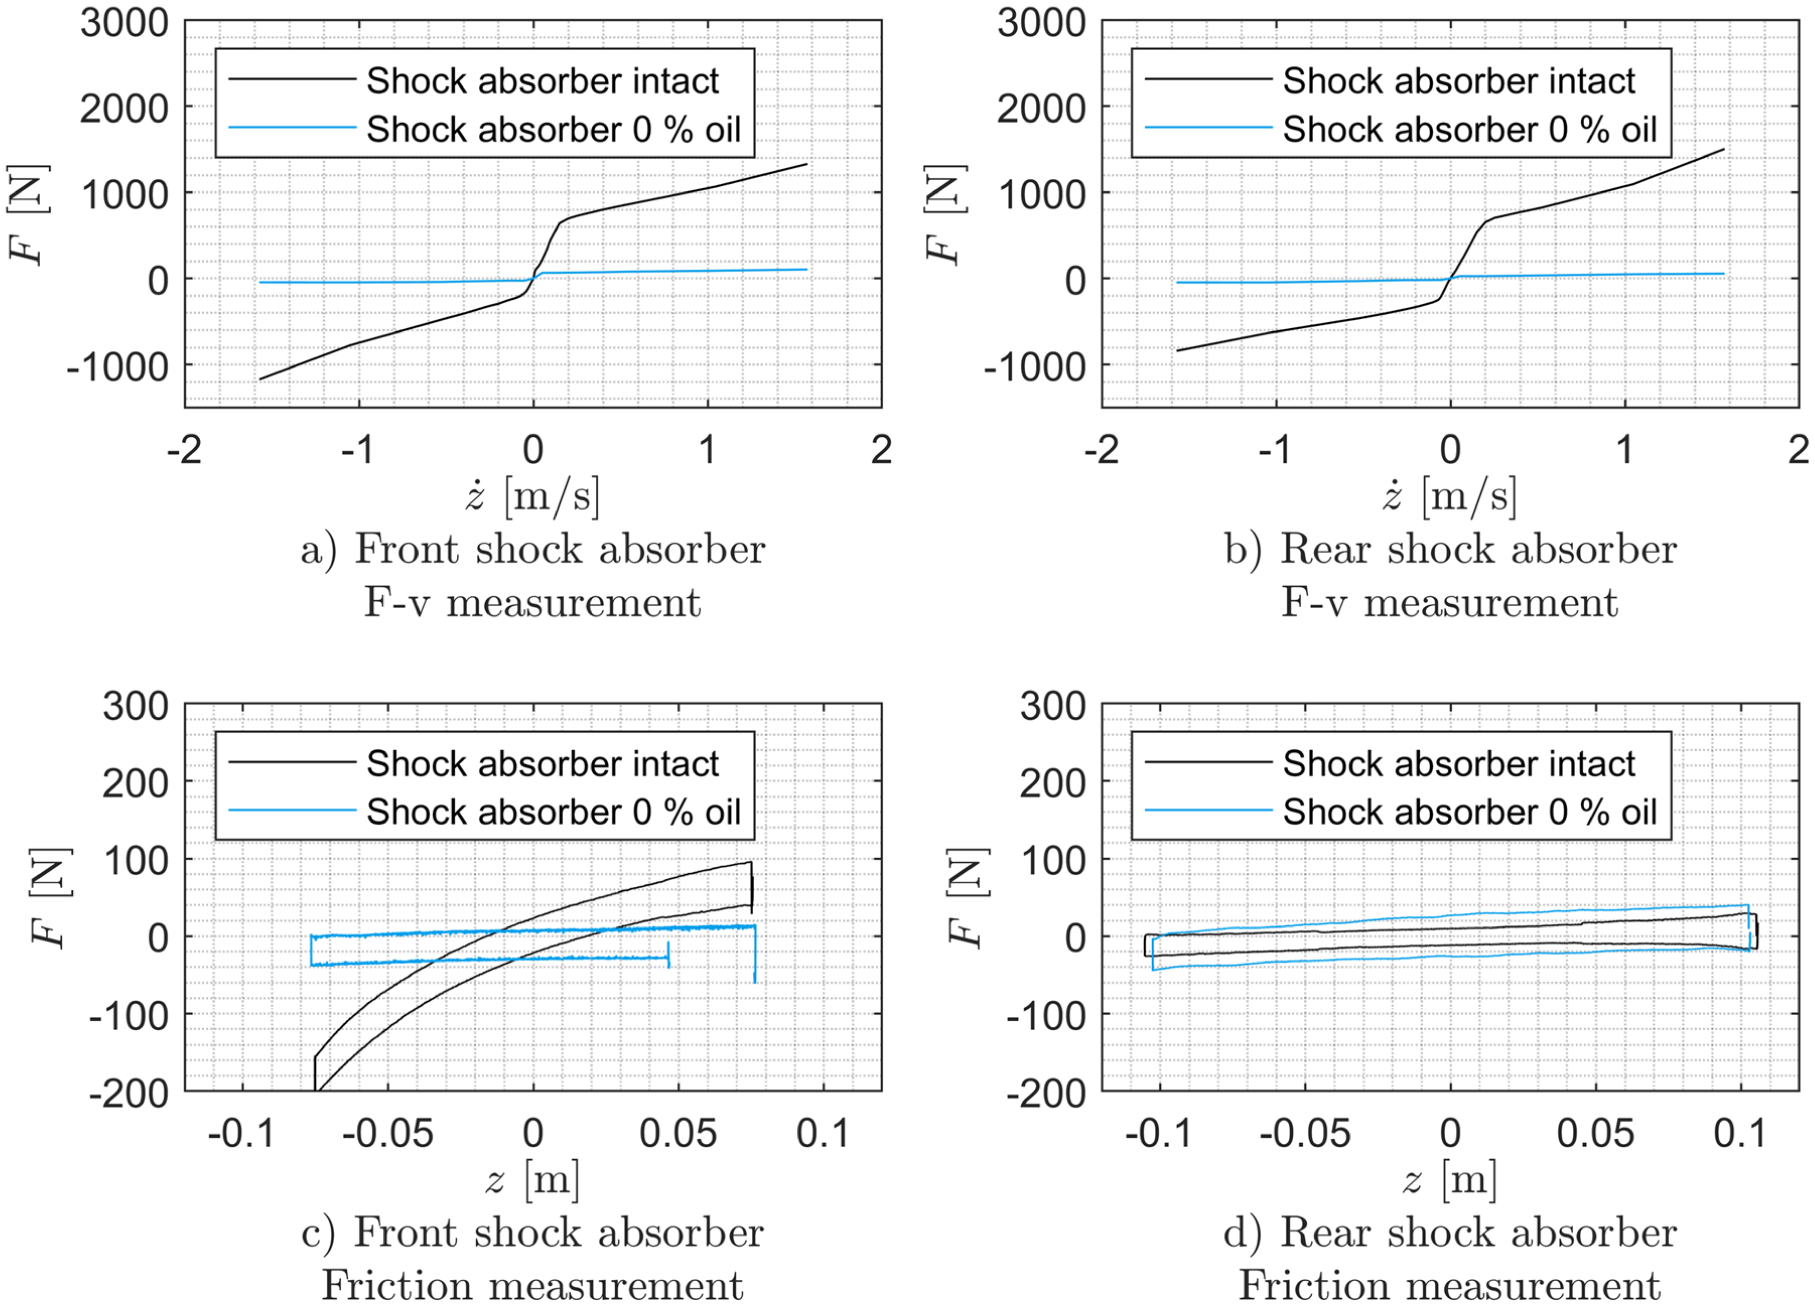
Force-velocity characteristics of the intact and oil-empty front axle shock absorbers (a) and rear axle shock absorbers (b) and force-deflection characteristics of the intact and oil-empty front axle shock absorbers (c) and rear axle shock absorbers (d).
The friction measurements were conducted with ramp signals at a velocity of 1 mm/s. The results of the friction measurements in Figure 6(c) show that the friction measurements of the intact front axle shock absorber reveal a clear deflection dependency. This can be explained by the gas preload of the front axle shock absorber. The oil-empty shock absorber does not exhibit this behavior, as it no longer contains the gas preload. Furthermore, the friction measurements show that the oil-empty shock absorbers exhibit greater frictional forces compared to the intact shock absorbers. To compare the frictional forces, half the hysteresis width of the shock absorbers of the intact and oil-empty shock absorbers was determined on the friction measurements. The friction force was determined at the zero crossing. The front shock absorbers have a friction force of 22 N when intact, while they have a friction force of 29 N when empty. The intact rear axle shock absorbers showed a half hysteresis width of 10 N, while the oil-empty rear axle shock absorbers showed a half hysteresis width of 20 N (Figure 6(d)). In general, it is reasonable to assume that quasi-static shock absorber friction is less affected by oil level (as long as some oil remains), as dynamic friction will be, owing to a series of interrelated tribological effects (such as described in Lampaert et al. 30 and Armstrong-Hélouvry et al. 31 ) that are predominantly active in the higher regimes of fluid-supported lubrication, that is typically at higher relative velocities. The lower friction force of the rear axle shock absorbers can be explained by the smaller piston diameter of the rear axle shock absorbers compared to the front axle shock absorbers. Deubel conducted a detailed study on the influence of the shock absorber oil level on the friction force of a shock absorber. 23 A low oil level in the shock absorber or even the absence of oil in the shock absorber leads to a reduction in the lubricating film between the friction partners in the shock absorber. The lower friction force of the rear axle shock absorbers can be explained by the smaller piston and piston rod diameters of the rear axle shock absorbers (29.8 and 13 mm) compared to the front axle shock absorbers (35.8 and 25 mm). The smaller diameter reduces the surface area of the friction partners. Furthermore, the lower gas stiffness as evident from Figure 6(d) indicates a lower internal pressure of the rear axle shock absorber. The study of Körner and Mayer has shown that shock absorber friction decreases with internal pressure, since the contact pressure of the seal at the piston rod decreases, leading to lower overall friction of the shock absorber. Other design-related influencing factors cannot be completely ruled out. 32
Force-velocity characteristics of oil-empty front and rear axle shock absorbers are illustrated in Figure 7 alongside the previously determined quasi-static friction forces of the same shock absorbers at intact and oil-empty states. It occurs that friction forces of the shock absorbers are significantly higher at an excitation velocity of 0.052 m/s compared to measured friction forces with ramp shaped excitation signals at a velocity of 1 mm/s. This observation confirms Deubel’s findings of a strong dependence of friction force on shock absorber deflection velocity. 23
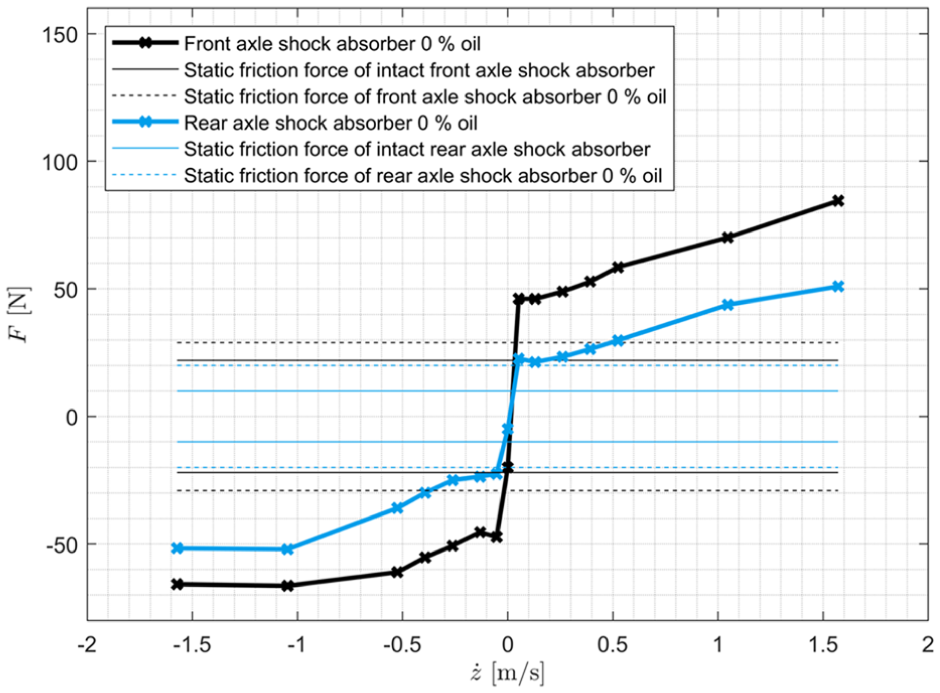
Force-velocity characteristics of oil-empty front and rear axle shock absorbers and quasi-static friction forces of the intact and oil-empty front and rear axle shock absorbers.
To represent the suspension friction
Next, the calculated suspension friction from the above friction model
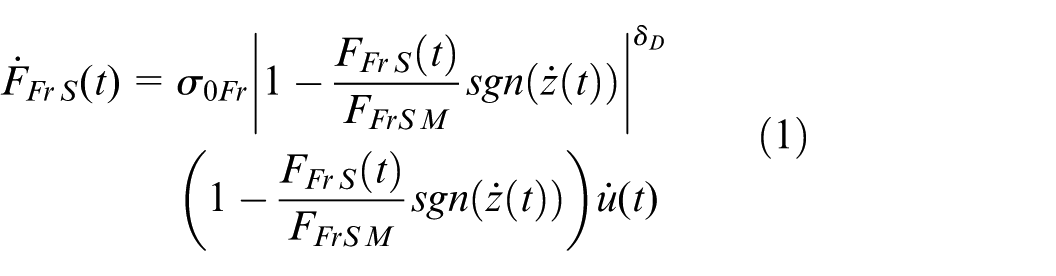
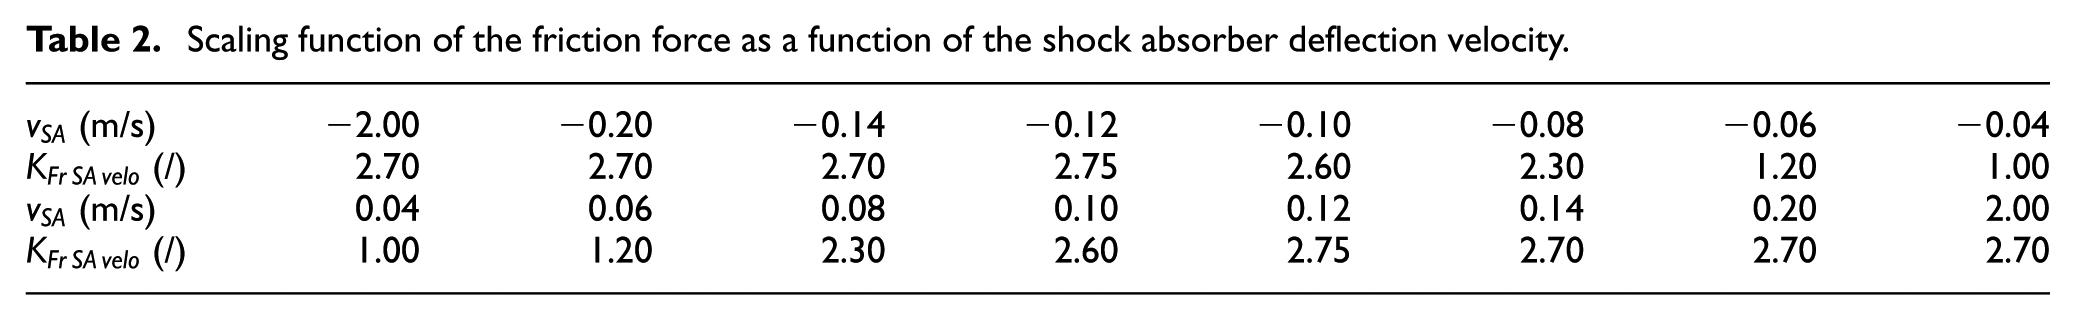
This shock absorber friction is scaled with the shock absorber deflection velocity

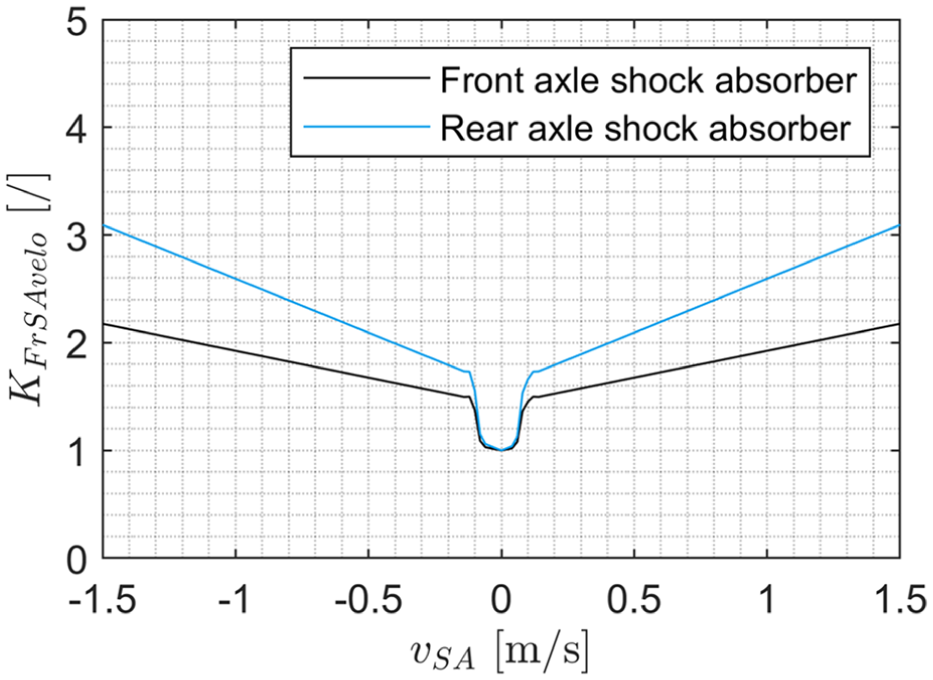
Scaling function of the shock absorber friction as a function of the deflection velocity.
Scaling function of the friction force as a function of the shock absorber deflection velocity.
The suspension and shock absorber friction are parameterized on the basis of measurements with intact shock absorbers. Figure 7 shows that the shock absorber friction increases as the oil level in the shock absorber decreases. To compensate this effect, the shock absorber friction force is scaled as a function of the oil level (


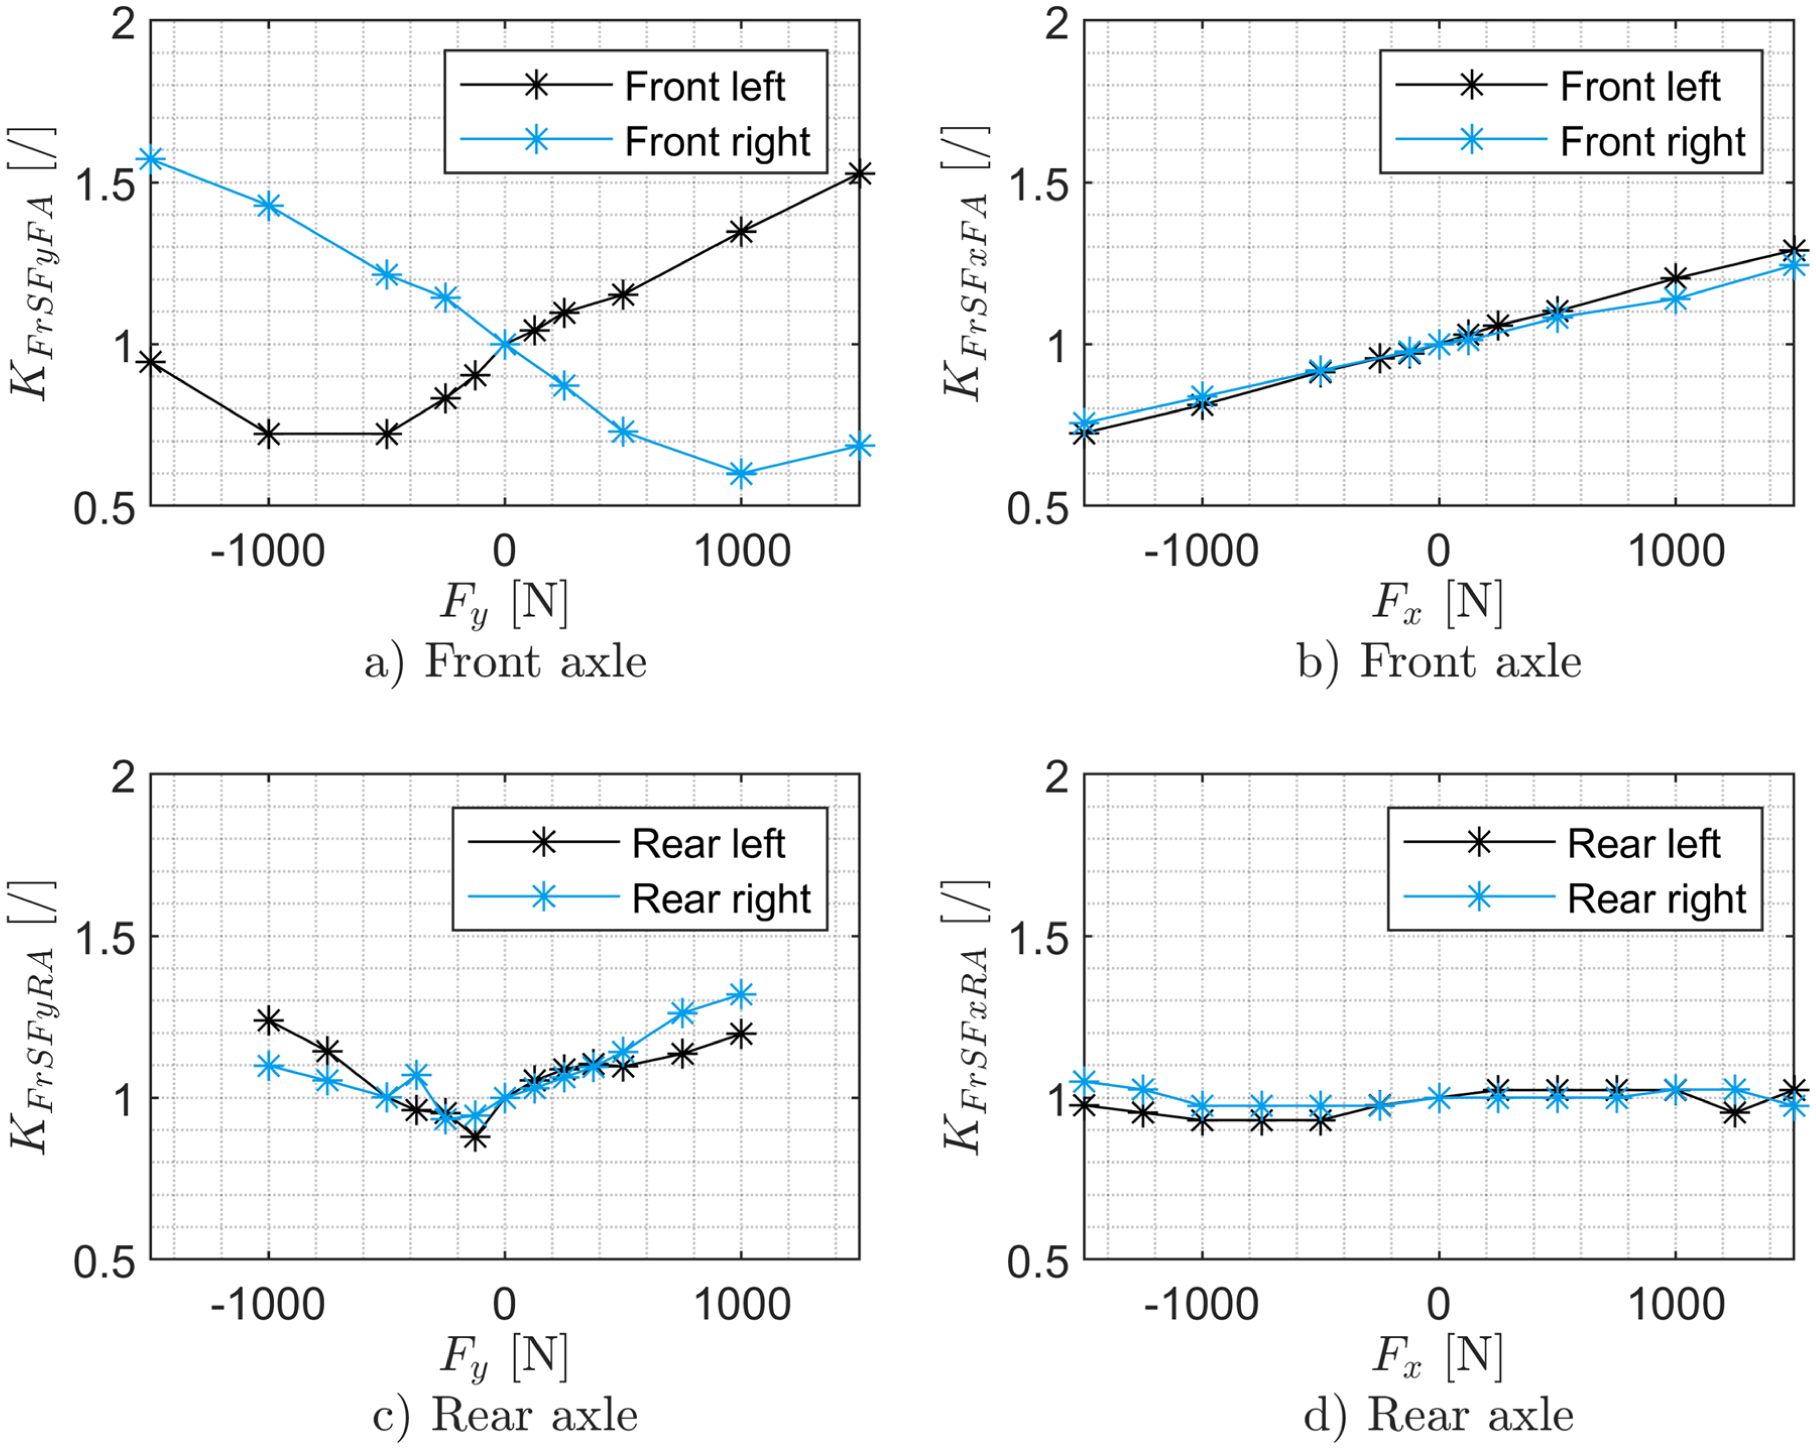
The suspension friction force is calculated according to equation (6), taking into account the friction force of the shock absorber
Finally, the suspension friction forces are scaled as a function of the horizontal suspension forces utilizing scaling functions according to Figure 4 (equation (7)). The full vehicle models scaling functions of the suspension friction as a function of the horizontal suspension forces are illustrated in Figure 9.

Scaling functions of the suspension friction as a function of the horizontal suspension forces in the full vehicle model: (a, b) front axle and (c, d) rear axle.
Validation with full vehicle model
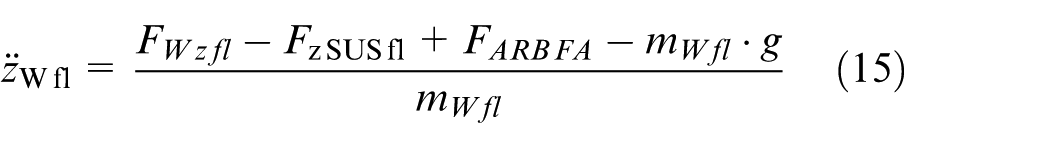
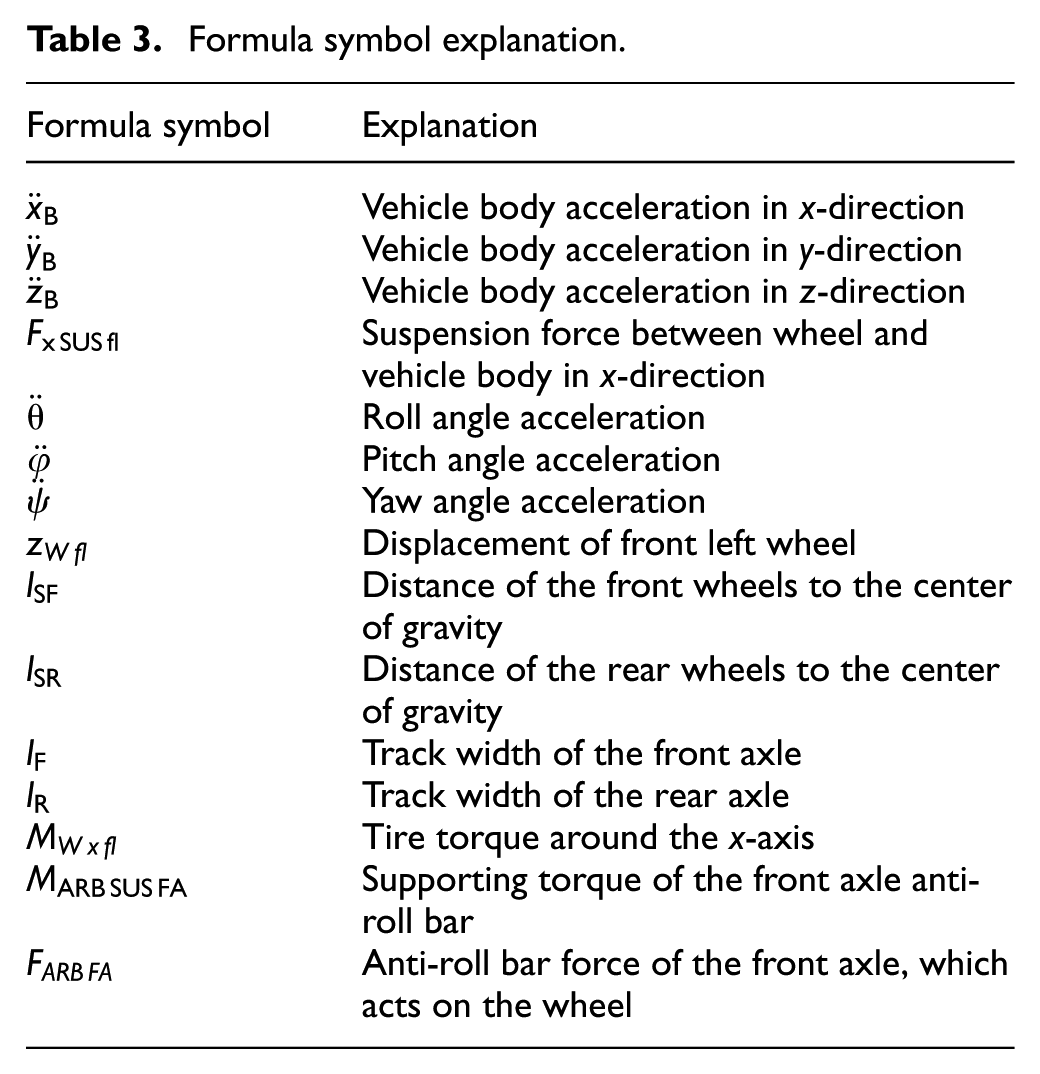
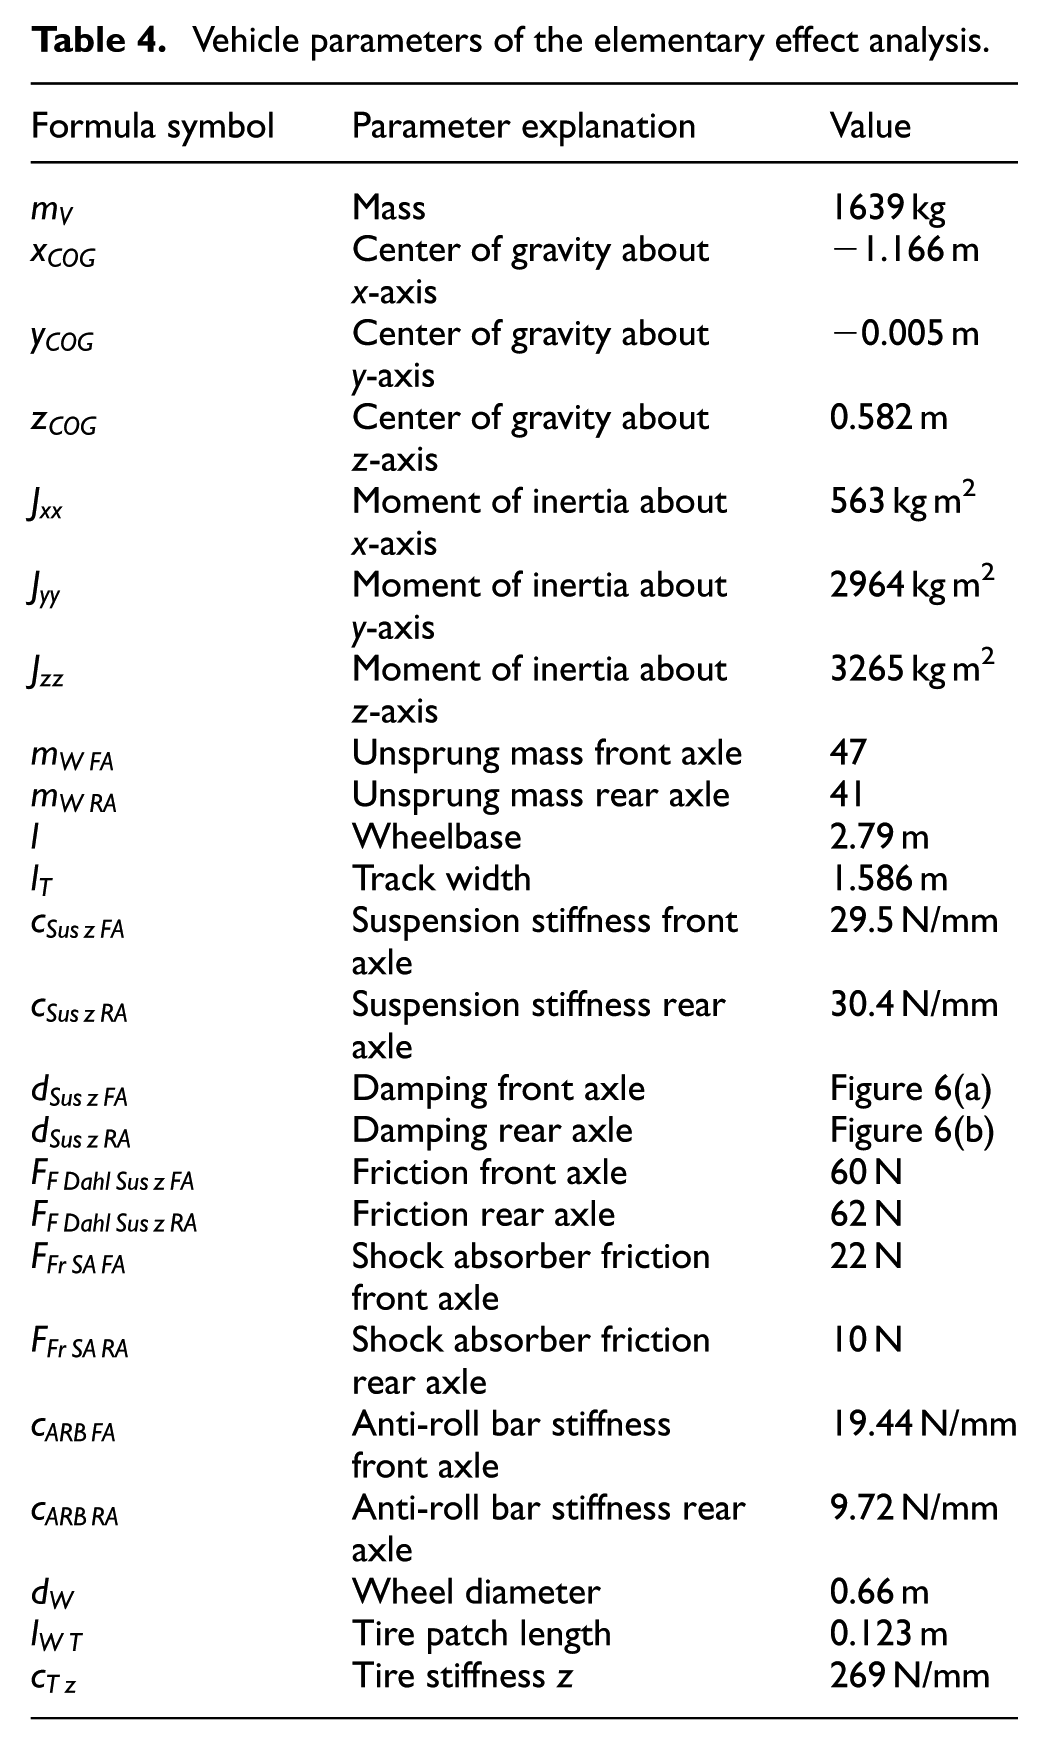
A mathematical five-mass full vehicle model is used to verify and validate the phenomenological suspension friction model. Equations (8)–(15) represent the equations of motion for the six degrees of freedom of the vehicle body, the vertical wheel movement and the vertical axle force at a vehicle corner. Tables 3 and 4 explain the formula symbols and parameters used.
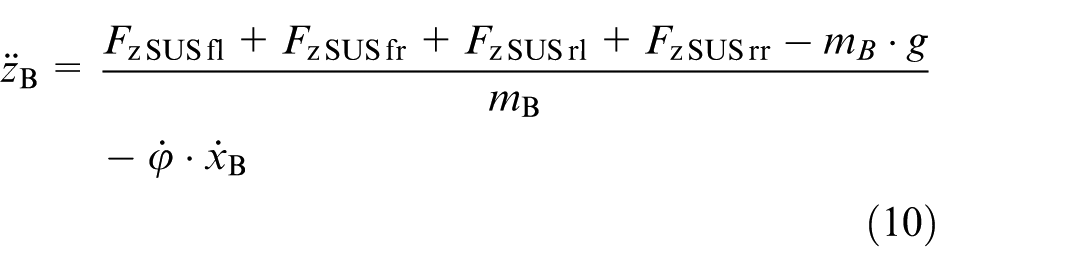
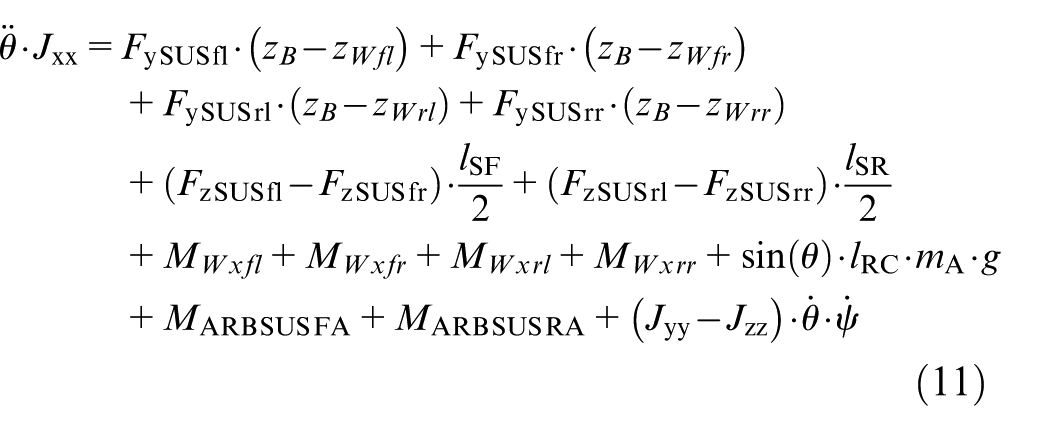
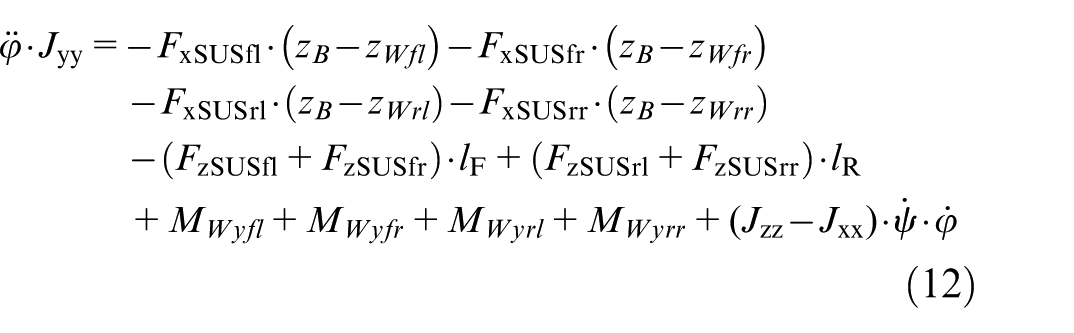
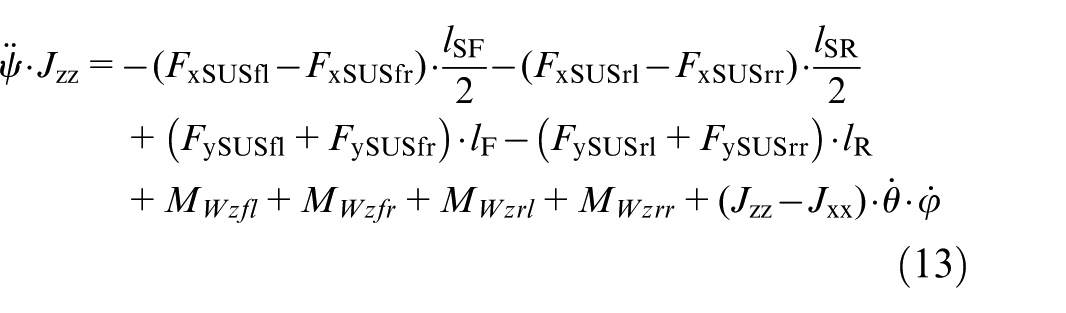

Formula symbol explanation.
Vehicle parameters of the elementary effect analysis.
The vertical suspension forces in the full vehicle model are composed of four parts: spring force, damper force, friction force and anti-roll bar force. Non-linear spring force and linear anti-rollbar stiffness of the model are determined by measurements of the test vehicle on the SMS.
Suspension damping is parameterized with the measured and reduced force-velocity characteristic curve of the intact shock absorbers. The measured force-velocity characteristic curves of the intact shock absorbers contain the velocity-dependent shock absorber friction. The shock absorber force is therefore reduced by the calculated shock absorber friction taking velocity dependence into account, but neglecting dependence on lateral force, as the force-velocity characteristics of the shock absorbers are measured without the influence of lateral force, but include the velocity-dependent friction.
Figure 10 illustrates the pitch rate during a speed bump crossing at slow speeds with three different vehicle configurations regarding the shock absorber states for validation purposes. The vehicle configurations are intact shock absorbers on both axles and oil-empty shock absorbers at either one of the axles. Measured pitch rates are compared with the simulated pitch rates of the full vehicle model with varying friction models.
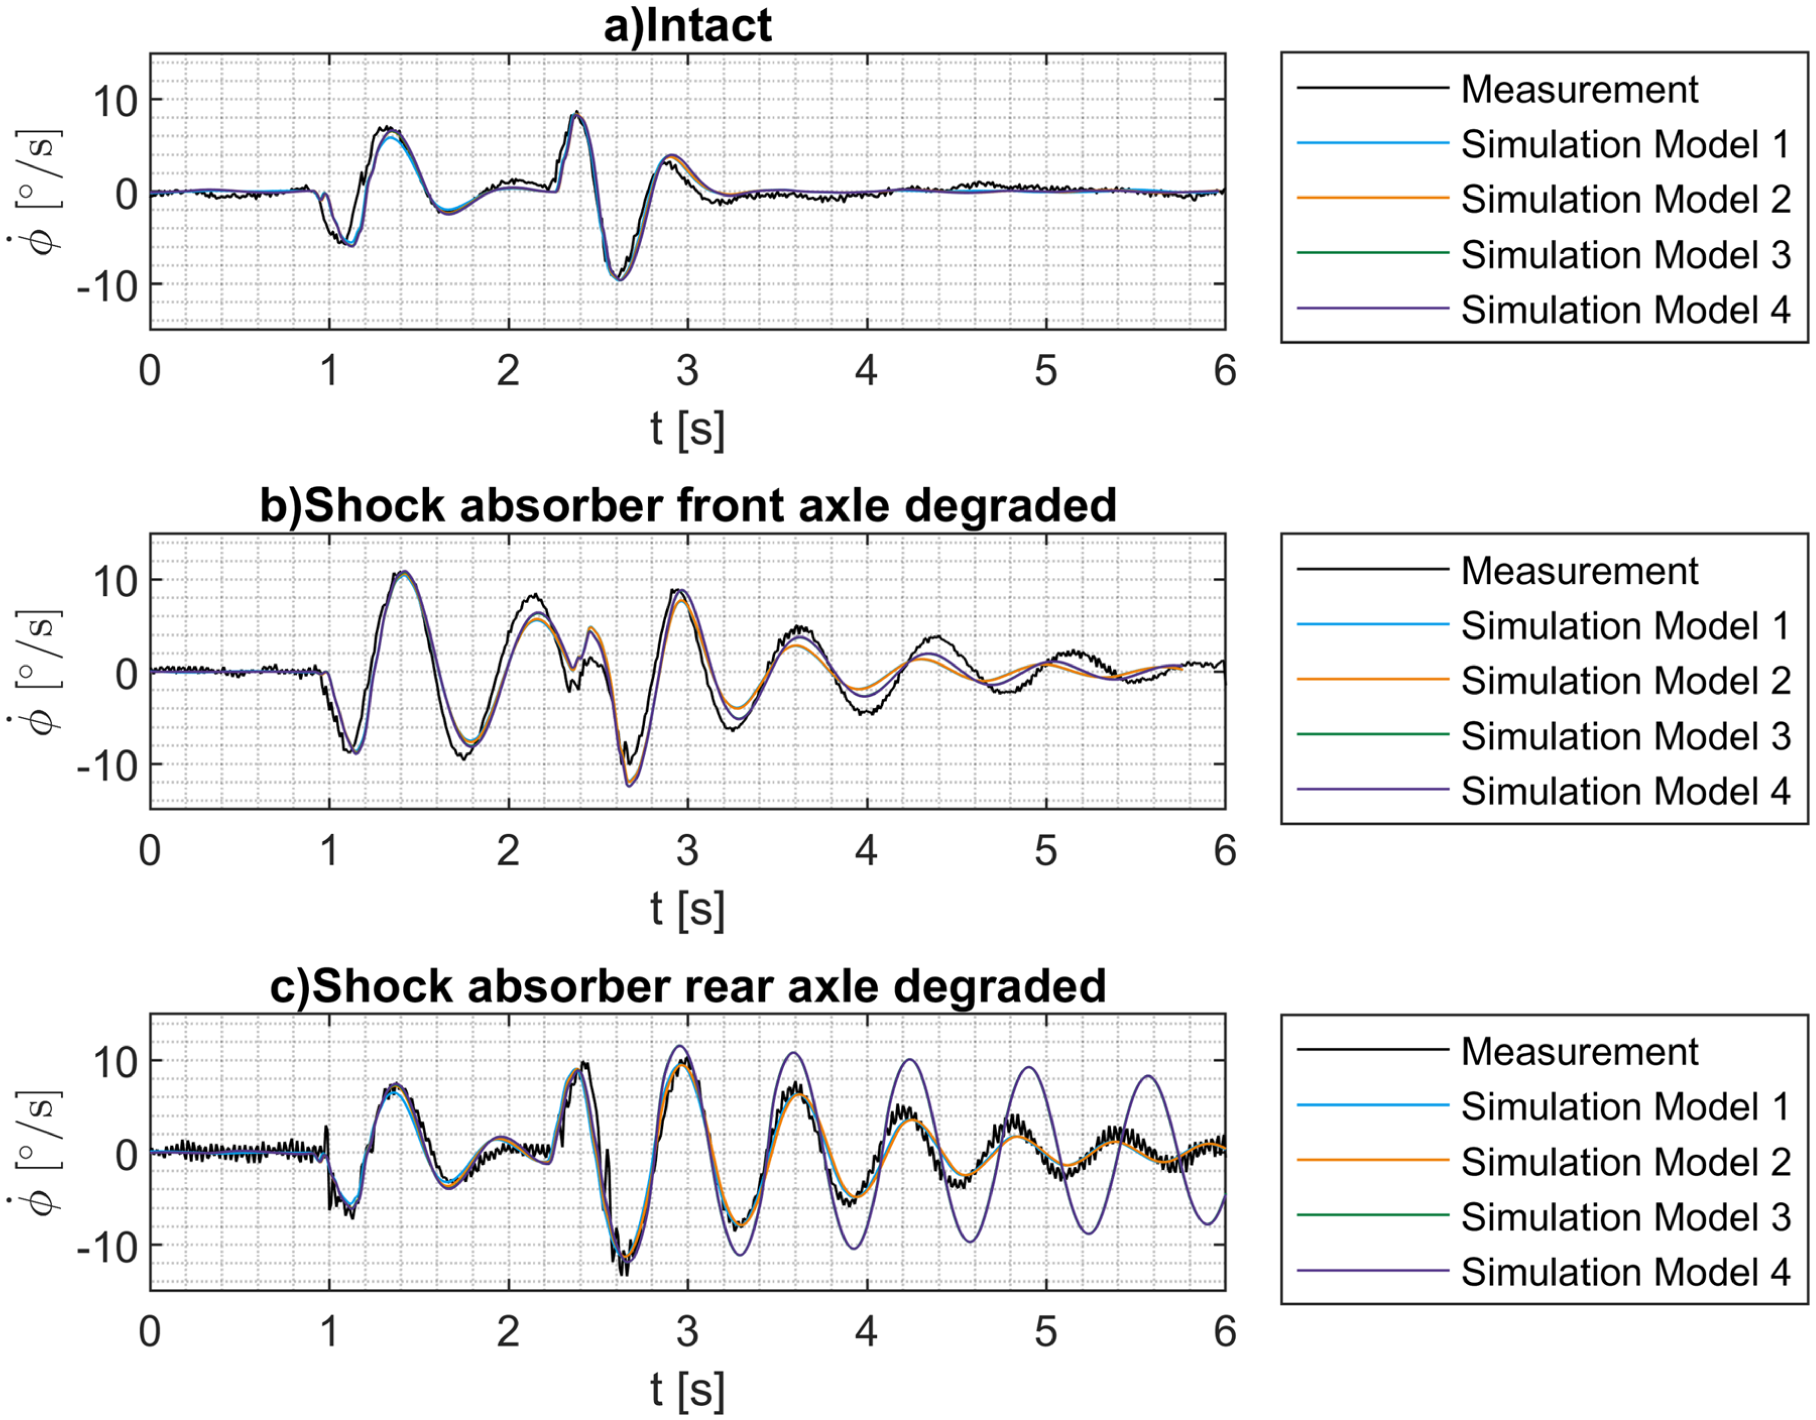
Measured and simulated pitch rates of a test vehicle during slow speed bump crossing for different shock absorber degradation states and for different suspension friction models: (a) intact, (b) shock absorber front axle degraded and (c) shock absorber rear axle degraded.
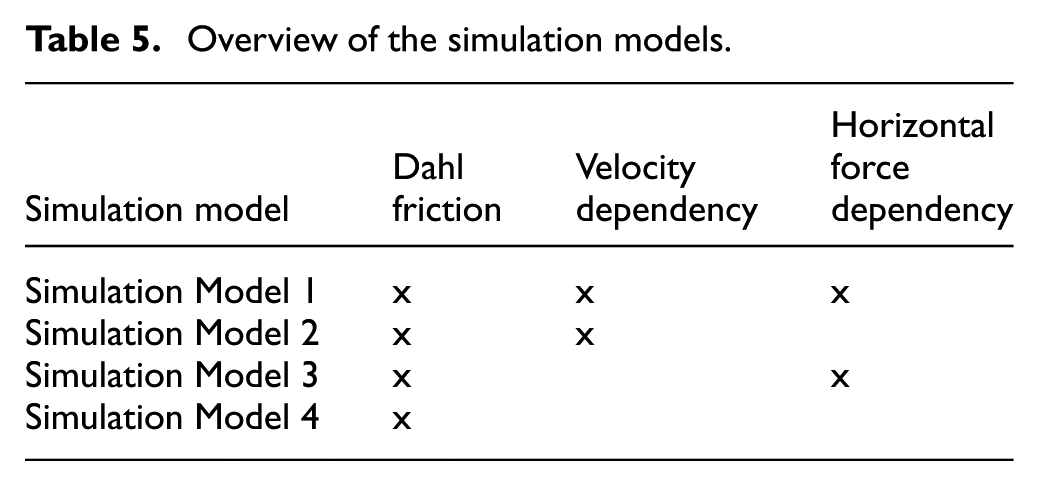
Simulation Model 1 corresponds to the entire mathematical model of suspension friction presented previously in this paper, consisting of the Dahl model, scaling for shock absorber deflection velocity, shock absorber oil level and horizontal suspension forces. Simulation Model 2 corresponds to the model independent of the horizontal suspension forces. Simulation Model 3 corresponds to the model independent of the shock absorber deflection velocity. Simulation Model 4 corresponds to a suspension friction model, which only consists of a simple Dahl model. The suspension friction models are summarized in Table 5. To evaluate the model quality, the root mean square error (RMSE) between the measured (
Overview of the simulation models.
Root mean square error of the pitch rate in °/s for the model variants from Table 5.
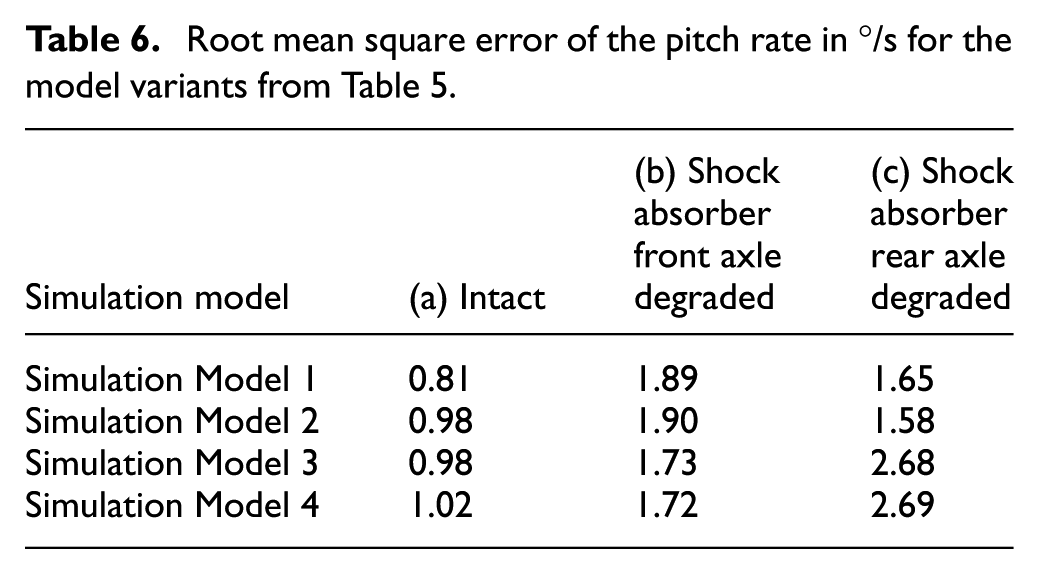
As demonstrated in Figure 10, the full vehicle model is able to reproduce the pitch rates of the test vehicle for the slow bump crossings with three different vehicle configurations. The four different model approaches show no effect for the intact vehicle. The RMSE shows the best results for the friction model presented here. However, the difference to the other model variants is relatively small. It can be assumed that the fluid friction forces in the shock absorbers are dominant compared to the suspension friction. For the vehicle configuration with oil-empty front axle shock absorbers, minor deviations in the simulation are observable, which leads to the assumption that the suspension friction on the front axle is overestimated for the oscillation of the vehicle with oil-empty front axle shock absorbers. The RMSE of the model presented here shows a slightly larger error for the model presented here. Relevant characteristics of the configuration with oil-empty rear axle shock absorbers, are well represented by the model of suspension friction. It appears that Simulation Models 1 and 2 reproduce the properties well, while Simulation Models 3 and 4 simulate a significantly higher oscillation and thus underestimate the suspension friction. This suggests that it is necessary to take the velocity dependence of the suspension friction into account. However, taking into account the dependency with the horizontal suspension forces has no effect on the simulation result. This can be explained, since the rear suspension friction is only influenced by lateral suspension forces, as shown in Figure 4. The investigated speed bump crossings do not cause forces in that direction.
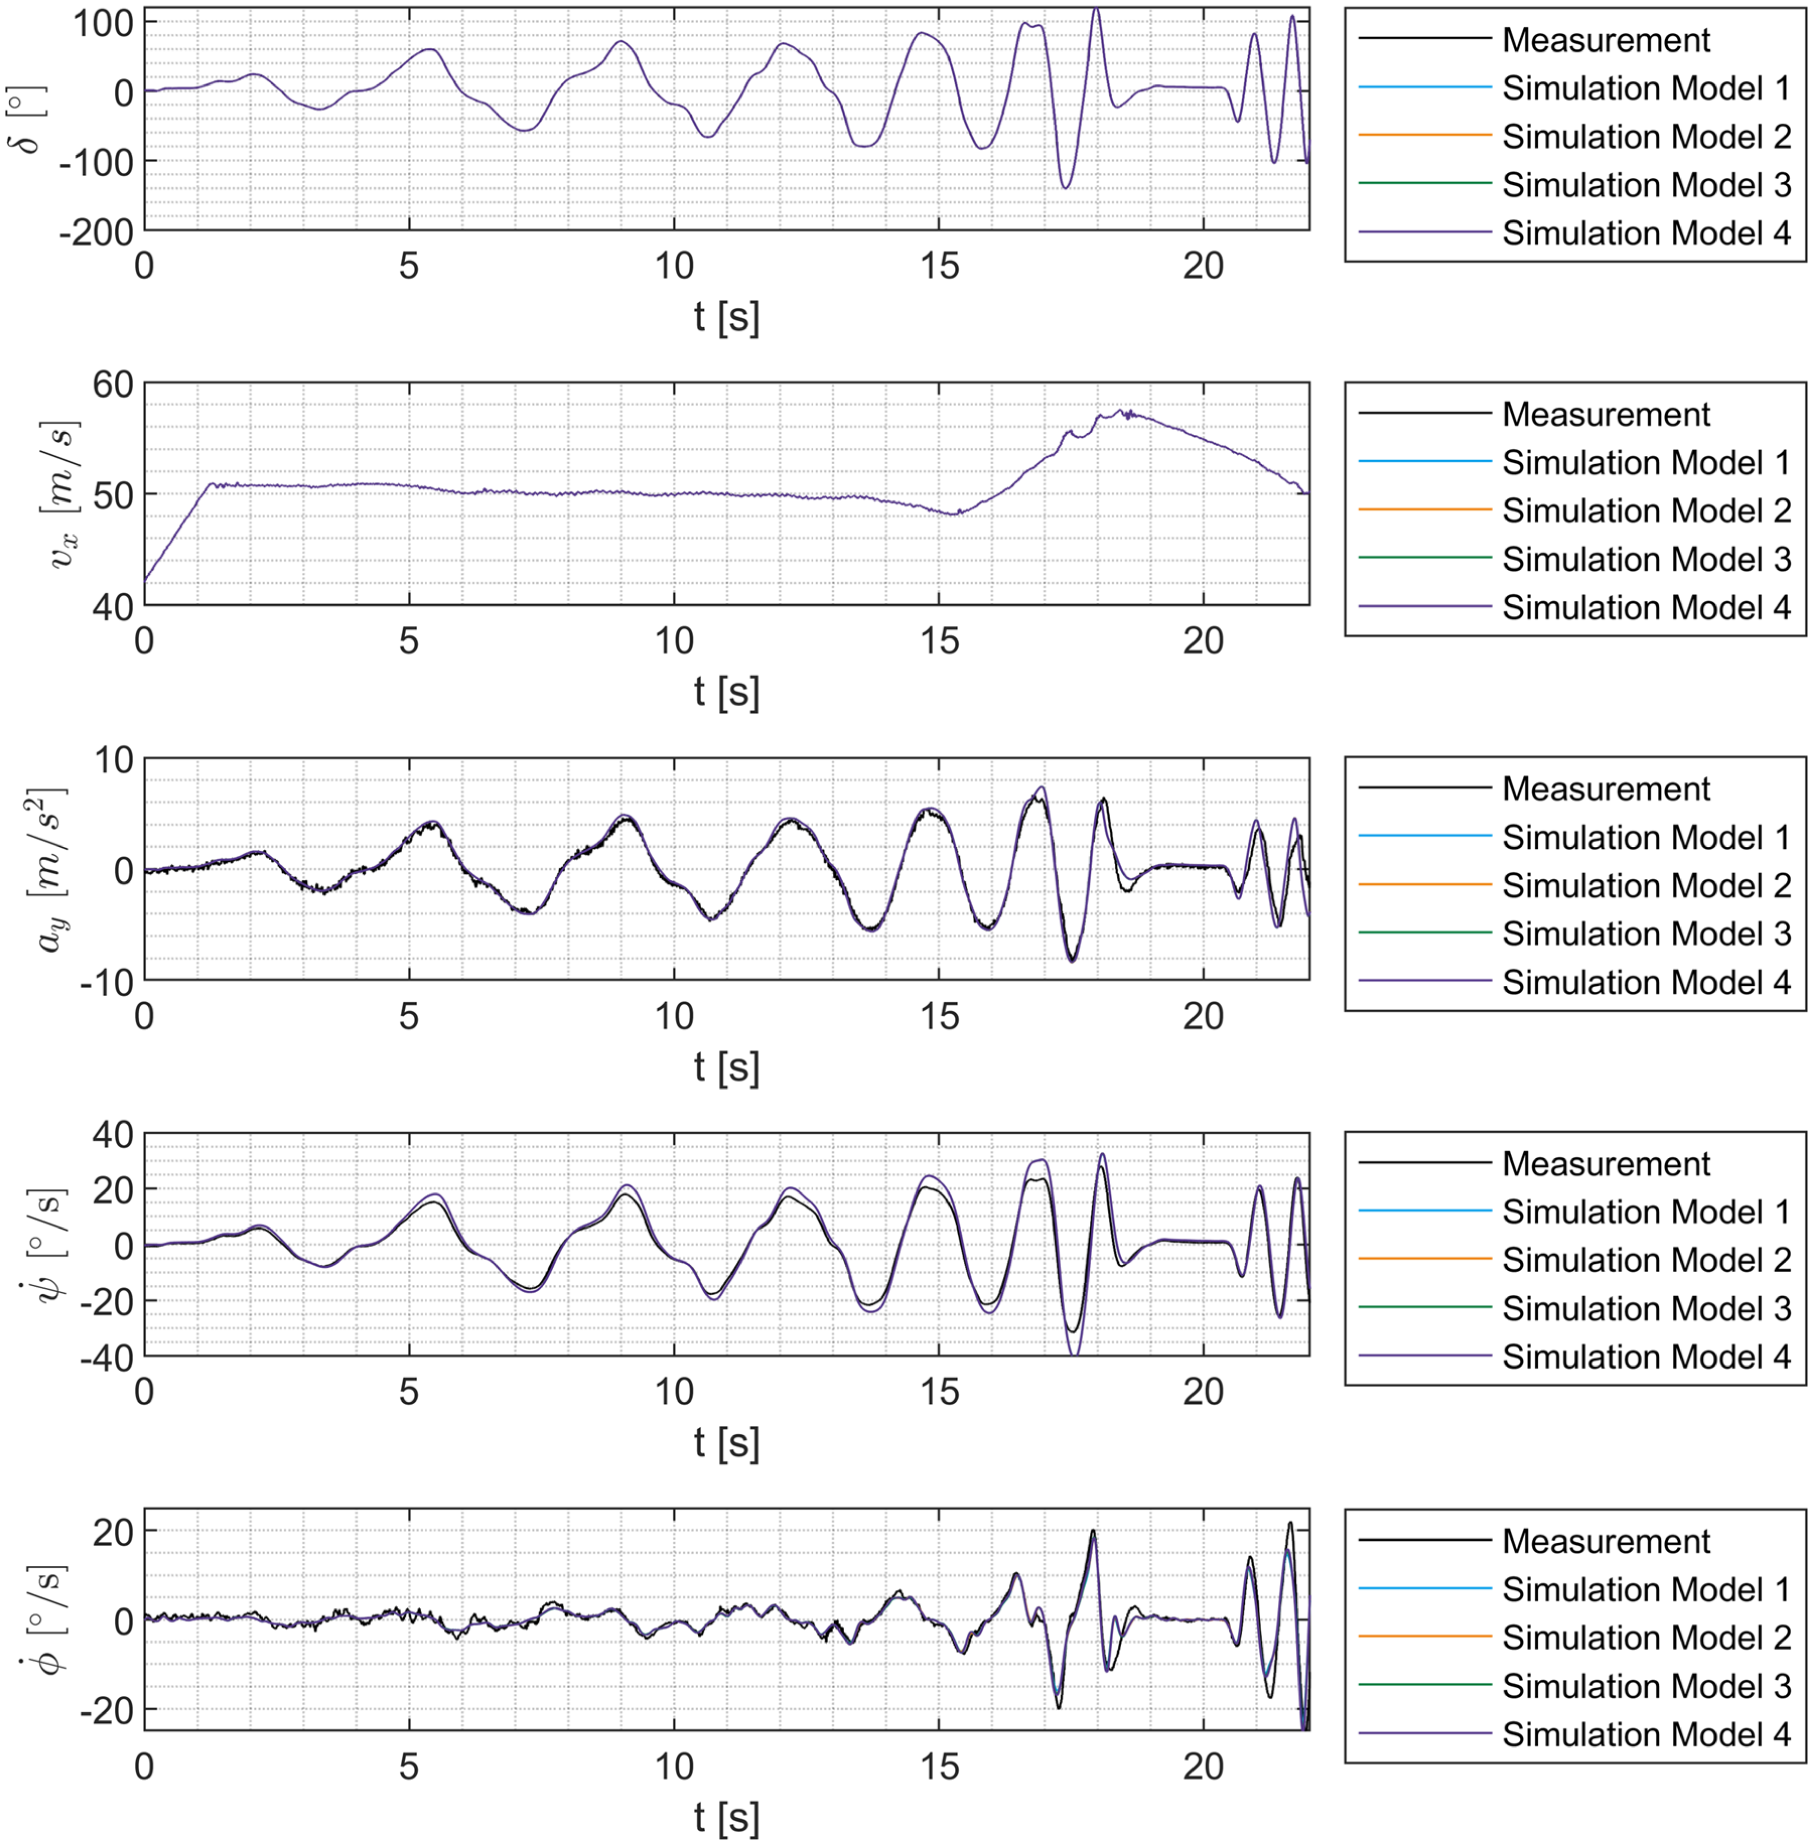
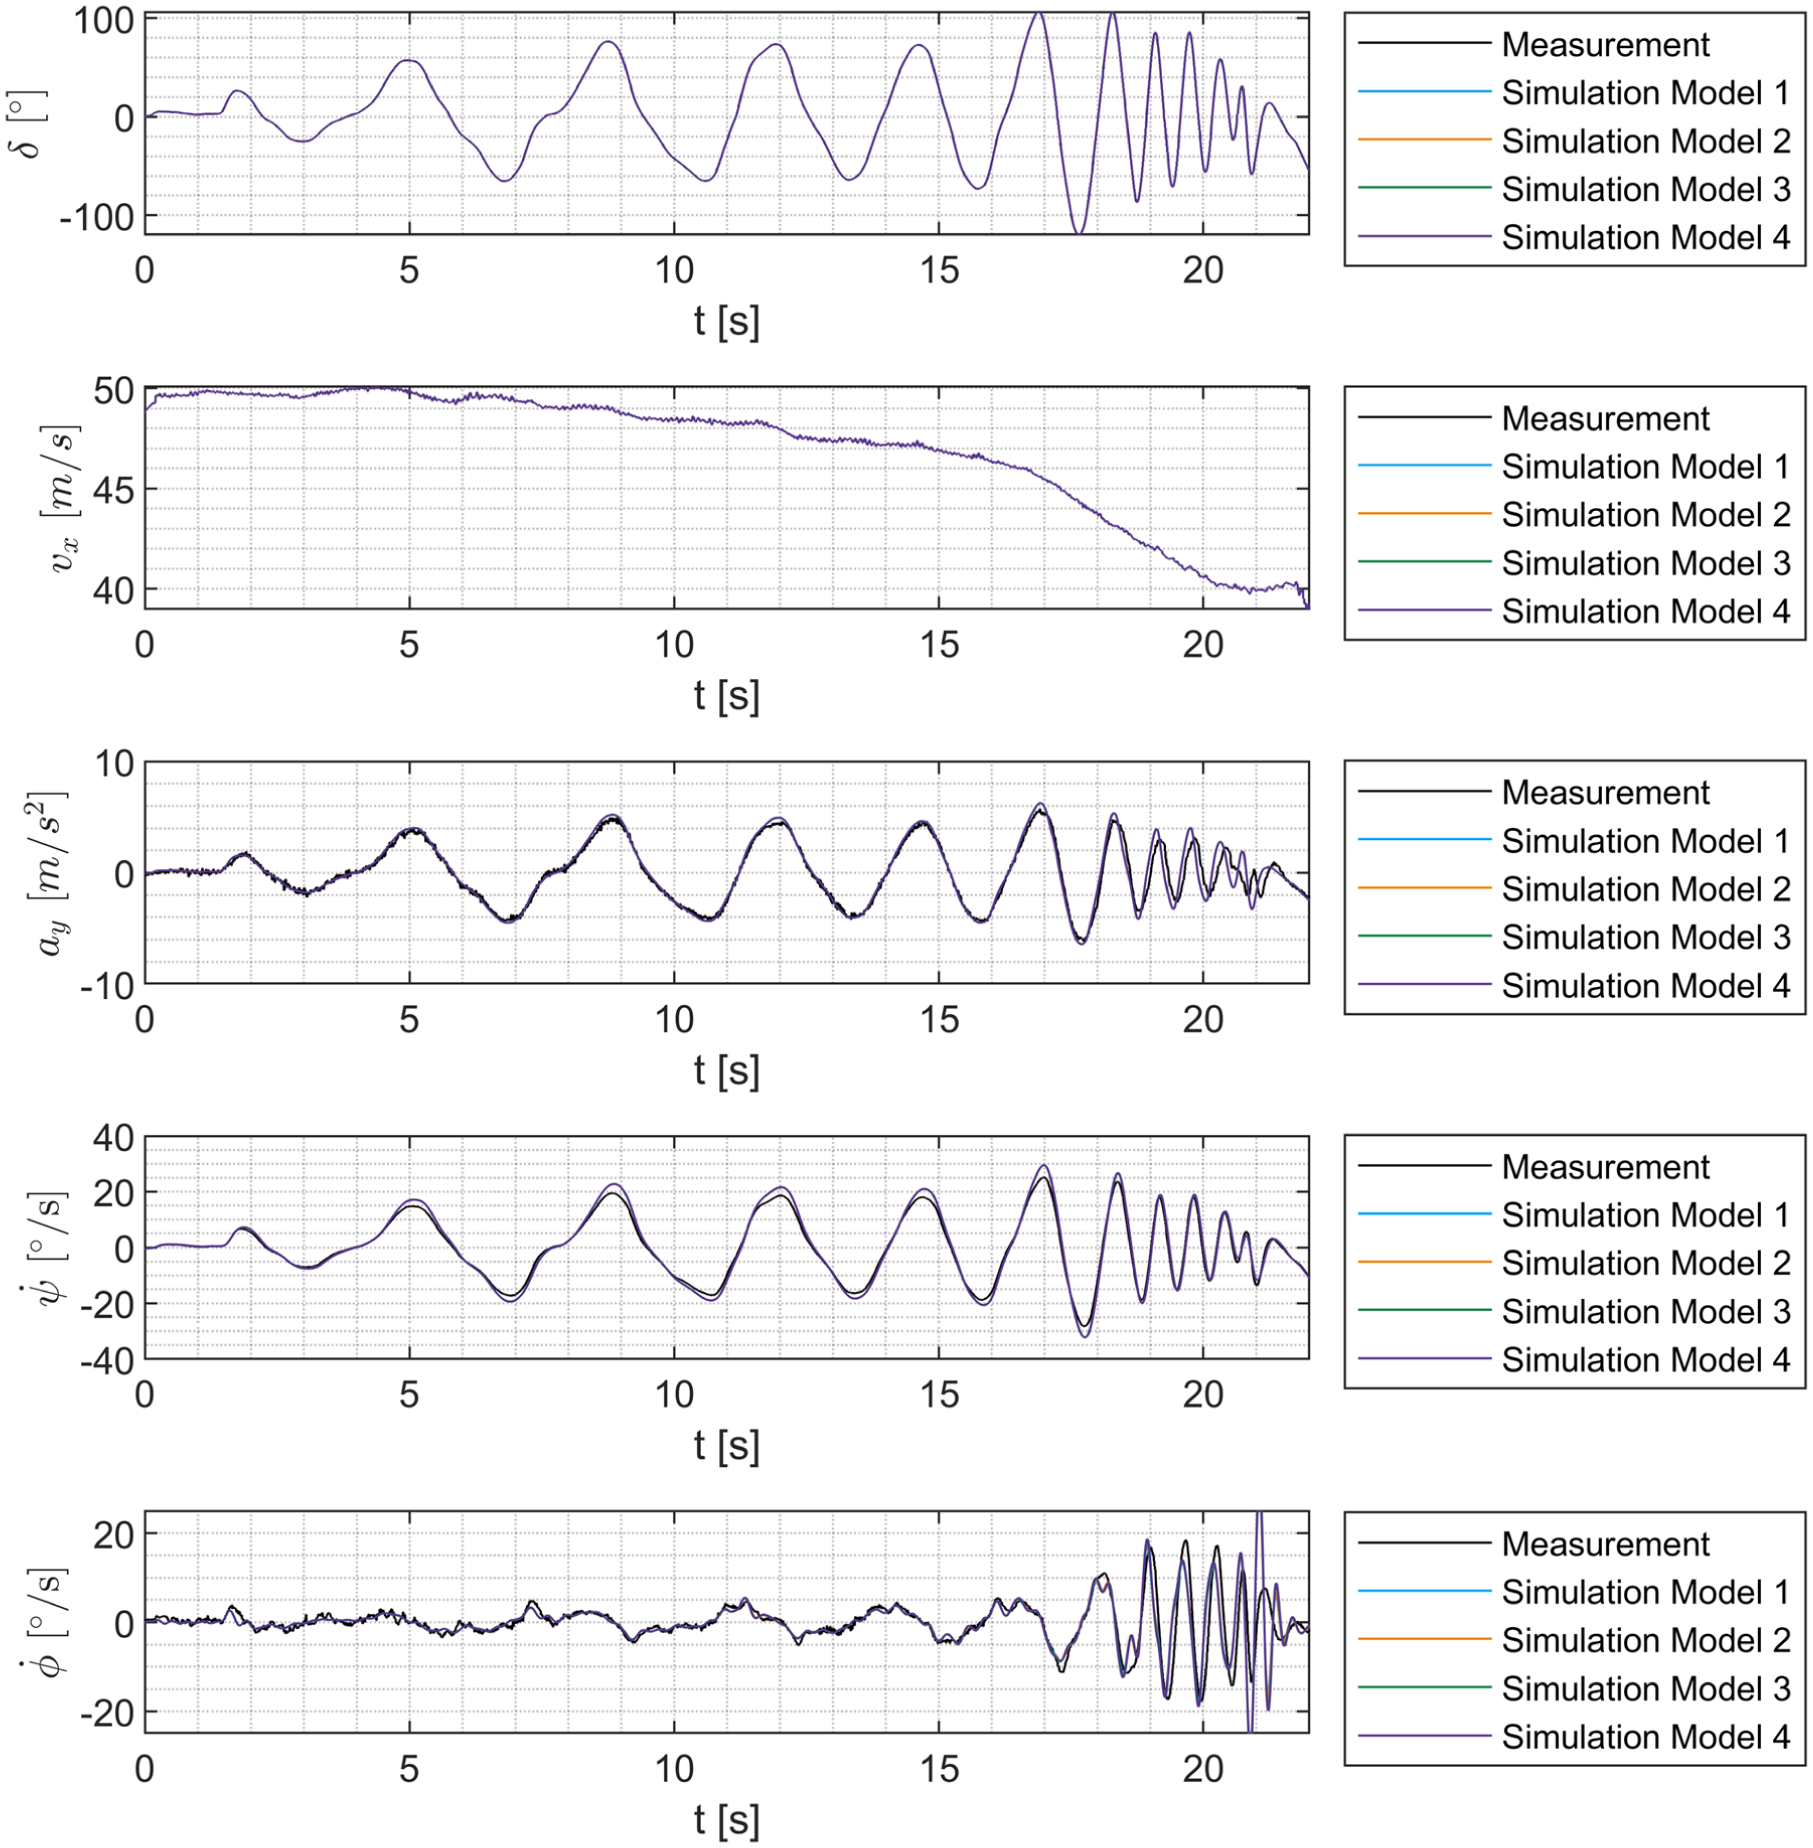
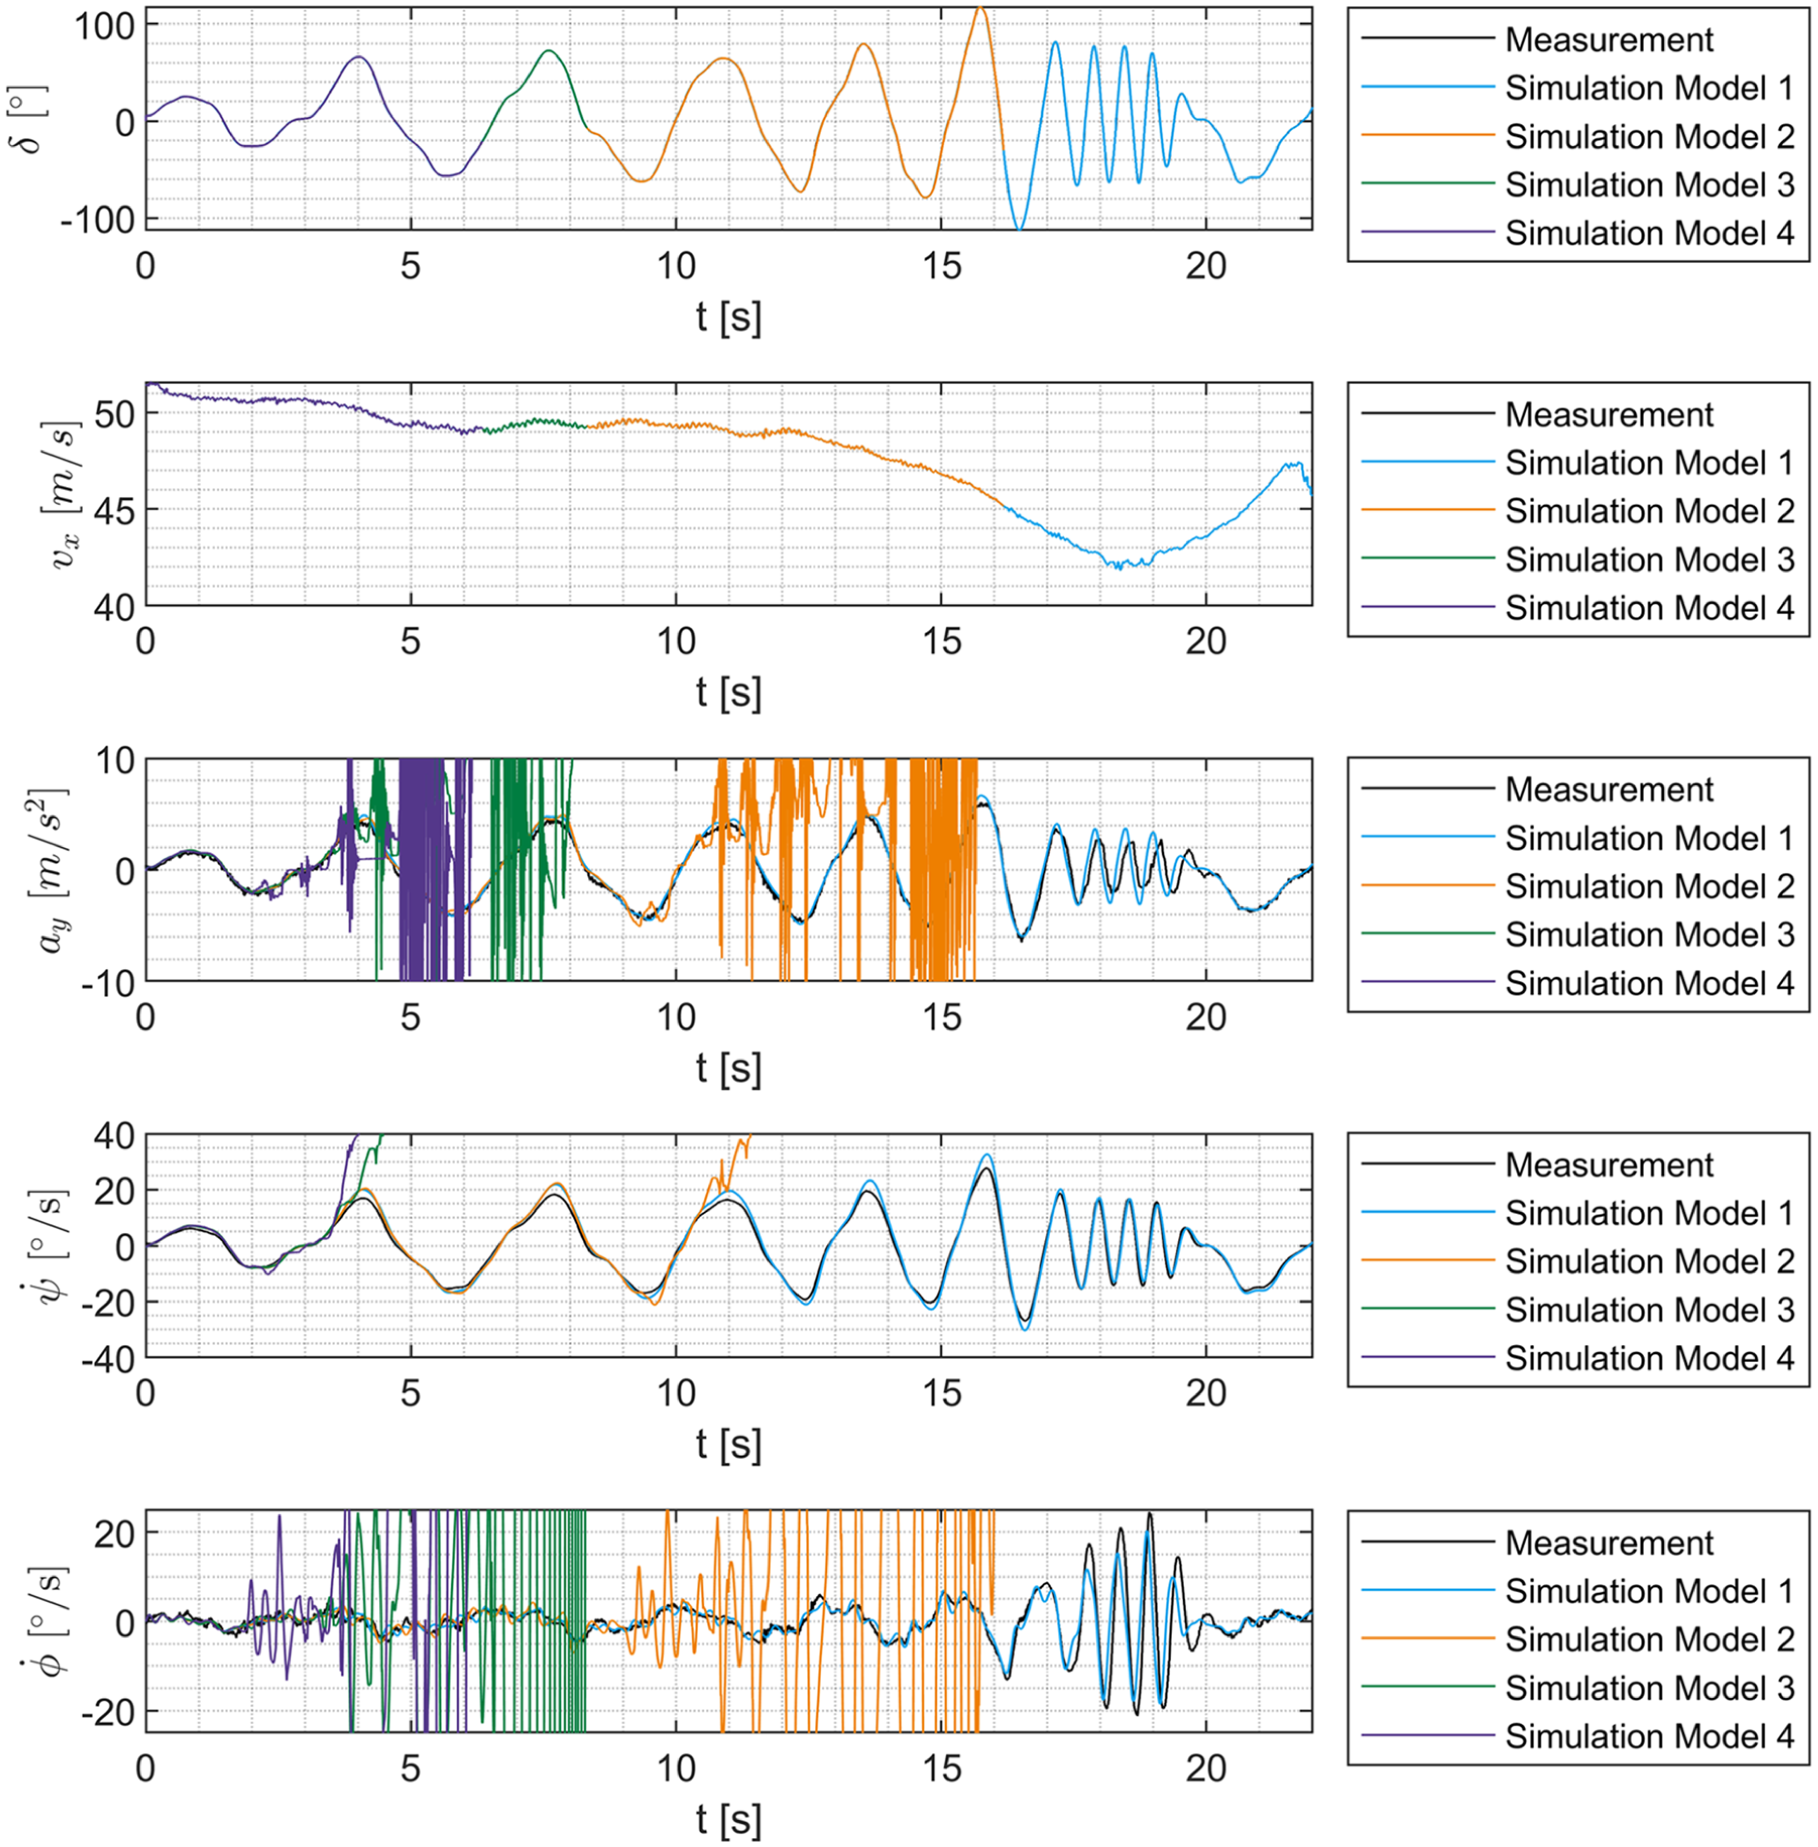
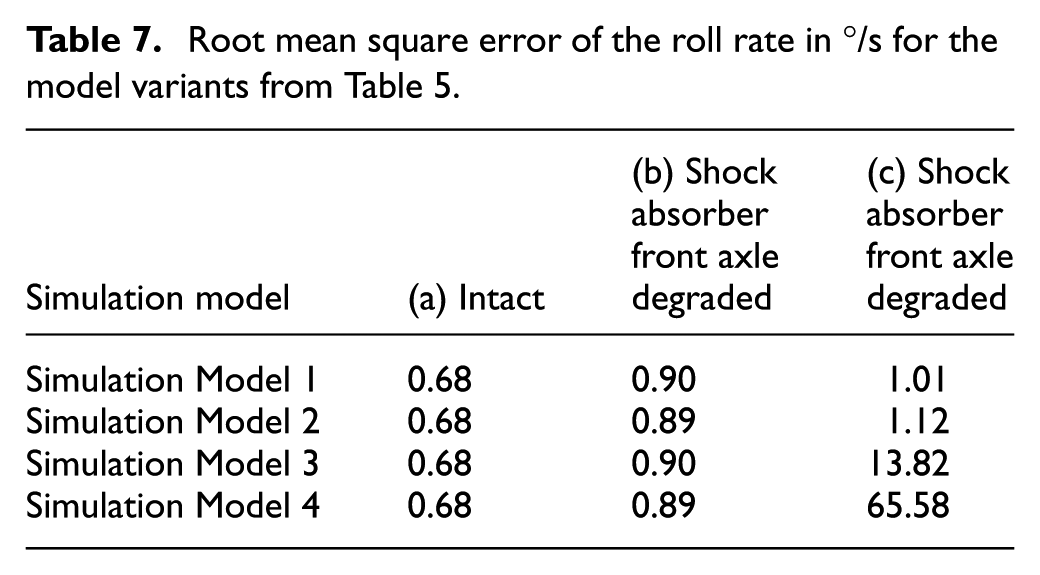
Validating the effect of horizontal forces on suspension friction is handled by conducting sinusoidal steering at 50 km/h with the test vehicle in intact condition and with degraded shock absorbers on either axle. Figures 11 to 13 present the steering wheel angle, vehicle speed, lateral acceleration, yaw rate and roll rate for one measured driving test and for simulations of the different model variants for all three vehicle conditions. The measured steering wheel angle and the measured vehicle speed were used as input variables for the simulations. Table 7 shows the calculated RMSE values for the roll rate of all variants examined. The figures and RMSE values show that the different model variants of suspension friction for the intact vehicle and the vehicle with degraded front axle shock absorbers have no major effect on the values presented. Figure 13 and the RMSE values show unnatural oscillations of the vehicle with degraded rear axle shock absorbers which can be traced to lacking dependencies in the model.
Measured and simulated values of the intact test vehicle for a sinusoidal steering at 50 km/h.
Measured and simulated values of the test vehicle with oil-empty front axle shock absorbers for sinusoidal steering at 50 km/h.
Measured and simulated values of the test vehicle with oil-empty rear axle shock absorbers for sinusoidal steering at 50 km/h.
Root mean square error of the roll rate in °/s for the model variants from Table 5.
Discussion
The applied full vehicle validation methods found the presented phenomenological suspension friction model having no significant effect on the simulations of the intact vehicle and on the vehicle with oil-empty front axle shock absorbers. Furthermore, the simulation of degraded front axle shock absorbers tends to overestimate suspension friction.
Another finding is that the suspension friction model with all its dependencies presented here is necessary for the correct simulation of the vehicle with degraded rear axle shock absorbers. If the dependencies investigated are not taken into account when simulating the vehicle with oil-empty rear axle shock absorbers, the investigated driving maneuvers cannot be simulated correctly. The purpose of this analysis is only to show that the friction model with its dependencies is necessary in order to be able to simulate certain driving maneuvers for vehicles with degraded shock absorbers. However, the results suggest that the consideration of the dependencies shown can also lead to an increase in simulation quality for other applications. In a future study, the friction model presented in this paper can help to investigate the effect of degraded shock absorbers in various states on the driving dynamics of passenger cars.
The dependency of the suspension friction on the deflection of the axle is only taken into account in the presented model via a higher basic friction. This dependency should be investigated in more detail in subsequent studies.
The simulation of the driving tests with oil-empty shock absorbers makes it possible to investigate the effect of suspension friction without the masking effect of the hydraulic shock absorber forces. The findings on the dependencies of suspension friction on deflection velocity and horizontal suspension forces can also be applied to other applications in the future, such as the simulation of vehicles with semi-active or active damping systems.
All tests were conducted on one test vehicle. The results can therefore not be generalized to all vehicles. However, the MacPherson front axle of the test vehicle represents around 80% of all front axles of all vehicles in Germany. 18 The rear axle investigated represents around 40% of all vehicle rear axles in Germany. The figures can certainly be scaled to other countries and the world. Furthermore, the study shows that it can be useful to take into account the dependencies of friction on horizontal forces and deflection velocities when modeling suspension friction.
The study shows for the first time the effect of horizontal suspension forces on suspension friction and their influence on full vehicle characteristics. The findings presented are not applicable to all axle designs. However, the investigation shows that the dependencies on suspension friction presented here should at least be taken into account for similar simulations.
Summary and outlook
In this paper, a mathematical phenomenological model of suspension friction is presented, which takes deflection velocity and oil level of the vehicle shock absorbers, as well as horizontal suspension forces into account. Measurement results from a full vehicle test rig are presented, which show the dependency of suspension friction on horizontal suspension forces. Furthermore, measurements of vehicle shock absorbers in intact and oil-empty condition are conducted, evaluated and displayed. From the findings of the test rig measurements, a suspension friction model is derived and parameterized, which is used in a full vehicle model. Validation of the suspension friction model is conducted through slow speed bump crossings at 8 km/h and sinusoidal steering at 50 km/h with a test vehicle in intact condition, or oil-empty shock absorbers at either axle.
These driving maneuvers are simulated with a full vehicle model testing various suspension friction model variants. It was recognized that the model of suspension friction presented here is particularly necessary to enable correct simulation of driving maneuvers for the vehicle with oil-empty rear axle shock absorbers. It is recommended to extend the suspension friction model to include the dependency of the deflection. The quality of the presented suspension friction model is sufficient to investigate the effects of degraded vehicle shock absorbers on the safety-critical driving dynamics of passenger cars and to develop suspension damping inspection methods based on slow speed bump crossings.
Footnotes
Funding
The authors received no financial support for the research, authorship, and/or publication of this article.
Declaration of conflicting interests
The authors declared no potential conflicts of interest with respect to the research, authorship, and/or publication of this article.