
Abstract
The friction potential of the suspension is typically considered to be invariant as the vertical dynamics of a vehicle are analysed. However, the current research on MacPherson suspensions indicates a strong dependence of the suspension friction on the present driving situation, which is primarily characterised by the wheel deflection relative to the chassis, and the tyre forces. Although it is well known that the shock absorber is generally subjected to side loads that can vary and initiate a certain amount of friction, the precise contribution of the shock absorber friction to the total suspension friction has yet to be investigated in detail. It is therefore essential to conduct a quantitative study on the importance of the shock absorber in the context of specific driving situations regarding the development of new, friction optimised shock absorber generations. The present study investigates the relationship between total suspension friction and the friction of the shock absorber, with a particular focus on the case of wheel lateral forces that aim to represent a simplified cornering manoeuvre of the vehicle. This is realised by using a multi-body simulation approach and a strain gauge application in order to estimate the side force at the shock absorber’s top mount. Subsequently, the shock absorber friction is determined using a test setup that considers the realistic load and mounting situation from the perspective of the MacPherson suspension subsystem. The combination of simulation and shock absorber friction measurement is sufficient to fully explain the characteristic friction trend on suspension (subsystem) level. The contribution of the shock absorber friction to the total suspension friction is determined to be a maximum of 80%, emphasising the importance of considering the side force at the shock absorber while aiming for suspension friction minimisation and ride comfort performance enhancement. On the other hand, the shock absorber’s contribution is also observed to be limited depending on the actual wheel force, indicating that the friction of the other components remains a crucial factor in the MacPherson suspension concept.
Introduction
Understanding all the effects, interrelations and dependencies of the suspension’s components is nowadays more important than ever in the context of an efficient automotive development process aiming at enhanced vehicle safety and dynamics.
While many mechanisms within the suspension are well understood, knowledge of suspension friction is still limited. A recent study on the friction of a MacPherson suspension shows the volatility of the friction with particular emphasis on the tyre forces and moments. 1 In this type of suspension, the twin-tube shock absorber (SA) is used not only for vibration damping but also to control the wheel kinematics. As the spring and SA are mounted together as a strut assembly, giving also the name strut-type suspension, the wheel forces are supported to a large extent by the strut’s top mount (TM), but not only in vertical direction.
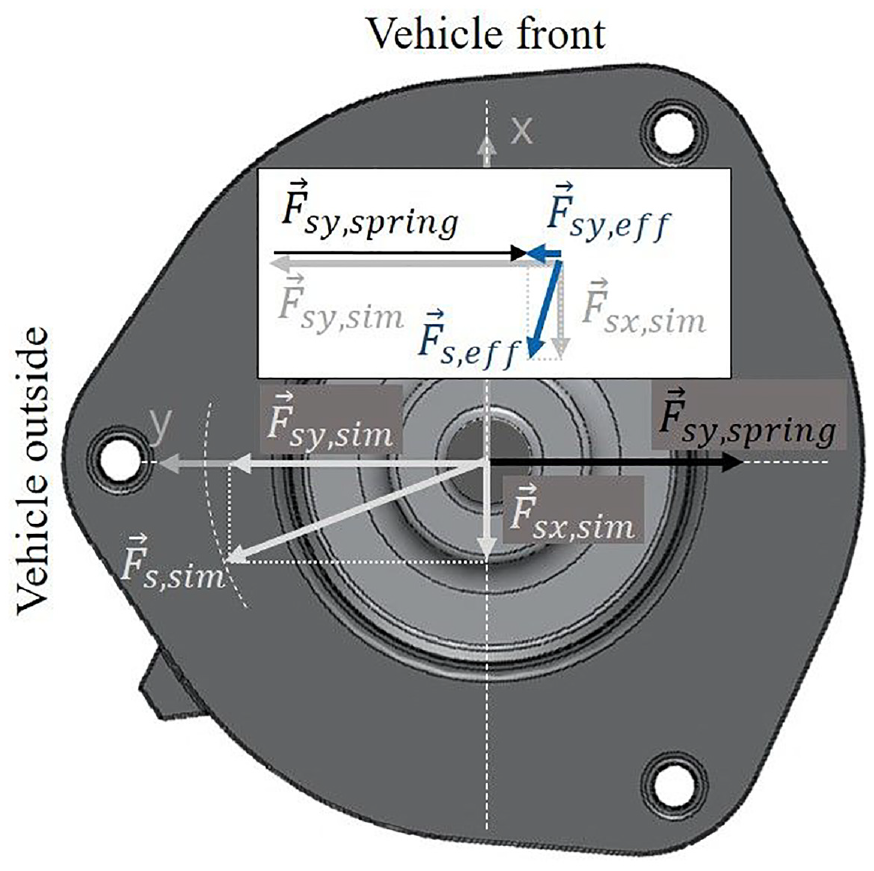
This is particularly true for the lateral and vertical directions as visualised in Figure 1. Therefore, the forces at the tyre contact patch (TCP)
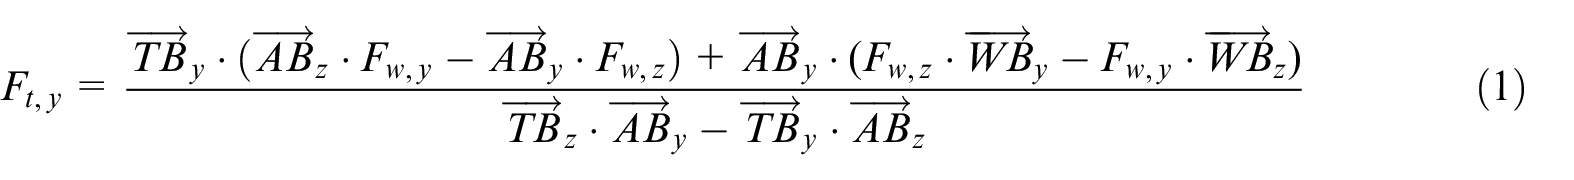
Due to the mounting situation of the SA, the TM forces cause a certain amount of SA side force. However, the extent to which the TM side force influences the shock absorber’s internal contact forces and thus the friction also depends on the spring forces. In MacPherson suspensions, so-called side load springs exert a force directed perpendicular to the SA axis and can thus increase or decrease the SA side force derived from the kinematic and kinetic situation.
Finally, the remaining (effective) side force causes the internal normal (contact) forces

A common approach to decrease the effective normal forces in the SA is to incline the coil spring axis with respect to the SA axis. In the best case, the spring can be highly inclined to achieve
Another approach discussed by Hastey et al.
9
is the use of specialised spring ends. By applying a lower radius at the respective spring ends, it becomes possible to create an inclination angle between the SA axis and the spring force direction. This angle increases during compression and therefore fits well to the generally increasing angle (
Outer forces at a spring-strut suspension (a) and resulting inner SA forces (b).
In real driving conditions, the SA of the MacPherson suspension is subject to volatile side forces corresponding to the forces at the TCP. In contrast, the side force minimisation by the above measures is not highly adaptive, as one specific amount of spring side force exists per deflection position, which is related to the spring’s multi-dimensional and deflection-dependent properties.
Therefore, the SA friction will be minimised for one specific force equilibrium at each deflection level, which will inevitably lead to an increased friction level apart from these states. Following this explanation, it is certain that the friction of a MacPherson suspension is strongly variable, which was presented in a previous study. 1
In contrast, the contribution of the SA friction to the total suspension friction for a specific driving situation has not yet been demonstrated in the literature. However, specific knowledge on this subject may enable the developer to assess the need of altering SA friction by proper design and material selection versus other factors, such as costs or durability.
Based on the above discussion, the contribution of paper can be summarised as:
Identification of the present side force at the shock absorber depending on the kinematic and kinetic state of the suspension, which in turn is affected by the driving scenario.
Determination of the shock absorber friction contribution to the total suspension friction.
Assessment of the shock absorber significance in terms of suspension friction optimisation.
The study follows the process outlined in Figure 2 and is based on quasi-static load cases in which a variation of TCP lateral force is applied for five definite suspension displacement levels (see Section ‘Suspension friction for definite load cases’). In order to enhance understanding of the outlined process, the load cases are kept relatively simple, but the methodology can easily be applied on more complex or combined scenarios, as the necessary steps to determine the SA contribution are basically the same.
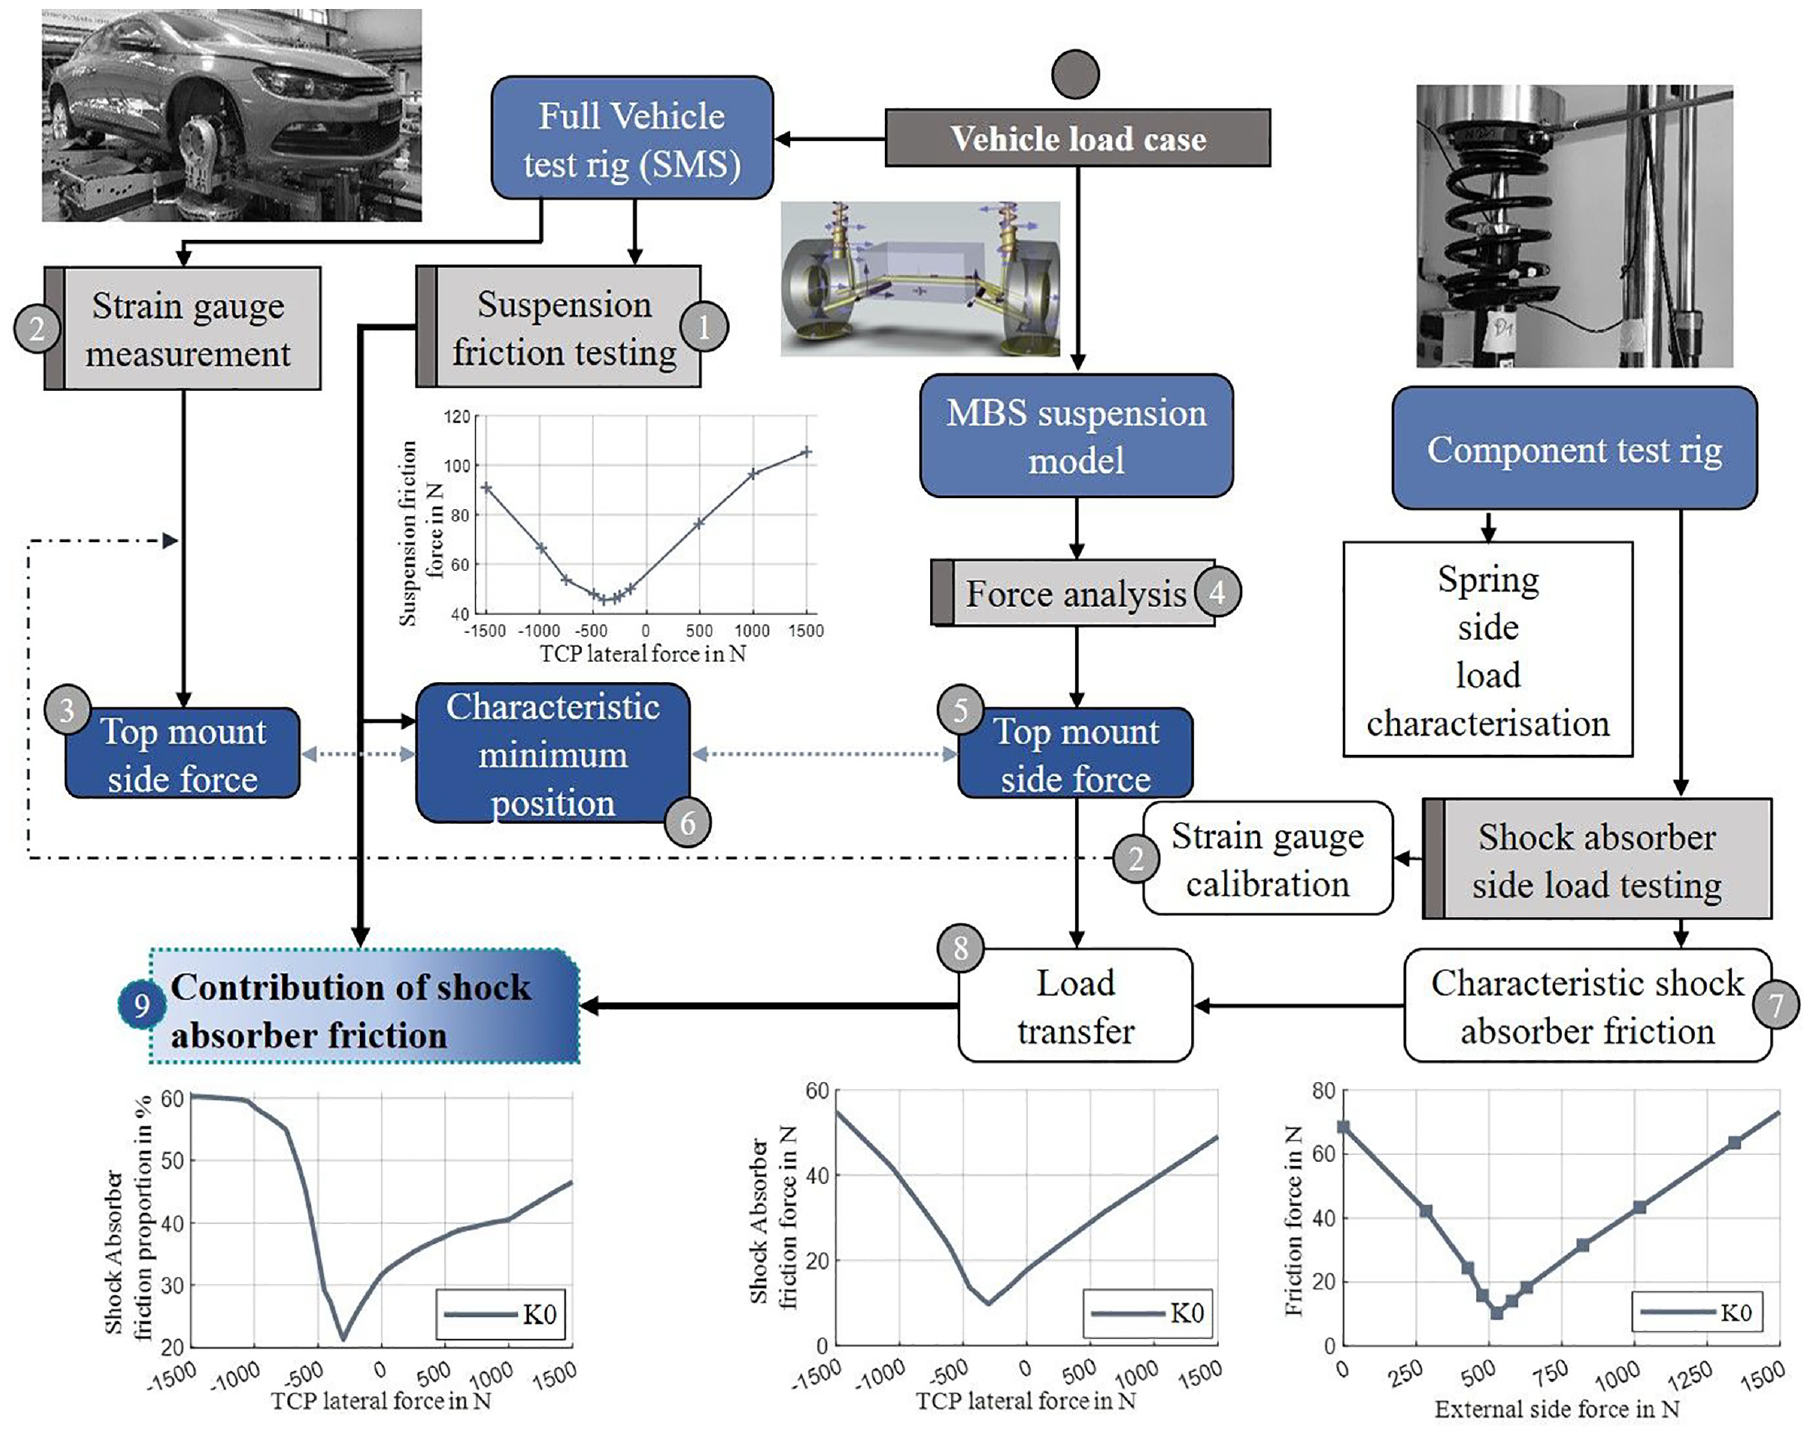
Process chart to evaluate the contribution of SA friction to the total suspension friction.
Firstly, the characteristic suspension friction (1) is presented in Section ‘Suspension friction for definite load cases’. By using a strain gauge application on the shock absorbers, which are calibrated on the shock absorber/strut test rig (2), the TM side force can be determined by experiment (3). In parallel, the same load case is applied to a multi-body system (MBS) model (4) allowing the side force to be determined by simulation (5). Following the hypothesis that the characteristic friction curve on suspension level is primarily caused by the SA, the characteristic curves of the suspension friction and the TM side force are compared (6). This is demonstrated in Section ‘Shock absorber side force determination’. By transferring the side force on full vehicle level, that is, expressing SA friction as a function of side force, the corresponding SA friction is determined (7, 8) in Section ‘Shock absorber friction’. Finally, the load case-specific contribution of the SA friction to the total suspension friction is investigated (9). A conclusion is provided in Section ‘Conclusions’.
Suspension friction for definite load cases
Based on a preliminary investigation,
1
a strong dependence of suspension friction on the TCP forces and moments is evident. The suspension friction is determined on a full vehicle test rig. The test vehicle is a VW Scirocco III, model year 2008. As this study focuses on simplified cornering manoeuvres, the following load case variation is investigated: A combined variation of the TCP lateral force
▪ Adjustment of the desired static wheel deflection.
▪ Applying a static TCP lateral force and therefore loading the suspension.
▪ Performing a quasi-static triangular excitation of the wheel at an amplitude of 3 mm.
▪ Controlling the other tyre forces and moments (except for the vertical force
Then, the suspension friction was determined by half the height of the vertical force-vertical displacement hysteresis. The experiment was repeated for any desired value of lateral force and deflection, represented each by a marker in Figure 3. Regarding the lateral force, an overturning moment resulting naturally from the axle caster trail multiplied by the lateral force is created and must be resisted by the fixed steering rack (by means of a steering wheel fixation). In this respect, the lateral force load case realistically represents a cornering manoeuvre, with the simplification that the steering wheel was kept in the centre position and the wheel deflection was set equal on both wheel sides. Therefore, the stabiliser came not into action.
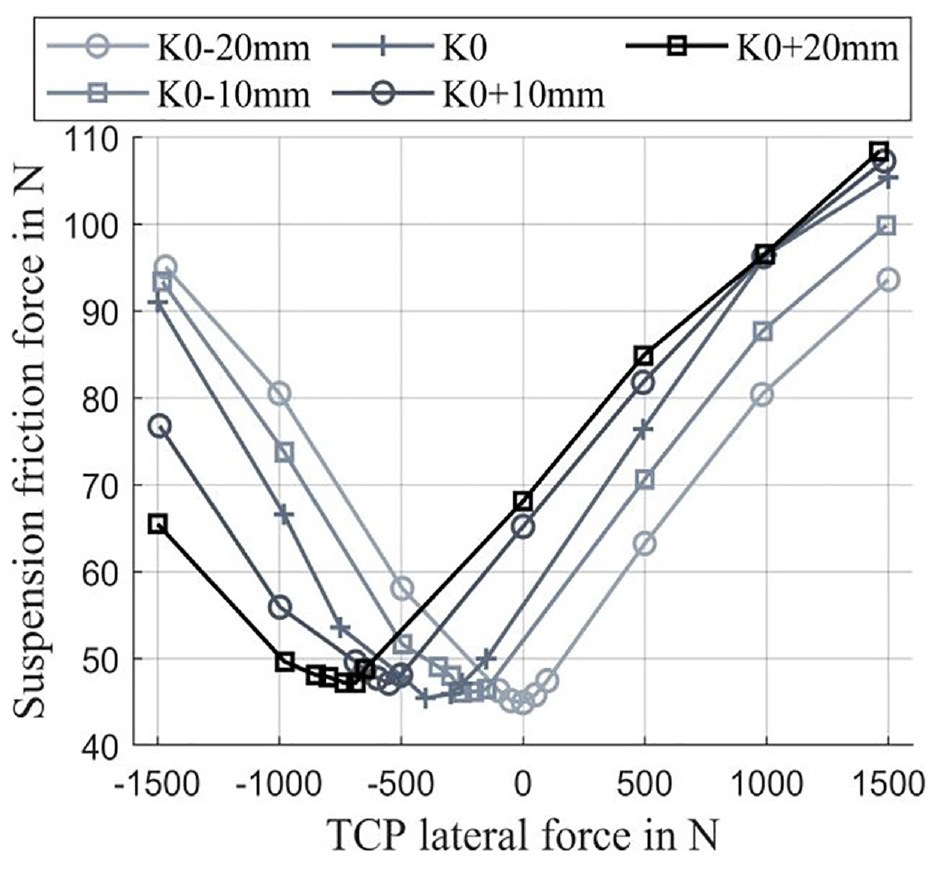
Combined lateral force and wheel deflection variation, displayed for the front left wheel side.
The original wheels were replaced by a spindle couple in order to accurately determine suspension friction by excluding the effect of the tyre on the recorded vertical force. Refer to the previous study 1 for further information regarding suspension friction testing.
Figure 3 presents the suspension friction of the combined lateral force and wheel deflection variation for the front left wheel side. A bi-linear curve shape is obtained for each deflection level and the indicated friction force minima are altogether located between 45 and 50 N. For each deflection level, there is a specific amount of SA side force in the nominal condition (i.e. without any external forces or moments except for the vertical tyre force), which is then minimised by a specific TCP lateral force. The results of the front right wheel side are almost identical with regard to the amount of friction and the minimum positions on the x-axis.
The primary hypothesis is that the suspension friction minimum will also result in a minimum of SA friction. The objective of this study is to demonstrate the relationship between SA and suspension friction by investigating the physical suspension mechanisms and the significance of the SA side force. This is exemplarily performed for the front left wheel side throughout this study.
Shock absorber side force determination
Before studying the side force by simulation and experiment for the described load case, some frequently used terms are introduced here:
▪ Side force (SF) generally speaking represents the force acting on the strut, which is directed perpendicular to the strut’s compression/rebound axis.
▪ Top mount side force (TM SF) is the raw side force acting at the interface TM – chassis of the vehicle. It is termed raw because it is typically altered by the spring characteristics. This constitutes the primary force later determined by experiment or simulation.
▪ Nominal (TM) side force is a specification of the above, that is, the determined SF for a specified suspension deflection level but without any additional forces or moments applied to the TCP.
▪ External TM side force is the applied SF on the strut’s TM on the hydropulser test rig (strain gauge calibration, strut/SA friction measurement).
▪ Spring side force is the SF applied by the spring in the strut subsystem, which alters the raw TM SF. The spring side force is a horizontal force directed perpendicular to the strut’s compression/rebound axis.
▪ Effective side force is the residual SF experienced by the SA after the TM side force is altered by the spring SF. This force has a direct impact on the SA’s inner contact forces and thus on the friction forces.
Methodology to determine side force by strain gauges
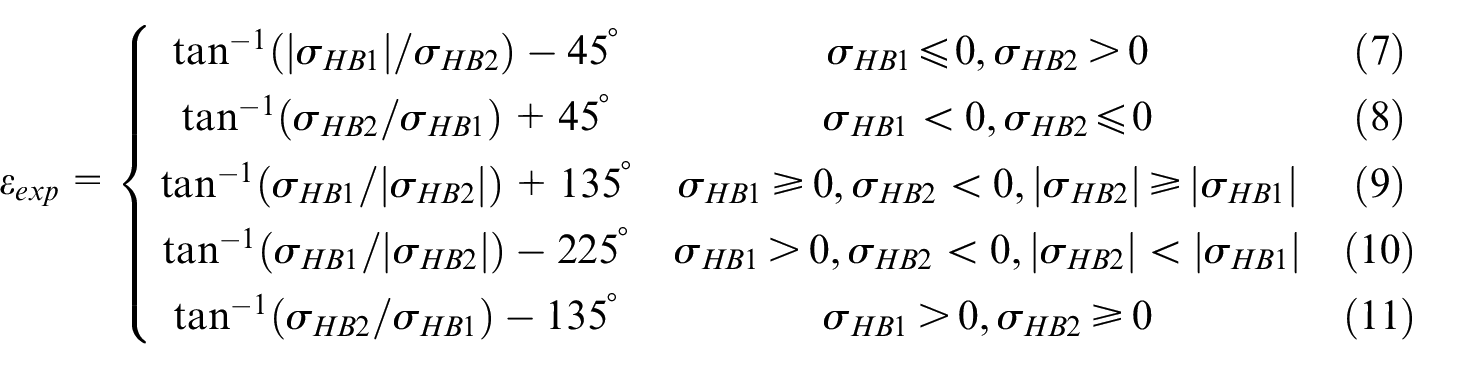
In order to determine the SA side load experimentally, two bending sensitive strain gauge half-bridges (HB) were applied on each SA housing according to Figure 4. They are offset by 90° to each other and by 45° to the reference coordinate system (x, y), which marks the SA standard orientation. This setup allows the angle
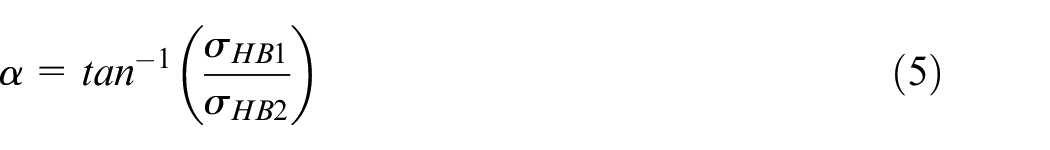

The individual strains as well as the total strain are a consequence of the TM SF and subsequent bending. The calculated angle
The strain gauge setup was calibrated on the hydropulser test rig. In a previous study 12 the loading of the strut in the suspension was investigated using a finite element simulation. As a result, a corresponding test setup was developed that considers the realistic mounting and load state of the strut in the MacPherson suspension. This setup is illustrated in Figure 5. The cylinder bottom is fixed to the hydraulic excitation unit, whereas the upper piston rod end is mounted freely using a combination of two linear bearings. These bearings also facilitate a tension-free mounting and the necessary degree of freedom to apply an external SF to the TM. The external SF (up to 1500 N) is applied by a pneumatic cylinder and measured by a separate load cell. Appendix A provides a list of dimensions of the SA for interested readers.
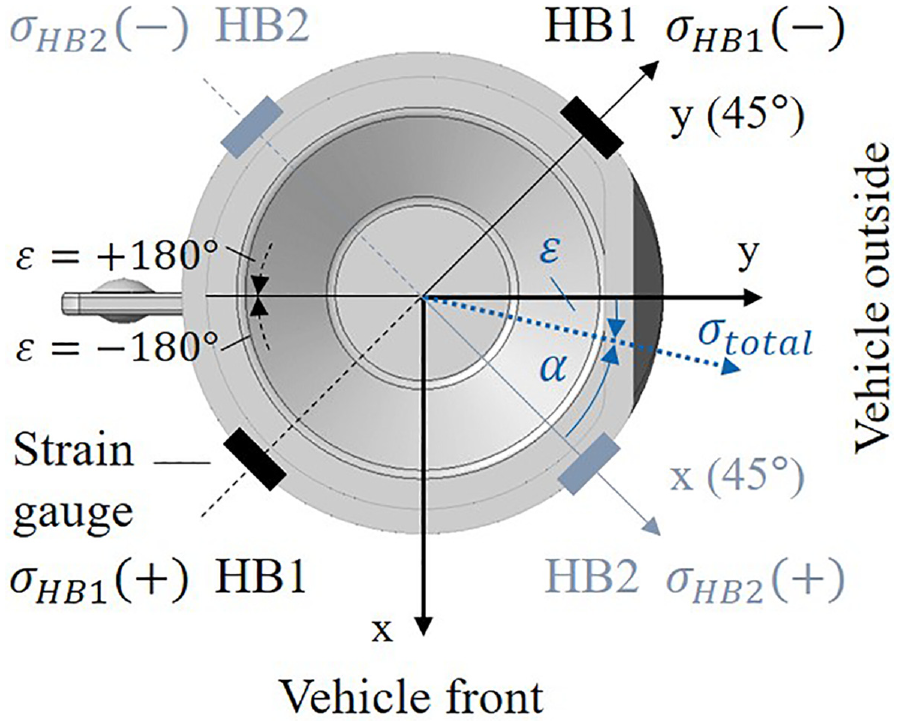
Top view on SA profile with applied HBs.
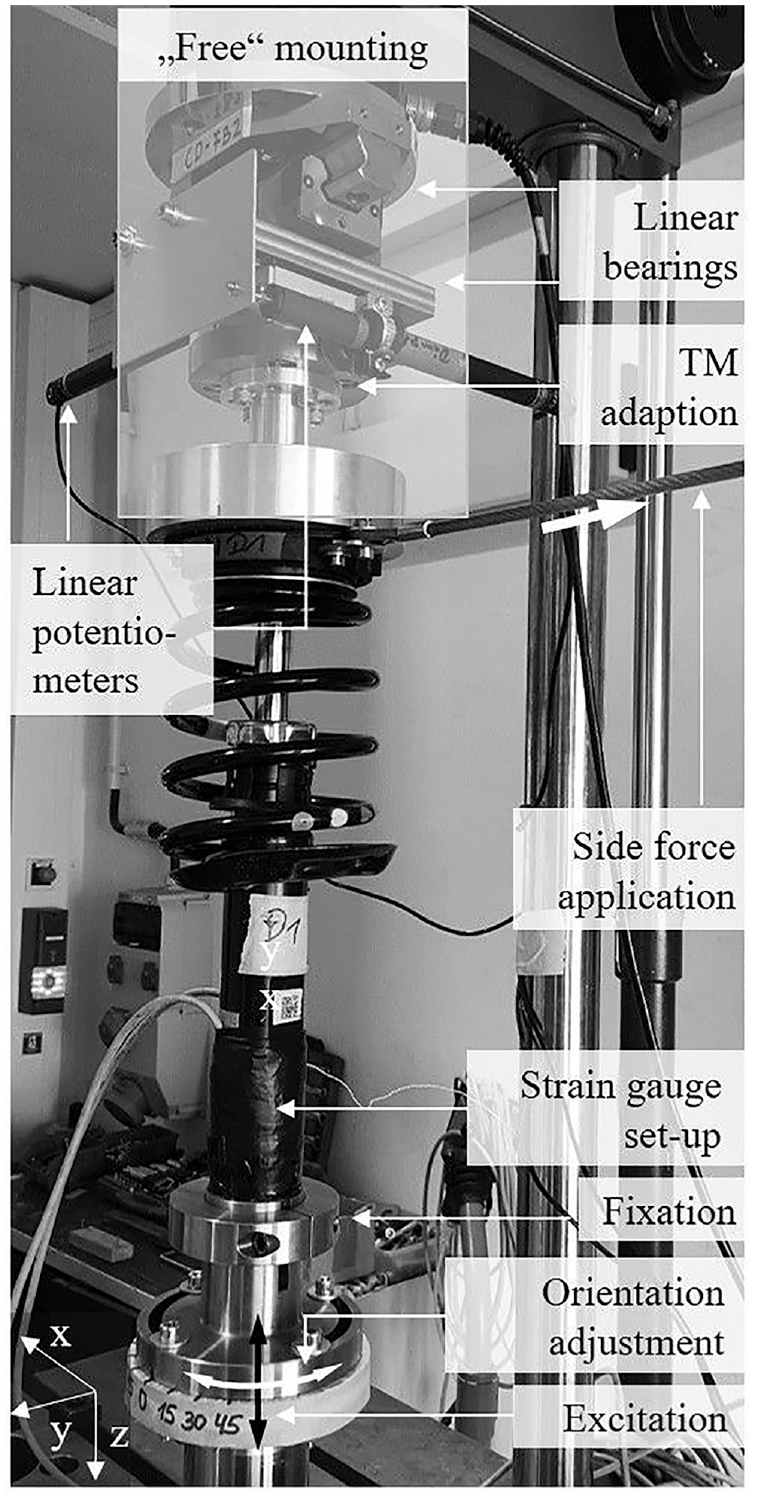
Calibration of strain gauge setup under SF (strut assembly).
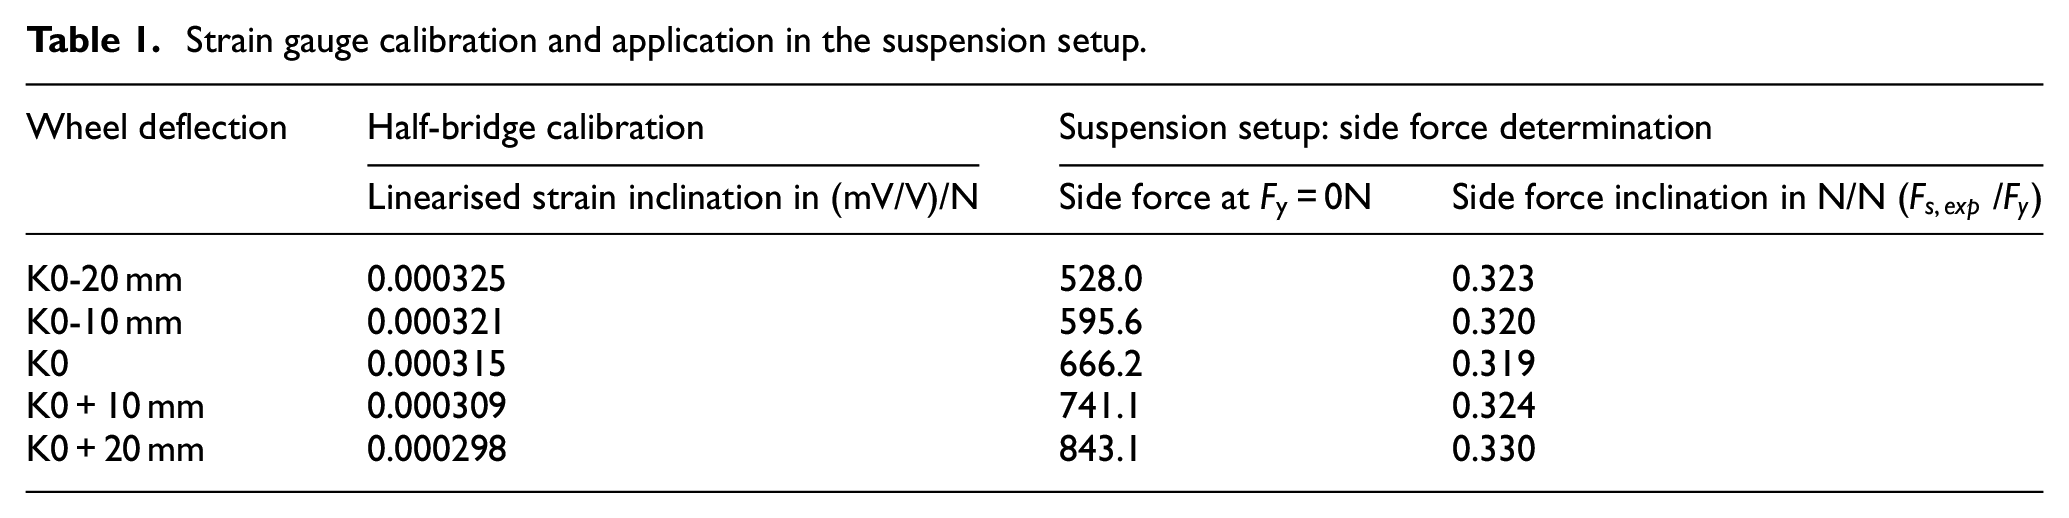
For each SF level, the total strain was calculated, resulting in a linear inclination of the same according to Figure 6(a). The more the SA is deflected (compressed, i.e. K0-20 mm → K0+20mm), the lower the inclination of the linearised strain, because the decreasing effective lever of the SF by the means of the free piston rod length results in decreasing bending moments (Table 1).
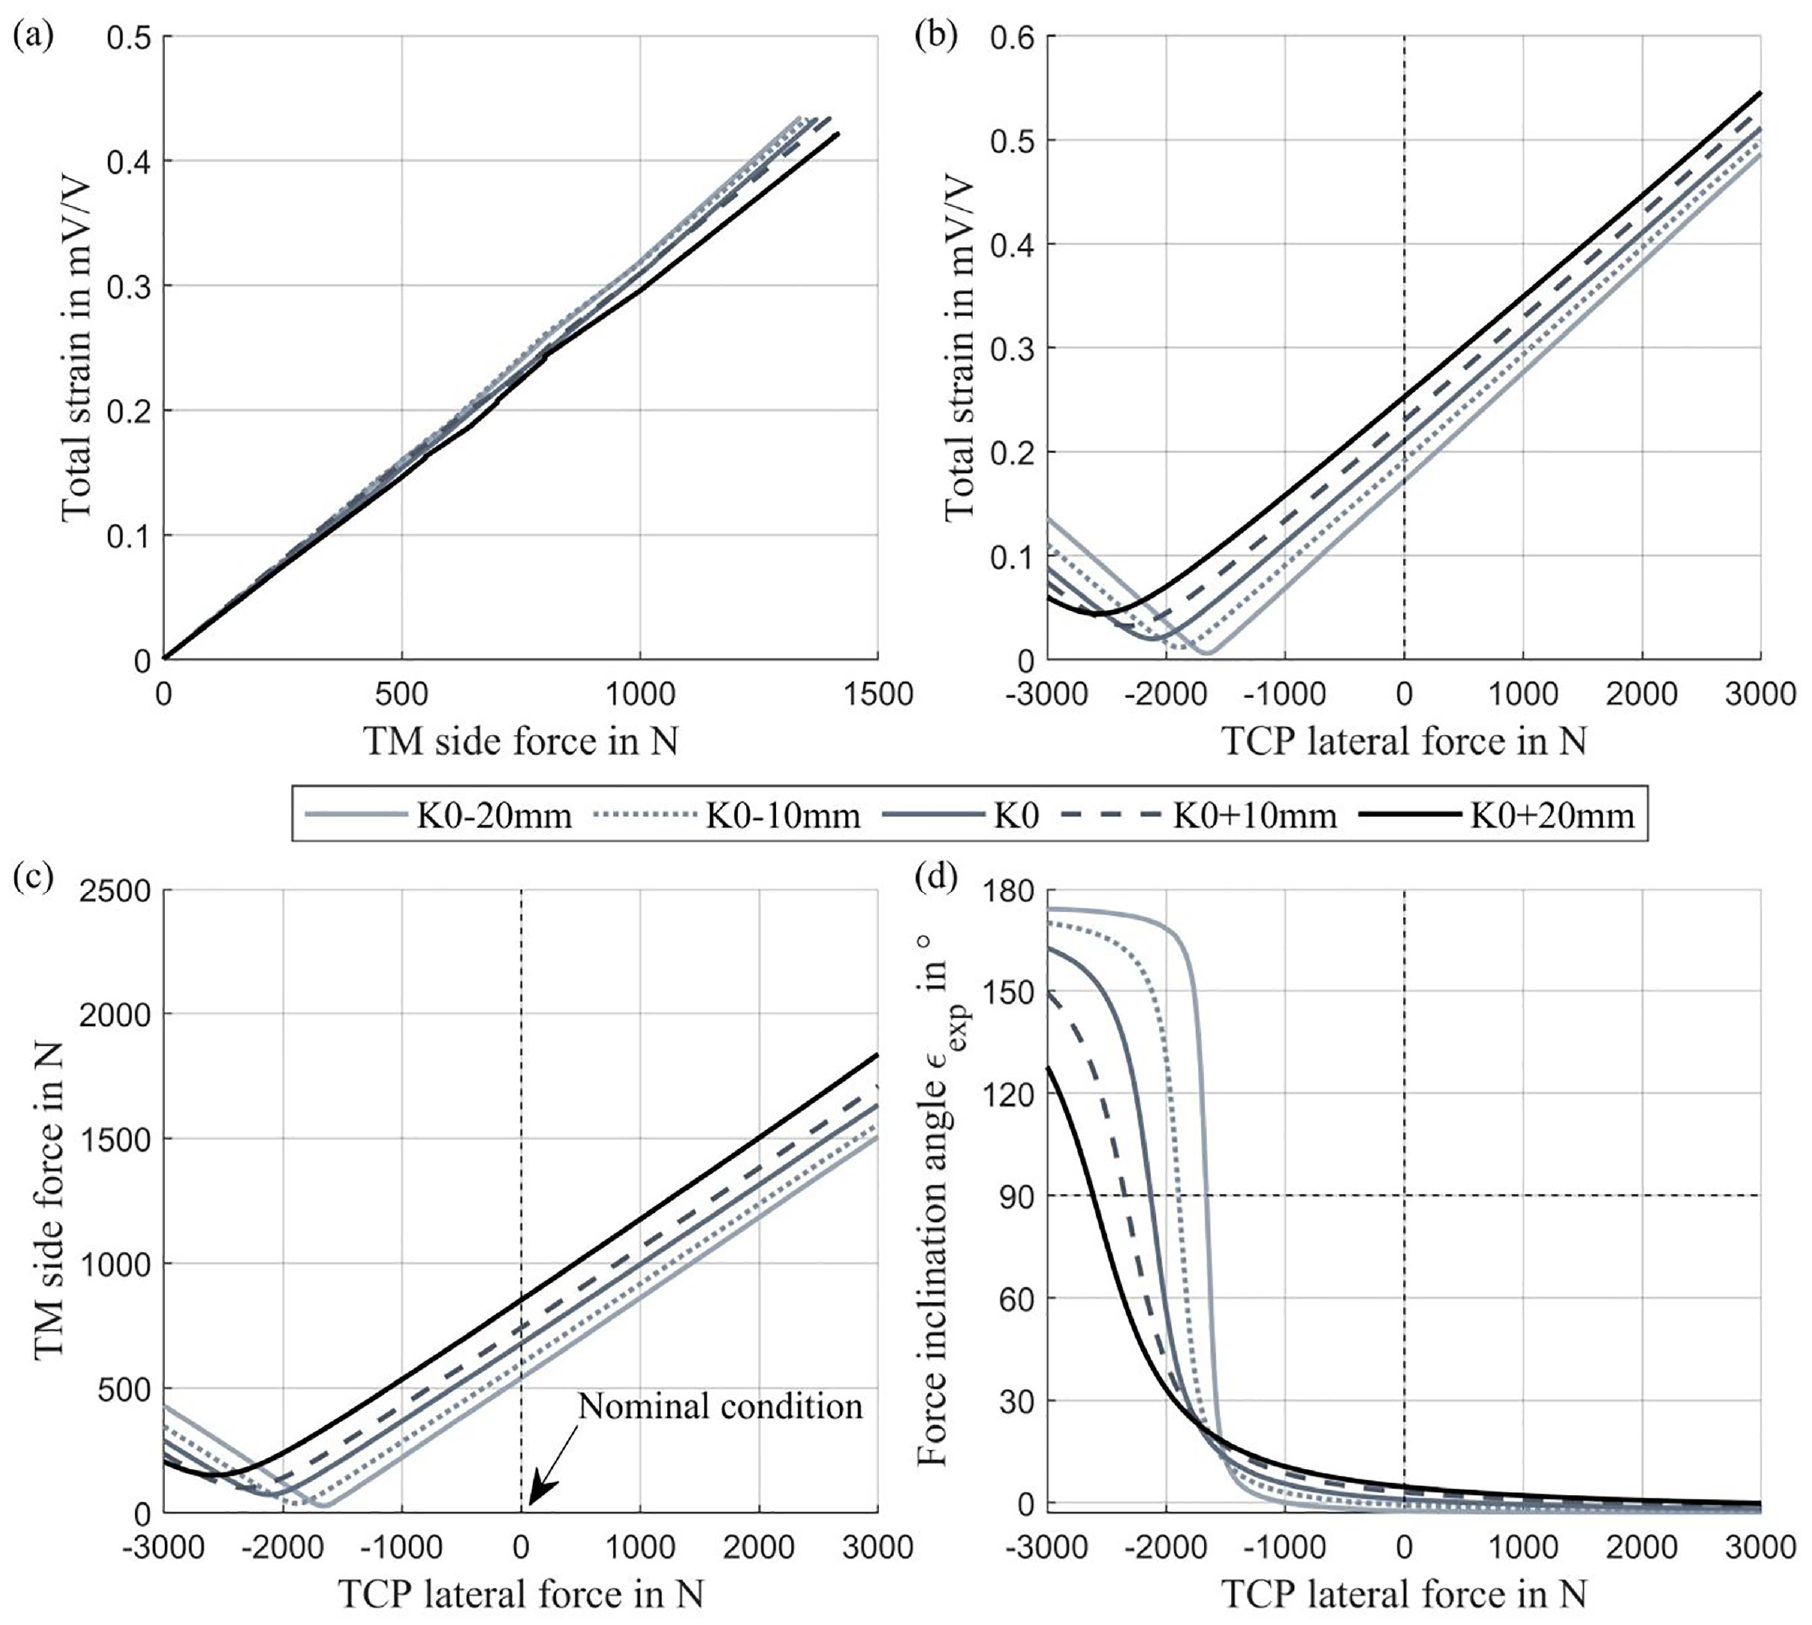
Strut strain gauge calibration (a), measured strain when assembled in the vehicle (b), and calculated TM SF (c) and SF angle (d).
Strain gauge calibration and application in the suspension setup.
After calibration, the SA was remounted in the suspension, and the strain was determined for the load cases previously presented (Figure 3). By linking the strain to the SF (calibration, component level) in Figure 6(a) and subsequently the strain to the TCP force/moment (suspension test, suspension level) as in Figure 6(b), it becomes possible to investigate the relationship between TCP force/moment and the TM SF in an experimental setup. Thus, when the SA compression state and the strain amounts are known, the acting SF (Figure 6(c)) and its direction (Figure 6(d)) are explicitly defined. Moreover, this setup can be used for road tests; then the steering wheel or wheel angle must be considered, too.
With regard to (Figure 6(b)), it is evident that the strain obtained in the nominal condition increases the higher the compression level, that is, at zero TCP lateral force. This is because of the higher wheel loads supported by the TM and the increasing inclination of the shock absorber. Correspondingly, this results in higher SFs and a shift of the SF minimum to lower TCP lateral forces, refer also to Table 1. This is consistent with the outcomes of the suspension friction setup (Figure 3), but there is a gap between the characteristic minima of the friction graph and the SF graph in terms of TCP lateral force, as the spring characteristics were not yet taken into account. This is discussed in a later section in detail.
The SF angle created by the external force is almost constant for the varied deflection states (Table 1). As a basic rule, 3 N of TCP lateral force is required to create 1 N of extra TM SF, which increases the SA friction as demonstrated in Section ‘Shock absorber friction’.
It is also evident from Figure 6(d) that the angle is close to 0° both in the nominal condition and for vehicle-outward directed TCP lateral forces. Consequently, the TM SF is likewise vehicle-outward directed. In the nominal condition, meaning the state free of external TCP forces and moments (Figure 6(c)), the corresponding nominal SF is a consequence of the strut loading (compression) by the vehicle weight.
As the TCP lateral force is reversed, the nominal TM SF is successively compensated by the increasing inward-directed (i.e. negative) TCP lateral force. Once the TM SF minimum is reached, the nominal SF is thus completely compensated by the external TCP lateral force. For even larger negative TCP lateral forces, the SF angle increases and converges to +180°. The TM SF increases again and the vector is thus inward-directed. In the transition area until considerable SFs are created again, the SF is primarily directed backwards (+90°). This indicates a residual amount of SF that is not cancelled by the TCP lateral force (which solely creates SFs in lateral direction). In other words, this signifies a longitudinally directed SF remaining as a result of the nominal state, that is, resulting from the TCP vertical force.
Methodology to determine side force by simulation
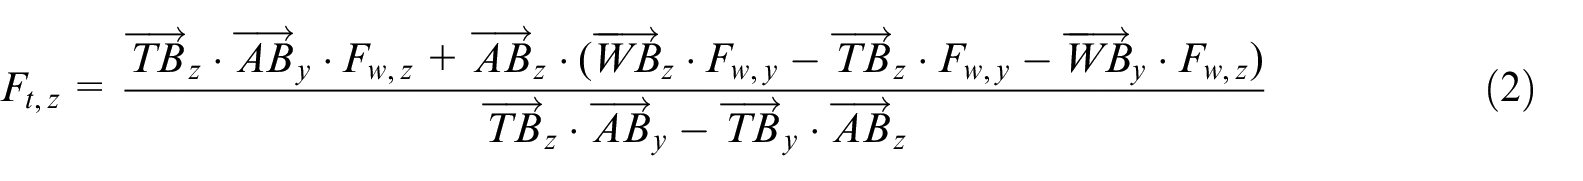
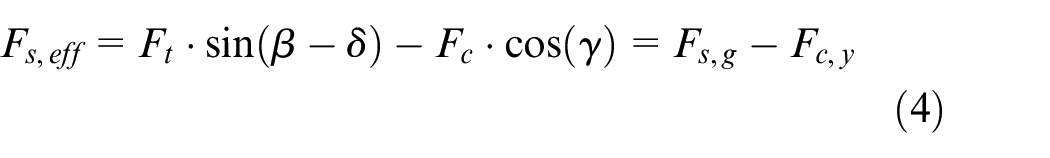
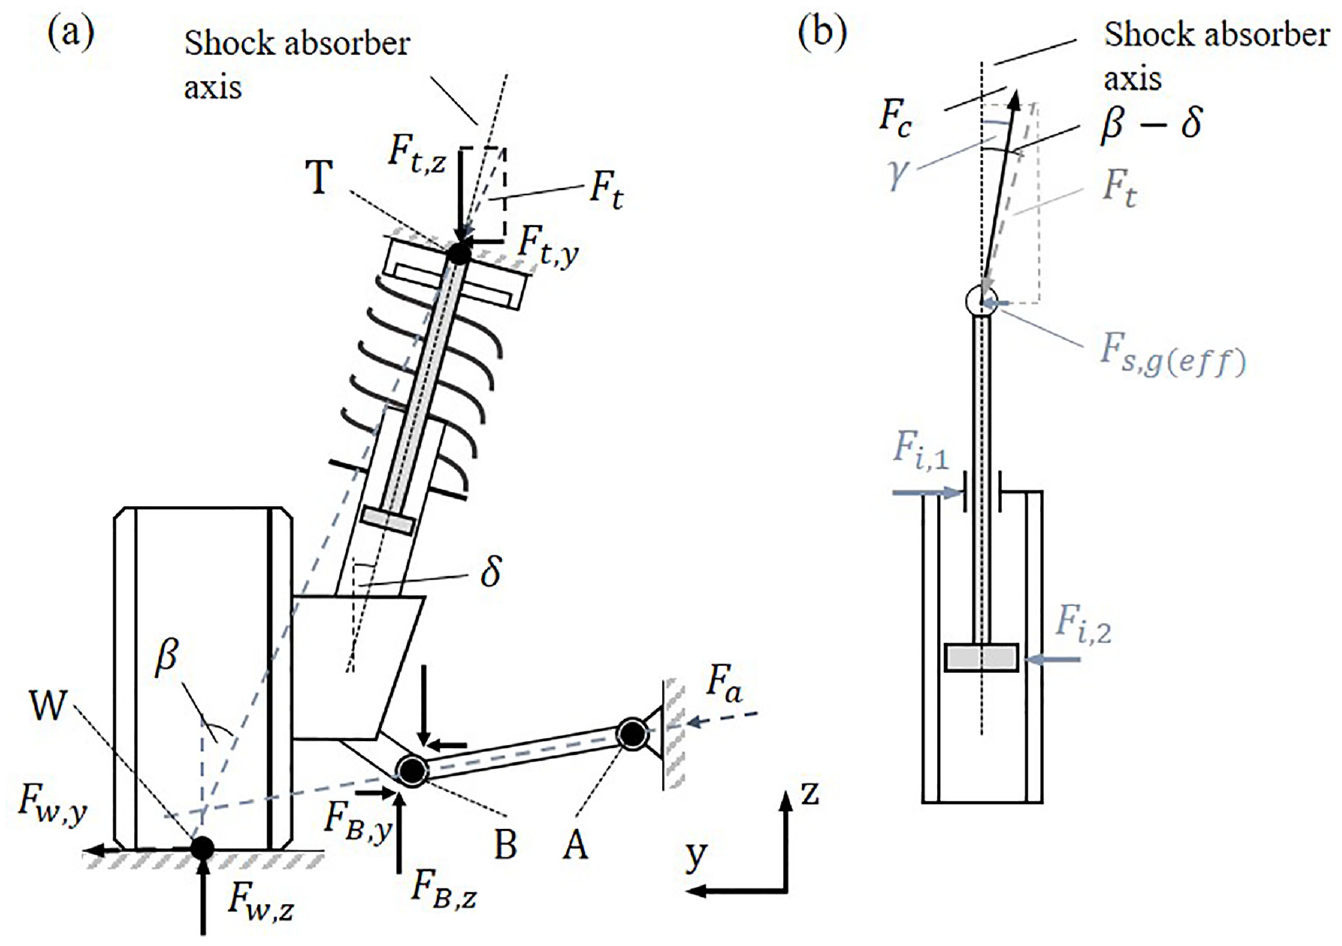
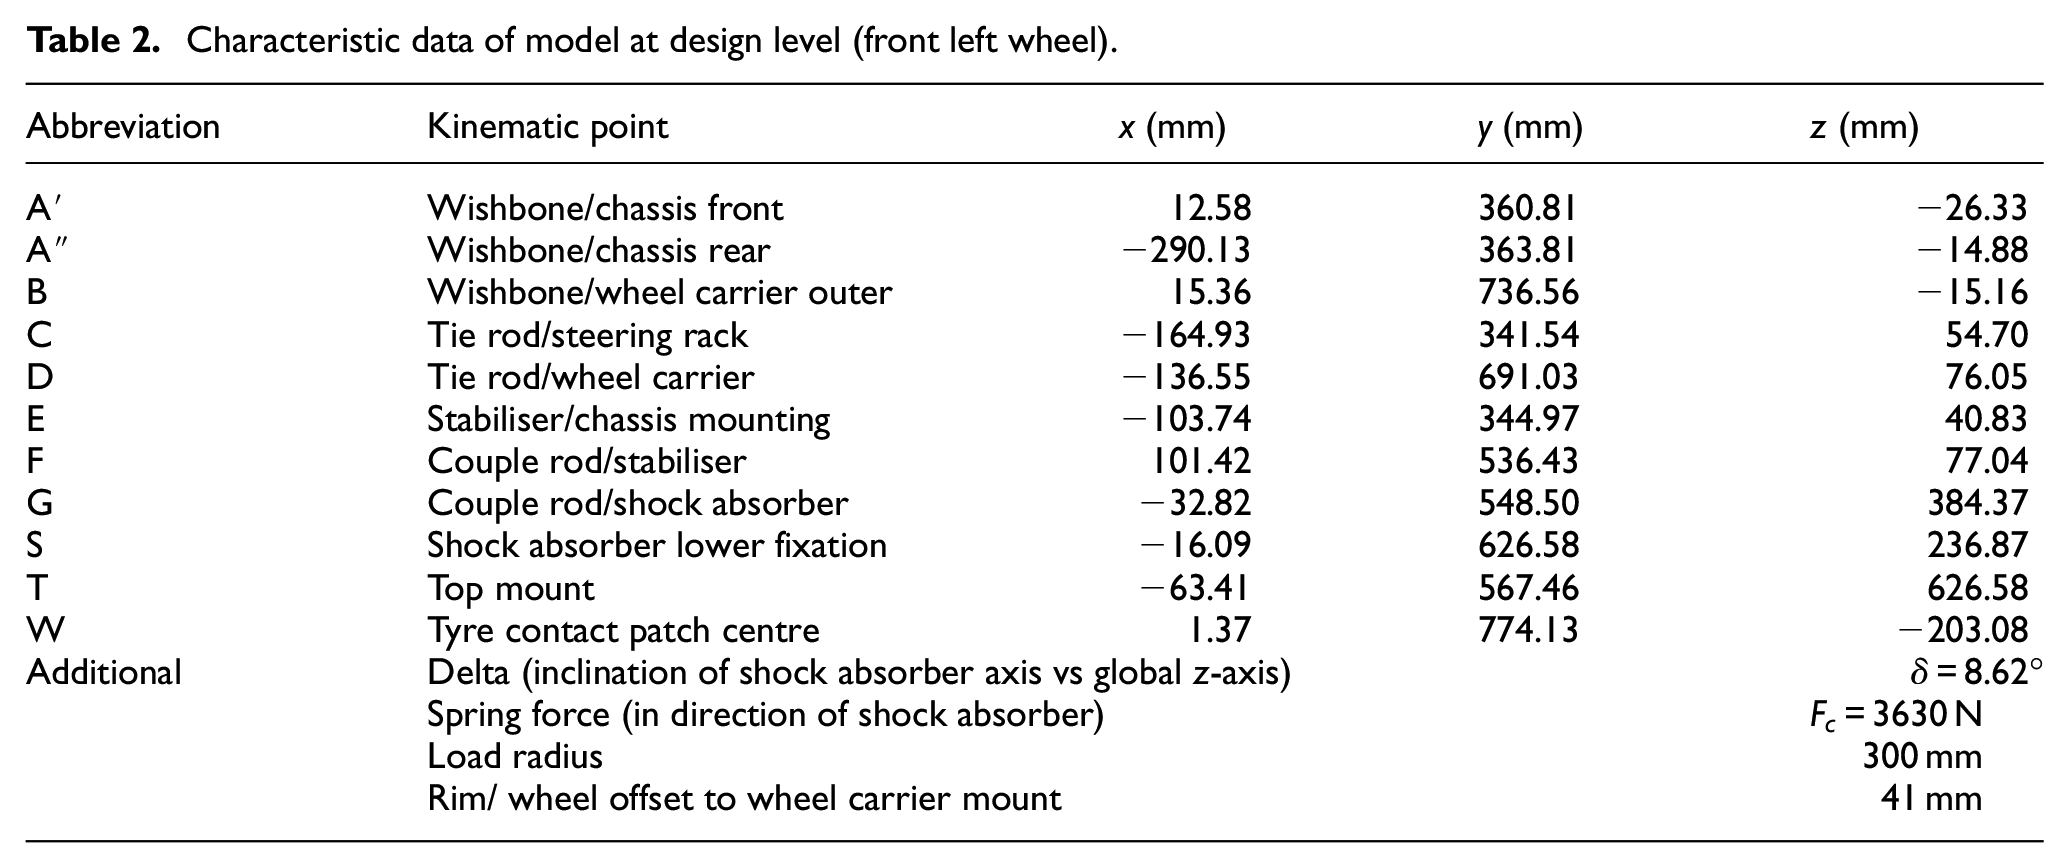
The SF can also be determined from the force equilibrium according to equations (1)–(4), or more accurately in three dimensions using an MBS model of the suspension. The suspension was reverse engineered 13 to determine the kinematic points, suspension component masses, component centre of gravity, etc. Figure 7 shows the model structure and its implementation in the software Simulation X. Table 2 provides the used kinematic points and other properties for the design level of the front left wheel, which is characterised by a free piston rod length of 108 mm (i.e. strut deflection) and a wheel load of approx. 4000 N.
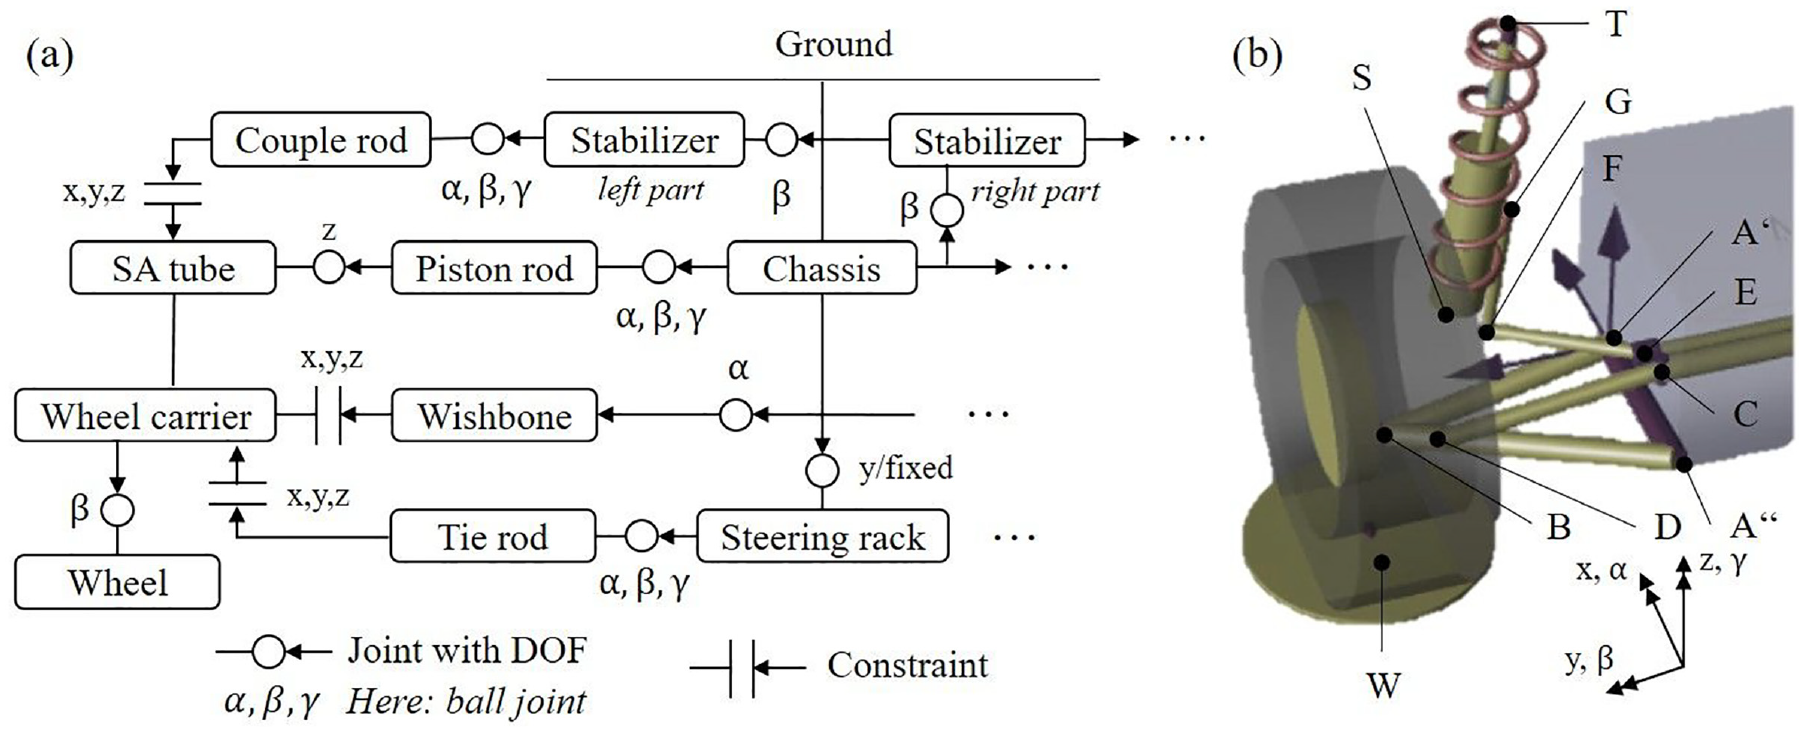
MacPherson kinematic model structure (a) and visualisation in Simulation X (b).
Characteristic data of model at design level (front left wheel).
The following simplifications were made:
The model was created as a kinematic model, that is, the visco-elastic properties of the suspension bushings were unknown and thus not implemented.
The suspension elements were treated as massless. This is valid as the SF is a result of the supported sprung mass (and the subsequent wheel or spring compression). The unsprung mass is of no relevance as long as the wheel is on the ground. The simulation was carried out in a stationary manner and so there are no inertial forces.
The simulation was carried out for one wheel side (front left) and no stabiliser was implemented. The effect of the stabiliser and the couple rod by means of introducing additional forces to the SA, which are connected at joint G, was not considered in this study. This represents a parallel wheel travel omitting any stabiliser action.
The tyre constitutes a rigid connection in vertical direction with the platform in analogy to the suspension friction experiment.
Before determining the SF, the importance of the side load spring must be highlighted. Besides the horizontal forces, there is typically a spring offset (i.e. eccentricity vs the SA axis), which determines the application point of the spring force. For concentric springs, this point corresponds exactly to the kinematic point T, which is the simplified upper joint of the SA. For non-concentric springs, T is shifted within the TM plane by the offsets in the local x- and y-directions resulting in a modified point T′. In general, shifting T vehicle-outwards will decrease the TM lateral force, as the angle
Figure 8(a) shows the piercing points of the spring force vector in the planes of the lower spring seat and the TM chassis (mounting) plane.
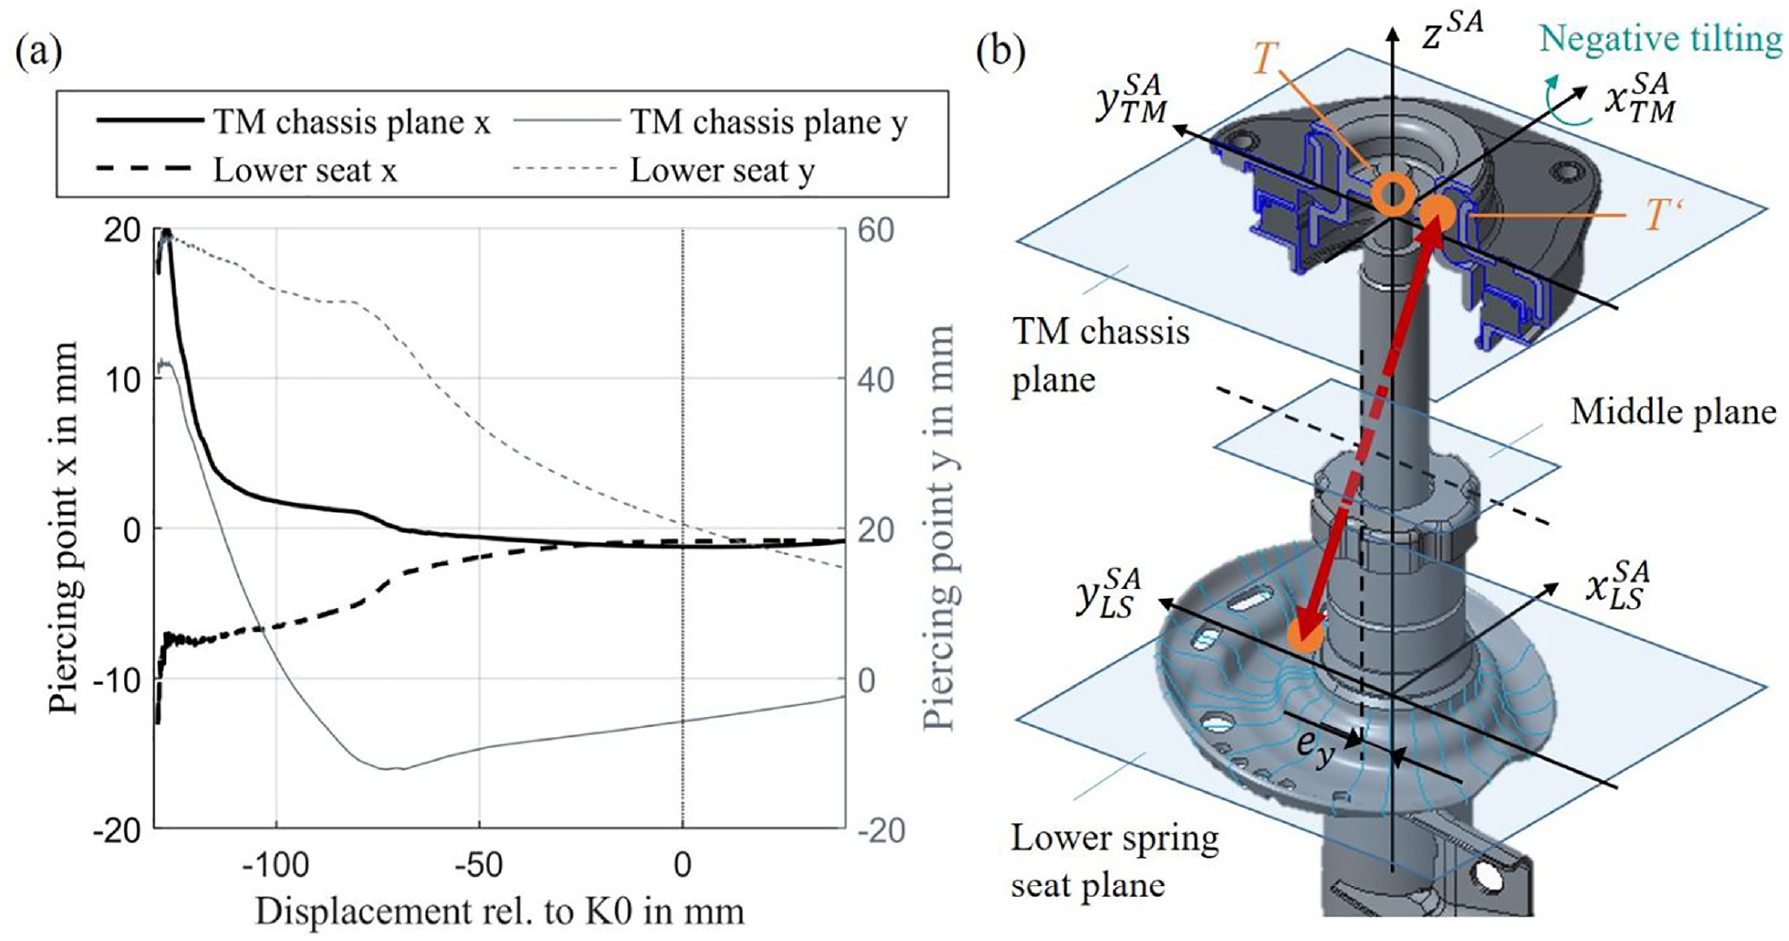
Spring offsets depending on plane of interest (a) and visualisation of spring force vector at design level (K0) (b).
For the given suspension and design level, Figure 8(b), T′ is shifted vehicle-inwards by 5.7 mm. This is detrimental regarding the SA side force, which increases by approx. 5%. An inclination of the spring force vector in the local y-z-plane as shown is the prerequisite for generating large SFs (refer to Table 4). In this case, the spring was designed with a nominal eccentricity in lateral direction
Regarding the local x-direction, the inclination of the spring is close to zero, so the longitudinal forces are close to zero, and the offset is also close to zero around the design level.
The nominal SF of the SA system, without considering the spring SF, is calculated to
In analogy to Section ‘Methodology to determine side force by strain gauges’, a variation of lateral forces was applied at the TCP for five suspension deflection levels, and the amount of simulative SF
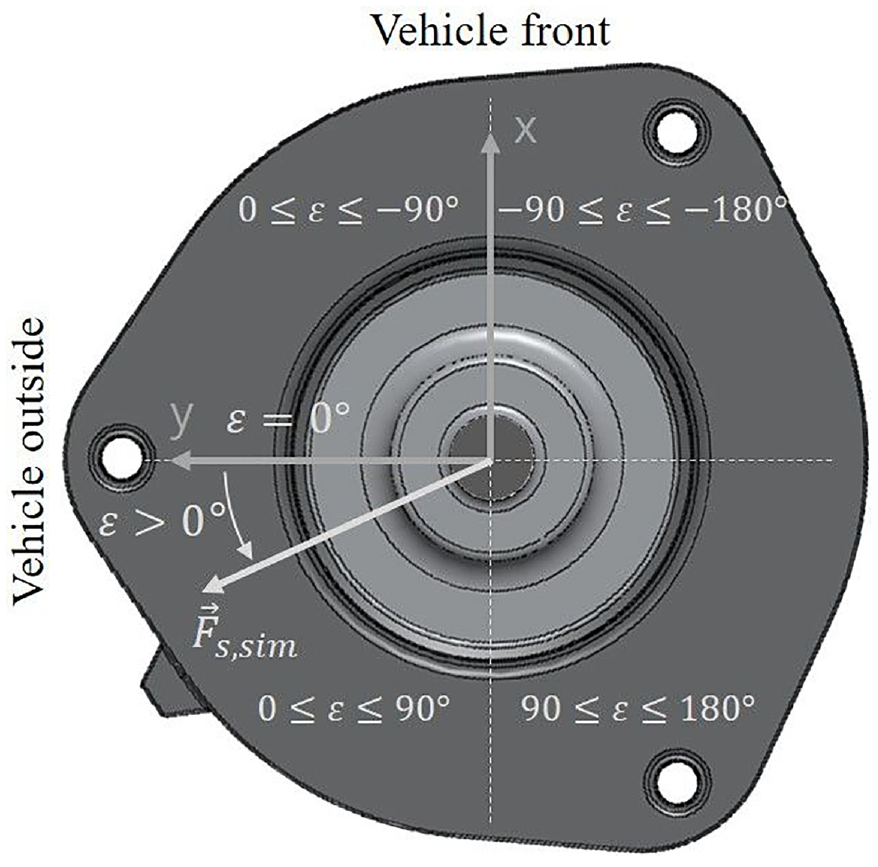
View on top mount with coordinate system of SF orientation.
An angle
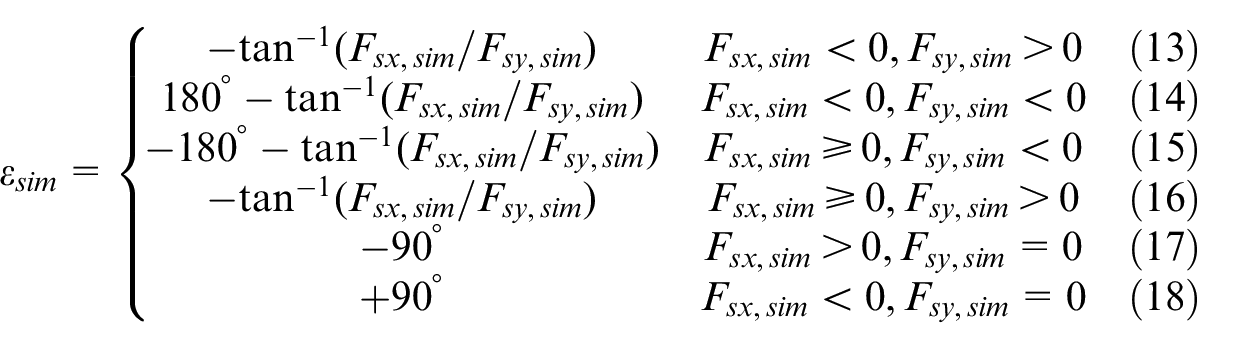
Figure 10 presents the results of the combined lateral force-deflection variation, which are in good agreement with the physical strain gauge experiments. For positive TCP lateral forces, the SF is also directed to the outside (
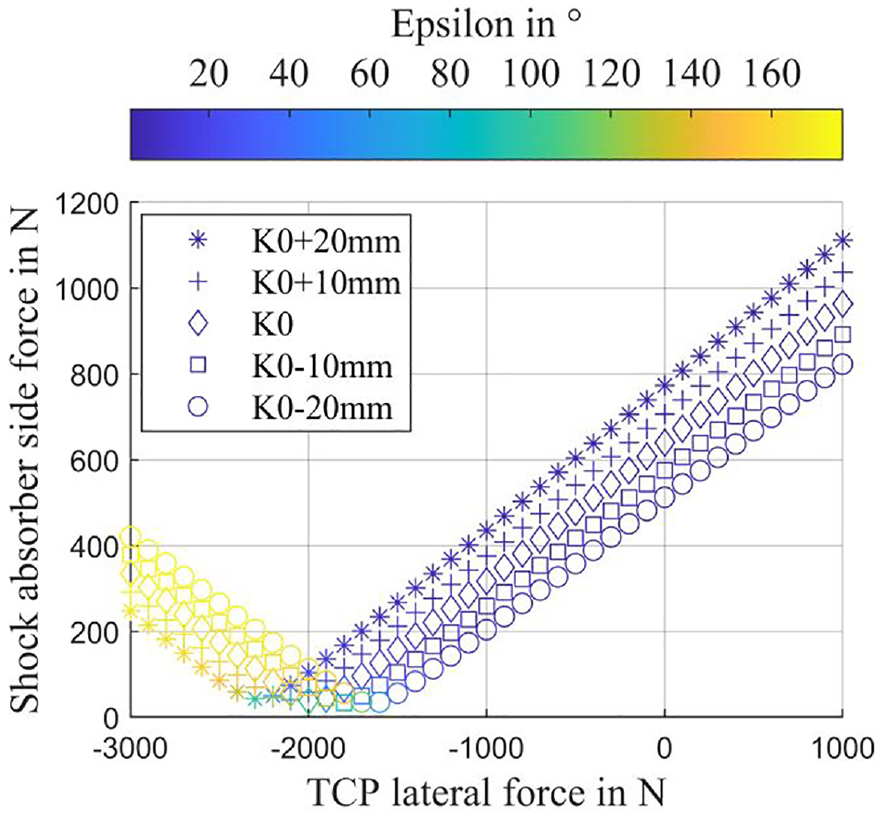
Calculated TM SF and SF angle as a function of TCP lateral force.
The remaining SF x-component is insignificant and is not compensated by the TCP lateral force. Because of this minor longitudinal force component, the SF vector will show predominantly in the local y-direction, once the amount of SF exceeds a certain threshold.
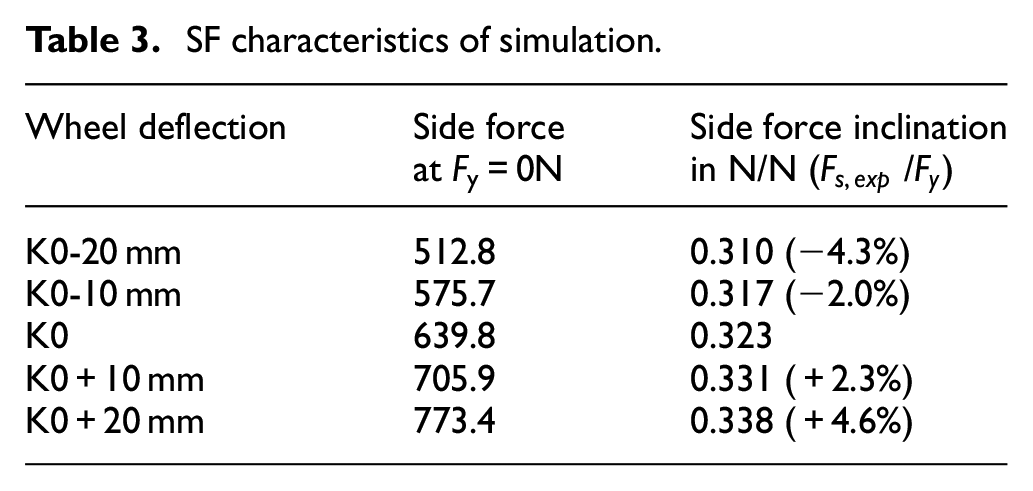
As illustrated in the preceding experiments, the nominal SF increases at higher deflection states resulting from higher wheel loads and increased SA inclination. Furthermore, the ratio of SF and TCP lateral force increases with increasing deflection, see Table 3. Similar values between 0.31 and 0.33 are found in agreement with the experimental investigation.
SF characteristics of simulation.
Comparison of detected side force and the suspension friction characteristics
The SF and the suspension friction, both of which are functions of TCP lateral force, can be compared by considering the spring SFs. Under the hypothesis that the SA is a primary source of suspension friction, it is reasonable to expect similar minimum characteristics for the SF compared to the suspension friction.
The determination of the spring forces was presented in a previous study. 12 Table 4 lists the spring forces and the tilting angles of the strut versus the TM in the y-z-plane of the suspension (i.e. around the local x-axis of the TM, see Figure 8(b)). It was found that the tilting angle significantly influences the lateral SF component.7,10–12 Conversely, tilting around the local y-axis is not considered to have significance for the lateral component of the spring SF (compare effect of x-axis tilting on longitudinal force). For the given wheel deflection levels, the tilting angle is consistently negative, thereby reinforcing the lateral spring force.
Deflection-dependent spring SFs and tilting angles.
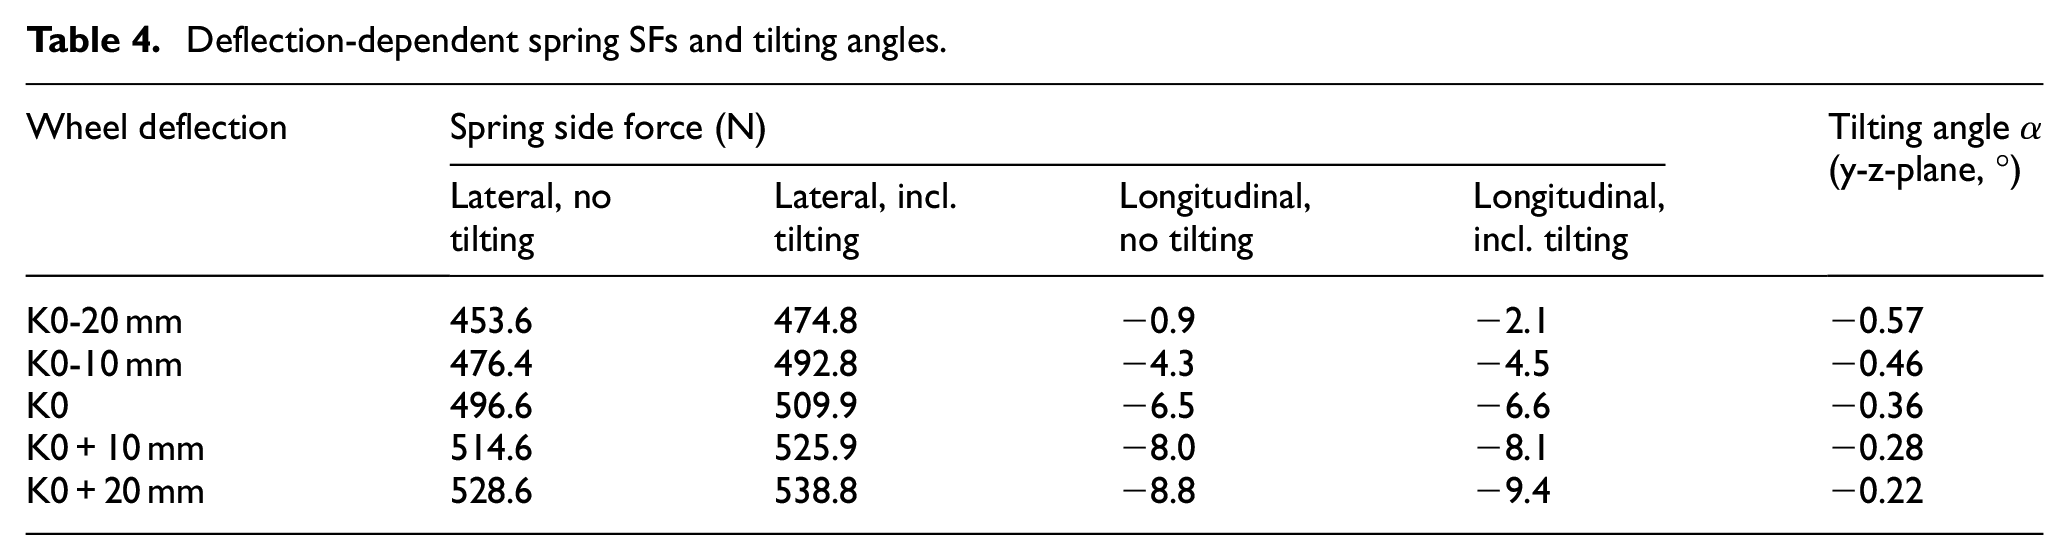
The lateral spring force component is particularly high and adds a certain amount of SF to the SA. For the given suspension, it is directed inwards (Figure 8(b)). Therefore, the nominal SF is partially compensated. The longitudinal spring force is negligible and was not considered for the subsequent analysis.
The lateral spring forces (including tilting) are applied on the SF curves of Figures 6(c) and 10. The nominal TM SF is decreased, that is, the curve minima are shifted towards positive TCP lateral forces. The resulting curves are shown in Figure 11 and the characteristic minimum positions are listed in Table 5.
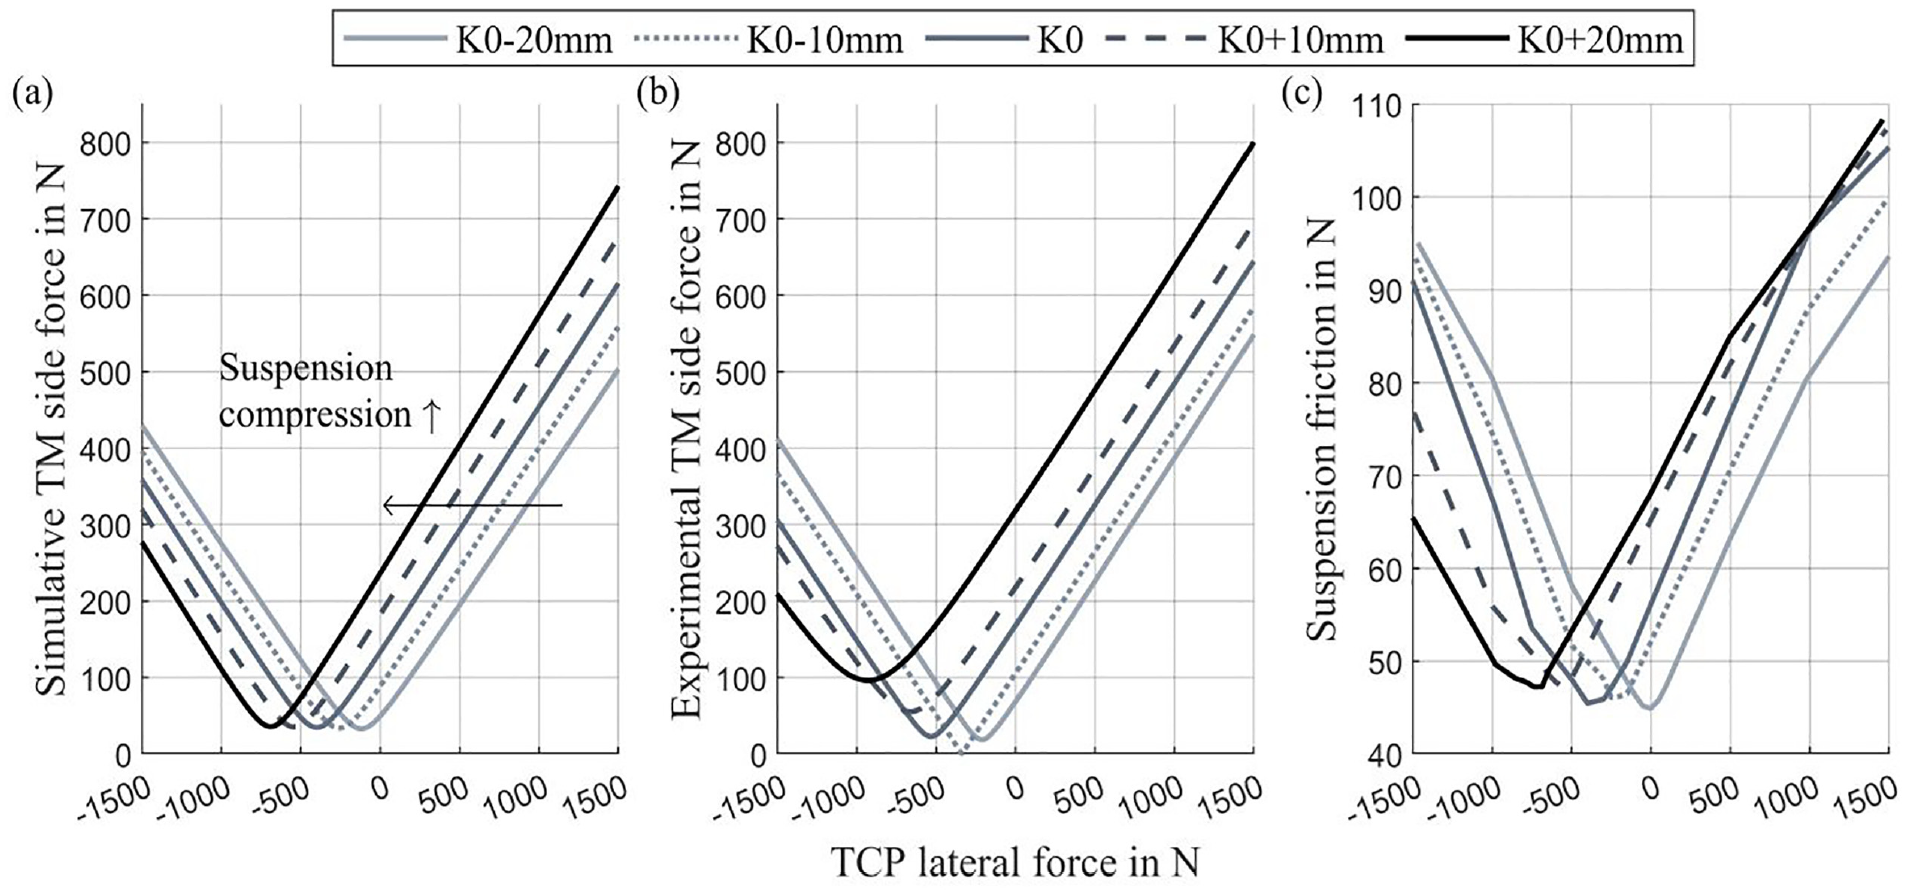
Comparison of simulative (a) and experimental (b) TM SF with suspension friction (c).
Characteristic minimum comparison of SF and suspension friction.
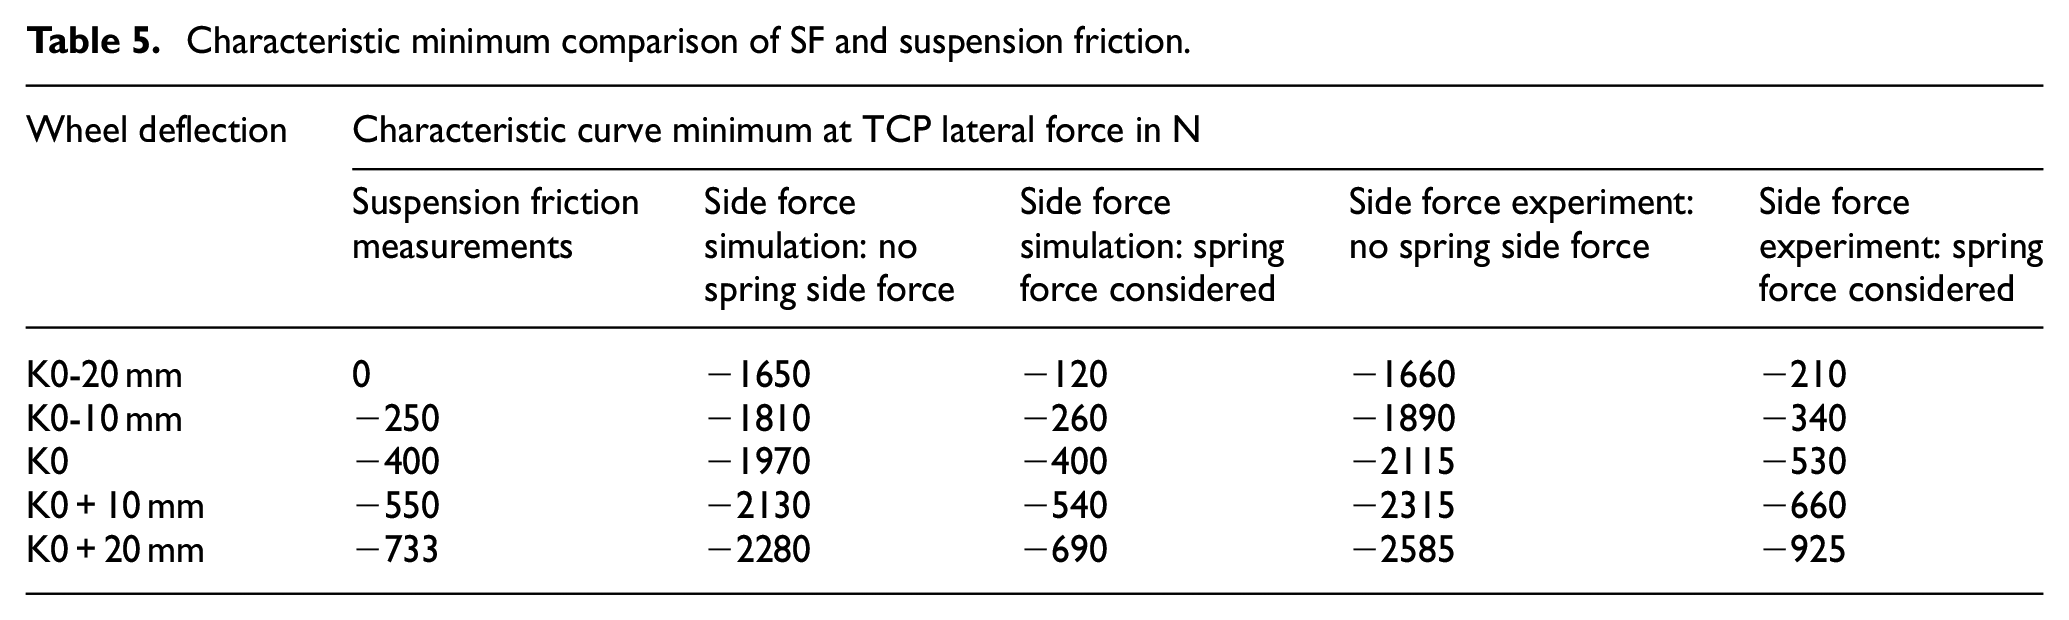
Firstly, a fair agreement exists between the experimental and the simulated SF with an average deviation of the minimum positions of about 130 N TCP lateral force (corresponding to about 40 N SF). While the simulation reaches a minimum (residual) SF of approx. 40 N regardless of deflection, the residual SF of the experiment increases with increasing deflection. During the experiment, increasing x-components are measured, which cannot be cancelled by the TCP lateral force variation as previously described. Once the y-component of the SF is fully cancelled by the external force (at the minimum point), the x-component remains and constitutes the residual SF.
Secondly, the simulation and the suspension friction (Figure 11(a) and (c)) demonstrate a high accordance of the respective minimum positions. A definite relationship between suspension friction and SA SF is evident. This is also valid for the experimental results, although they are subjected to higher deviations. The variation of deflection level demonstrates that the trends of the suspension friction evolution are replicated by the SF curves not only qualitatively but also quantitatively to a high degree.
Unlike the simulation, the experimental SF determination is the synergy of two experiments, that is, the strain calibration at first on the strut and its subsequent utilisation as equipped in the suspension. Because of some practical aspects mentioned below, the accuracy is limited resulting in deviations:
The basic strain of the half-bridges, which was found to deviate over time, can easily be offset during the calibration process, but this is not fully possible during subsequent use in the suspension. Therefore, some of the measured strain may not be due to an SF but due to an uncompensated offset.
The strut equipped in the suspension is subjected to tilting around the TM’s local x- and y-axes as previously described, which is not considered at the subsystem level during calibration. Even though the apparent angles are small, some tension may be detected by the half-bridges.
The former may be a reason for the higher residual SF detected for higher deflection levels compared to the simulation, resulting from a detected x-component of the SF. Regarding suspension friction, there is also a slight increase of the residuum. Therefore, it is possible that in reality there is an increasing amount of longitudinal SF with increasing deflection, which may not be accurately captured by the kinematic MBS model.
Under consideration of these points, a satisfying agreement of simulation and experiment is concluded. This proves that the experimental setup is correctly designed and can be used beyond the load case of this study to analyse the SA SF in more complex and realistic manoeuvres. In the following sections, the simulation results are used to study the relationship between SA friction and suspension friction.
Shock absorber friction
Friction measurements
The strut assembly was measured as explained in Section ‘Shock absorber side force determination’ and as shown in Figure 5. In the context of the quasi-static application as presented in this study, measuring the strut assembly is a reasonable approach given the small amount of friction originating from the TM and the spring. Both were measured and contribute less than 1 N at 3 mm amplitude, which can be neglected. Accordingly, the measured quasi-static friction of the assembly will be referred to as ‘shock absorber friction’ (‘SA friction’).
The assembly permits the most realistic application of the SF directly on the TM and perpendicular to the SA vertical axis, corresponding to the simulation. Moreover, an adjustment of the angle
Since the spring was mounted, the TM SFs determined by simulation were applied directly to the SA, allowing a quasi-static friction value to be assigned to each SF.
The quasi-static friction, both for the strut assembly and for the suspension, was defined by half the hysteresis height of the force-displacement chart recorded from each measurement. The tests were performed at a constant velocity of 0.5 mm/s (ramp signal) and 3 mm amplitude. Ten cycles were performed, and a representative mean friction value was calculated.
Figure 12 shows the results with a bi-linear characteristic for the SA friction that is similar to the suspension friction. While the markers constitute the actual results, the solid lines represent the inter- and extrapolated data. The minimum position in terms of external TM SF is directly related to the lateral SF component of the spring (refer to Table 4). In other words, at zero external SF, the SA experiences the full SF of the spring, resulting in a high friction force. By increasing the external force, the spring SF is gradually compensated, until it reaches the point of full compensation that is characterised by the respective friction force minimum. If the SF is increased further, the friction increases again.
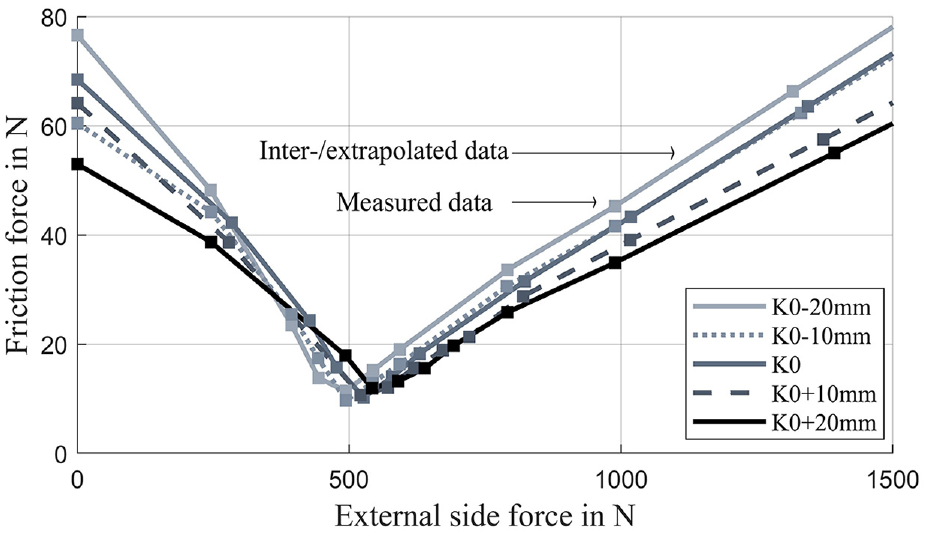
SA friction depending on external SF for
With increasing compression (i.e. K0-20 mm → K0+20 mm), the decreasing distance (lever) of the applied SF relative to the internal friction contacts of the SA results in decreasing contact forces, which ultimately result in continuously decreasing friction forces.
In contrast, the obtained minimum friction forces are quite independent of deflection, as in each case the spring SF can be compensated by a certain external SF. Only a small deviation remains, as the deflection-dependent friction force minimum is not always perfectly located due to the applied external SF step size.
It is also observed that the sensitivity of SA friction regarding the effective SF is not perfectly linear, but rather degressive. This is indicated by similar friction forces that are obtained at zero and at 1500 N SF for each deflection level, while for the latter more SF is required starting from the friction force minimum to reach that friction level. This degressive character was already observed for the single SA (i.e. unassembled, without TM and spring) during previous experiments. 14
Contribution of shock absorber friction to total suspension friction
Given the known value of the TM SF as a result of the simulation, the SA friction can be related to the TCP lateral force (load case) as a function of the externally applied TM SF.
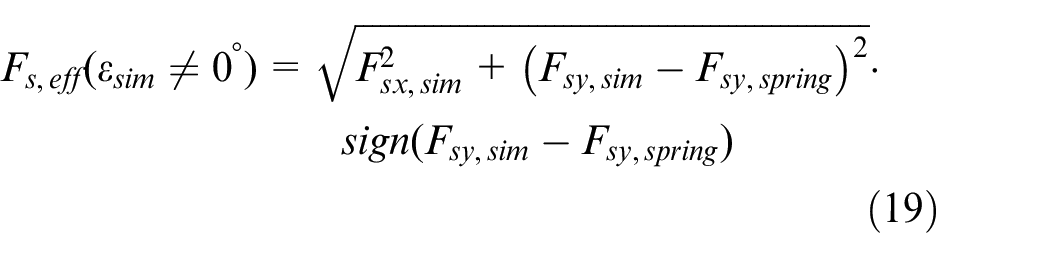
The following analysis is carried out in the TCP lateral force range of −1500 to +1500 N, wherein the minimum suspension friction force is captured (see Figure 11(c)). This range can be captured experimentally, since the capacity of the external SF is otherwise a limiting factor. In this range, the SF angle
The error made because of this simplification was considered by correcting the simulative SF
Composition of effective SF.
If the lateral SF component significantly exceeds the lateral spring SF (
On the other hand, if the lateral SF equals the opposed lateral spring SF (
The made error resulting from the simplification (

Another simplification concerns the neglect of any tilting of the SA versus the TM (refer to Table 4) in the experimental SA friction measurement. In reality the angle
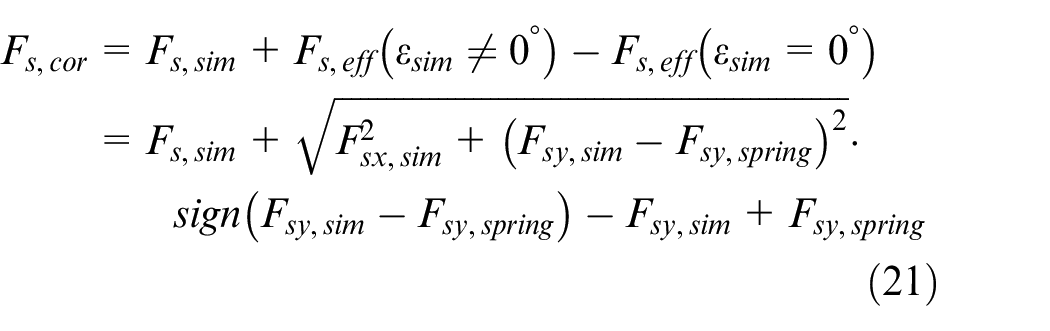
Using the methodology described, the determined SA friction force (see Figure 12) is assigned to a TCP lateral force level. Furthermore, the SA friction acting along the local SA axis is transformed onto the global z-axis, which corresponds to the z-axis of the suspension system. As the spatial inclination of the SA is relatively low (<10°), the z-transformed friction force is only reduced by 1%–2%. The results are presented in Figure 14(a), wherein the curve order follows the trend of the simulated side force. On the left side of the friction force minima, higher effective SFs and higher free piston rod lengths (K0+20mm → K0-20 mm) superimpose. This results in high friction values at low deflections and a high differentiation of the friction curves.
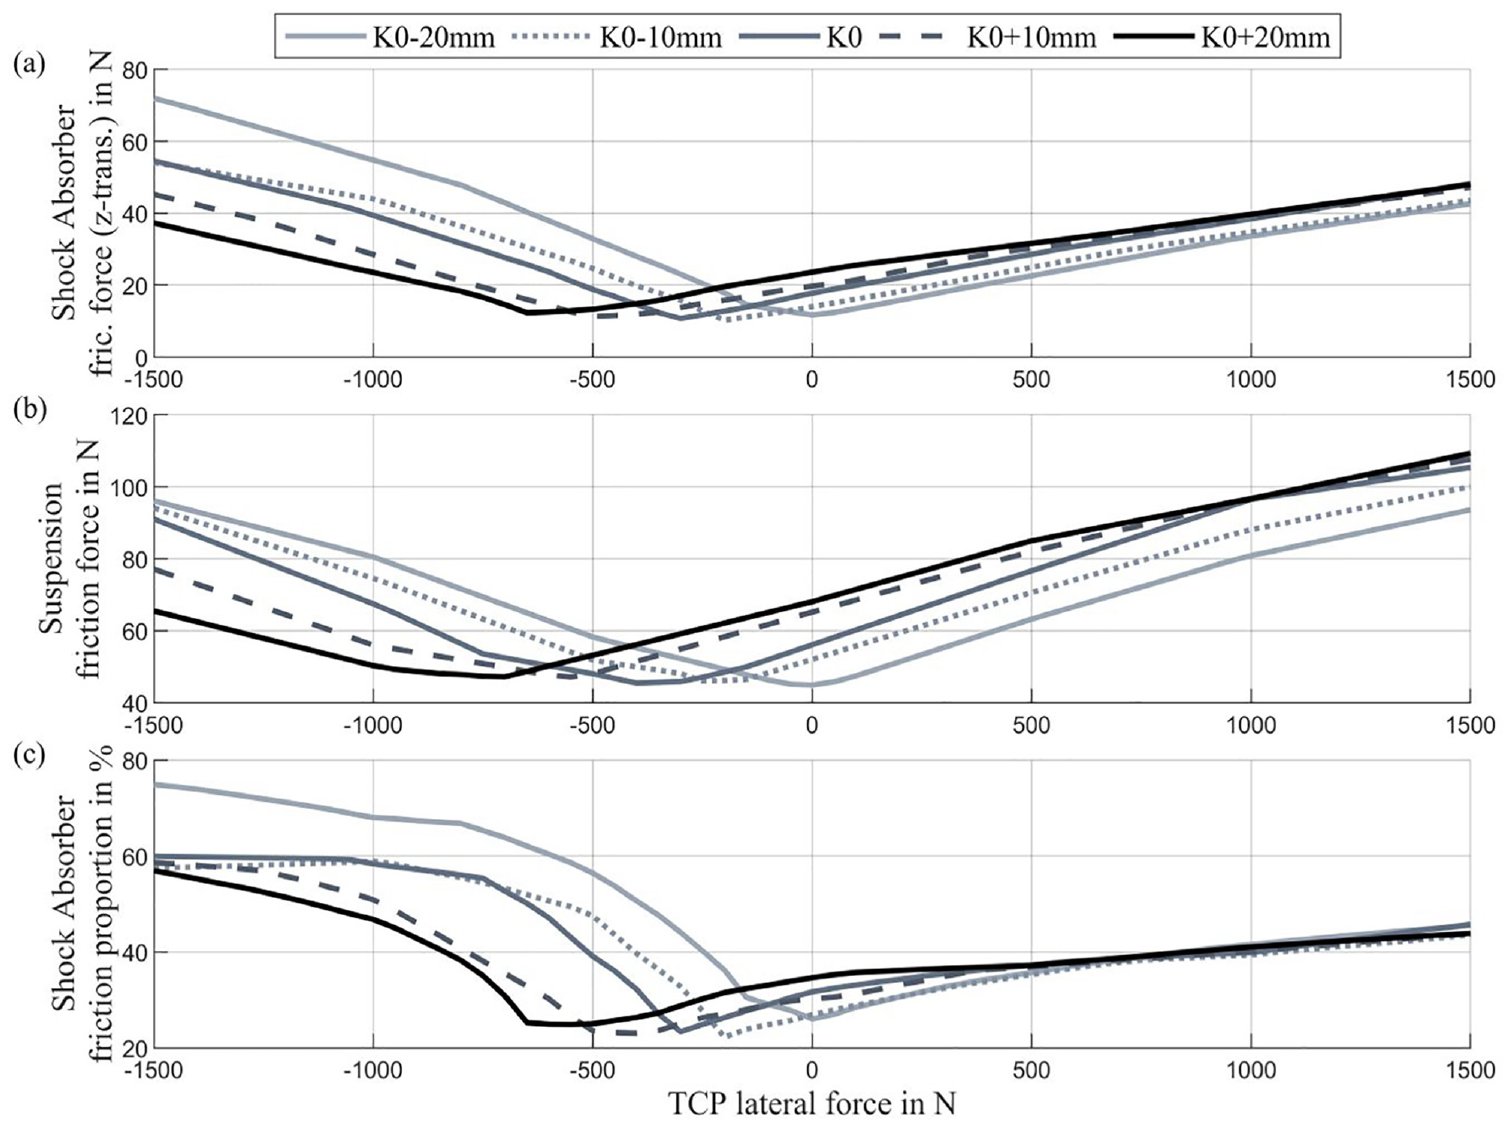
SA friction as a function of TCP lateral force (a), suspension friction (b) and SA friction contribution to total suspension friction (c).
On the right side, the curves are located closer to one another. Although Table 3 indicates that the ratio between TCP lateral force and TM SF increases with increasing deflection level, the effect of proportionally higher SFs for higher deflection levels is mitigated by the smaller SF lever and the degressivity of the SA friction.
Comparing the SA friction with the suspension friction of Figure 14(b), the latter shows a striking similarity both in terms of minimum position and curve order. This already suggests that the suspension friction evolution is strongly influenced by the SA friction.
The contribution of the SA friction to the total suspension friction is depicted in Figure 14(c). In the region of the suspension friction minimum, the SA friction contribution is the lowest at approx. 20%–25%.
Towards lower TCP lateral forces, the SA friction contribution increases rapidly up to 75% and is generally higher the lower the strut compression level. As previously explained, at low deflections, higher SF levels and high levers generate high SA friction, which dominates the suspension friction.
For vehicle outside-directed (i.e. towards higher) TCP lateral forces, the contribution reaches only 45% and is almost independent of the deflection level due to the degressive SA friction. However, the SA friction contribution is expected to continue to increase for higher TCP lateral forces.
Finally, the TCP lateral force range up to ±3500 N is analysed in order to assess the significance of the SA for more severe cornering. In real cornering, the lateral force is applied in the same direction on both wheel sides, while the suspension components of both sides are mounted symmetrically. Therefore, assuming exactly the same component characteristics, the curves of Figure 14 are inverted for the right wheel side with respect to TCP lateral force. The average SA contribution is analysed and visualised in Appendix D, representing the two wheel sides together for the extended TCP force range. The results should be considered as an estimate, as the suspension and SA friction forces are partially linearly extrapolated in order to cover the range. Starting from a minimum contribution of about 30% in the range around zero TCP lateral force, the contribution to the total suspension friction rises to about 55%–75% and increases the lower the suspension compression state.
Friction of remaining suspension components
The calculated friction force of the remaining suspension components, that is, non-SA friction, is shown in Figure 15. It appears that the curves reach a minimum between −1000 and −750 N TCP lateral force, and that the minimum shifts towards lower TCP lateral forces for higher deflection levels. From this minimum friction level, the curves increase approximately linearly with increasing or decreasing TCP lateral force. This indicates an existing friction characteristic of at least one of the remaining suspension components that is proportional to TCP lateral force.
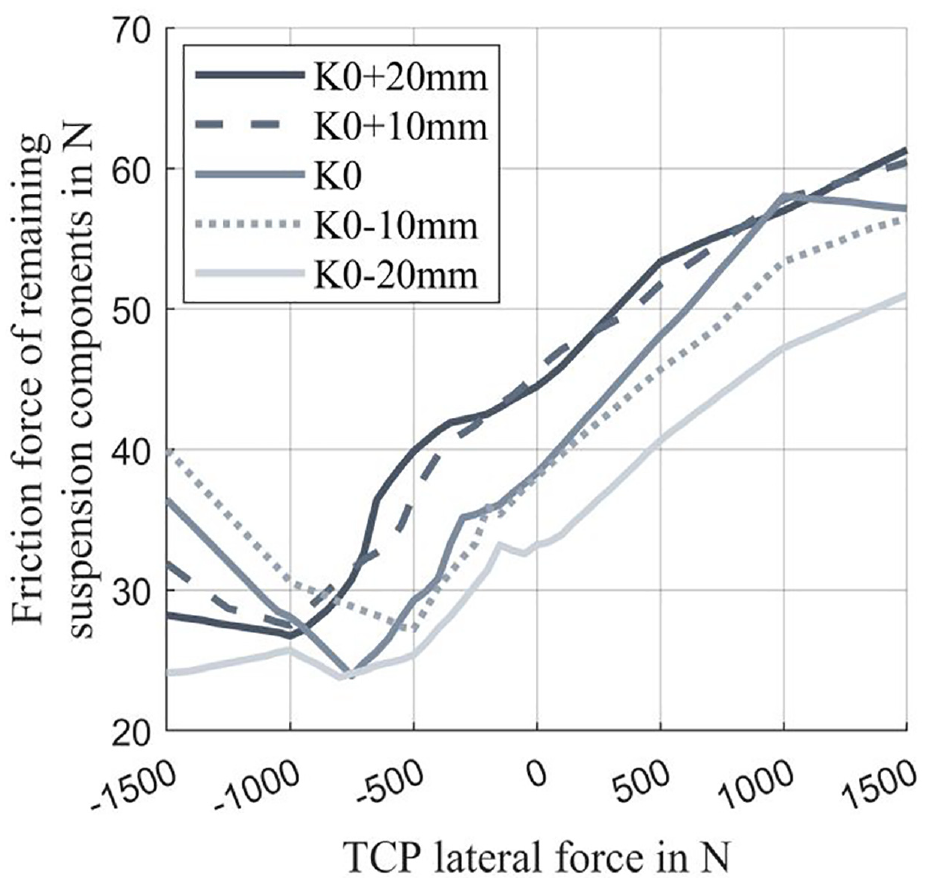
Friction of remaining suspension components.
Since the quasi-static hysteresis of the top mount is small (about 1 N), the remaining relevant components are the two wishbone elastomer bearings (A, A′), the wheel carrier-sided ball joint (B) and the two steering rod ball joints (C, D). It is assumed that joint B, the wheel carrier ball joint, might be a primary origin of the remaining suspension friction. The forces are analysed below, together with those of the steering knuckle joint (D).
According to Stietz, 15 the vehicle weight acts mainly as vertical force in the joint’s axial direction, provided it is installed accordingly. Then, longitudinal and lateral tyre forces act as a radial force. Regarding the mounting situation in the given suspension, this is approximately true for the wheel carrier joint (B), as well as for the steering knuckle joint (D).
Furthermore, it can be said that the normal force between the ball and the socket has two origins: a clamping force between socket and stud resulting from the manufacturing process 16 (preload); plus additional forces resulting from the loads of the working condition. As the first part is unknown, only the latter is analysed in terms of radial force, which leads to increased friction moments of the joint.
It is possible to analyse the radial force specifically since the spatial orientation of the bearing stud in the suspension coordinate system (refer to Figure 7(b)) is known through computer aided design methods. The radial direction is defined as perpendicular to the bearing stud (axial direction), see Figure 16(a).
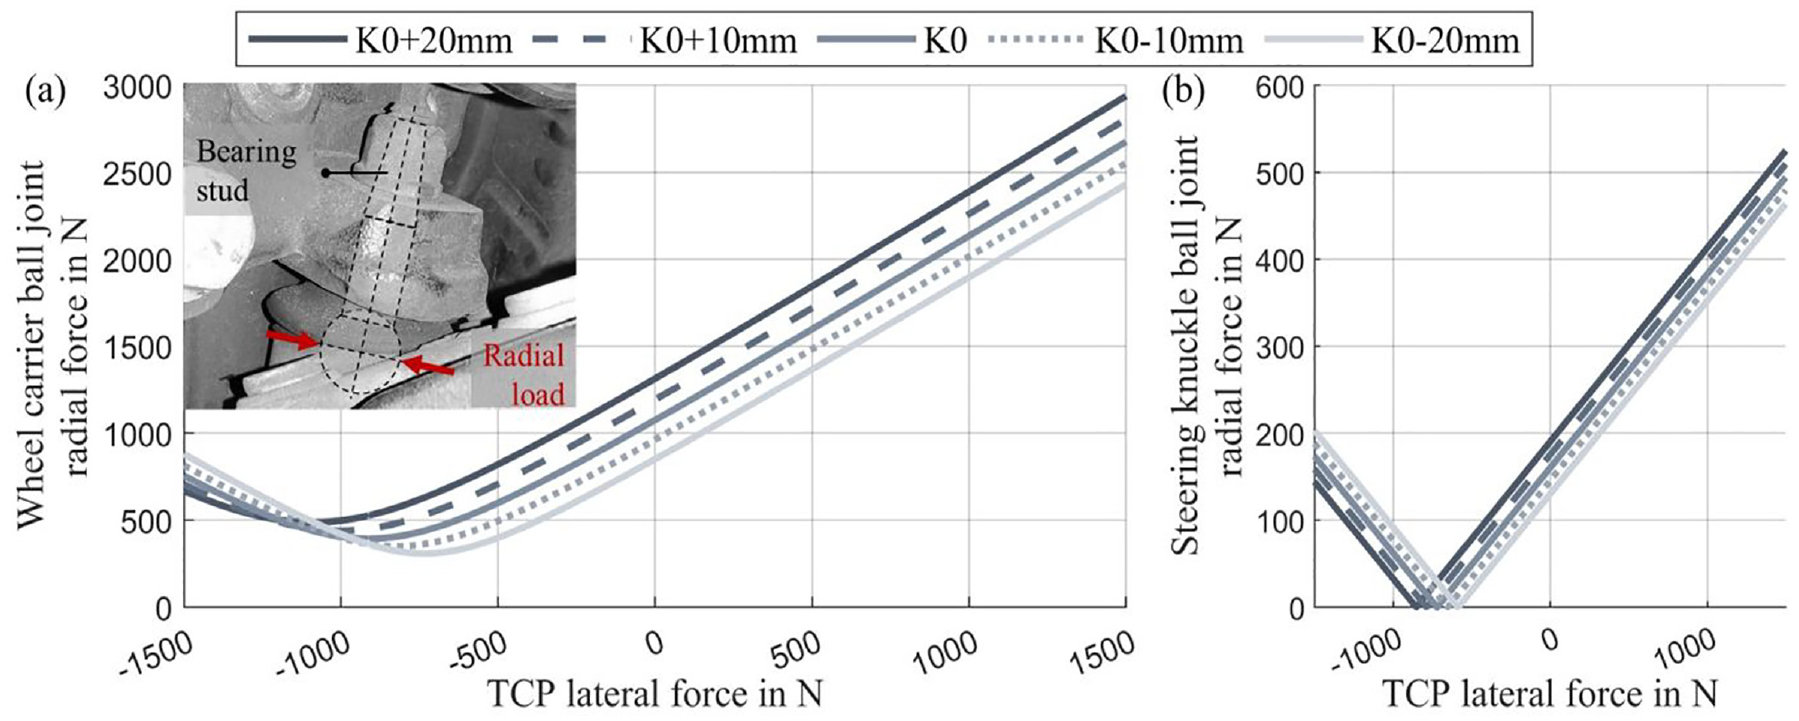
Radial force of wheel carrier ball joint (a) and steering knuckle ball joint (b).
It can be observed that the radial load on the wheel carrier joint (Figure 16(a)) increases linearly with the TCP lateral force. This fits the linear trend of the friction force calculated for the remaining suspension components, provided there exists an approximately constant coefficient of friction. In addition, the minimum locations of the radial load agree with those of the friction forces. The minimum shifts to lower TCP lateral forces with increasing deflection and fits the tendency of the friction curves. Similar observations are made regarding the steering knuckle rod joint (Figure 16(b)), but the forces are much smaller. On the assumption that the friction coefficients are similar, this joint is therefore considered to be less relevant. The increase of axial force is much smaller compared to the radial direction regarding both joints. These findings support the hypothesis that the wheel carrier ball joint can potentially provide a significant part of the remaining suspension friction. Nevertheless, it is likely that the sum of the still remaining components also contributes significantly.
Conclusions
Based on the observation of specific curves regarding suspension friction of a mid-size passenger vehicle with a MacPherson front suspension, this study investigates the shock absorber side force at the top mount as a key to understanding the role of shock absorber friction for this suspension type. Quasi-static lateral tyre force variations at five suspension deflection levels are used as simplified load cases for the analysis of the associated mechanisms and effects.
Firstly, bi-linear friction curves with deflection-specific friction force minima are obtained on suspension (subsystem or full vehicle) level. A strain gauge application (experiment) and a multi-body simulation approach are employed in parallel to determine the shock absorber side forces for the same load cases. By considering the spring side forces, the effective shock absorber side forces are found to have similar characteristics compared to the suspension friction force in terms of force minima locations. Both the experimental and the simulative approach are found to be in good agreement, which implies that the applied experimental design to measure the strut or shock absorber characteristics (friction; side force calibration) is realistically chosen to represent the loads appearing in the suspension subsystem.
Secondly, the shock absorber friction in the strut assembly is determined as a function of the applied top mount side force. The novel methodology of this study enables the transfer of side forces obtained from simulation or experiment to the suspension level, expressed as a function of deflection state and lateral tyre force. As shock absorber and total suspension friction are both expressed in relation to the same basis, a quantitative comparison between the two can be made as not clearly stated in the literature before. The results clearly demonstrate that, despite the modern side load springs effectively reducing the shock absorber load, the friction increases significantly outside a certain optimum state, reaching about 80% for the load cases. Based on further analysis of the suspension forces, it is concluded that the wheel carrier ball joint is another primary cause of suspension friction next to the shock absorber. Especially for instances of low shock absorber friction, the remaining suspension components assume significant importance, as the contribution of the shock absorber is then limited to approximately 25%.
The presented methodology emphasises the necessity of considering the current vehicle state in terms of suspension deflection and tyre forces in order to exactly provide corresponding shock absorber friction values. Although the study is based on a simple load case, the methodology outlined can be likewise applied to any complex or combined signal. The crucial point is to determine the side force vector acting on the shock absorber through understanding the suspension’s internal force equilibrium. The methodology enables subsequent studies on the contribution of shock absorber friction for complex and combined scenarios, thereby facilitating a more comprehensive understanding of the significance of the shock absorber.
In a final conclusion, the shock absorber should be the primary focus of suspension designers when attempting to reduce the friction force of a MacPherson suspension in the context of a certain discipline, such as in terms of ride comfort. It is therefore essential to consider the specific side force state of the shock absorber corresponding to a certain driving situation of interest. As a secondary focus, suspension designers should also consider the wheel carrier ball joint friction as an important parameter to further affect the suspension friction.
Footnotes
Appendices
Declaration of conflicting interests
The author(s) declared no potential conflicts of interest with respect to the research, authorship, and/or publication of this article.
Funding
The author(s) received no financial support for the research, authorship, and/or publication of this article.