
Abstract
The fatigue performance of a metallic component is strongly correlated with several surface integrity features (surface roughness, residual stresses, microstructure). It is commonly characterised using ISO tests. However, conventional procedures for manufacturing fatigue samples influence all the surface integrity features simultaneously. So, standard fatigue testing procedures do not discriminate between each feature’s sensitivity. This paper aims to show how an advanced combination of various processes (finish turning, belt finishing, roller burnishing) leading to complementary process signatures determines which surface integrity features are the most sensitive and how two features can be coupled. This methodology is applied to a martensitic stainless steel 15-5 PH (precipitation-hardening). It highlights that this steel is very sensitive to the presence of a nanosized white layer and that there is a synergy effect by combining a thick compressive layer and a very low surface roughness.
Introduction
When industrialising a safety component, engineers must estimate its effective fatigue resistance by considering the fatigue strength of the material and the functional operating conditions that the part should withstand. The fatigue performance of a material is supposed to be an intrinsic property characterised using standardised ISO tests. Fatigue samples are commonly manufactured by turning or grinding and then polishing by hand (for instance, lapping with abrasive slurry) to remove scratches from machining and to be as close as possible to a mirror-like surface. However, companies are not that interested in characterising fatigue strength for a mirror-polished surface because their own components are manufactured with a large variety of processes combined in a manufacturing sequence. Each manufacturing sequence leads to a specific surface integrity, as defined by Fields and Kahles, 1 characterised by various features, such as the following:
The geometric parameters specified by two-dimensional roughness parameters (Ra, Rz, …) or by more complex three-dimensional ones (Sa, Ssk, …) that aim to reflect local stress concentration in the valleys, as proposed by Arola and Williams. 2
The mechanical parameters residual stress and microhardness. Jawahir et al. 3 showed that machining processes typically affect residual stress within several 100 µm.
The metallurgical parameters, such as the microstructure (nature of phases and their corresponding grain sizes) and inclusions, as shown by Novovic et al. 4 Several works highlighted that common manufacturing processes, such as turning or grinding, induce systematic microstructure modifications, such as dynamic recrystallisation in the case of a martensitic 15-5 PH stainless steel since Mondelin et al. 5 or transformation of martensite into untempered or overtempered martensite for case-hardened steel since Tönshoff et al. 6 These affected layers are ‘white layers’ several micrometres thick, as shown by Rech and Moisan. 7
Several papers, such as that of Jawahir et al., 3 claim that most of the standard ISO fatigue tests do not consider these surface integrity features. Indeed, Griffiths 8 underlined that the majority of high-cycle fatigue life involves crack initiation on the surface. The initiation is directly controlled by the corresponding manufacturing sequence (from the roughing step to the finishing step). So, after a roughing operation (i.e. turning), followed by lapping, it is questionable if the surface of the fatigue sample is affected by the residual stress state induced by turning and/or if the ‘white layer’ has been fully removed. It is also questionable if the absence of residual stresses and the homogeneous microstructural state have been verified. Between two sets of effective manufacturing conditions for each process in a sequence, it is easy to imagine that fatigue properties may vary even if all samples exhibit the same external surface integrity. This observation was clearly made by Hashimoto et al. 9 when comparing the influence on fatigue of a preliminary hard turning versus a grinding operation before the final honing operation. Even if the surface integrities are similar in the external shallow layer, they observed double fatigue life for the samples produced by preliminary hard turning, which was attributed to a different crack propagation due to the different residual stress state below this shallow layer affected by honing, as shown by Hashimoto et al. 10 This was confirmed by Smith et al. 11
So, companies are interested in characterising the fatigue strength corresponding to their own manufacturing sequences. However, all their components are not manufactured with the same manufacturing conditions. For instance, a recent paper (Qang et al. 12 ) aimed at comparing the fatigue strength of a component produced by milling and polishing with that of a component produced by grinding and polishing. Another work (Beck et al. 13 ) aimed at comparing the fatigue strength of a component produced by grinding with that produced by wire electrical discharge machining (WEDM). Suárez et al. 14 investigated the influence of new manufacturing processes, such as abrasive water jet machining, WEDM and ultrasound-vibration-assisted milling on fatigue resistance, compared to a conventional milling process. All these research works are strongly connected to an industrial application. Companies are willing to answer two questions:
How would the modification of manufacturing conditions or sequences affect surface integrity features?
How would the modification of surface integrity features influence fatigue strength?
To answer these ancient questions, numerous research teams have intensively investigated the development, optimisation and modelling of manufacturing processes or sequences with the aim to optimise surface integrity features. Major past contributions related to cutting, abrasive or mechanical reinforcement processes have been summarised through keynotes, such as that in Brinksmeier et al. 15 However, as stated by Jawahir et al., 3 the correlation between surface integrity and the fatigue life of machined components is not well established. It is challenging to isolate the effect of a single surface integrity feature among many features. Some parameters are strongly linked. For instance, Novovic et al. 4 investigated the interaction between surface roughness and residual stresses. Based on these statements, some researchers have proposed various methods for fatigue testing so as to determine the influence of a single surface integrity feature. Some authors have proposed to tailor surface integrity by modifying manufacturing conditions. For example, Skalli 16 investigated various grinding conditions to explore the sensitivity of the fatigue resistance of AISI4140 steel to residual stress and surface roughness. Moussaoui et al. 17 made a similar investigation by varying milling conditions of a TA6V alloy to obtain various surface roughness values and residual stress states in the external layer. However, none of these papers have considered the influence of the microstructure modified by these processes.
Grove and Mörke 18 proposed modifying the cutting speed in turning to induce various residual stress states in the near-surface. Unfortunately, they do not consider the influence of cutting speed on the surface roughness and the microstructural state of AISI1060 steel to analyse their results even if these surface integrity features are affected. Javidi et al. 19 modified the feed rate in turning AISI4340 to obtain various surface roughness values. Residual stresses were also significantly affected, which makes it almost impossible to discriminate the main influencing parameter. Moreover, these references proposed a limited variation of surface integrity due to the limited variation of cutting conditions that ensure avoiding threshold effects, such as grinding burns (Jawahir et al. 3 ) or vibrational instabilities in high-speed milling or in turning with small diameter of fatigue samples (Chomienne et al. 20 ). Moreover, most of them focussed their attention on external residual stresses without analysing the profiles of residual stress, which influences crack propagation (Hashimoto et al. 9 ).
The state-of-the-art highlights that it is not possible to use a single manufacturing process to discriminate the sensitivity of various surface integrity features, as it only enables a limited range of variation and influences all the features simultaneously. It has also been shown that the analysis of the surface integrity features requires the analysis of residual profiles in the thick affected layer and its value on the external layer. Novovic et al. 4 proposed a more advanced strategy combining milling, grinding, creep feed grinding, shot peening, polishing and heat treatments to induce various residual stress profiles and surface topographies. Unfortunately, the proposed methodology failed to prove its efficiency to discriminate the sensitivity to various surface integrity features, as the case study led to a dominant effect of a nonuniform distribution of carbides in the workpiece, which overshadowed the effect of other features (surface roughness and residual stress). Recent works aimed at applying multiple machining processes to investigate the mechanisms controlling the fatigue strength of a nickel superalloy (Liao et al. 21 – Holmberg et al. 22 ). However, their methodology is limited to a narrow range of surface integrity due to the limitation of the industrial case study and cannot be generalised.
So, there is a clear need to design a new method for fatigue testing to determine the sensitivity of a single surface integrity feature among others. Inspired by the work of Novovic et al., 4 this paper proposes an original combination of various manufacturing processes, leading to complementary surface integrity signatures (roughness, residual stress profiles, external layer microstructural state). The selection of the manufacturing processes is discussed in the next section, and the proposed strategy was applied to a case study of manufacturing a shaft made of 15-5PH martensitic stainless steel (heat treatment H-1025) submitted to rotary bending fatigue under the ambient environment.
Designing manufacturing sequences
The previous section notes that any manufacturing process leads to a modification of surface integrity features belonging to three main groups of features (geometrical, mechanical and metallurgical features). There is no clear, unquestionable list of key features, as they depend on the fatigue testing conditions of the target component (fatigue mode, corrosion, temperature). Based on the application field of the present work (a rotary shaft made of 15-5 PH), the following list of surface integrity features has been considered (Figure 1):
Geometrical features: Only the common Ra parameter was considered in this work.
Mechanical features: As rotary bending fatigue was investigated, only the residual stress profiles parallel to the axis were characterised, especially the external residual stress state σext, and the total affected depth Δσ (Figure 1).
Metallurgical features: The thickness of the ‘white layer’ (ΔWL) and the total depth of the metallurgically affected layer (ΔM) were analysed. Indeed, Mondelin et al. 5 showed that the 15-5 PH is made of very stable martensite with almost no retained austenite regardless of its thermomechanical history. So, no phase transformation can be expected. Only modifications of the shape and size of grains are likely to occur due to the thermomechanical loadings induced by manufacturing processes.
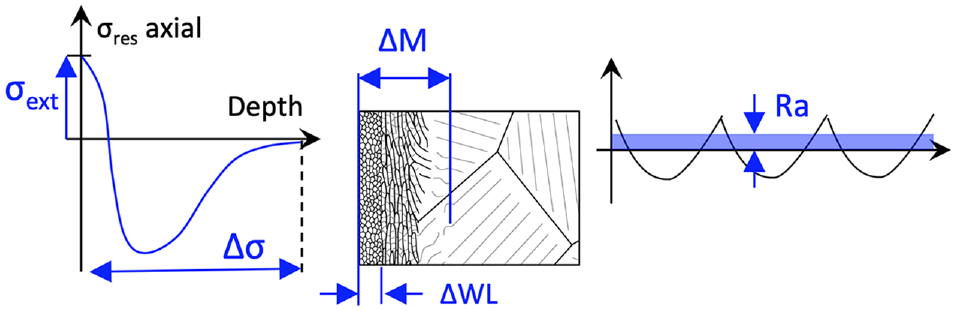
Surface integrity parameters.
An objective of this work is to select various manufacturing processes, leading to various and complementary surface integrity signatures that are applicable in manufacturing thin rotary-bending samples. Three criteria were considered:
Regarding the surface roughness, the objective was to get at least two levels of parameter Ra.
Regarding residual stresses, it was aimed at obtaining either tensile (σext > 0) or compressive residual stresses (σext < 0) in the external layer. In addition, it was expected to get, on one side, a limited affected thickness (low values of Δσ) and, on the other side, a deeply affected thickness (high values of Δσ).
Finally, the objective was to generate a ‘white layer’ (nanosized grains) in the external surface (ΔWL) or to keep a microstructure as close as possible to the bulk one (microsized grains).
Several manufacturing processes can be a good candidate to get various and complementary surface signatures. Based on the selected criteria, three processes were selected, thanks to several preliminary works by the authors (i.e. turning, roller burnishing and belt finishing).
Turning
Based on preliminary investigations made on the 15-5 PH steel by Chomienne et al., 20 turning is a good candidate to obtain residual tensile stresses around σext ≈ +100/+200 MPa with a limited affected layer Δσ ≈ 150 μm. Additionally, turning operations systematically induce a ΔWL ≈ 2–3 μm thick white layer composed of martensite nanograins, which were generated by dynamic recrystallisation phenomena, as shown by Chomienne et al. 23 A variation in surface roughness can be obtained easily, thanks to a variation in feed per revolution. So, the turning process should be able to produce both rough (Figure 2(1a)) and smooth (Figure 2(1b)) surface topographies.
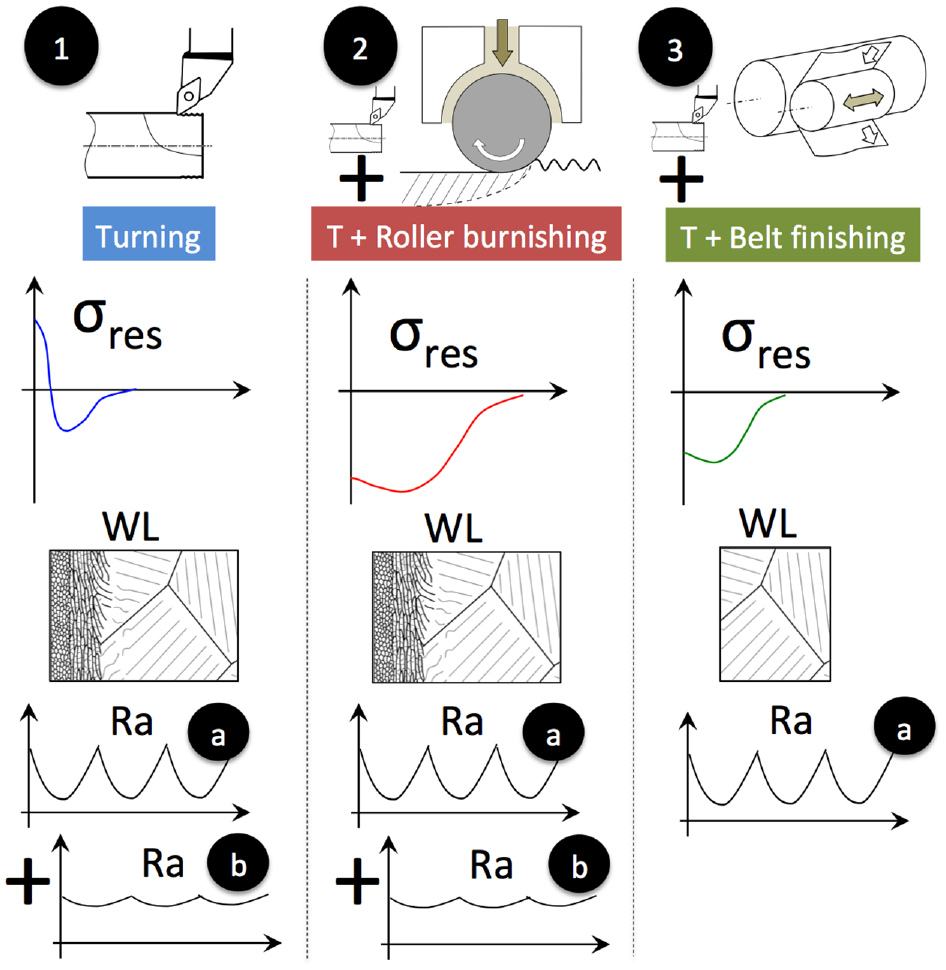
Schematic surface integrities corresponding to various manufacturing strategies: (1a) surface roughness in rough turning, (1b) surface roughness in finish turning, (2a) surface roughness in rough ball burninshing, (2b) surface roughness in fine ball burnishing, and (3a) surface roughness in belt finishing.
The theoretical surface integrity features expected after turning are illustrated in Figure 2(1).
Roller burnishing
Based on preliminary investigations made on the 15-5 PH steel by Chomienne et al., 23 it was also proposed to apply a roller burnishing post-treatment after turning. It was intended that the severe plastic deformation should induce a thick compressive layer Δσ ≈ 200 μm with a strong compressive state in the external layer σext ≈ –600 MPa. As far as a microstructure is concerned, the white layer previously generated by the turning operation should remain as no material removal occurred. A small increase in the whole deformed layer ΔM was expected. As stated previously, a variation of surface roughness can easily be obtained by a variation of the feed per revolution or of the roller diameter. So, the roller burnishing process should be able to produce rough (Figure 2(2a)) and smooth (Figure 2(2b)) surface topographies. The theoretical surface integrity features expected after turning and roller burnishing is illustrated in Figure 2(2).
Belt finishing
Finally, obtaining surface integrity without any white layer and with a limited deformed layer is expected. Indeed, since Henaff and Morel, 24 it is believed that the white layer may modify crack propagation due to a variation of grain size (more grain boundaries). Based on preliminary investigations made on martensitic hardened steel by Rech and Grzesik, 25 using the belt finishing process was proposed since this superfinishing process can remove thin layers without creating a new white layer. Indeed, this process induces a limited plastic deformation and the temperature remains very low. So, by properly selecting the process duration, belt finishing can remove either the white layer or the white layer (ΔWL) + the whole plastically affected layer (ΔM) induced by the preliminary turning operation. It was also expected to obtain compressive stresses in the external layer σext ≈ –400/–500 MPa with a limited affected depth Δσ < 40 μm since Rech and Grzesik. 25 Surface roughness is mainly determined by the belt’s grain size, as shown by Khellouki. 26 So, a target surface roughness can be reached using proper belt grain size selection. The theoretical surface integrity features expected after turning and belt finishing is illustrated in Figure 2(3).
In summary, three manufacturing sequences were proposed to generate three various and complementary surface topographies, residual stress fields and microstructural states in the external layer: turning, turning and roller burnishing, turning and belt finishing. The manufacturing conditions for each manufacturing sequence must be adjusted to obtain at least two levels of surface roughness (levels a and b in Figure 2). The next section will describe the manufacturing sequences and the corresponding actual surface integrity features.
Surface integrity characterisation
This section describes the manufacturing sequences of the six lots of rotary-bending fatigue samples that were produced with the geometry described in Figure 3.
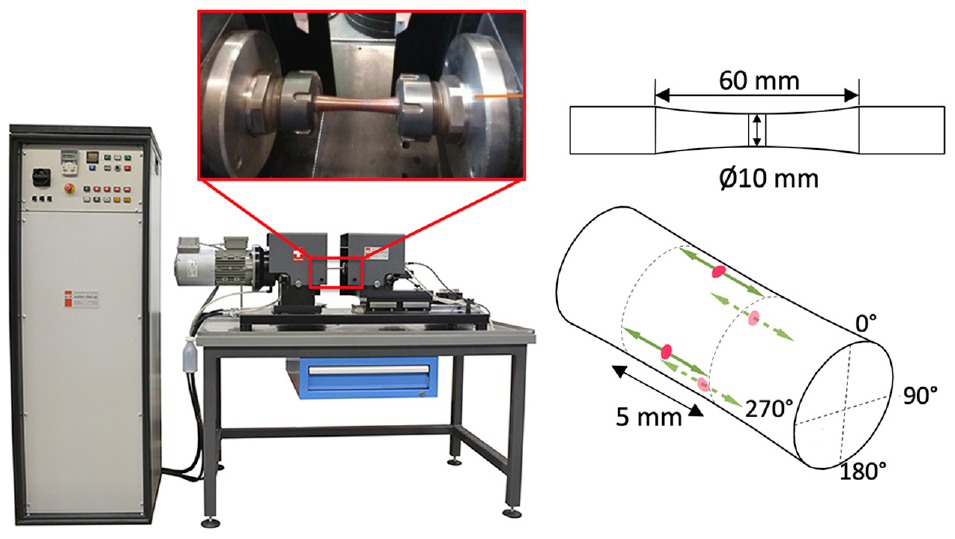
Rotary-bending fatigue samples.
Prior to the machining operations, samples were annealed at 400°C for 4 h, followed by a very low cooling rate. As this alloy has a very stable martensitic structure, the metallurgical state was not altered. As stated by Chomienne et al., 20 manufacturing, and especially turning, such thin samples may generate a significant scattering due to their low stiffness. So, it was necessary to manufacture with care and individually control the samples. At least 10 samples were manufactured for each manufacturing procedure.
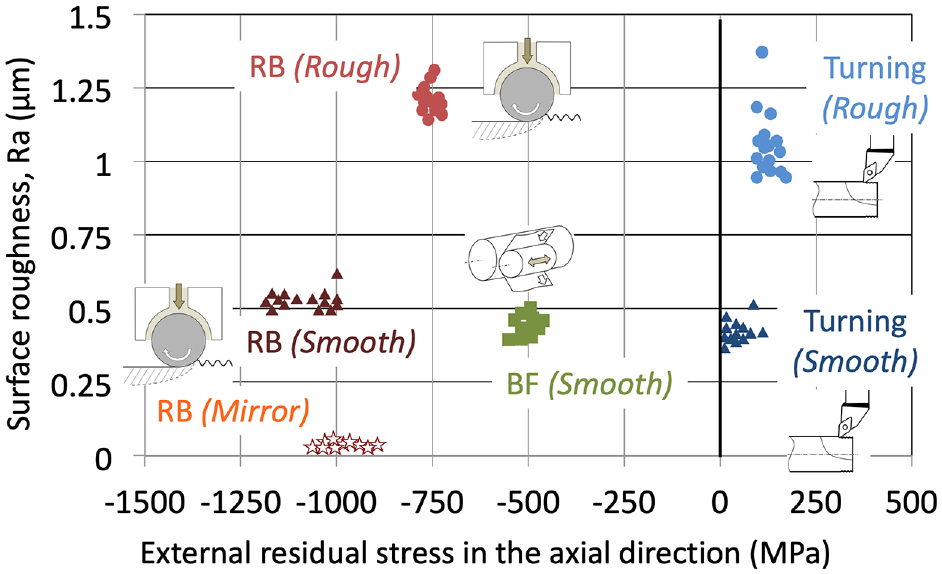
Surface integrity maps of the fatigue samples.
Surface integrity features induced by each manufacturing sequence.
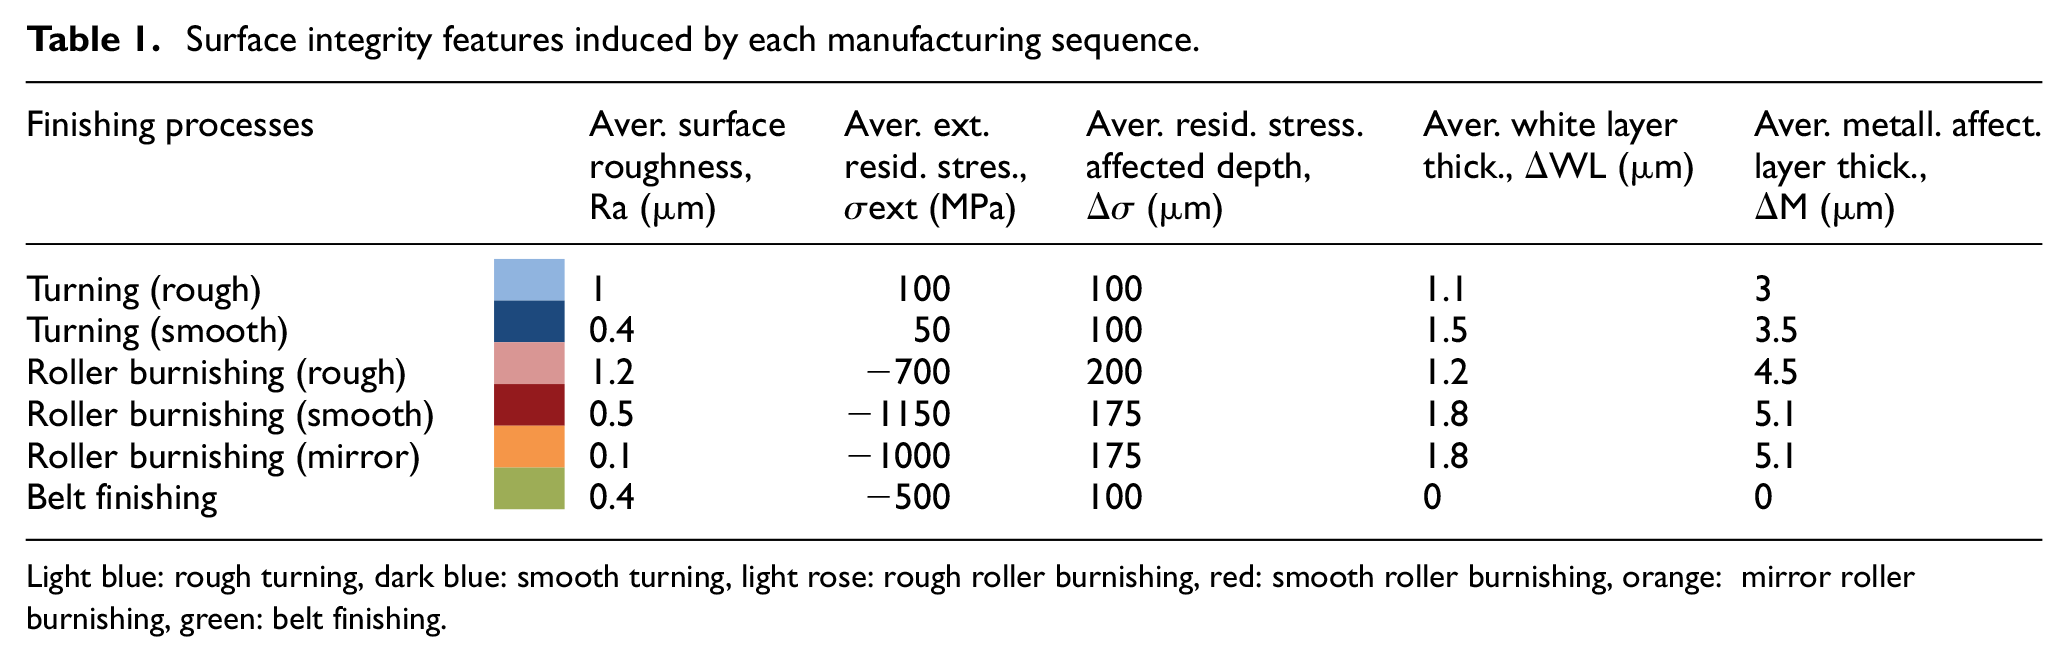
Light blue: rough turning, dark blue: smooth turning, light rose: rough roller burnishing, red: smooth roller burnishing, orange: mirror roller burnishing, green: belt finishing.
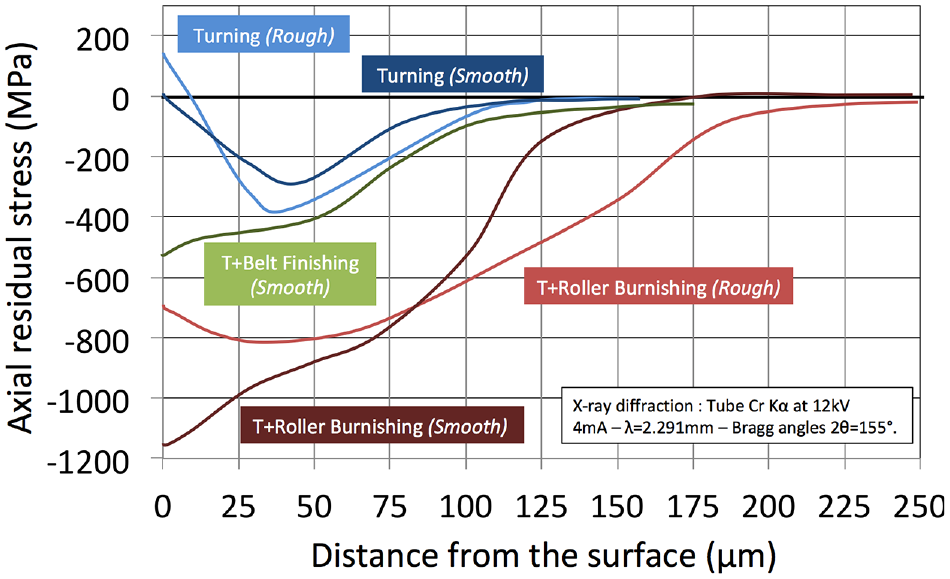
Average residual stress profiles obtained for each manufacturing sequence.
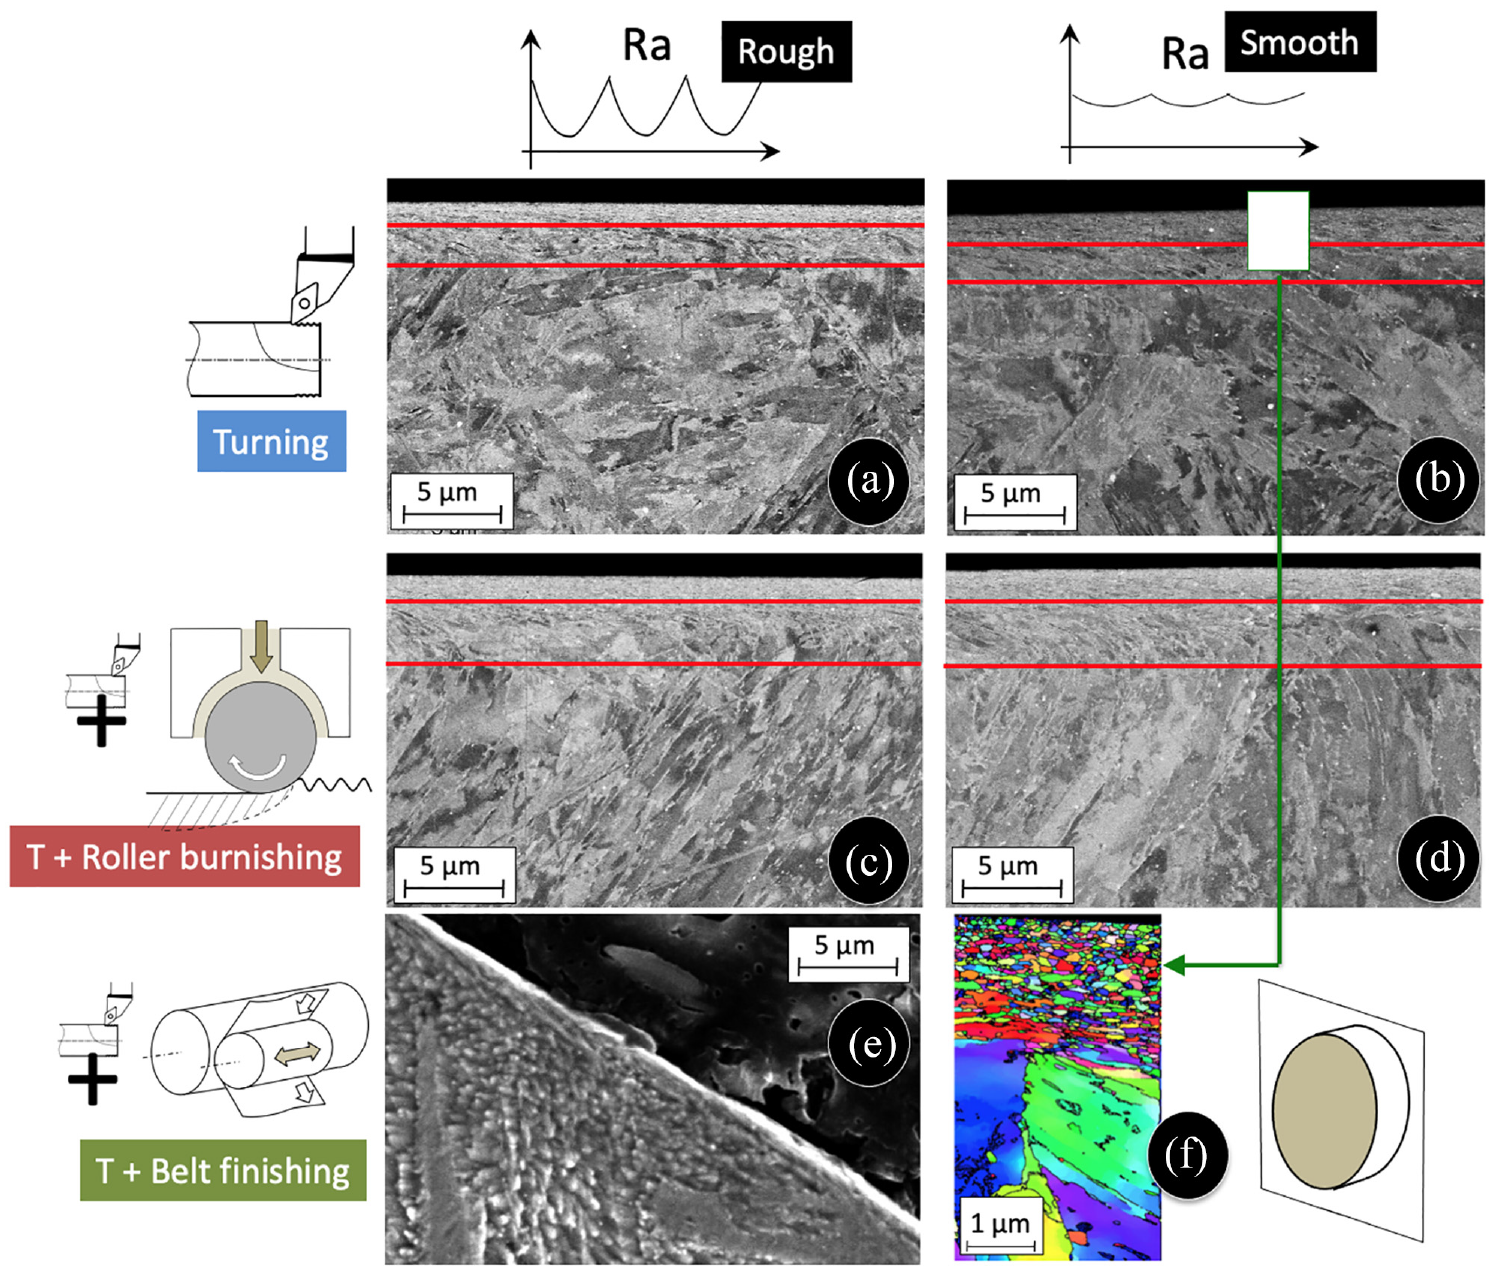
Microstructural state induced by each manufacturing sequence: (a) rough turning, (b) smooth turning, (c) rough roller burnishing, (d) smooth roller burnishing, (e) belt finishing, and (f) EBSD analysis of the affected layer in smooth turning.
Turning
The finish turning operations were made using a DNMG150604PF4215 insert with the following cutting conditions: cutting speed Vc = 90 m/min, depth of cut ap = 0.6 mm and cutting fluid: emulsion. Two ranges of surface roughness were machined: a rough surface Ra ≈ 1 μm obtained with a f = 0.1 mm/rev feed and a smooth surface Ra ≈ 0.5 μm obtained with an f = 0.08 mm/rev feed.
Axial residual stress profiles were characterised on some preliminary samples. The average curve is presented in Figure 5. A typical hook shape is observed with external stress σext ≈ +50/+100 MPa and affected depth around Δσ ≈ 100 μm, irrespective of the feed variation. As observed by Mondelin, 27 it is difficult to obtain significantly different residual stress profiles with the 15-5 PH alloy after turning.
In a preliminary work, Dumas et al. 28 proved that the final residual stress profile is not affected by previous roughing operations when the finish cutting depth in turning is ap > 0.15 mm. So, with ap = 0.6 mm, the residual stress profile is only due to the finish turning operation. Figure 6(a) and (b) show that the microstructural state is very similar for both conditions in turning. The thickness of the white layer ΔWL is around 1–2 μm and the plastically deformed layer ΔM is around 3–4 μm.
These results agree with previous investigations on 15-5 PH alloy by Chomienne. 20 The two lots of samples exhibit very similar surface integrity features with a limited tensile stress state and a limited affected layer. They mainly differ by their surface roughness.
Roller burnishing
The roller burnishing operations were made on a CNC lathe equipped with an Ecoroll setup having a 2 mm diameter roller with the following cutting conditions: rolling speed Vc = 50 m/min, normal force Fn = 80 N and cutting fluid: emulsion. Two ranges of surface roughness were induced: a rough surface Ra ≈ 1.2 μm obtained with a feed f = 0.2 mm/rev and a smooth surface Ra ≈ 0.4 μm obtained with a feed f = 0.11 mm/rev. An additional lot of samples have been produced with a mirror-like surface finish, thanks to a second roller burnishing operation with a feed f = 0.05 mm/rev.
An average residual stress profile induced by a roller burnishing shape is observable in Figure 5. The external stress σext vary between –700 and –1200 MPa depending on the feed, whereas the thickness of the affected layer remains around Δσ ≈ 175/200 μm. The smoothest surfaces exhibit a more intense compression state in the surface (σext ≈ –1150 MPa), whereas the affected layer is surprisingly something smaller (Δσ ≈ 175 μm ⇔Δσ ≈ 200 μm). The average residual stress profile obtained for the mirror-like surfaces was similar to the ‘smooth’ profile, confirming the observations of Chomienne. 23
Figure 6(c) and (d) show the microstructural state for both burnishing conditions. It seems that the nanosized grain surface layer is almost unaltered by roller burnishing. On the contrary, the micrograph of a burnished surface reveals a small increase, up to ΔM ≈ 5.1 μm, of the plastically deformed layer compared to a turned surface. These surface integrity features agree with the trend observed for 15-5PH by Mondelin. 29 The three lots of samples exhibit complementary surface integrity features covering a range of surface roughness and a range a compressive residual stress in the near-surface.
Belt finishing
The belt finishing operations were made on a CNC lathe equipped with a Supfina setup with a single set of cutting conditions: roller hardness = 80 shores, normal force Fn = 250 N, belt grain size = 100 μm, part rotation speed = 800 rev/min, duration = 30 s, belt feed = 5.5 cm/min, oscillation frequency = 13 Hz, oscillation magnitude = ±1 mm and cutting fluid = emulsion.
The belt finishing conditions were engineered at Ra ≈ 0.5 μm. The duration was selected to be sure to remove the nanosized layer and the plastically deformed layer, which is confirmed in Figure 6(e). So, no affected layer is observable on these samples.
Axial residual stress profiles were characterised. The average profile is presented in Figure 5. A typical belt-finished shape is observed with external stress σext ≈ –500 MPa. Compared to the residual stress profiles induced by turning, belt finishing induces compressive stresses within a narrow-affected depth around ≈25–50 μm. Below this layer, the original profile induced by turning is present. The affected depth of the final residual stress state is similar to the turning Δσ ≈ 100 μm. These samples differ mainly from the turned and roller burnished samples by the absence of a white layer and a strong compressive state in a thin layer near the surface.
Surface integrity features
Based on the various manufacturing sequences combining turning, roller burnishing and belt finishing, it is possible to generate a design of experiment with six lots covering a range of values for each surface integrity features. These values are reported in Table 1.
Fatigue tests
Fatigue tests were performed on a four-point rotary bending machine with a fatigue stress ratio R = –1 (Figure 3). A Walter + Bay UBM200 machine has been used to apply a constant bending moment in the sample, thanks to a dead-weight loading. Cylindrical smooth shank specimens are clamped, thanks to a self-centring collet chuck system. The machine is closed-loop, driven by a motor providing a stable rotation speed at 3000 rpm, whereas a sensor detects specimen failure.
To minimise the number of samples for each manufacturing sequence case study, a Locati test was conducted, followed by a staircase campaign. The Locati test enables rapidly evaluating the fatigue strength with a single sample thanks to the Miner 30 hypothesis on cumulative damages and on results from Rafaesky. 31 This facilitates calibrating the staircase campaign based on the work of Dixon and Mood. 32 This method uses a limited number of samples (at least 10 samples) and enables estimating the fatigue strength with a 50% failure probability at the number of cycles considered (here 2 × 10⁶ cycles). The rotation speed was selected at 3000 rpm, which leads to an average 11 h duration for each fatigue test. On the rotating-bending fatigue samples (Figure 3), the maximum bending stress applied to the external surface of the fatigue specimen can be written as (1):
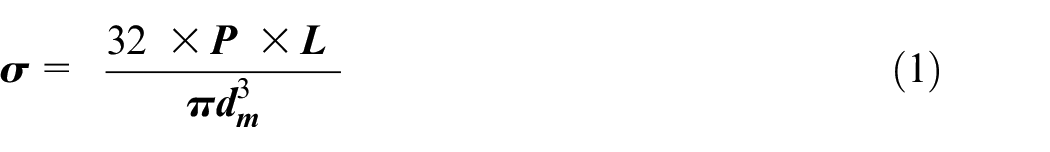
where P and L are the applied load and the length of the lever, respectively. The lever length of L = 0.5 mm is used in this study. The diameter dm in the middle of the fatigue specimen is 10 mm. The fatigue test was performed for 2 × 10⁶ cycles at each level of load.
Based on the principle of a staircase method, a first fatigue test is performed for 2 × 10⁶ cycles at a defined stress level. For instance, in the case of the ‘turning’ sample, the first level of load was 650 MPa. If the sample breaks (failure) before the deadline, a cross is plotted in the table (Figure 7) and a negative increment of load d (15 or 25 MPa) is applied for the next step. In the turning sample, the second level of load was 625 MPa. If the sample is not broken (run-out) when reaching the deadline, a circle is plotted in the table (Figure 7) and a positive increment of load d (15 or 25 MPa) is used for the next step. In the turning’ sample, the fourth level of load was 625 MPa, as the third sample has not broken at the level of 600 MPa.
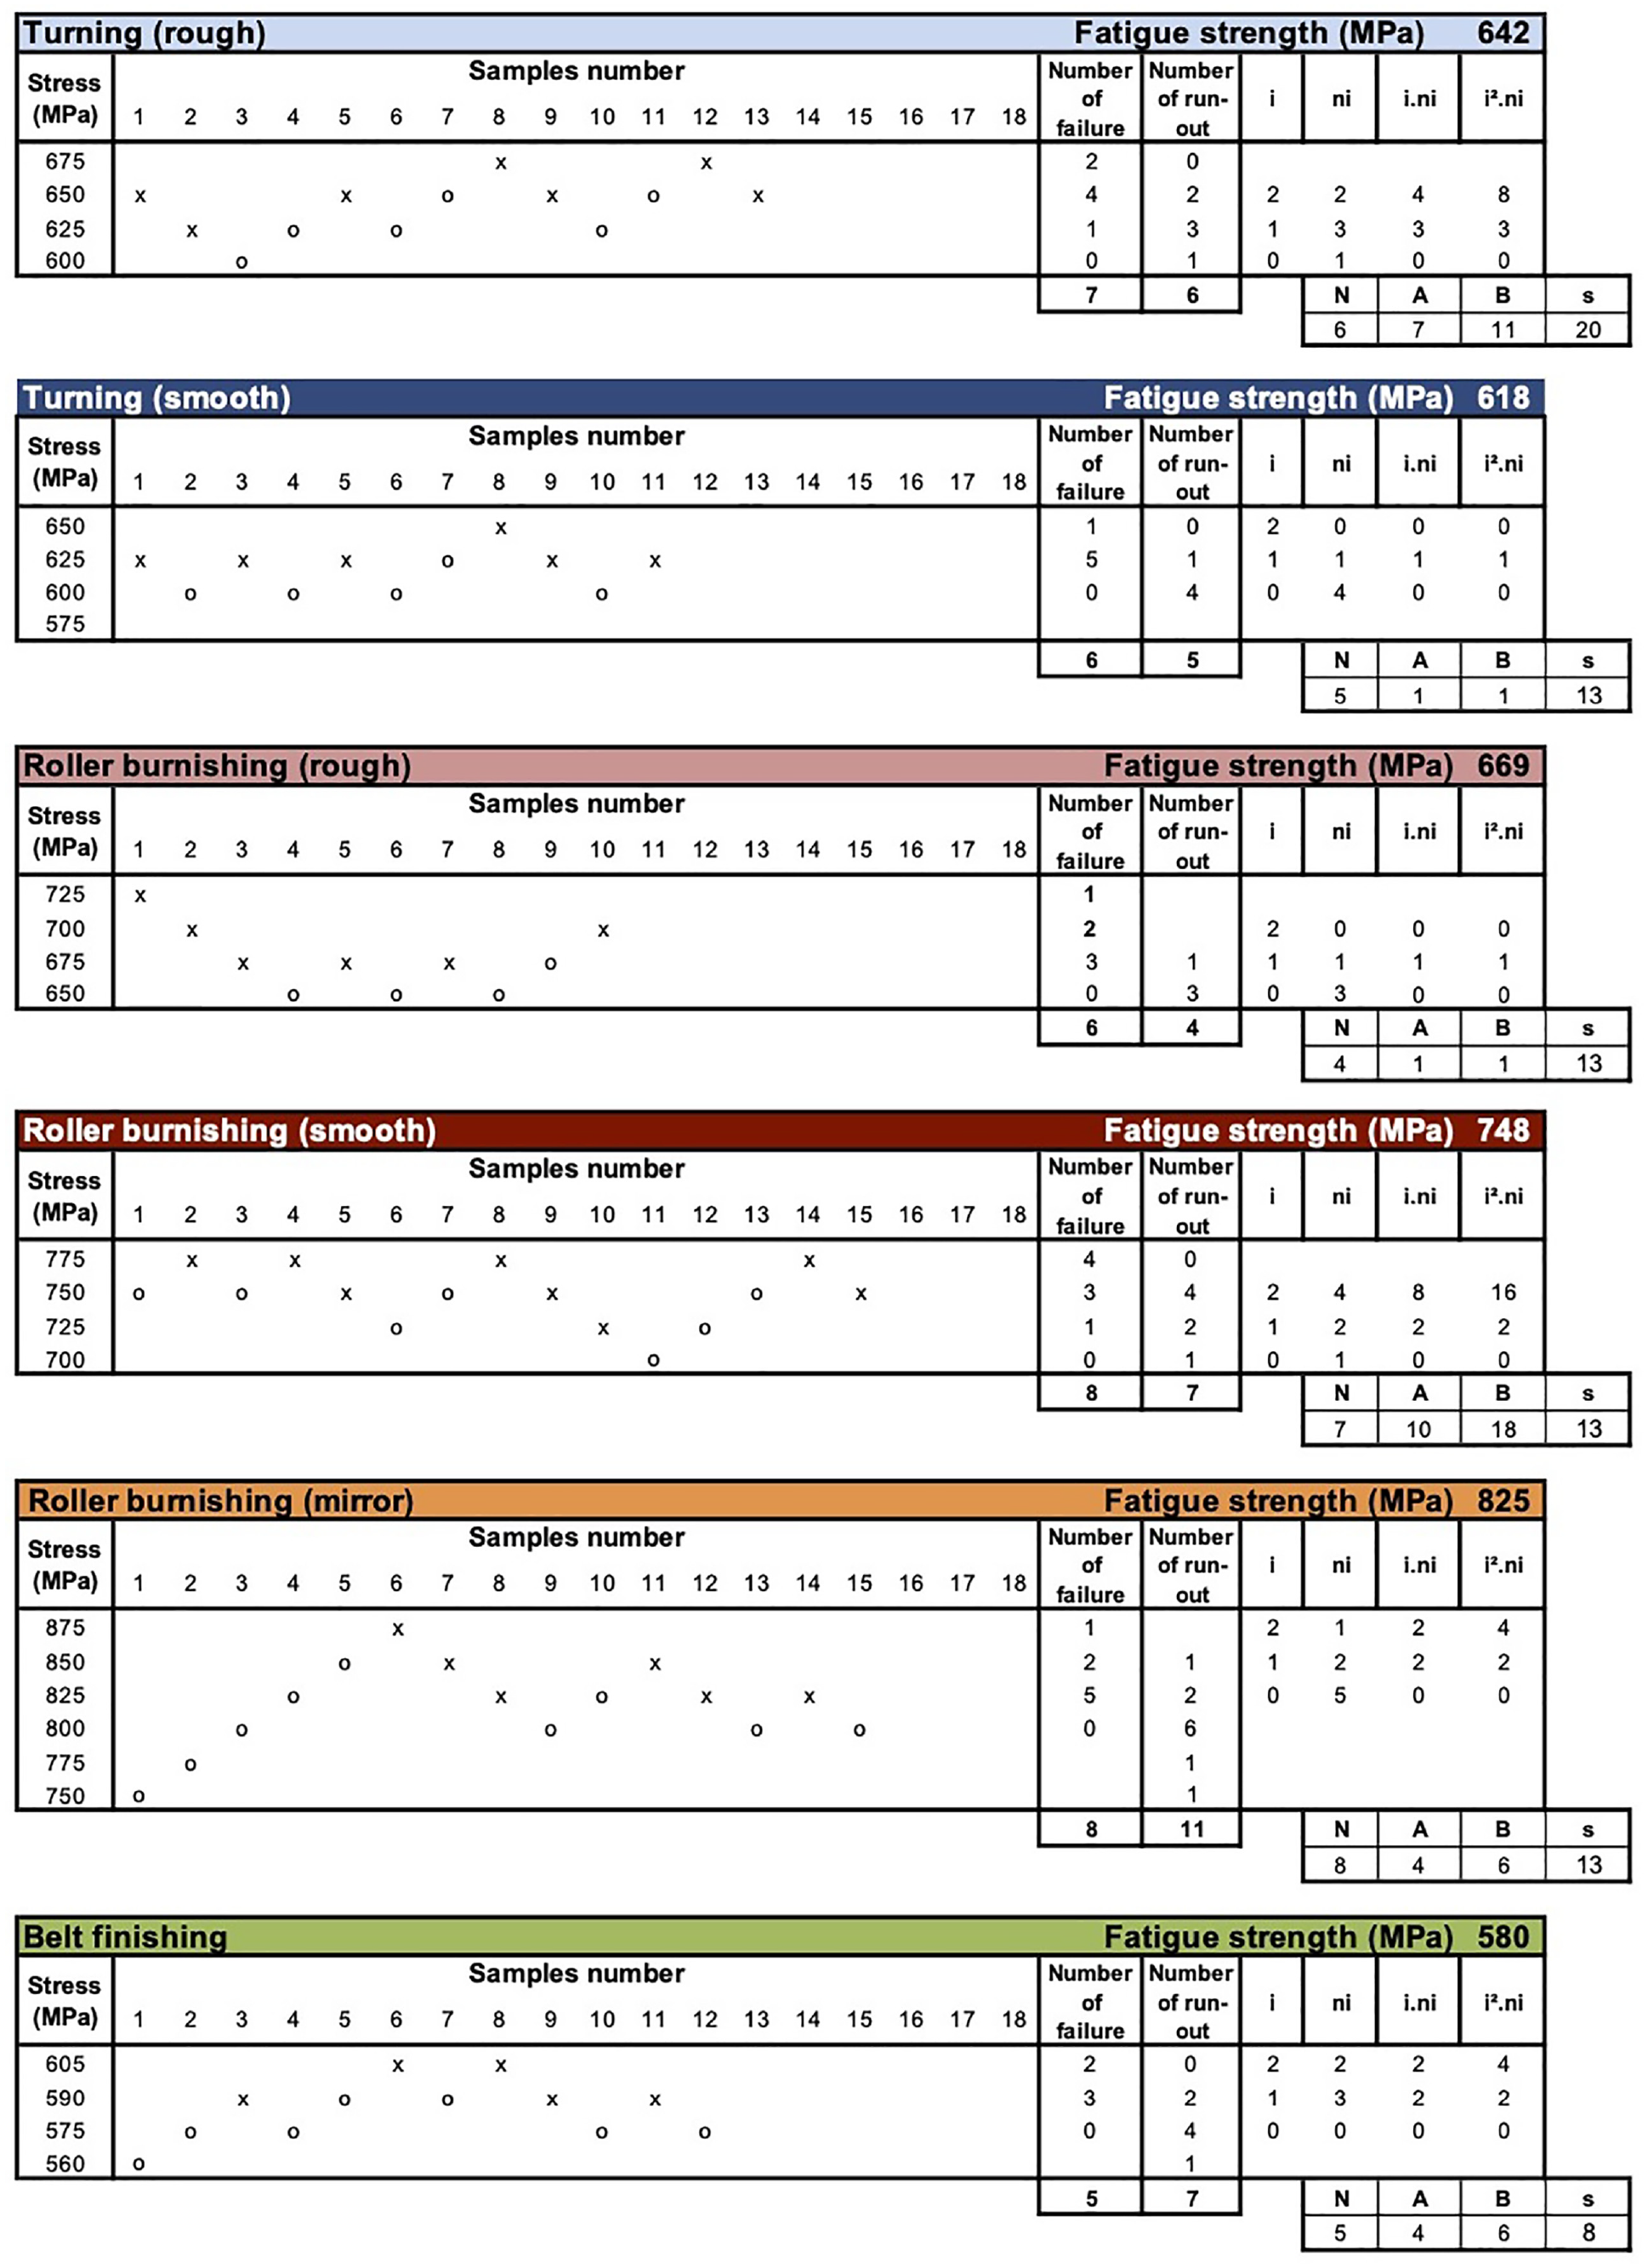
Fatigue test results following the staircase method for 2 × 10⁶ cycles
After having tested at least 10 samples, the estimation of the fatigue strength σD in the staircase method can be estimated as follows:
The fatigue strength σD can be given as (2) when the least frequent event is run-out:
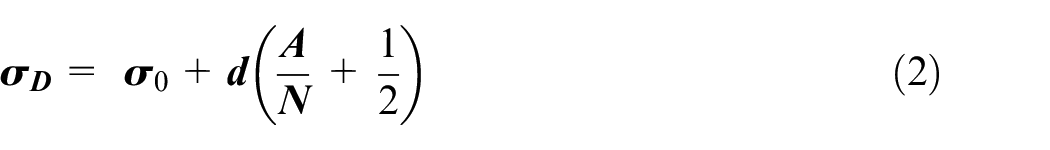
The fatigue strength σD can be given as (3) when the least frequent event fails:
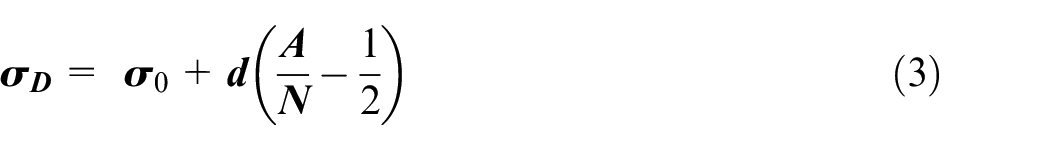
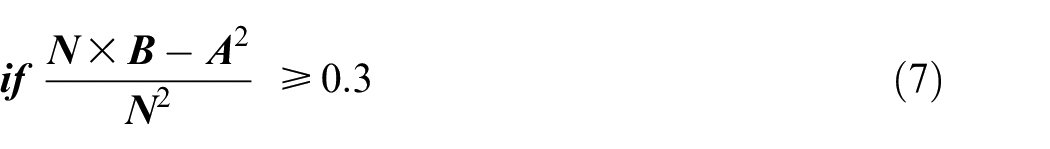
σ0 and d are the lowest stress level and the increment of stress. A, N and B can be estimated by equations (4)–(6):


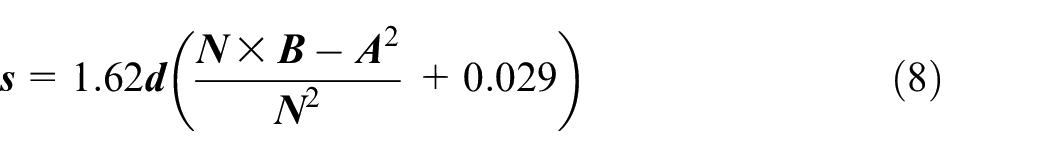
where the stress level i and the number of the events of each stress level ni are represented. The standard deviation of the fatigue limit s can be written as (8) or (10):

The loading history during the staircase campaign with the six engineered surfaces is given in Figure 7.
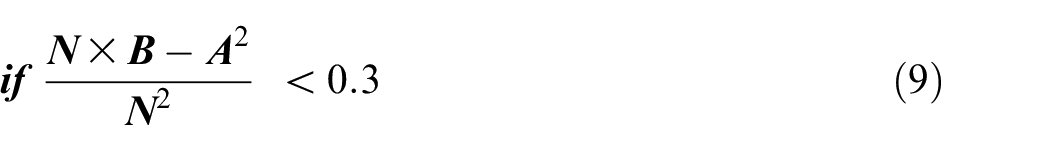
Figure 8 plots an overview of the fatigue strength σD estimated for each manufacturing sequence. As the industrial context of this work is the fatigue design of a shaft that is finished by a fine turning operation, the reference can be considered as the turned samples with the smoothest roughness (plotted in dark blue in Figure 8). The estimated strength is around σD ≈ 618 MPa. This value is something below the σD ≈ 650 MPa values reported by Rafaesky, 31 who used a conventional hand polishing operation to finish the samples without providing any details on the previous manufacturing conditions and on the surface integrity features.
Surface integrity maps of the fatigue samples.
Depending on the manufacturing sequence, the fatigue strength varies between 580 (belt finishing) and 825 MPa (roller burnishing with a mirror like surface). The previous section has shown that the six various manufacturing sequences lead to a complex combination of surface integrity features (σext, Δσ, ΔWL, ΔM, Ra), which makes it difficult to conclude immediately on the key features controlling the fatigue strength. Figures 9 to 11 show the sensitivity of each surface integrity feature.
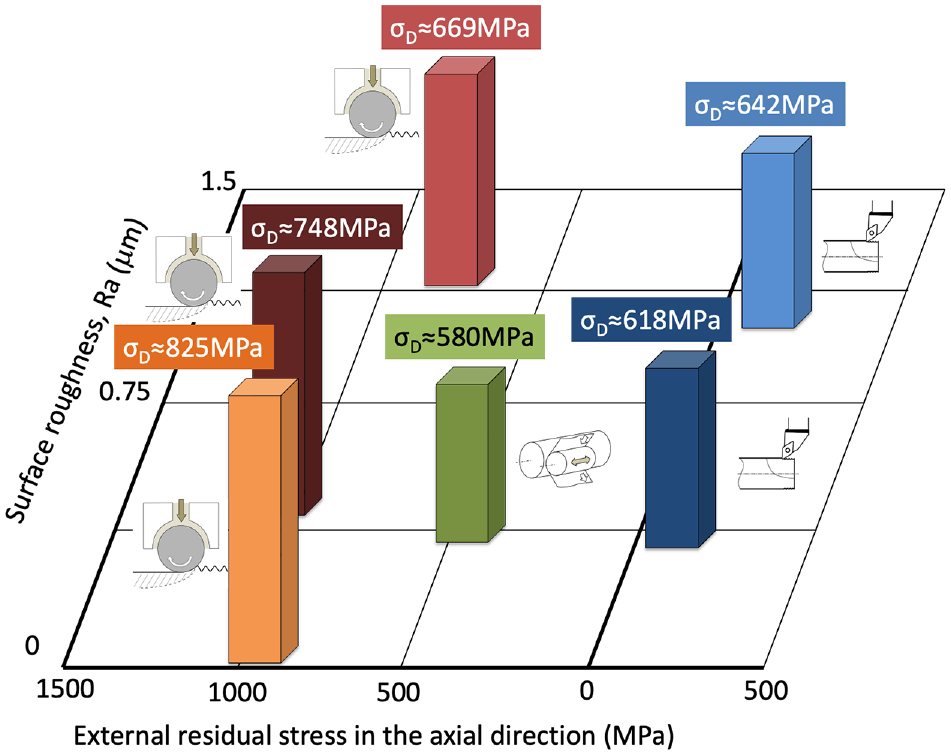
Correlation between fatigue strength and residual stress profile features.
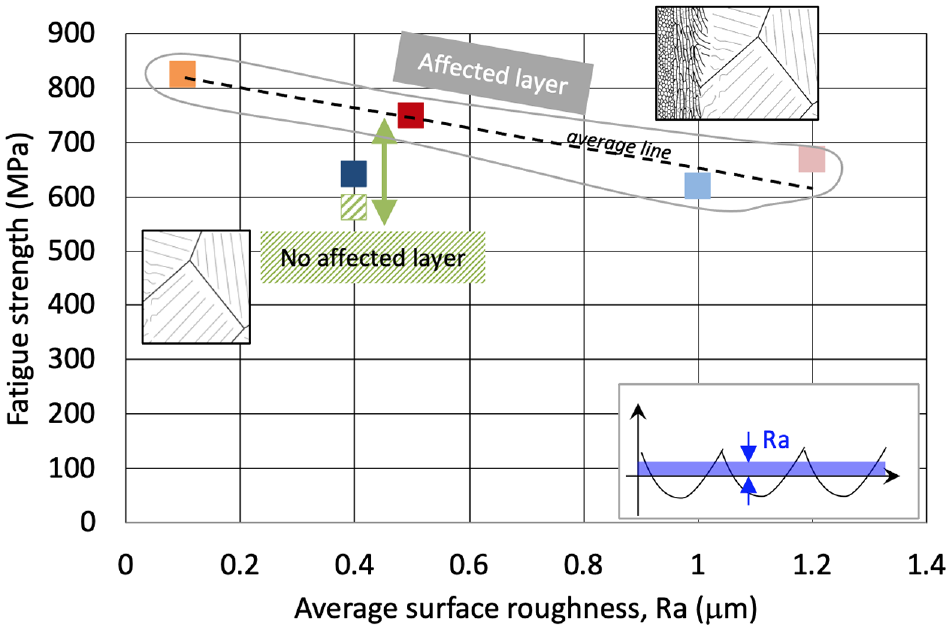
Correlation between fatigue strength and surface roughness.
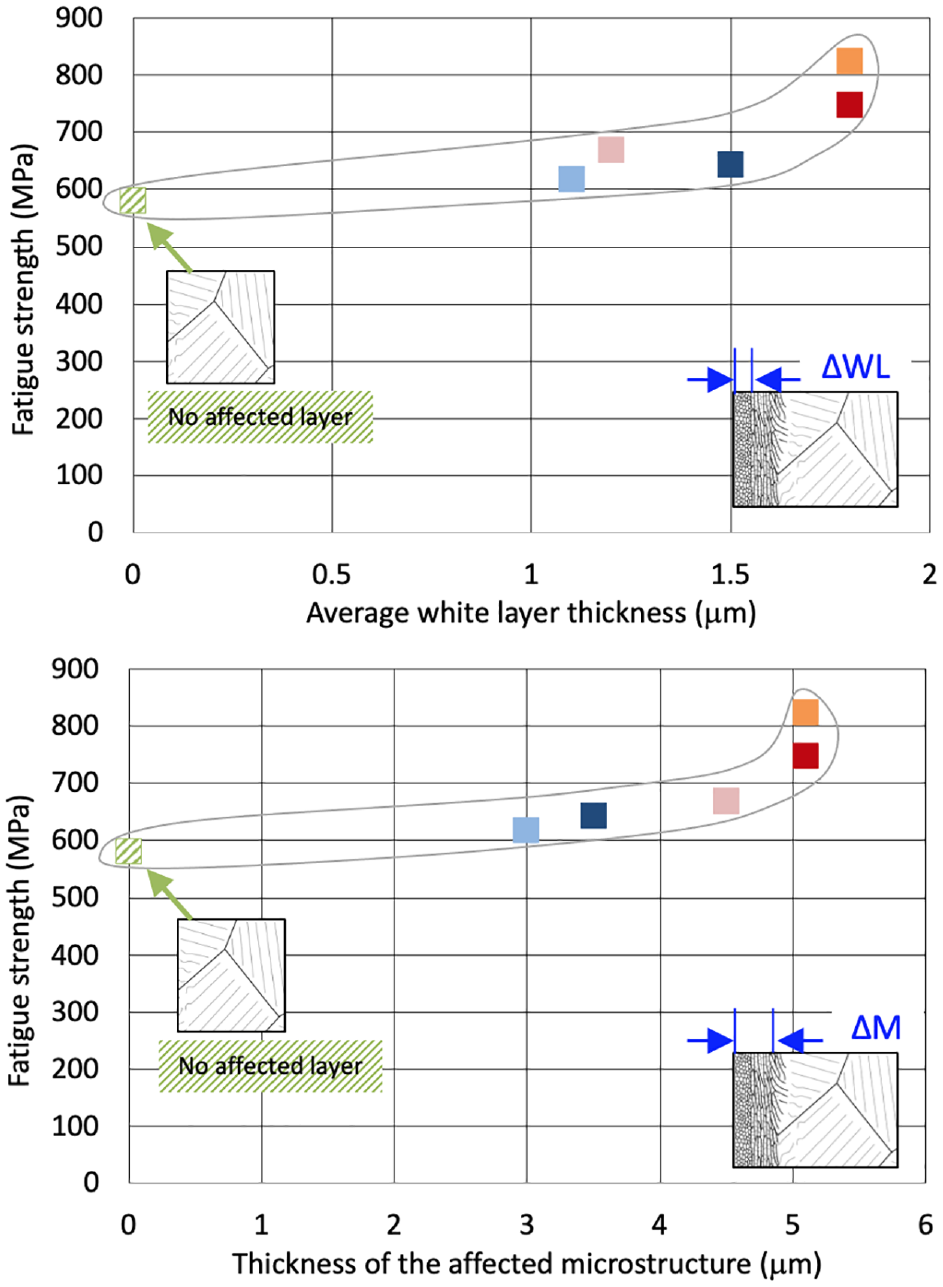
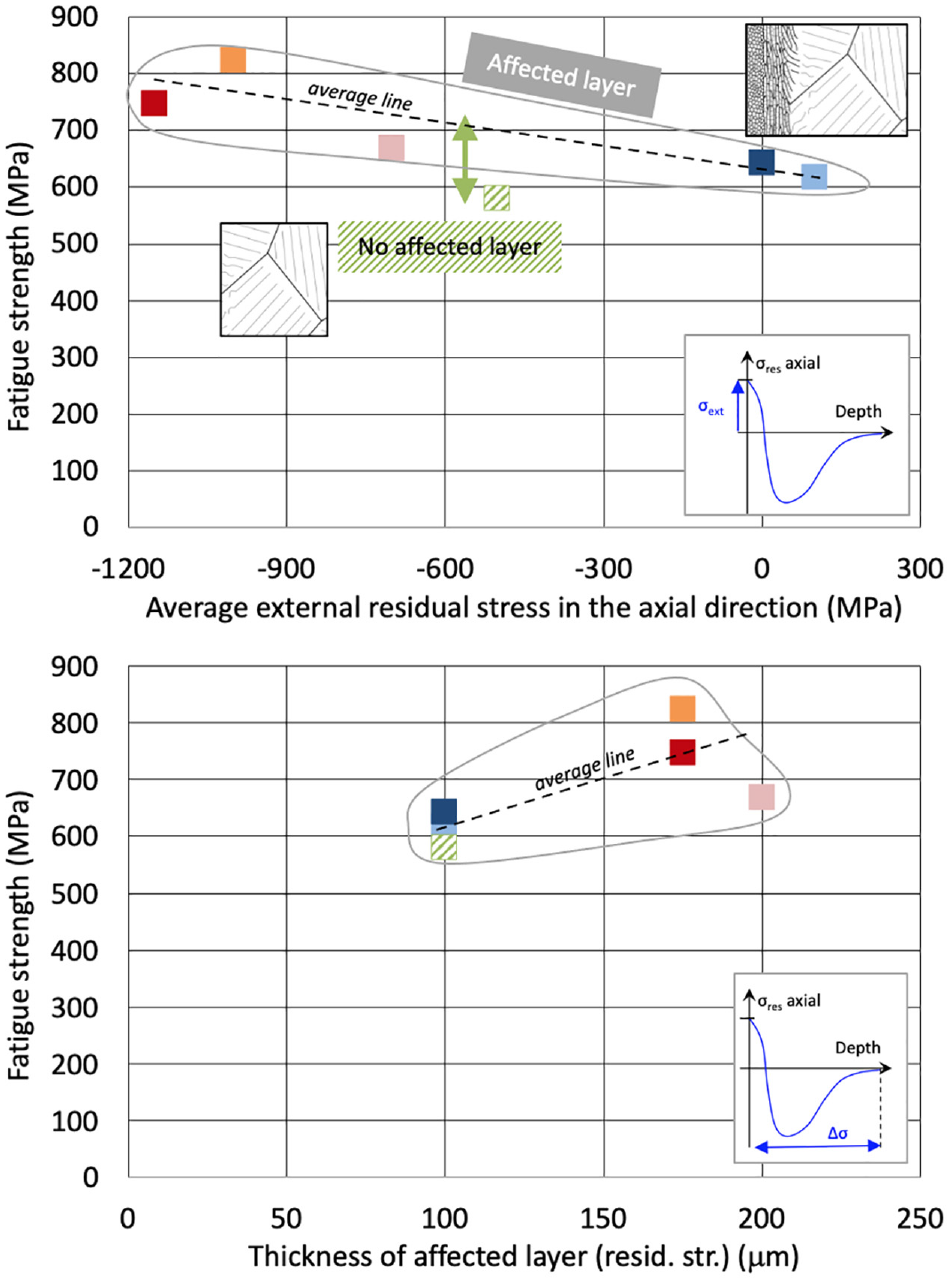
Correlation between fatigue strength and microstructure affected depth.
Figure 9 aims at correlating the evolution of the fatigue strength with the residual stress level in the external layer σext and with the depth Δσ of the affected layer. This curve confirms that this alloy is very sensitive to both residual stress criteria. The best fatigue resistance can be obtained by inducing a compressive layer combined with a thick affected layer. This result sounds as an evidence for a mechanical engineer. However, the situation for the belt-finished surface (green square in Figure 9) is unexpected, as the corresponding fatigue strength is significantly lower (σD ≈ 580 MPa) than any other surfaces even if its external residual stress level is compressive (σext ≈ –500 MPa). Surfaces having a worse residual stress state (i.e. turning: σext ≈ +100 MPa) exhibit a better fatigue resistance. So residual stress state cannot be the single parameter determining the fatigue resistance.
Figure 10 correlates the evolution of the fatigue strength with the surface roughness Ra. As expected, the fatigue strength is improved when the surface roughness decreases, which is a well-known result for many metals. Once again, the surfaces finished by belt finishing (green square in Figure 10) do not fit with the theoretical behaviour.
Finally, Figure 11 correlates the evolution of the fatigue strength with the thickness of the white layer and the plastically deformed layer. This reveals that the presence of a white layer and a deformed plastic layer benefits fatigue resistance. It explains the worse fatigue resistance of the belt ground samples, as this process fully removes the affected layer. By comparing the external residual stress, it is expected that belt ground surfaces should lead to better fatigue resistance due to a more compressive layer and a smoother surface roughness. However, the presence of the white layer is clearly beneficial to a larger extent than the absence of compressive stresses or the rough surface.
Remark: Besides the previous observations, the analysis of the fatigue strength obtained for the rough turned samples (coloured light blue in Figure 8) exhibits a slight improvement compared to the smooth turned samples (coloured dark blue): σD ≈ 642 MPa ⇔ 610 MPa. From a theoretical point of view, the contrary was expected, as other surface integrity features were close. As no clear explanations have been found, this lets us assume that this difference is probably due to a scattering effect even if the surface integrity of these samples was engineered with care.
In summary, it is confirmed that a smart combination of these three manufacturing processes (turning, roller burnishing, belt finishing) leads to complementary surface integrity features:
Ra: two to three levels of surface roughness
σext: tensile ⇔ compressive residual stresses
Δσ: deep ⇔ thin residual stress profiles
ΔWL: nanosized layer⇔ original microstructure
The six manufacturing sequences make it possible to discriminate the sensitivity of surface integrity features.
In the present application for the 15-5 PH steel, it can be concluded that there is a clear synergy effect between surface roughness, residual stress and microstructure. First, the fatigue performance is strongly influenced by the presence of a white layer containing submicronic grains. The presence of a larger number of grain boundaries seems to delay crack initiation in the case of the 15-5 PH. This confirms the observation made by Henaff and Morel 24 for another steel.
Second, a great improvement in the surface roughness may significantly improve fatigue strength even if a deep compressive state is already present. This result is not in accordance with common expectations that surface roughness plays a secondary role in the presence of compressive residual stresses. Indeed, since Li et al., 33 crack initiation in the valleys of the roughness is supposed to be delayed due to the compressive stress state, whatever the geometrical stress concentration factor is. So, the 15-5 PH steel is sensitive to a combination of thick compressive layers with very smooth surfaces.
This surface engineering methodology has the potential to contribute to the design of a part and especially the definition of the specification. For instance, as far as the 15-5 PH is concerned, it is clear that a manufacturing sequence can improve or worsen the fatigue resistance compared to a theoretical value reported in an ISO handbook (σD ≈ 650 MPa for the 15-5 PH since Rafaesky 31 ). So, surface integrity has to be specified in a comprehensive way. Especially, it is recommended to specify the grain size in the external layer in addition to the level of compressive residual stresses and surface roughness.
Conclusions
This work proposed a strategy to discriminate the sensitivity of various surface integrity features (surface roughness, residual stress profiles, microstructural state) on the fatigue resistance of a material. It was proposed to use a surface engineering strategy based on the surface integrity signatures of various manufacturing processes (cutting and superfinishing processes) to generate tailored surface integrity features. This original approach was applied to evaluate the surface integrity features controlling the rotating bending fatigue of 15-5 PH martensitic stainless steel. First, it was highlighted that the thickness of the compressive layer is the main factor influencing the fatigue strength of this alloy. Second, the fatigue strength is favoured by the presence of a nanosized grain layer (dynamic recrystallisation) on the external layer. Third, surface roughness is a secondary factor. However, the fatigue strength may be improved when combining a low surface roughness with a compressive stress state of the external layer.
Footnotes
Acknowledgements
Authors would like to express their gratitude to Airbus Helicopters and the Institut Carnot I@L for their support.
Declaration of conflicting interests
The author(s) declared no potential conflicts of interest with respect to the research, authorship, and/or publication of this article.
Funding
The author(s) received no financial support for the research, authorship, and/or publication of this article.