
Abstract
As part of the efforts to produce robust, cost effective bipolar plates, it is necessary to evaluate the forming characteristics of potential materials under consideration. For this work the relationship between strain and deformation induced surface roughness was investigated for channels made from AISI 304 stainless steel and AISI 1010 mild steel that are formed using a hydroforming process. The experiment investigated the effect of channel geometry and hydroforming pressure on surface roughness of the sheet metals under consideration. It is important to state that some functional properties and manufacturing processes of metallic bipolar plates are dependent on the surface roughness of the materials. The results indicate that the final roughness of the formed part is dependent on the initial roughness of the as received sheet. Also, the results show that the surface roughness increases with increasing forming pressure and the resulting increase in strain of the sheet metal due to deformation.
Introduction
For several years, automobile manufacturers have been developing commercially viable fuel cell vehicles with limited success. Between 2013, when fuel cell vehicles were launched and 2017 less than 6000 fuel cell powered vehicles were sold in the United States. 1 This is a negligible number of cars compared to the total sold in the US during the same time. Despite successes made in research on fuel cell technology, some major challenges are identified, including high cost of manufacturing of fuel cell stacks, durability of fuel cell units, low efficiency, and low power density resulting in the low rate of production of fuel cell powered vehicles. 2 Efforts to mitigate these challenges include reducing of material weight and volume as well as improving material utilization by producing more effective bipolar plates for PEM fuel cells with reduced thickness materials. The primary roles of bipolar plates in PEM fuel cell are: (i) to uniformly distribute H2 and O2 ions in a PEMFC, (ii) provide a low-resistance electrical interconnection between cells, and (iii) structurally support the stack of PEMFC.
Considering the number of cars produced yearly and other applications that can deploy fuel cell technology, it can be concluded that there are great potentials for fuel cell technology. To meet these potential market volumes, there is need to develop a high-speed mass production of highly efficient bipolar plates at low cost. Graphite has been the primary material used for bipolar plate production in most contemporary fuel cell stacks because of some of its desirable properties. However, its porous nature, and high mass and volume have inhibited the performance of fuel cells3–5 while at the same time graphite’s poor manufacturability has resulted in high production costs. Thus, graphite limitations have necessitated the need to research new candidate materials for bipolar plate production. Alo et al. 6 reviewed several works that have been done over a decade to replace the traditional graphite bipolar plate with metallic bipolar plate PEMFC. As a result, metals and metal alloys are now being evaluated as alternatives to graphite because of their good mechanical strength, high electrical conductivity and thermal conductivity, high gas permeability, low cost, and ease of manufacturing.2,7–11 In addition, by selecting the appropriate metal alloy or appropriate metal coating, corrosion can be mitigated. Better surface characteristics of sheet metal will enhance the electrical and thermal conductivity of the bipolar plate which will improve the performance of proton exchange membrane fuel cells (PEMFC).
A good candidate for metallic bipolar plates must have surface roughness sufficient to deliver excellent interfacial contact resistivity, can be formed into microscale channels using appropriate techniques, and it should be economically feasible.6,11 The formability of candidate metal alloys for manufacturing fuel cell bipolar plates is critical because the material must satisfy a number of functional and structural requirements.12–14 Satisfactory mechanical strength at high strains is an advantageous characteristic of some metal alloys when manufacturing bipolar plates to decrease the volume and weight of a fuel cell stack. Figure 1 shows some early examples of hydroformed plate.
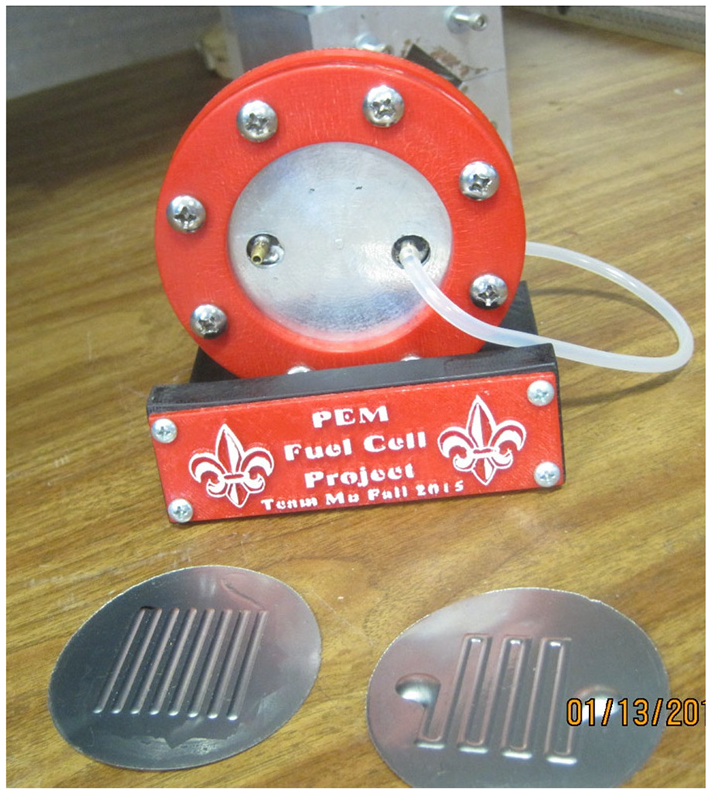
An early example of a fuel cell with hydroformed plates that are used in the construction of bipolar plates.
Most sheet metal forming processes used to produce bipolar plates are biaxial deformation processes. To capture the formability of the sheet metal, biaxial testing methods like hydraulic bulge testing are used to establish the forming limits of the sheet metal. For hydraulic bulge test, fluid pressure is used to force the sheet metal into circular or elliptical dies. The tests are stopped at predetermined bulge or dome heights or pressures.15,16 The change in dome height due to the increase in pressure and the resulting change in thickness are determined both analytically and experimentally. The strains in the bulged workpieces can be measured directly using either digital image correlation (DIC) or strain grid measurement. In addition, several researchers have used analytical approaches in conjunction with hydraulic bulge tests to determine material properties that were incorporated into finite element models of metal forming operations.10,15–17
Other researchers have used hydraulic bulge testing to determine the relationship between surface roughness and deformation in sheet metal. 16 Several of the researchers indicated that there is a linear relationship between surface roughness and strains, and that the roughness also depends on the initial roughness value of the undeformed parts 16 while other researchers have shown that the free surface roughness is dependent on deformation in sheet metal18–20 and the state of stress. 21 Factors such as the grain diameter of the materials, initial roughness, and anisotropy are reported factors that affect the roughness of a metal. 18 Leu 22 found that during tensile tests, free surface roughness decreases nonlinearly as the normal anisotropic value and strain hardening exponent decreases but increases linearly with effective strain or grain size. Abdolvand et al. 23 used high resolution electron backscattered diffraction (EBSD) and crystal plasticity finite element model to study the effect of strong grain neighbor in polycrystals. They cross correlated kikuchi patterns for the calculation of elastics strain and lattice rotations simulated deformation in each grain using a crystal plasticity user material (UMAT) subroutine in Abacus FE program. They found that the stress along the loading axis decreases with increasing tensile plastic flow which is controlled by the crystallographic orientation of the grain and its immediate neighbor. Dautzenberg and Kals 24 used several testing techniques including tension and bulge tests to investigate surface roughness caused by metal forming. They used elements from plastic theory and Taylor’s model to develop a model for roughness for metal forming processes that showed that surface roughness can be defined as a function of deformation. Zhang et al. 25 observed that for FCC metals that the initial surface roughness impacts the free surface roughness of parts under tensile loading such that higher initial surface roughness may result in less surface roughness after plastic deformation lower initial surface roughness may result in increased roughness during uniaxial tension processes.
The goal of the current study is to examine the development of roughness when microscale hydroforming capillary channels that are representative of those in PEMFC bipolar plates for two common ferrous alloys that could reduce the costs and increase the robustness of fuel cells. For this study the effect of deformation, channel width, and forming pressure during microscale sheet hydroforming producing 1-mm and 2-mm wide channels for 100-micron thick annealed AISI 304 stainless steel and hard tempered AISI 1010 mild steel was examined.
Materials
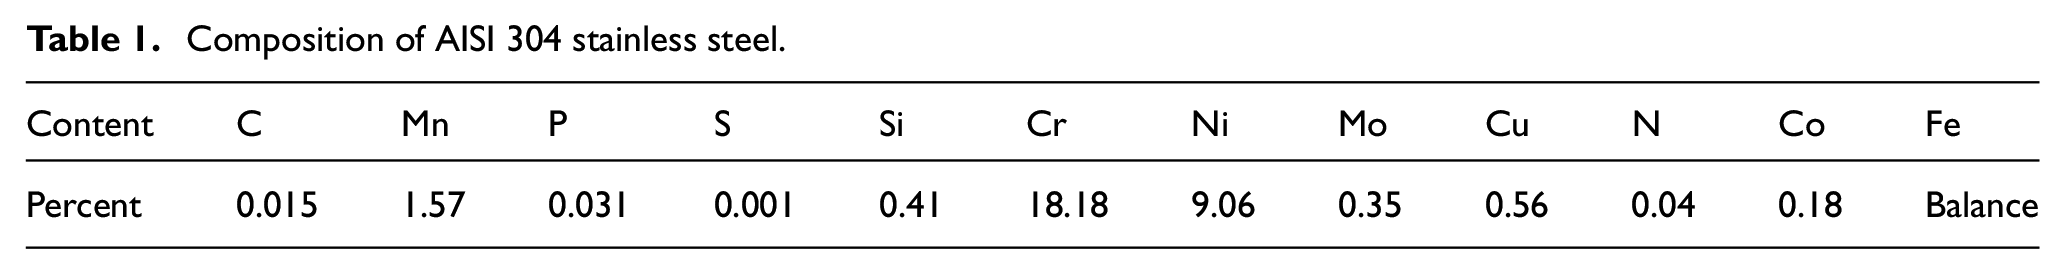
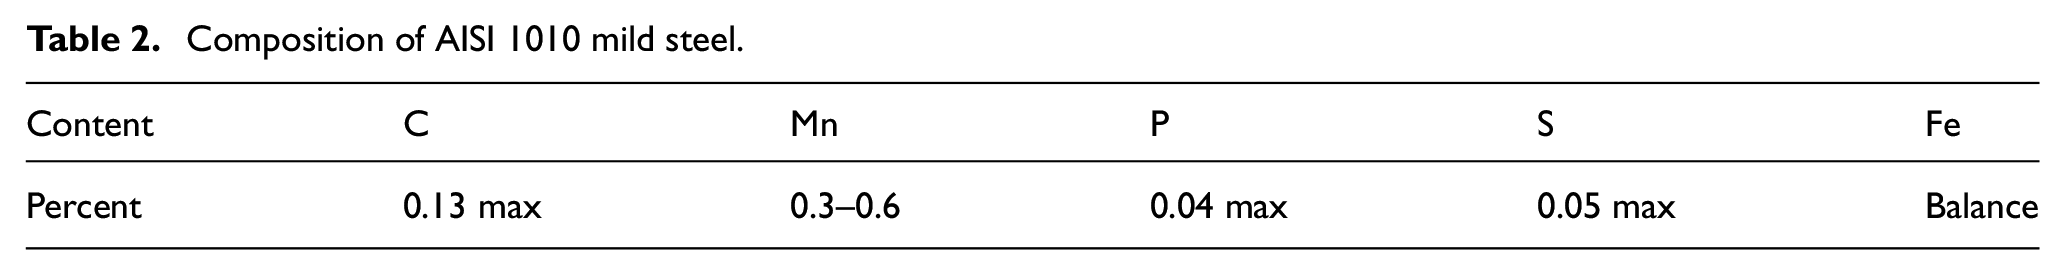
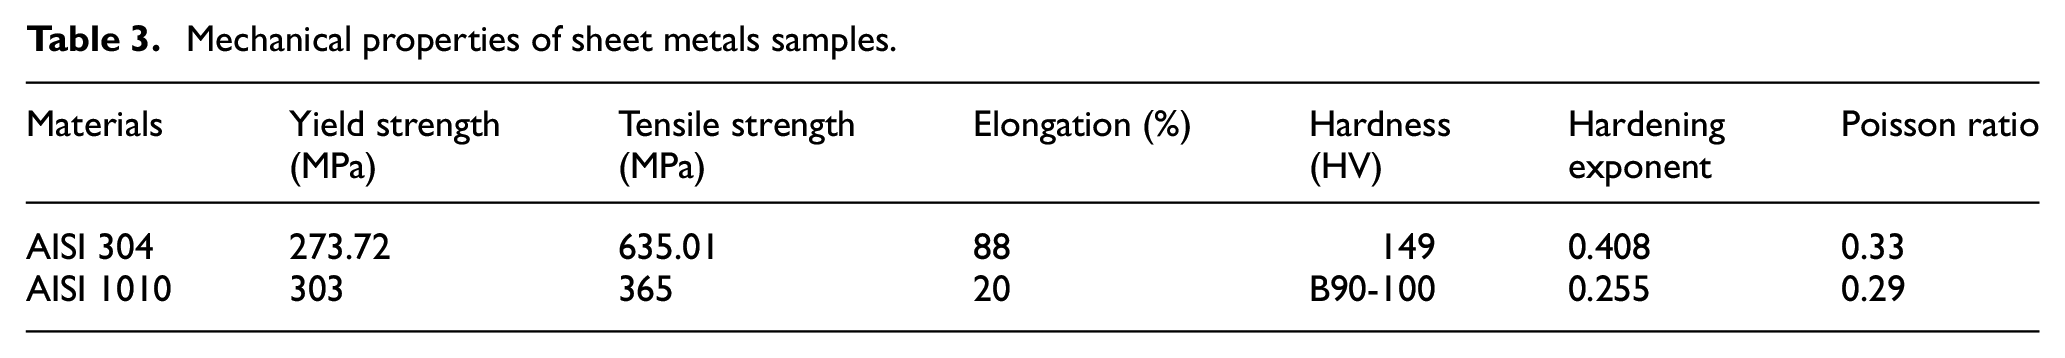
The materials chosen for this study are 100 µm thick annealed AISI 304 stainless steel (Brown Metals Company, USA) and fully hard tempered mild steel AISI 1010 (Precision Brand Product, USA). The chemical composition of stainless steel and mild steel are provided in Tables 1 and 2 respectively. Table 3 shows the mechanical properties of the two sheet metals.
Composition of AISI 304 stainless steel.
Composition of AISI 1010 mild steel.
Mechanical properties of sheet metals samples.
AISI 304 stainless steel is the most common stainless steel; it is an austenitic stainless steel with face centered cubic (FCC) crystal structure. This alloy (AISI 304) is used in a variety of applications ranging from cooking ware to machinery and automobile parts. Like many other stainless-steel alloys, AISI 304 has very high corrosion resistance in chloride, sulfide, and other oxidizing environments. However, it has inferior thermal and electrical conductivity compared to mild steel. When AISI 304 stainless steel is annealed, it enhances its overall formability.
AISI 1010 carbon steel is a mild steel with carbon content between 0.10% and 0.13%. It is very useful in applications where material accuracy and economy are of importance. This steel has relatively low strength, but it can be quenched and tempered to increase strength. Generally, mild steels have poor corrosion properties, but they can be protected with appropriate coating material for improved corrosion properties.
Methodology
Bulge tests and channel forming
The hydraulic bulge test is known to have greater range of plastic strain before fracture compared to other conventional material-testing techniques like uniaxial tension tests. It also has an advantage that the strain at the pole of the bulge can be determined analytically by accurately measuring the height of the dome and the diameter of the die. The current experimental method is based on the method described by Olayinka et al. 16 Microscale hydroforming was used to form channels in sheet metals to investigate candidate materials that satisfy structural and morphological requirements for PEMFC. The schematic of the sheet hydroforming experimental setup is shown in Figure 2(a). A 60-ton press (Baldwin, USA), in the setup, was used to apply clamping force. The work piece was placed on the die system located in the lower tooling as shown in Figure 2(b) and (c). An O-ring ensured that there was a good seal between the upper platen and the work piece during the test.
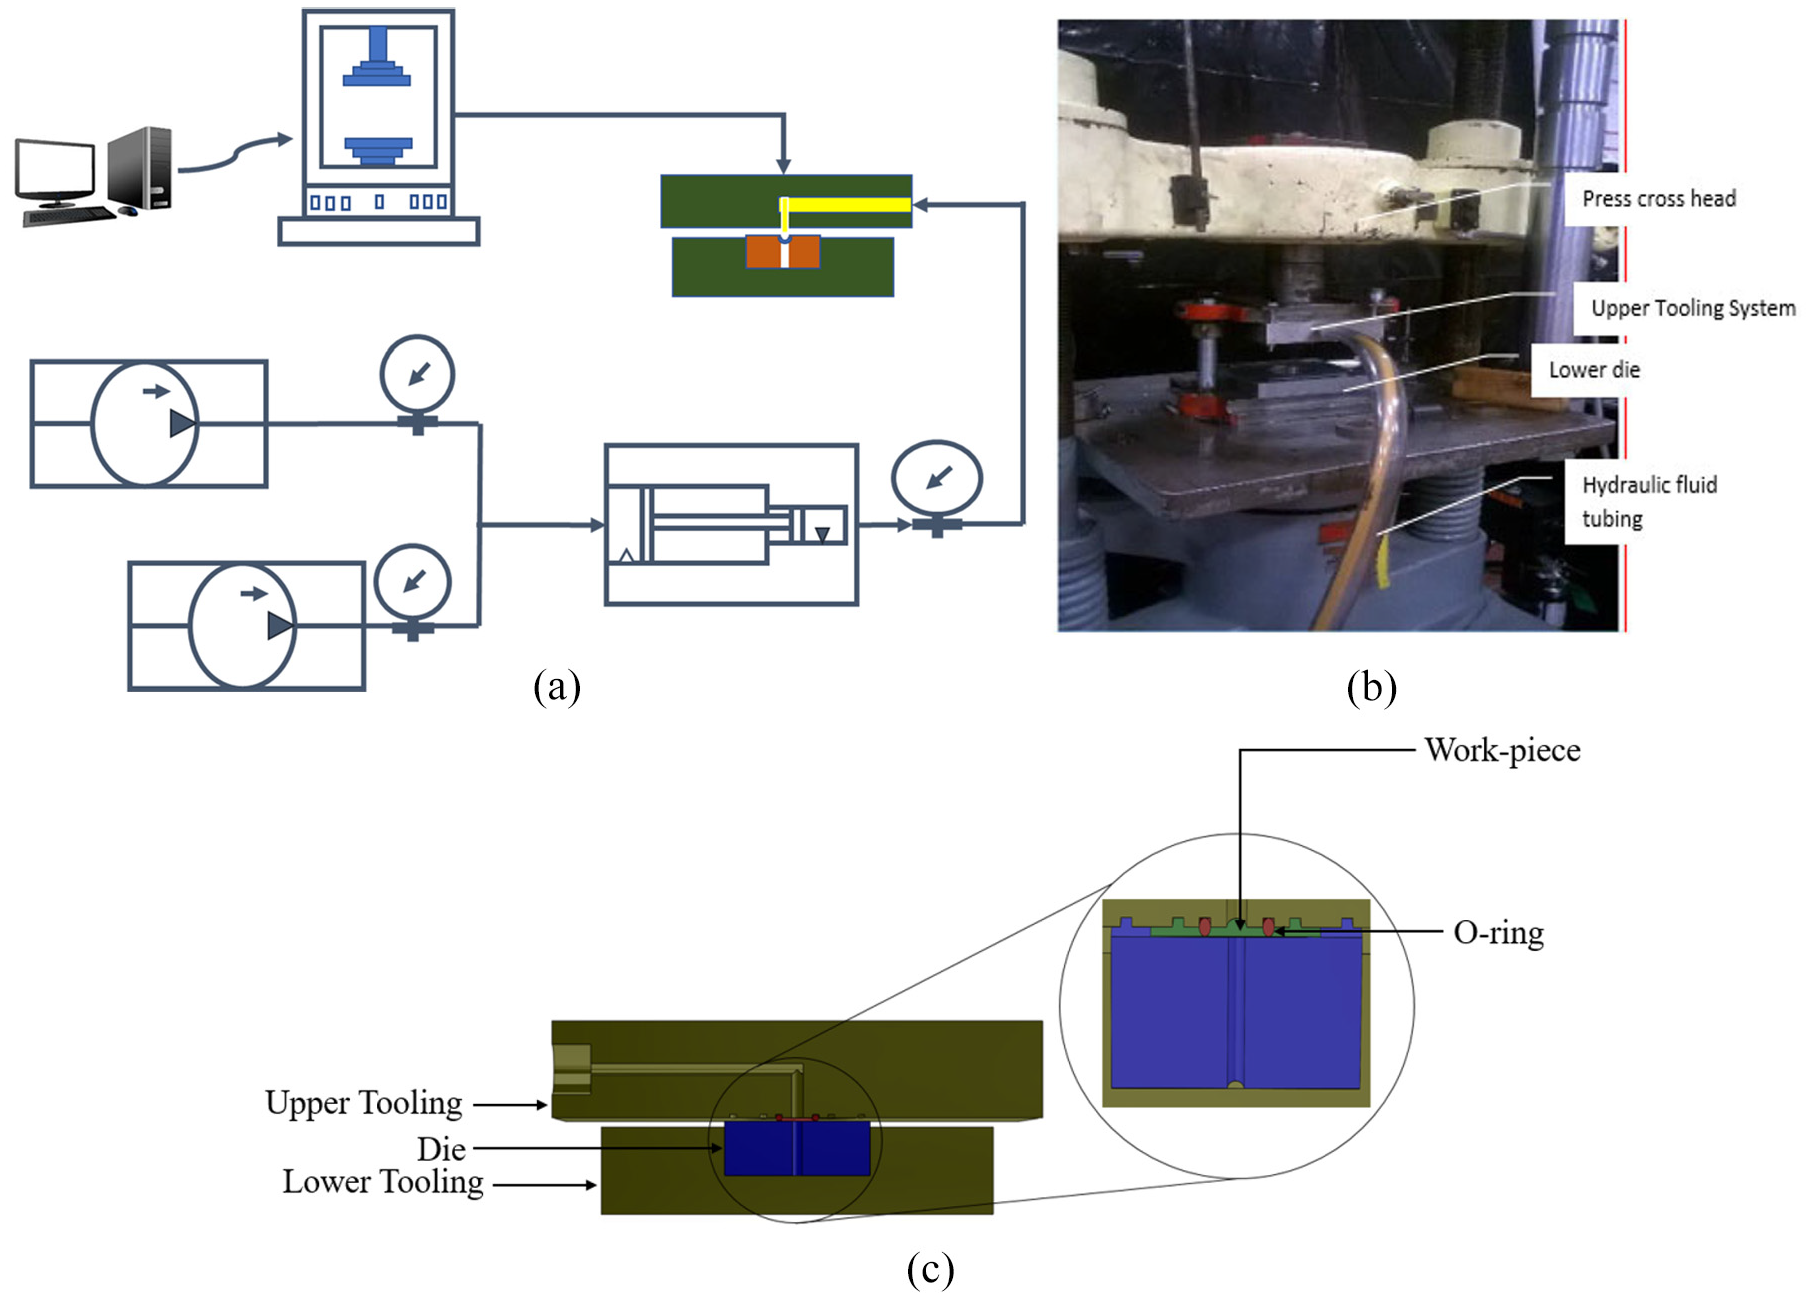
Hydroforming system set up: (a) hydraulic system schematic, (b) the Baldwin press and the die holder and (c) tooling setup.
Figure 3 is a schematic of the (a) bulge test process and (b) channel forming process. The dies used to form 1 and 2 mm wide channels are shown in Figure 4 and typical channel specimens are shown in Figure 5. A blank holder force of 20 kN was applied to ensure a good seal between the upper tooling, O-ring, and work piece. The pressurized hydraulic fluid was pumped through the upper tooling, forcing the workpiece into the lower die. The peak pressure was measured and recorded for each test using the pressure gage installed on the pressure intensifier. Once the desired bulging pressure was attained, the test was stopped, and the workpiece was removed. The dome height was measured after each test using a digital micrometer (Mitutoyo, Japan). The same process was repeated for the channeled samples.
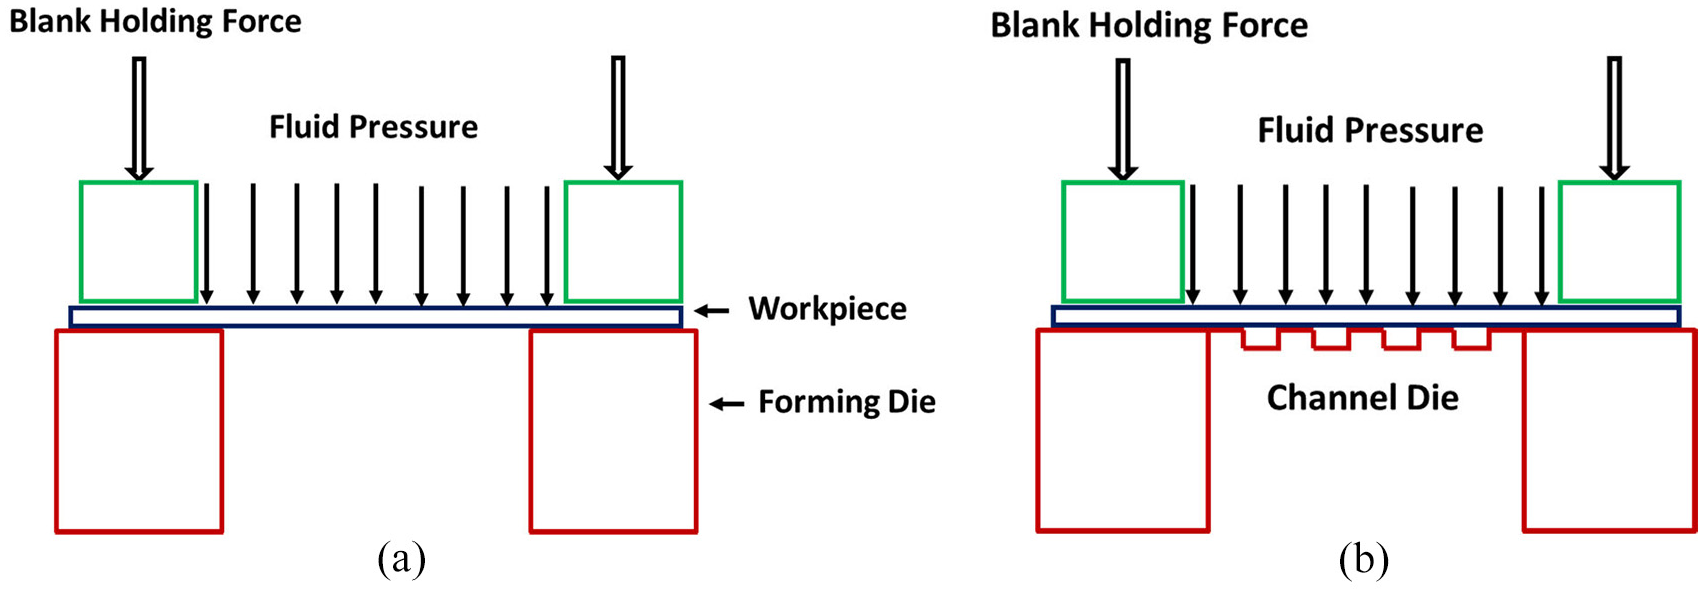
Schematic hydroforming: (a) hydraulic bulge test and (b) channel hydroforming.
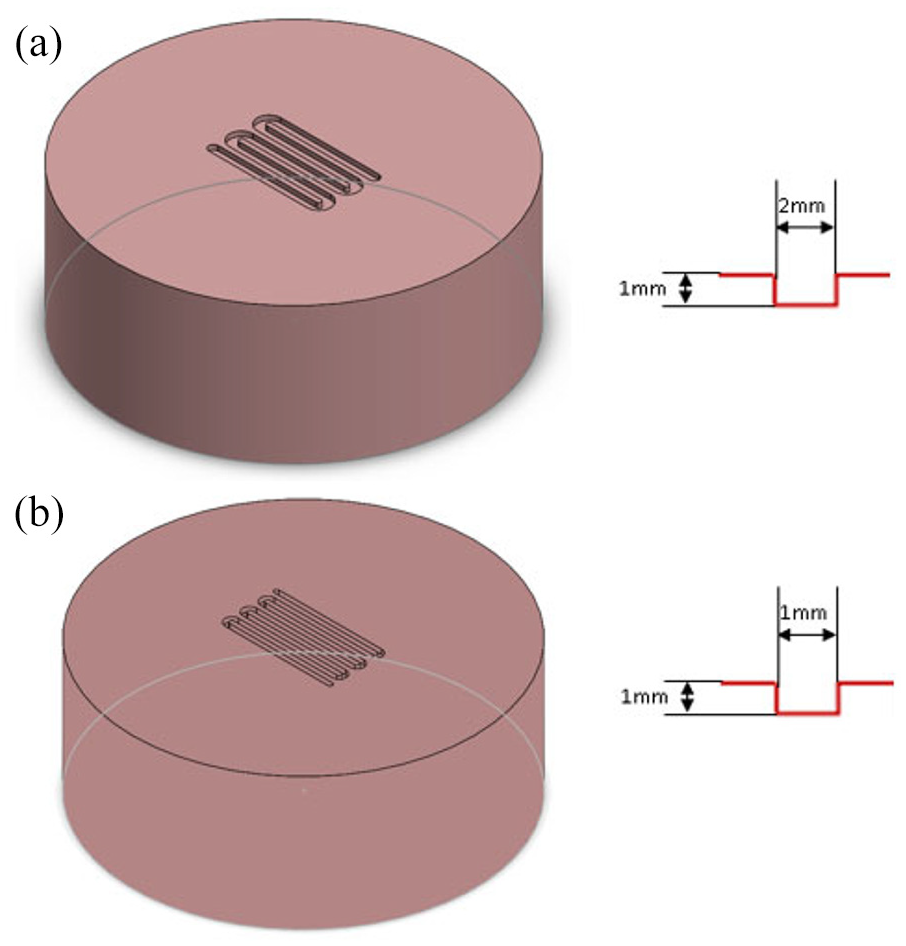
Channel dies: (a) 2-mm wide channel and (b) 1-mm wide channel.
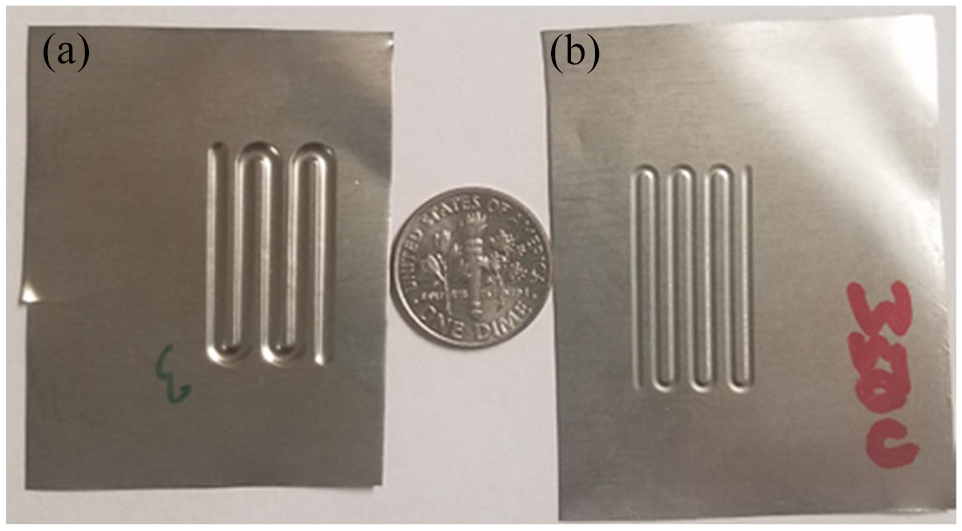
Hydroformed channels in work pieces: (a) 2-mm channel and (b) 1-mm channel.
Surface roughness measurement
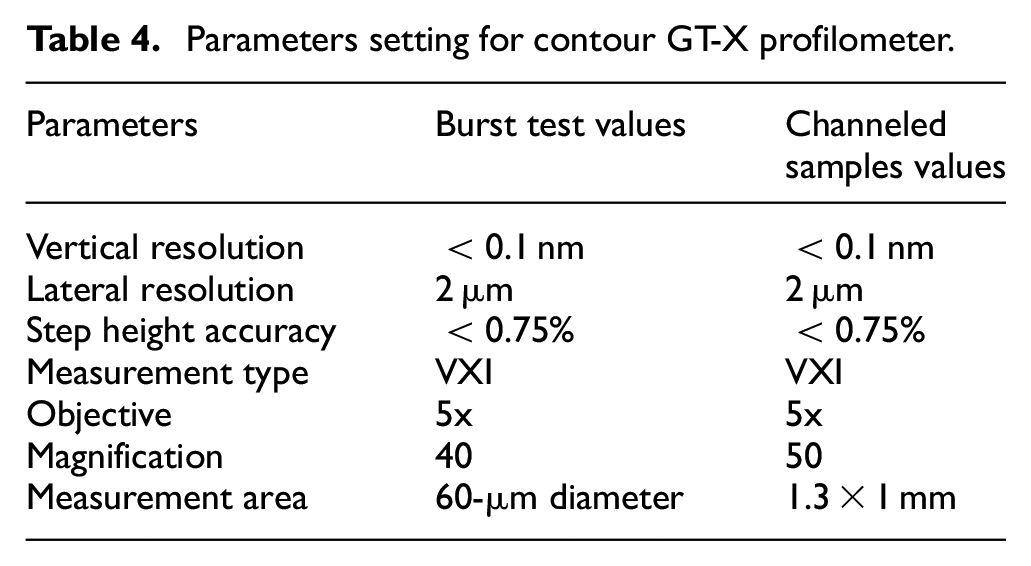
The annealed AISI 304 stainless steel samples and the tempered AISI 1010 mild steel were hydroformed at different pressures for the bulge test samples (5-mm diameter die) and for the channel samples. The samples were rinsed in acetone to remove contaminants that could interfere with the roughness measurement. The rinsed and degreased samples were air dried and subsequently wiped using denatured alcohol. A 3D optical profilometer GTK-17 (Bruker, USA) was used to evaluate the roughness parameters of the sample surfaces. The parameters of the optical profilometer are shown in Table 4. Figure 6 is the schematic of the optical profilometer. The samples were positioned on the sample stage of the profilometer carefully, and the spacing between the samples and the objective lens were set in order to ensure the surface is in focus. The scanned area was 60 µm in diameter for the bulge test and 1.3 × 1 mm for the channel samples.
Parameters setting for contour GT-X profilometer.
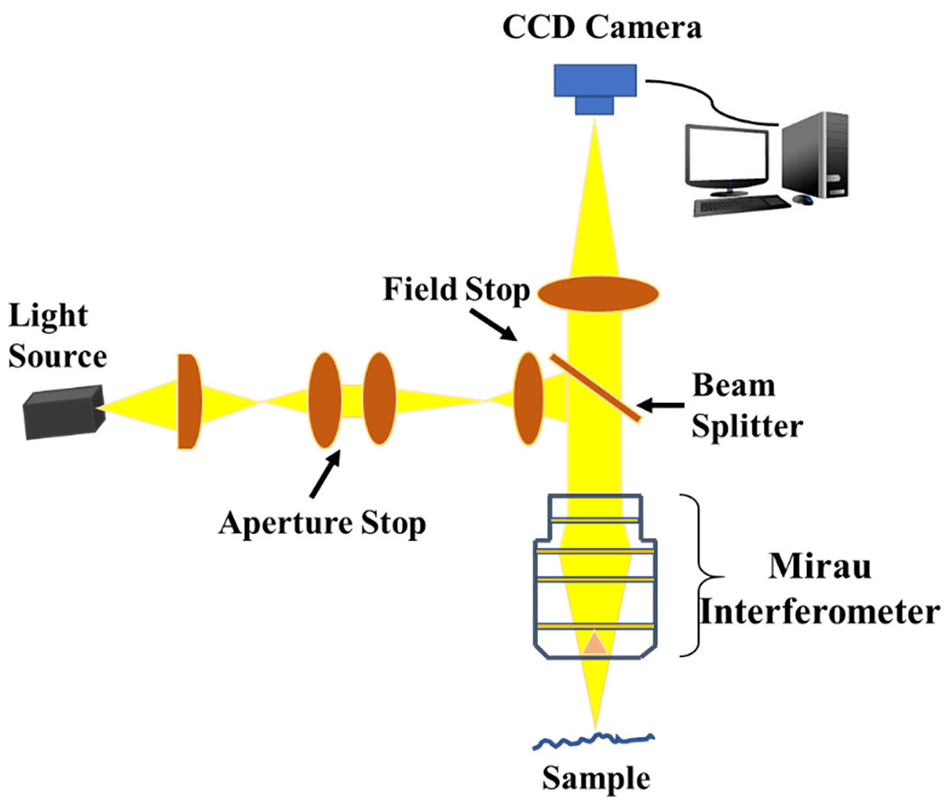
Schematics of an optical profilometer.
Result and discussion
Bulge test results
Figure 7 shows the plot of forming pressure and the dome height for the bulge tests. It can be seen for both the AISI 1010 mild steel and the AISI 304 stainless steel that the relationship between dome height and pressure is linear until just prior to fracture. Each data point represents three tests with a high degree of repeatability. At the maximum bulge height just prior to burst, the strain was determined to be about 55% for the stainless steel samples and 23% for the mild steel samples.
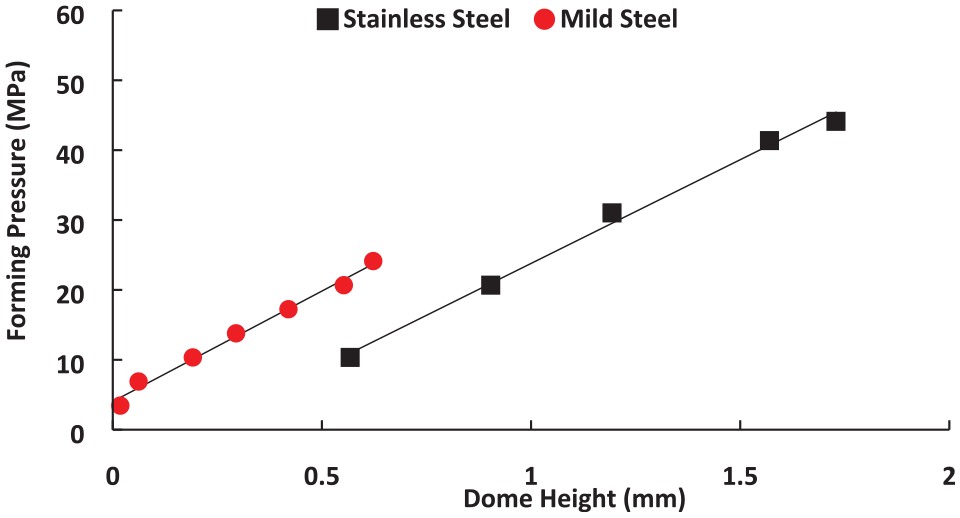
Plot of forming pressure against dome height for stainless and mild steel samples.
Figure 8 shows the plot of the dome height and strain for the bulge test. The maximum dome height was measured just prior to the burst pressure, and strain was determined. It can be observed from the plot that power law relationship was established for both the mild steel and stainless steel samples.
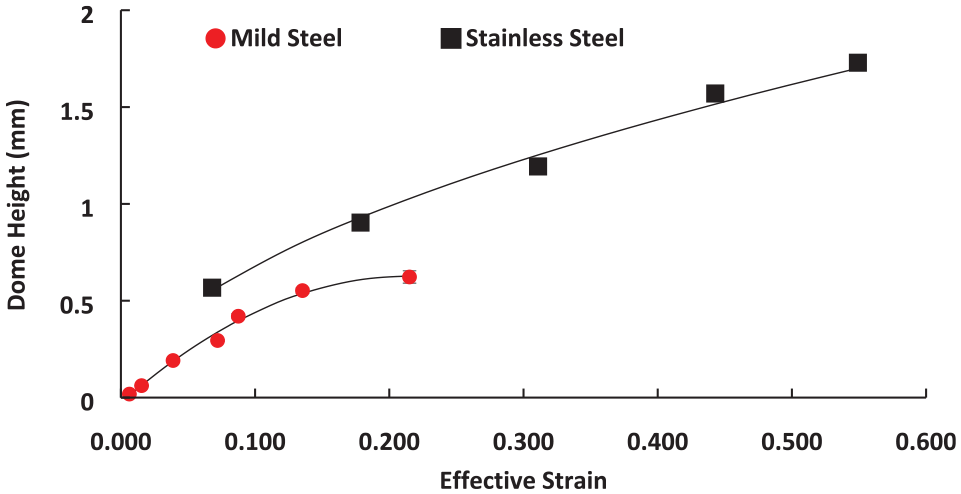
Plot of dome height against strain for stainless and mild steel samples.
Figure 9 shows the roughness map for blank of both the AISI 304 stainless steel and the AISI 1010 mild steel samples. The maximum value of the roughness obtained for the undeformed AISI 304 was approximately 1-µm while the maximum value of roughness for the undeformed AISI 1010 was 5-μm. This shows that mild steel samples do have a relatively high initial surface roughness before the deformation. In Figure 10, the average roughness (Sa) for the AISI bulge tests samples appear to have a linear relationship with respect to strain up to 0.45 strain. At this point, the roughness experienced a slight reduction until the samples failed. This reduction can be attributed to the stretching of the grain boundaries at high strain and also the sustained stretching of the macroscale roughening like waviness will result in reduction in the average roughness. The average roughness in the mild steel samples appears nearly constant up to fracture, there was a slight decrease in the average roughness up to about 7% strain after which the roughness remain constant until burst. The roughness in the mild steel sample deviation from the power law relationship with strain can be attributed to the high value of the initial average roughness of the blank material. This high values could be as a result of macroscale roughening characteristics such as waviness. In addition to this, the mild steel sample bursted at a relatively low strain compared to the stainless steel maximum strain. The result shows highest strain of about 0.2 in the mild steel sample compared to 0.45 strain recorded for the stainless steel sample. The understanding that surface roughening is impacted by grain rotation and grain neighbor effect during continuing straining shows that higher strain would produce more surface roughening.
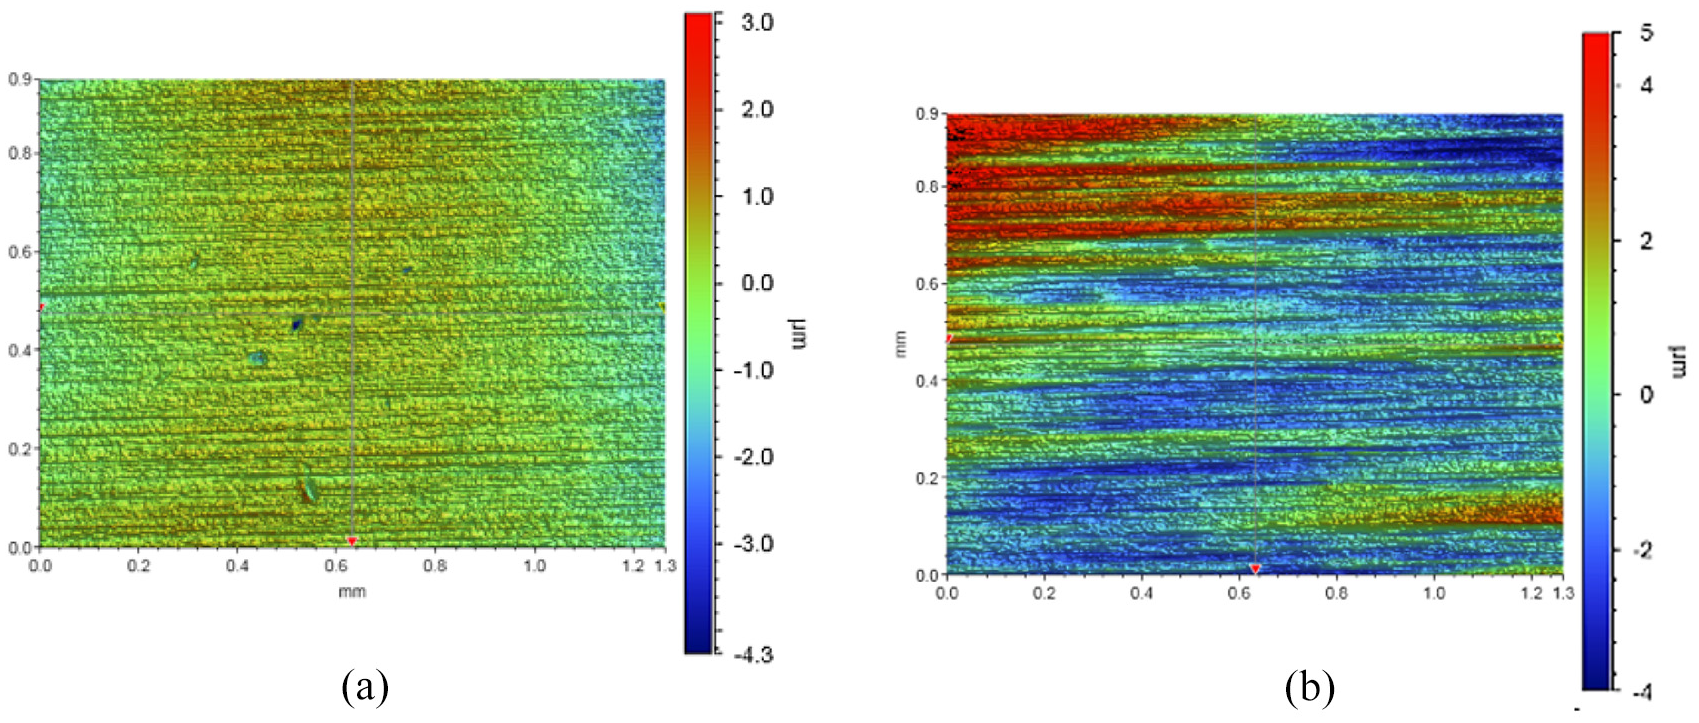
Roughness map for undeformed samples: (a) annealed AISI 304 and (b) AISI 1010.
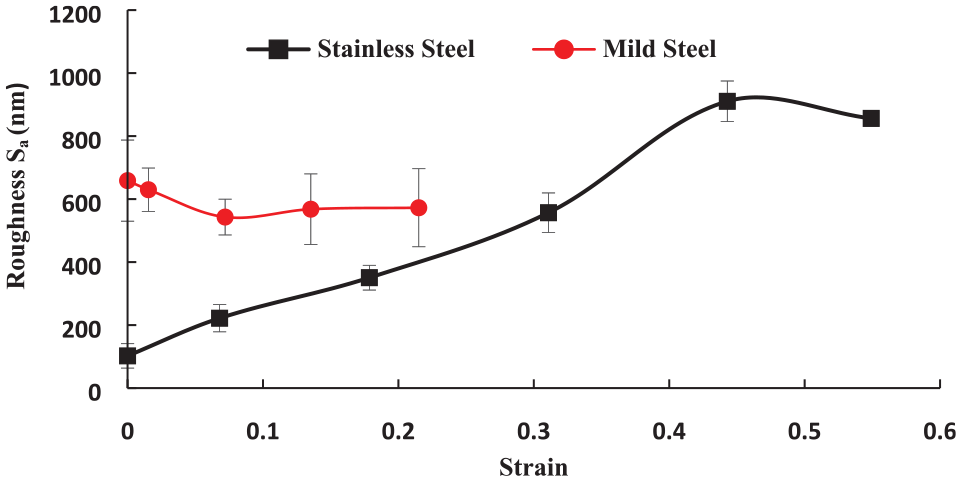
Plot of average roughness (Sa) against strain for stainless and mild steel samples.
Channel samples results
Figures 11 to 13 show the change in the roughness parameters due to increased forming pressure. Figure 11(a) and (b) show typical 3-D topographical images obtained by using a contour GT-K profilometer for stainless steel and mild steel. Figures 12 and 13 compare the roughness parameters Sa and Sz for the stainless steel and the mild steel as function of forming pressure.
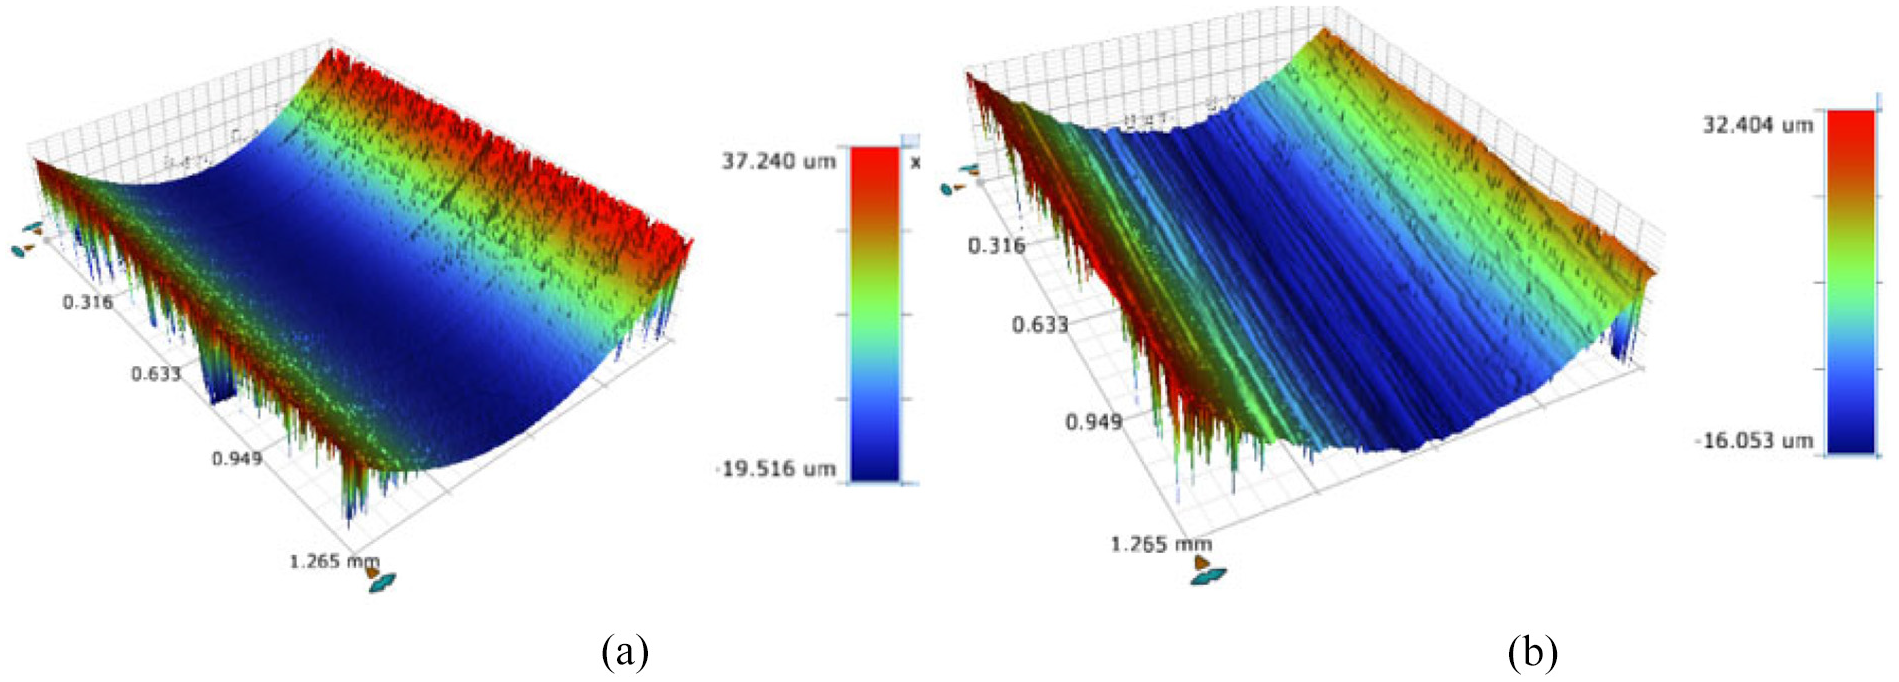
3-D roughness map for: (a) AISI 304 Stainless steel and (b) AISI 1010 mild steel just before burst.
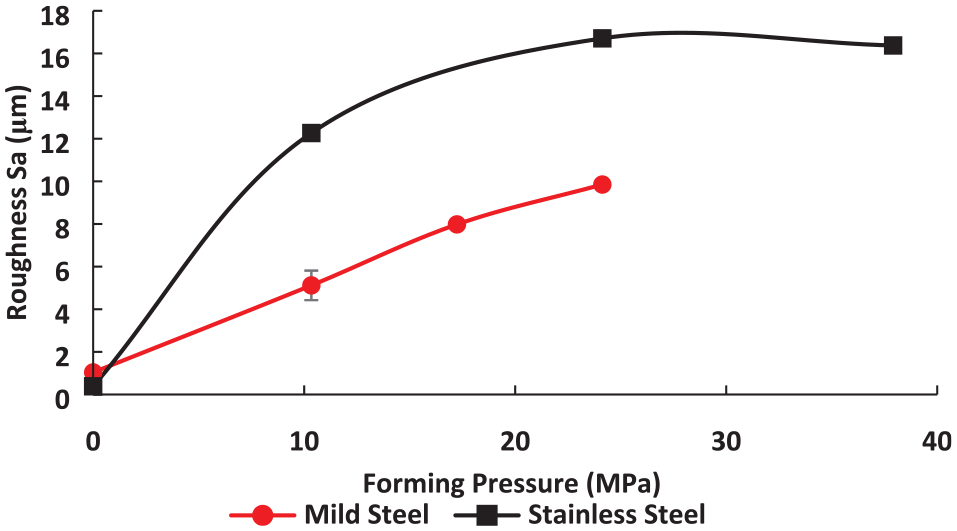
Plot of mean roughness (Sa) against forming pressure for stainless and mild steel for 2-mm wide channel samples.
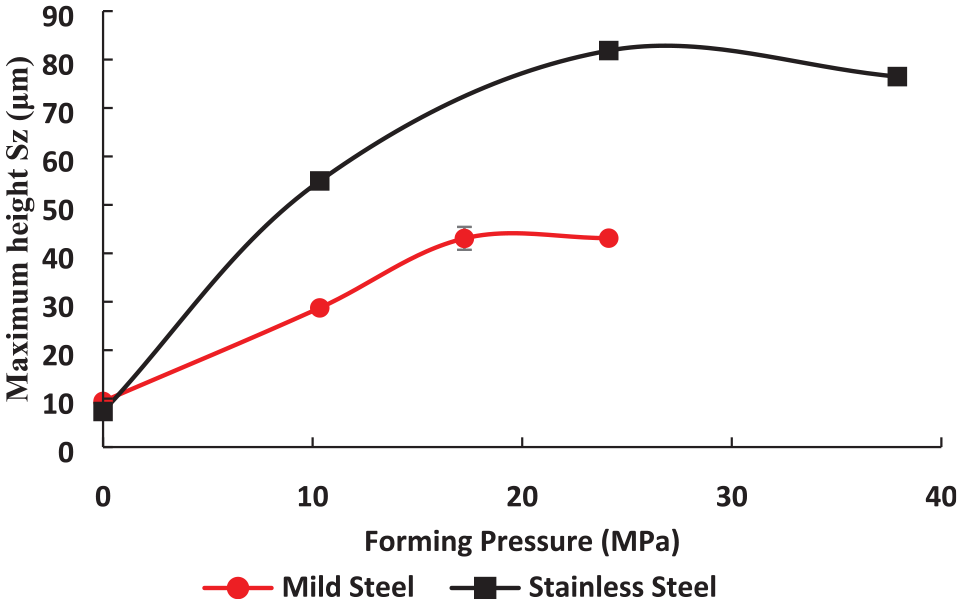
Plot of maximum height (Sz) against forming pressure for stainless and mild steel 2-mm wide channel samples.
Figure 12 shows that change in average roughness (Sa) with pressure increases more rapidly in AISI 304 samples for 2-mm wide channels compared the AISI1010 samples for 2-mm wide channels even though the initial roughness for the AISI 304 is less than that of the AISI 1010. The 2-mm wide channel data are similar to the 1-mm channel results. The average roughness for the stainless steel increases sharply up to 12 μm at 10 MPa afterward the slope decreases. Once the roughness reaches 15 μm at 25 MPa, the roughness value remains constant until fracture. Roughness in mild steel samples on the other hand, continues to increase until fractures occurs, at approximately 24 MPa. The maximum average roughness obtained in the mild steel samples is 8 μm while the maximum Ra roughness in the stainless steel is 14 μm. Error bars are shown for the roughness in Figure 12 but are small enough that the symbols cover them.
Maximum height roughness (Sz) curves in Figure 13 for 2-mm wide channels is similar to the average roughness Sa shown in Figure 12. For the stainless-steel samples, the roughness continued to increase as forming pressure increases up to about 25 MPa. Mild steel samples show linear relationship up to about 17 MPa, then it appears constant or slightly decreases until fracture.
The linear relationship observed in the roughness seen in Figure 10 for the stainless steel bulge test samples is consistent with results from previous studies.16,26 The slight dip experienced at higher strains, near the burst pressure has also been reported by other researchers. 27 This slight shift from linearity can be attributed to deformation induced thinning at the pole of the bulged dome, where the roughness was measured and which experienced the highest strains in the sample.
It is believed that the elongation of the grain boundaries occurs as a result of obstruction to the rotation grains. The observation in the roughness of the mild steel bulge test samples might be due to the initial surface roughness of the samples. The “as-received” mild steel’s initial roughness greater than that of the subsequently deformed mild steel compared to the stainless steel roughness can be attributed to the differences in the rolling process of the two sheet materials and the crystalline structures of the two materials. Unlike the AISI 304 which is an austenitic steel with a face centered crystal (FCC) structures, mild steel AISI 1010 is a body centered crystal (BCC) structure. This could factor in the initial roughness of both materials, also manufacturing processes will also play a part. However, these parameters shows a linear relationship with respect to the strain in the AISI 304 stainless steel samples compared to the AISI 1010 mild steel samples. The difference in the magnitude of the Sz indicates that the roughness of the samples are driven by height of the features rather than the depth of the roughness. The strain induced surface roughness of sheet metals can be explained based on the Hall-Petch relationship and grain boundary strenghtening. 28 Mismatching of grains especially due to their sizing tends to increase the roughness. In other words, the formation of smaller grains as a result of deformation will produce more mismatched points which results in increased roughness. However, it is believed that as the sheet thickness continues to decrease, the reverse Hall-Petch starts to occur, and the grains begin to soften. The inhomogeneity of the surface deformation for most metal alloys under plastic deformation processes might provide sites of strain localization. 29
Conclusions
The need to develop more processing techniques for sheet material which can be used in mesoscale applications such as bipolar plates of a fuel cell is paramount, especially, as the world is transitioning from fossil fuel to sustainable energy. Based on the results of this work the following conclusions can be made.
(1) The surface roughness parameters of 100-micron thick annealed AISI 304 stainless steels under consideration showed linear relationship with strain while surface roughness parameters of 100-micron thick hard tempered AISI 1010 mild steel do not respond significantly to change in deformation.
(2) AISI 304 stainless steel is capable of high strains before rupture which is important for material utilization and formation of sheet metal into intricate shapes and channels.
(3) The initial surface roughness of the sheet metal has significant influence on the final surface roughness after deformation.
(4) Tit can be expected that the deformation of sheet metals would have direct consequence on the PEMFC performance characteristics that has been established in literature to have dependency on surface roughness of the bipolar plates. Such characteristics include water management, heat management, corrosion resistance, contact resistance, and others.
Footnotes
Acknowledgements
The authors want to acknowledge the support of Louisiana Advanced Materials Processing Lab of the Mechanical Engineering Department at the University of Louisiana at Lafayette, Lafayette, Louisiana and Center for Rotating Machinery, Louisiana State University. Baton Rouge, Louisiana.
Declaration of conflicting interests
The author(s) declared no potential conflicts of interest with respect to the research, authorship, and/or publication of this article.
Funding
The author(s) received no financial support for the research, authorship, and/or publication of this article.
Availability of data and material
All data generated or analyzed during this study are included in this published article and are available from the corresponding author on reasonable request.