
Abstract
To simultaneously optimize the surface quality and machining efficiency of the electrical discharge machining (EDM) processes used to produce titanium alloy quadrilateral group small hole parts, a combined “EDM + AFM” machining technology is proposed in this paper as an efficient and high-quality machining approach. In the proposed method, TC4 titanium alloy is first machined using the EDM process with graphite electrodes and the abrasive flow machining (AFM) process is then used to finish the machined surface. The effects of various electrical parameters on EDM-derived surface quality and improvements in EDM-derived quality under the application of AFM were assessed and, using the final surface roughness as a constraint condition, the effects of various combinations of EDM and “EDM + AFM” on efficiency were studied. The results revealed that the thickness and surface roughness of the superficial recast layer of the TC4 titanium alloy increase with both current and pulse width; in particular, increasing these parameters can increase the surface roughness by two to three grades. Following AFM, the alloy has a more uniform hardness distribution and the surface stress state changes from tensile to compressive stress, indicating that the combined “EDM + AFM” machining scheme can significantly enhance the surface quality of EDM-produced titanium alloy quadrilateral small group holes. The combined scheme achieves a balancing point beyond which increasing the roughness or the number of machining holes enhances either the machining efficiency or the machining surface quality. In the case of typical titanium alloy quadrilateral group small hole parts, the combined machining process can improve the finishing efficiency and total machining efficiency by 71.2% and 25.36%, respectively.
Keywords
Introduction
Because of their low densities, high corrosion resistances, and high strengths, titanium alloys are widely used in the aerospace industry. 1 The structural components of a modern aircraft feature large a number of titanium alloy quadrilateral group small hole parts, which can be fabricated using electrical discharge machining (EDM). In this process, EDM is applied to remove a workpiece material through pulsed spark discharges between an electrode and the workpiece. Owing to their low thermal conductivities, however, it is difficult to machine titanium alloys via EDM. Specifically, it is difficult to obtain a high surface quality because the materials are thrown out before they are fully melted, which tends to cause discharge concentration and short-circuiting. 2 The high instantaneous temperatures generated by pulsed discharge processes alter the structure of a machined surface through the formation of a shallow recast layer in the workpiece. Furthermore, differences in terms of the processing environment and parameters can result in the formation of defects such as ablation and micro cracks on the part’s surfaces, which can reduce the fatigue life of the parts to a certain degree. 3 Abrasive flow machining (AFM) can be applied to remove EDM-produced surface defects and improve the surface roughness of a workpiece through the impact of the abrasive particles in a viscoelastic polymer abrasive. Furthermore, the high fluidity of abrasives ensures that they be processed at all reachable positions. Thus, the application of AFM techniques to EDM-treated titanium alloy quadrilateral group small hole surfaces can yield unique advantages in resolving the difficulties that arise owing to the use of conventional machining methods in achieving surface finishing.
There is a significant body of research on the application of EDM and AFM to TC4 titanium alloys. Jabbaripour et al. 4 used copper electrodes to carry out the EDM of titanium alloy and found that although increasing the pulse energy could enhance the machining efficiency, the surface quality significantly deteriorated. Vijay and Ram 5 used the Taguchi method to optimize the EDM parameters of titanium alloys and found that the number of surface micro-defects increased with the pulse width. Vinod et al. 6 studied the formation mechanism of residual stress in EDM and their results indicate that the distribution of residual thermal stress correlates with the distribution of residual stress on the part’s surface. Yildiz et al. 7 established a correlation between the recast layer thickness and surface roughness by analyzing experimental data and derived a formula for predicting the former based on the latter. In terms of AFM research, Dong et al. 8 applied rheological theory to establish a theoretical model for calculating the normal pressure on the inner surface of a tube and the slip velocity on its wall, and used the results to determine the material removal rate of high viscoelastic AFM. Singh and Ravi Sankar 9 applied an abrasive flow process to finish micro holes and remove recast EDM layers, thereby reducing the surface roughness to 150 nm, equivalent to a roughness reduction of approximately 88.53%. Ghadikolaei and Vahdati 10 reported that AFM performs well at removing superficial convex peaks. Loveless et al. 11 used AFM to process a workpiece surface following mechanical processing and EDM, and revealed that AFM can remove the recast layer from an EDM-treated surface and make it more uniform. Gorana et al. 12 developed a mechanical model of single-abrasive AFM treatment and concluded that the material-removal mechanism primarily involves sliding and plowing. Zhang et al. 13 used AFM to process the surfaces of titanium alloy materials, applied response surface analysis to quantitatively evaluate the effect of process parameters such as the abrasive particle size and the concentration and processing time on surface roughness and micro morphology, and established a surface roughness prediction model. Rajendra and Jain 14 proposed a tangential force model and used it to analyze processing parameters; they concluded that AFM can remove residual stress from a workpiece surface and improve its fatigue strength based on their results.
Although, as indicated above, previous studies on AFM and EDM have resulted in incisive conclusions and significant achievements, there is still lack of research on the surface qualities of TC4 titanium alloys machined within graphite electrodes, particularly in terms of improvement in the surface quality of EDM-produced quadrilateral small group holes. Furthermore, the tradeoff between surface quality and machining efficiency in such materials has not been clarified. In the current practice, graphite electrodes are used in TC4-titanium-alloy EDM, while AFM is employed afterwards to finish the workpiece. In this study, the surface roughness, micro-morphology, metallographic structure, chemical composition, surface micro-hardness, and residual stress of surfaces before and after EDM were analyzed and compared. The machining efficiencies of titanium alloy specimens and typical titanium alloy group hole parts were then measured to compare the effects of EDM and a combined “EDM + AFM” machining process on machining surface quality and machining efficiency and to optimize the method, significantly improving the surface quality and machining efficiency of EDM-derived titanium alloy group hole components.
Experiments
Experimental method
The peak current and pulse width used in the EDM process have an important effect on the workpiece surface roughness as well as on the surface micro-morphology, metallographic structure, chemical composition, surface microhardness, surface residual stress, etc. In the assessments carried out in this study, TC4 titanium alloy specimens were machined using different electrical parameters and the resulting surface integrities were analyzed. The specimens were then polished using AFM to investigate the degree to which surface quality improved. The results were used to compare the effects of EDM and “EDM + AFM” application on machining efficiency and quality.
EDM sample preparation
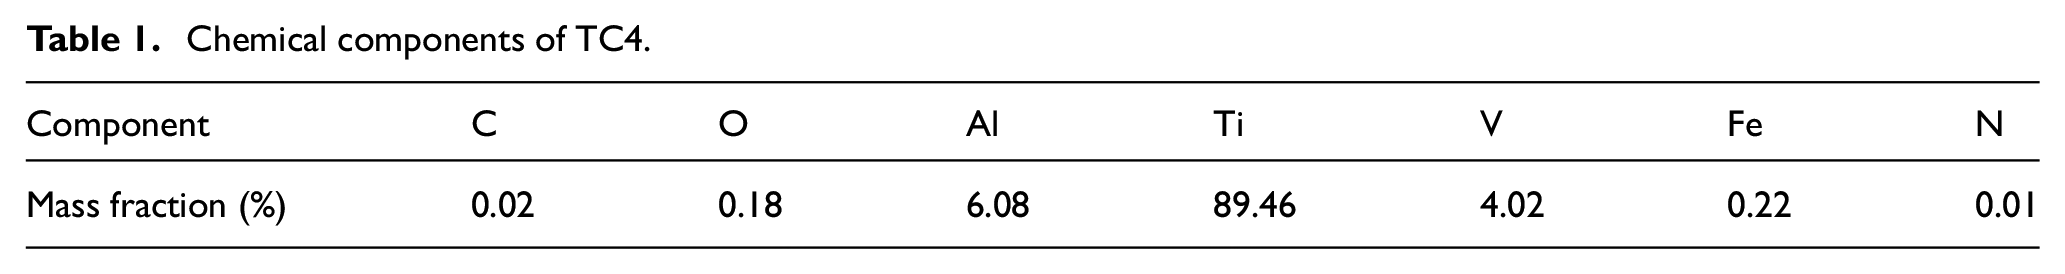
The sample chemical components of the TC4 (M state) sample material are listed in Table 1.
Chemical components of TC4.
Each TC4 titanium alloy sample was machined using graphite electrodes with particle size of 5 μm on a FORM200 EDM machine tool. Based on preliminary testing, six EDM specimens were prepared using the parameters listed in Tables 2 and 3. The samples were divided into two groups – A, comprising samples A1, A2, and A3; and B, comprising samples B1, B2, and B3 – which were used to study the surface quality produced by EDM and the post-AFM changes in surface quality, respectively. The EDM samples and their dimensions are shown in Figure 1.
Main processing parameters.
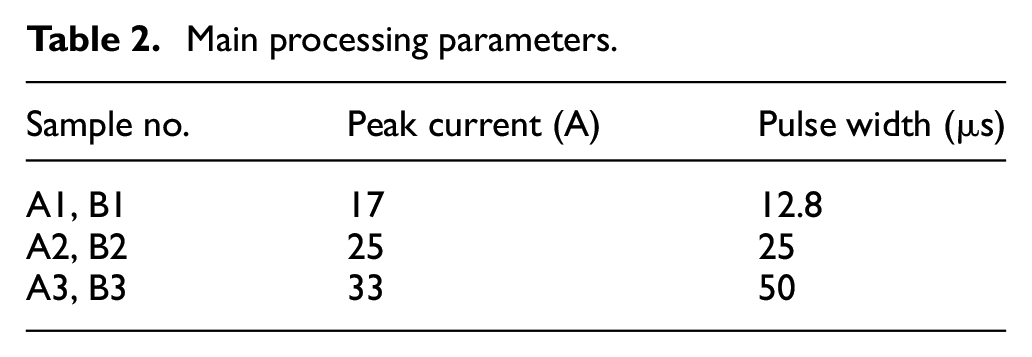
Other processing parameters.
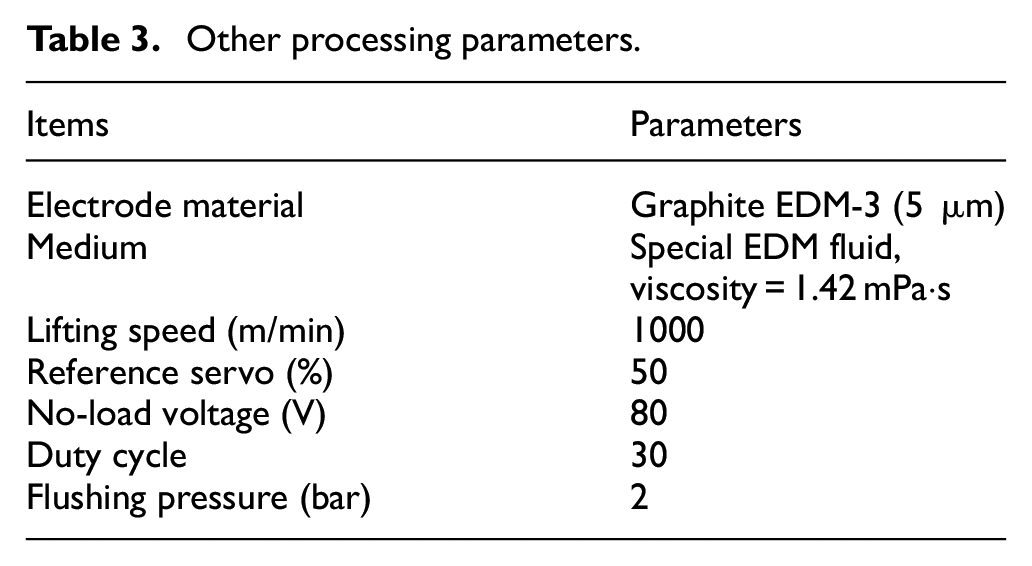
EDM samples and their dimensions: (a) sample dimensions and (b) EDM samples.
AFM sample preparation
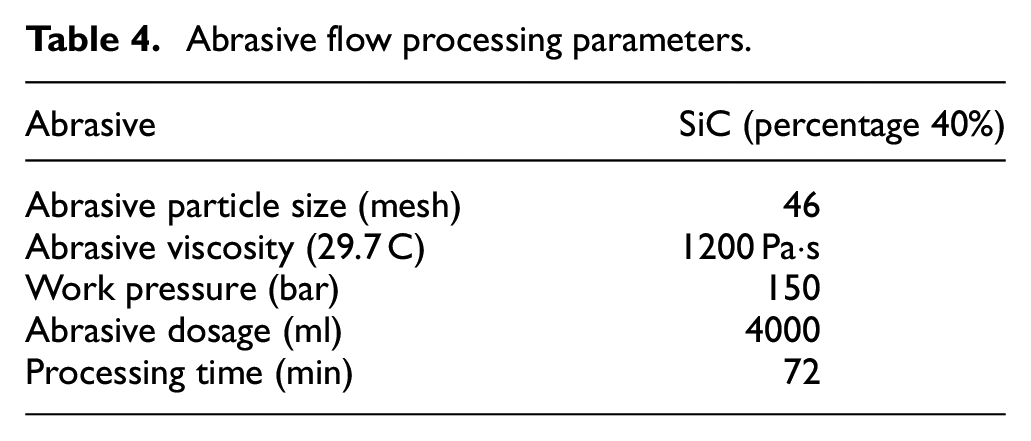
The three primary elements of abrasive flow processing are the machining tool, abrasive, and fixture. The fixture and upper and lower abrasive cylinders of the machine tool form a closed working chamber in which the cylinders apply abrasive movement and the grains of the abrasive remove the surface material of the workpiece to improve its surface quality. A larger granular abrasive can efficiently remove the recast layer and rapidly reduce the roughness of a surface. Based on our preliminary process test results, the commonly used SiC abrasive was selected for the AFM sample preparation. Increasing the processing pressure, that is, the pressure acting on the abrasive grain, enhances the removal effect. According to the actual parameters of the machine tool, the processing pressure is selected to be 150 bar. The fixture, which provides a flow path for the abrasive, should be designed to enhance the smoothness of the flow path. A photograph and schematic diagram of the AFM fixture are shown in Figures 2 and 3, respectively. APCMA250 abrasive flow machine (Figure 4) was used to finish the samples. The EDM-machined surfaces of the three B samples were subjected to abrasive flow finishing and the surface quality of each of the post-finishing surfaces was evaluated. The specific processing parameters are listed in Table 4 and the samples are shown in Figure 5.
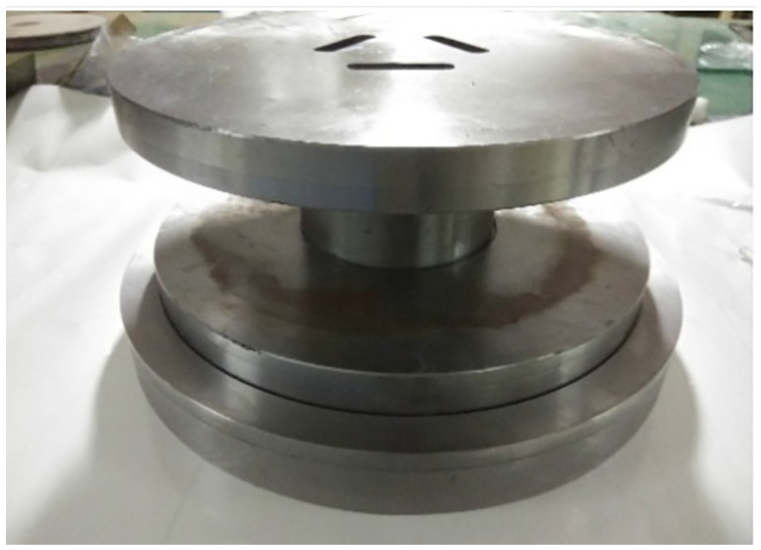
AFM fixture.
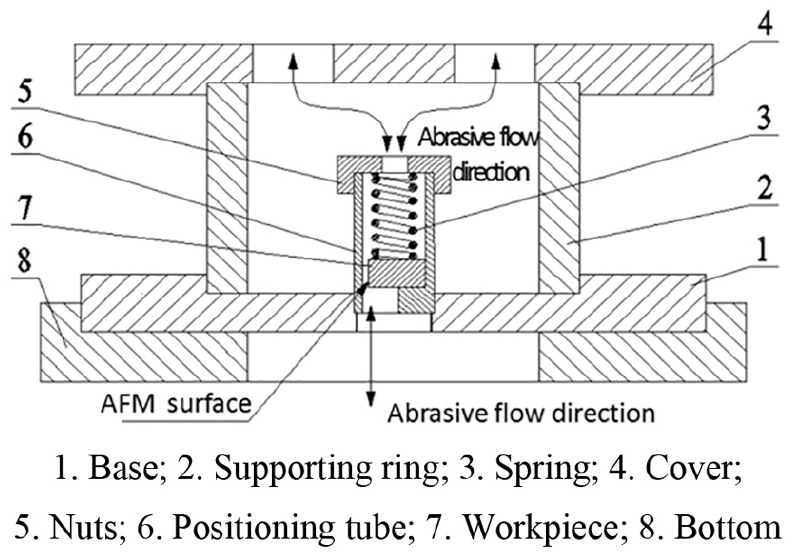
Diagram of AFM fixture.
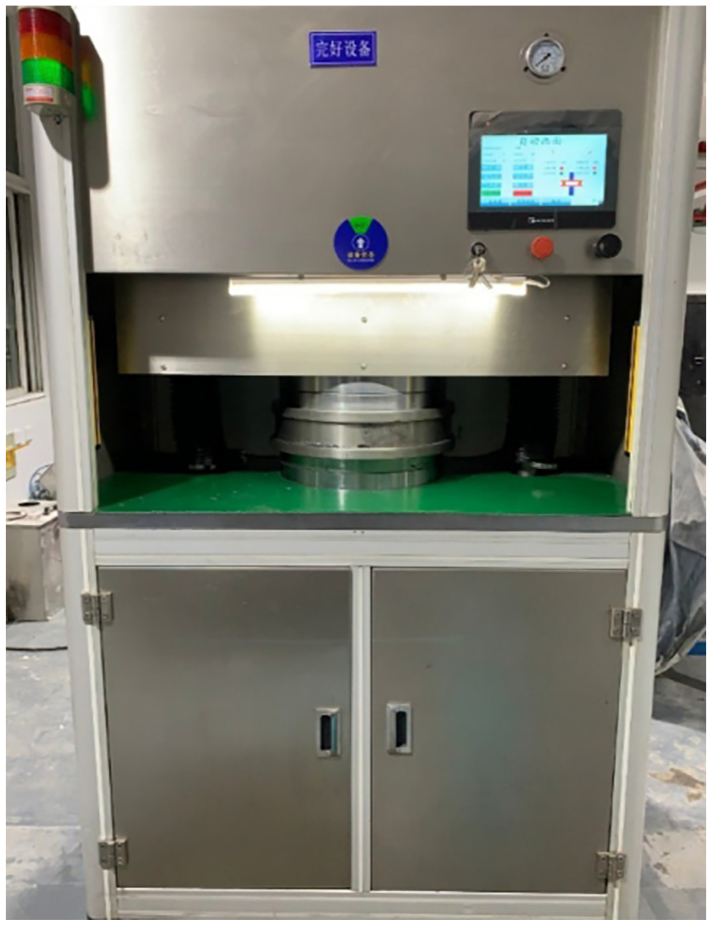
AFM setup.
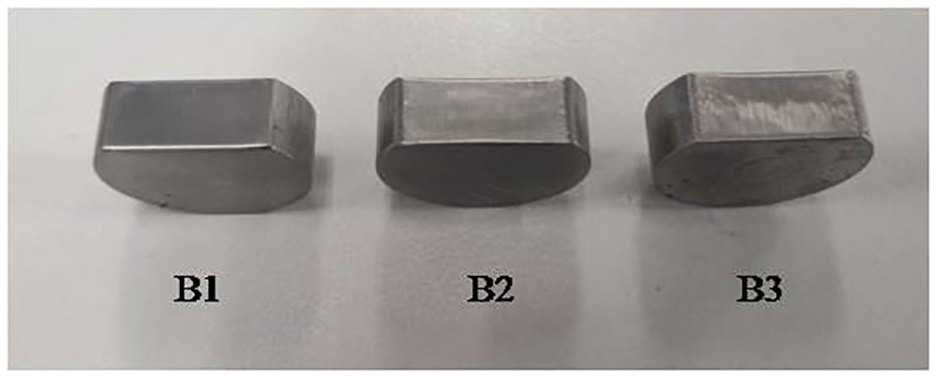
Samples after AFM.
Abrasive flow processing parameters.
EDM surface integrity analysis
As the surface roughness of an EDM sample increases, its wear resistance, sealing performance, corrosion resistance, and fatigue strength decrease. The surface roughness of EDM-produced aeronautical titanium alloy parts usually fall within a required range of Ra6.3 to Ra1.6 μm. To obtain the respective objective surface qualities of Ra6.3, Ra3.2, and Ra1.6 μm, specific peak currents and pulse widths must be selected. To better understand EDM surface integrity, the surface quality of samples with these three process parameters was assessed.
Machined surface roughness
The surface morphologies of TC4 titanium alloy EDM samples produced using each process parameter are shown in Figure 6. A post-EDM surface contains many discharge pits produced by pulsed discharges and has a surface roughness that depends on the size and depth of the discharge pits. The energy of an individual pulse increases with the peak current, while the pulse width prolongs the duration of discharge. Thus, increasing these factors increases the depths of the discharge marks and enlarges the etching pits, gradually reduces the number of discharge marks per unit area, and enhances the surface roughness.
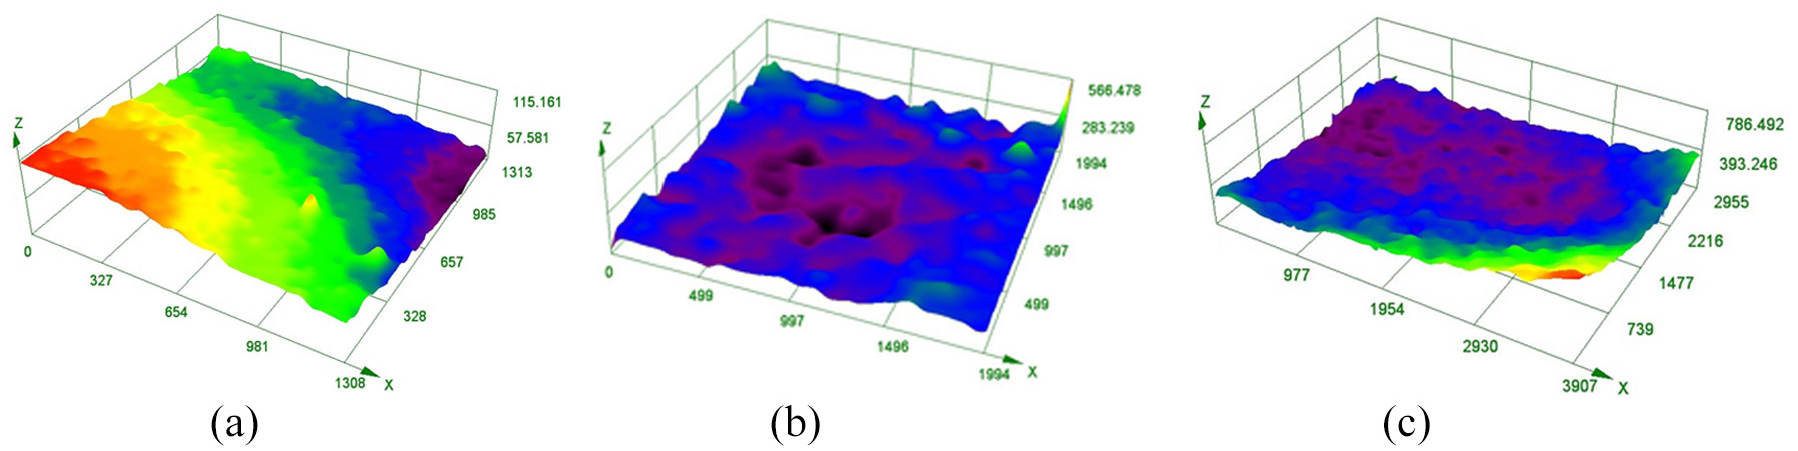
Surface morphologies of EDM samples: (a) sample A1 (Ra1.572 μm), (b) sample A2 (Ra3.174 μm), and (c) sample A3 (Ra6.294 μm).
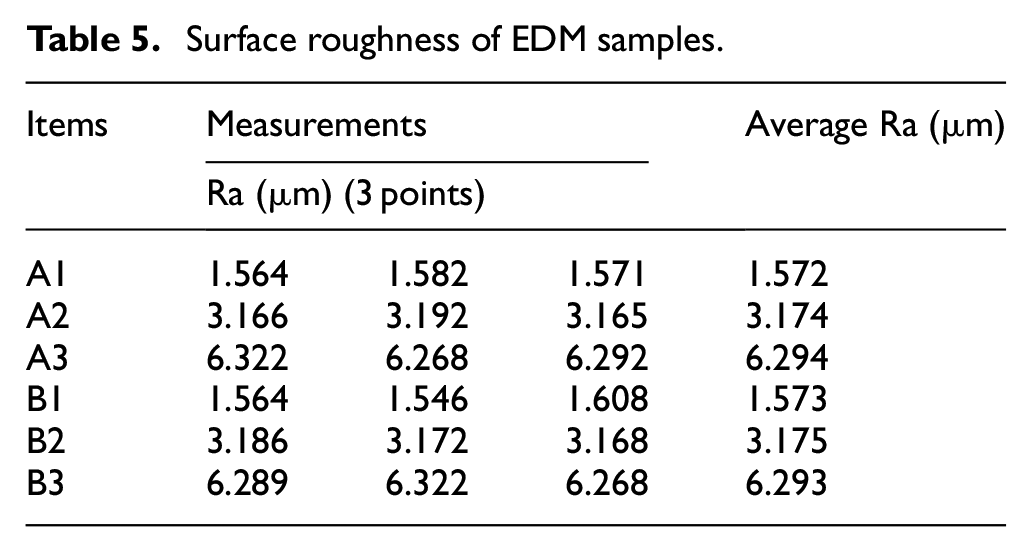
The surface roughness of each EDM specimen was measured using a surface roughness tester while applying three processing parameters and the roughness was taken as the average of the three measurements. For each processing parameter, the surface roughness values of the respective samples were similar. The roughness data are listed in Table 5.
Surface roughness of EDM samples.
Machined surface micromorphologies
The micro-morphology of a post-EDM TC4 titanium alloy machined surface comprises stacked blocks, small number of pores, and spherical and aspherical particles. As the geometric size of the blocks increases, the number of pores increases and the surface roughness gradually increases. Metallographic photographs of the EDM samples (Figure 7) reveal a region in the surface layer containing a white recast. On the surface of the blocks, orange-peel-like lines formed as a result of the rapid solidification and shrinkage of small amounts of molten metal that could not be quickly thrown off the workpiece surface are evident. Because of the high melting point and low thermal conductivity of titanium alloy, corrosion products are often thrown off before melting completely, resulting in curling at the edges of the blocks. Following complete melting or gasification, the corrosion products coagulate into spherical particles under their own surface tension. Although most of the spherical particles are driven away by the working fluid, a small number are left at the edges of the blocks.
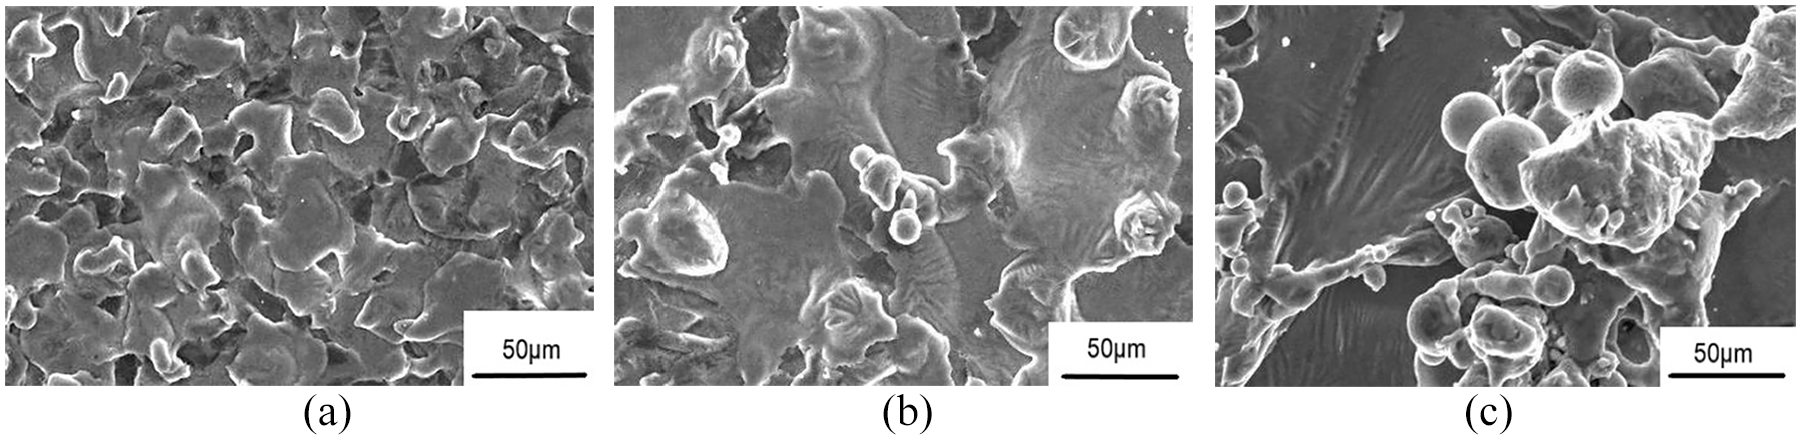
Surface microstructures of specimens: (a) specimen A1 (Ra1.572 μm), (b) specimen A2 (Ra3.174 μm), and (c) specimen A3 (Ra6.294 μm).
No post-EDM micro-cracks were found on group A specimen surfaces. The thermal stress induced by the surface temperature gradient of the EDM process is the direct cause of micro-cracking of the workpiece surfaces. The heat generated by the EDM pulse discharges is absorbed by the electrodes, workpiece materials, and working fluids. The thermal conductivity of TC4 titanium alloy is 7.955 W/(m·K), which is only one-fifth that of iron; as a result, the heat absorbed by the workpiece materials during the EDM of TC4 titanium alloy is less than that absorbed by most common metals. Instead, the heat is shed from the poles of the material along with melted and vaporized corrosion products. As a result, the temperature gradient of a TC4 titanium alloy workpiece is smaller than that of a common metal piece and, unless the thermal stress generated by this reduced temperature gradient exceeds the tensile strength of the titanium alloy, no micro-cracks will be formed on the surface.
Chemical composition and metallographic microstructure analysis
Chemical composition analysis
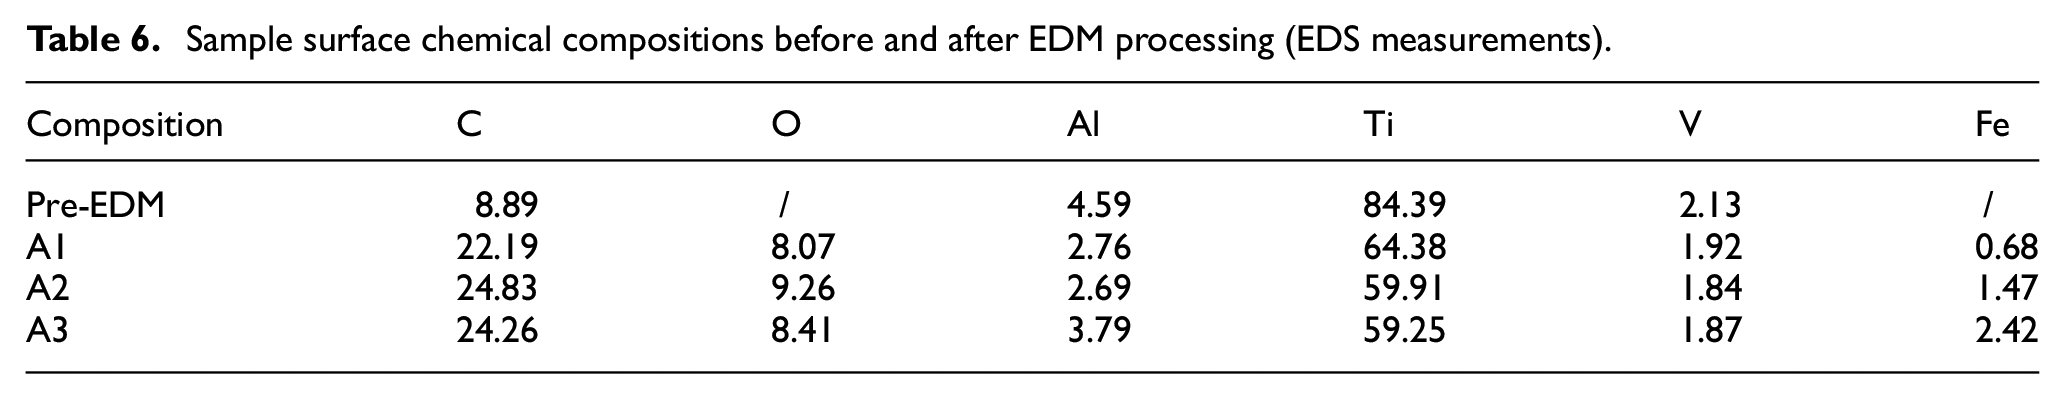
The changes in the surface element composition of TC4 titanium alloy sample A1 following EDM were analyzed using an OXFORD X-ray spectrometer. The chemical compositions of the pre-machined and post-EDM surface of the sample are shown in Figures 8 and 9, respectively, and the respective surface chemical element mass ratios are listed in Table 6. There is an approximate oxygen content of 10% on the EDM surface; in contrast, no oxygen was present in the non-machined surface, indicating that the high instantaneous temperature of the EDM process resulted in an oxidation reaction between the machined surface material and oxygen that dissolved in the working fluid. Similarly, the carbon content of the machined surface is enhanced by 13%–16% relative to the non-machined surface. The additional carbon was introduced by the dissolution of graphite electrodes and the instantaneous pyrolysis of the working fluid into free carbon at high temperature. These two reactions enhanced the infiltration of elemental carbon into the surface of the TC4 titanium alloy at high temperatures to form a mixture of TiC and titanium. 15
Sample surface chemical compositions before and after EDM processing (EDS measurements).
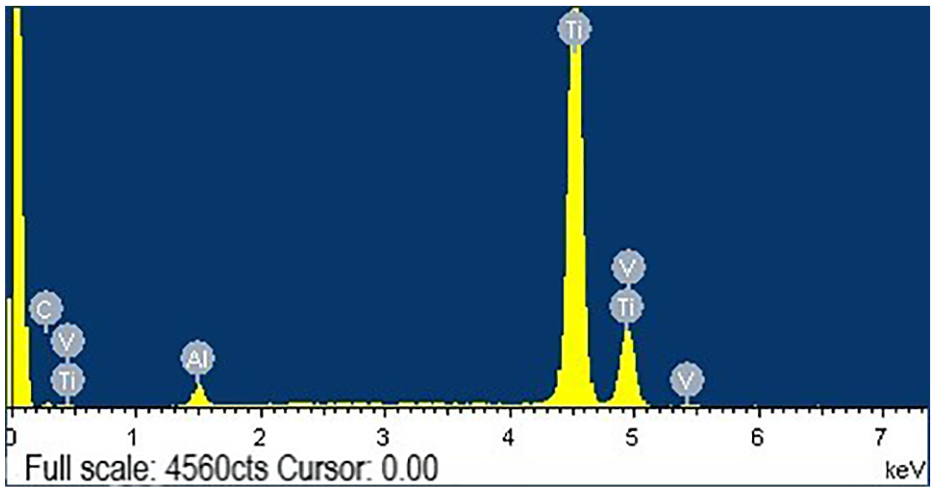
Energy spectrum of specimen A1 (pre-EDM).
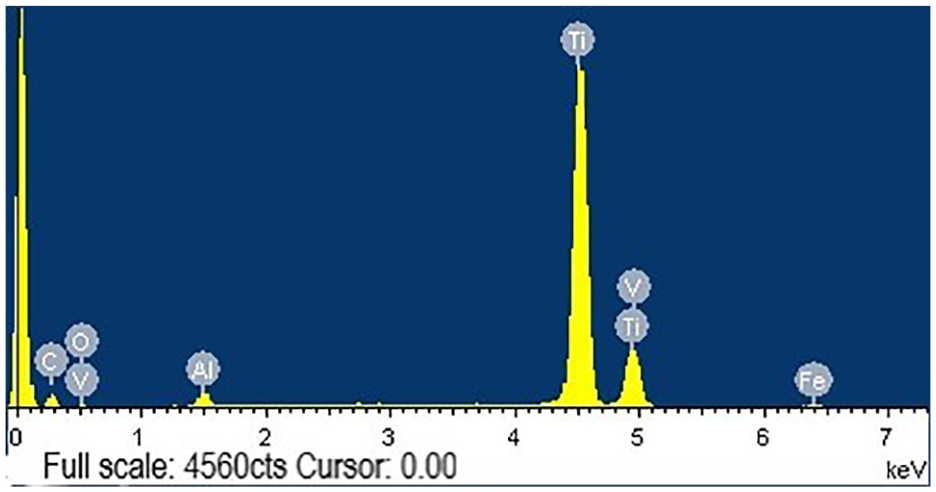
Energy spectrum of specimen A1 (post-EDM).
The C and O contents produced on the surfaces of the three group-A samples vary minimally with the processing parameter, indicating that, to a certain extent, neither the current amplitude nor the pulse width had a significant effect on the chemical compositions of the post-EDM TC4 titanium alloy surfaces, which were instead determined by the formation mechanism of the recast layer. Previous studies 16 have shown that spark discharges cause the surface material to melt and erode at high instantaneous temperatures, following which the working fluid can rapidly cool and solidify the melted material. Most of the melted material is then washed away by the working fluid, while a small portion forms a solidified layer on the workpiece surface. The etched materials that have not been washed away and redeposited continue to solidify onto and cover the solidified layer, gradually thickening into a recast layer. Although current and pulse width have a significant influence on the thickness of the recast layer, these parameters have minimal influence on the chemical compositions of the individual layers.
Cross section metallographic microstructure
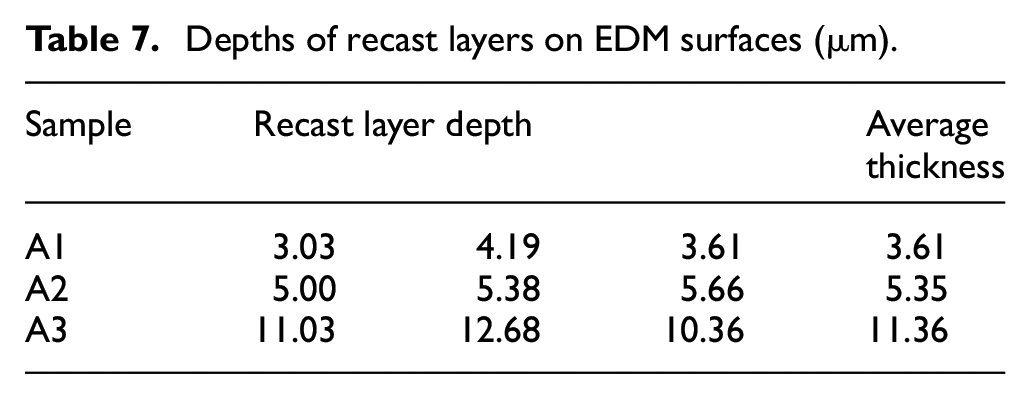
Further analysis of the cross-section metallographic structures of the group-A specimens revealed normal α+β dual-state structures on the machined and non-machined surfaces, with no structure containing acicular α phase, indicating that the samples did not overheat as a result of the superior cooling during EDM. The TC4 titanium alloys were typical α+β titanium alloys in which oxygen absorption reaction occurs during heating in air. Oxygen is a stable element in α structures, and an increase in the surface oxygen content will lead to the formation of an oxygen-rich α layer. The three samples also formed white recast layers of varying thicknesses on their machined surfaces in which the metallographic and microstructures differed from those of the matrix. The average thickness of the recast layers increased with the pulse width and current. As these factors increase, additional material is melted as a result of the additional absorption of heat; as the working fluid cannot completely wash away the melted materials, a thicker recast layer is formed. 15 However, the amount of heat absorbed by a workpiece is related to the thermal conductivity of the workpiece material, and the low thermal conductivity of titanium alloy results in thinner recast layers. As presented in Table 7 and Figure 10, the average recast layer thicknesses of specimens A1, A2, and A3 were approximately 3.61, 5.35, and 11.36 μm, respectively.
Depths of recast layers on EDM surfaces (μm).
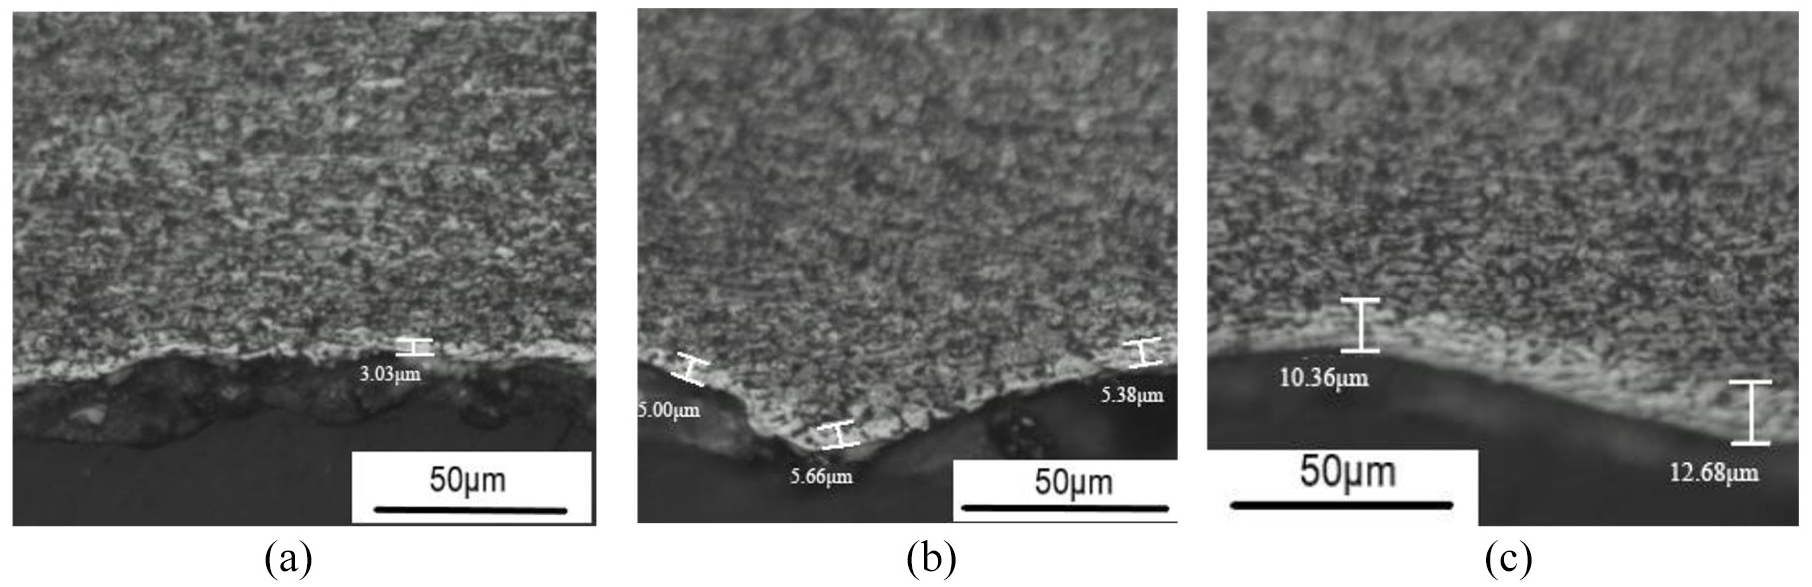
Cross-sectional metallographic structures of group-A sample machined surfaces: (a) sample A1 (Ra1.572 μm), (b) sample A2 (Ra3.174 μm), and (c) sample A3 (Ra6.294 μm).
Analysis of surface integrity and machining efficiency of AFM
The EDM process produces discharge pits and a recasting layer, and AFM is therefore used to finish the surface. To assess the efficiency of the EDM and AFM processes and improve the finishing procedure, the surface quality and performance before and after AFM finishing were compared.
Post-AFM surface roughness
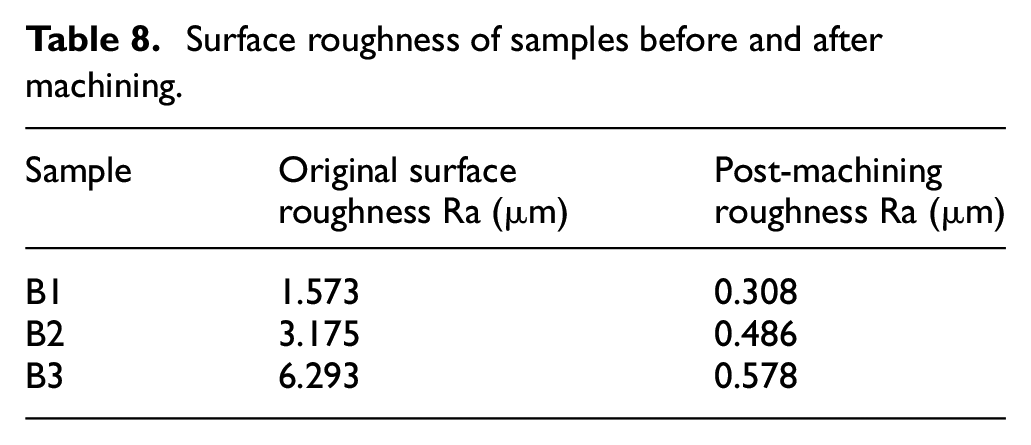
The surface roughness values of all three group-B samples were significantly reduced following AFM in which the processing parameters listed in Table 3 were applied. The surface morphologies of the post-AFM samples are shown in Figure 11 and the average roughness values obtained from three measurements of each machined surface are listed in Table 8. The results indicate that the surface roughness following AFM is related to the original surface roughness of the workpiece, with higher original surface roughness values corresponding to higher post-AFM roughness values. In the AFM process, abrasive particles distributed within a flexible viscoelastic medium are extruded onto the workpiece surface under pressure provided by the abrasive cylinder. The flow of these particles through a rough workpiece surface is met by wave crests of increased resistance to the abrasive motion. Under the applied pressure, the abrasive particles impact the workpiece surface and produce scratching and plowing patterns that enable improved cutting into the wave crests. This cutting effect enables micro-removal of the machined surface that eliminates the micro-roughness of the workpiece surface and reduces the roughness of the machined surface.
Surface roughness of samples before and after machining.
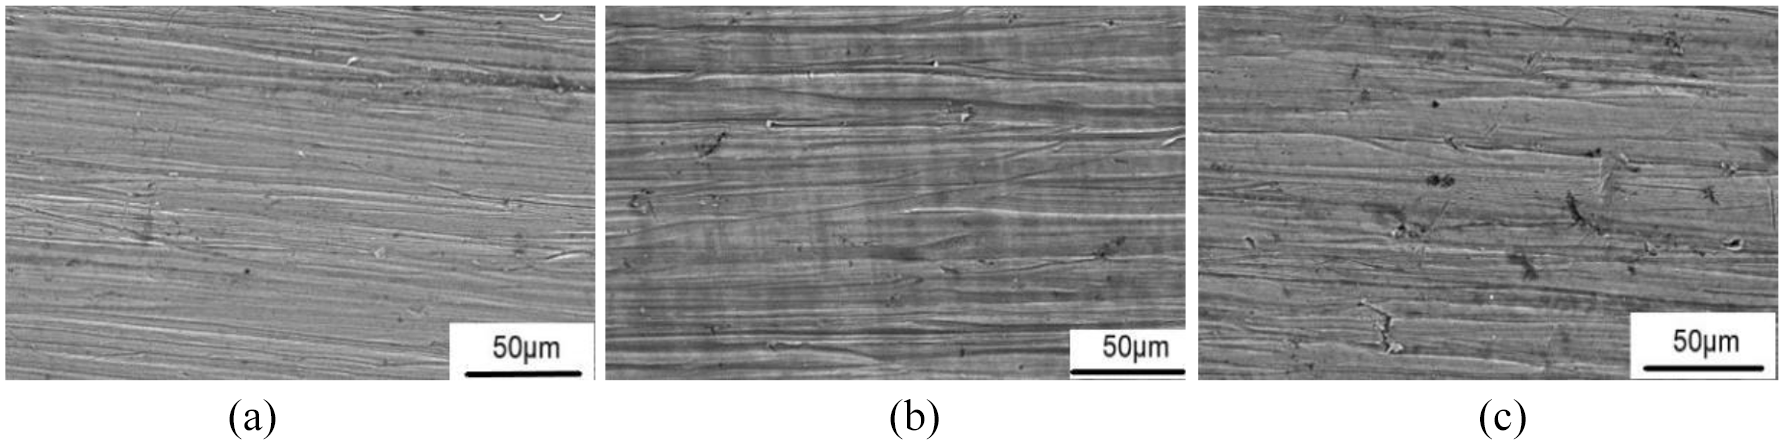
Surface morphologies following AFM: (a) sample B1 (Ra0.308 μm), (b) sample B2 (Ra0.486 μm), and (c) sample B3 (Ra0.578 μm).
Post-AFM surface microstructures
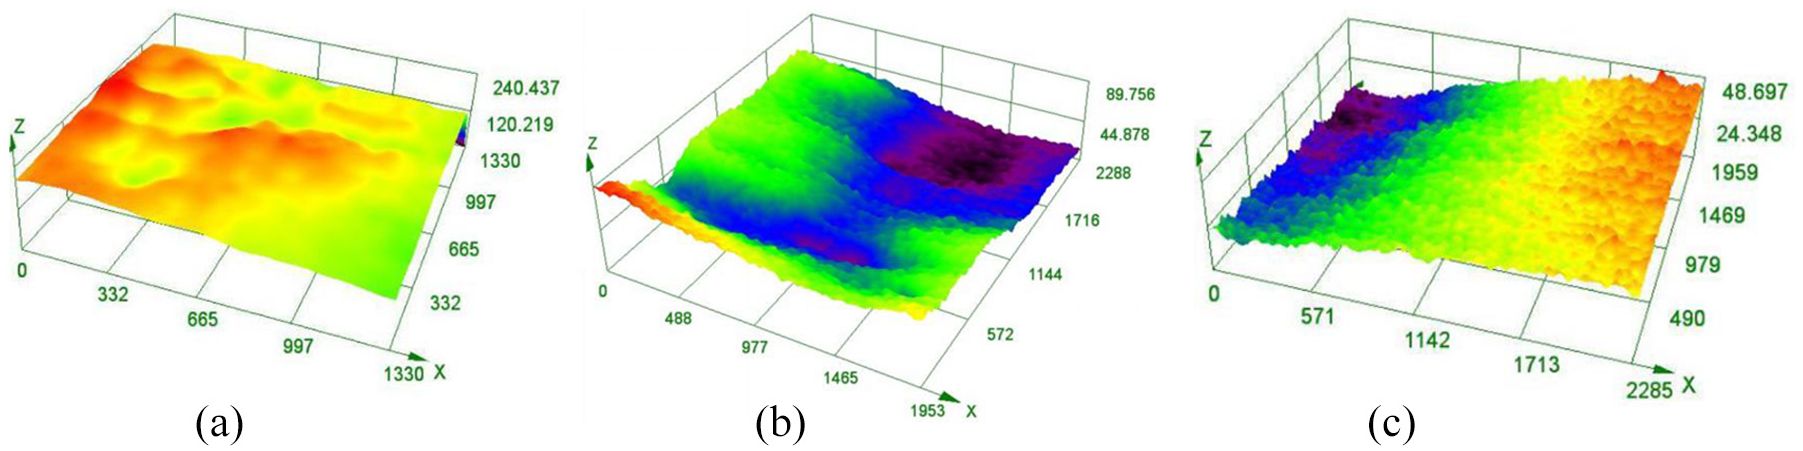
Following the application of AFM using the control parameters listed in Table 3, all original stacked blocks, voids, and spherical/aspherical particles on the machined surfaces of the three group-B samples were removed. The surface micro-topographies of the samples before and after machining are shown in Figures 12 and 13, respectively. A post-AFM surface contains uniform grains and has a refined surface texture in which height fluctuations are reduced. In addition, abrasive marks will be present on the surface, which has become generally smoother. The abrasive extrusion force produces greater contact stress at the contact points at the top of the protrusions from the workpiece surface, which in turn induces the abrasive to adhere in the vicinity of the protrusions. As the abrading material slips along the material surface, the adhesion point is removed. At the same time, the abrasive penetrates the protrusions, plowing the workpiece surface into a series of small grooves and lines.
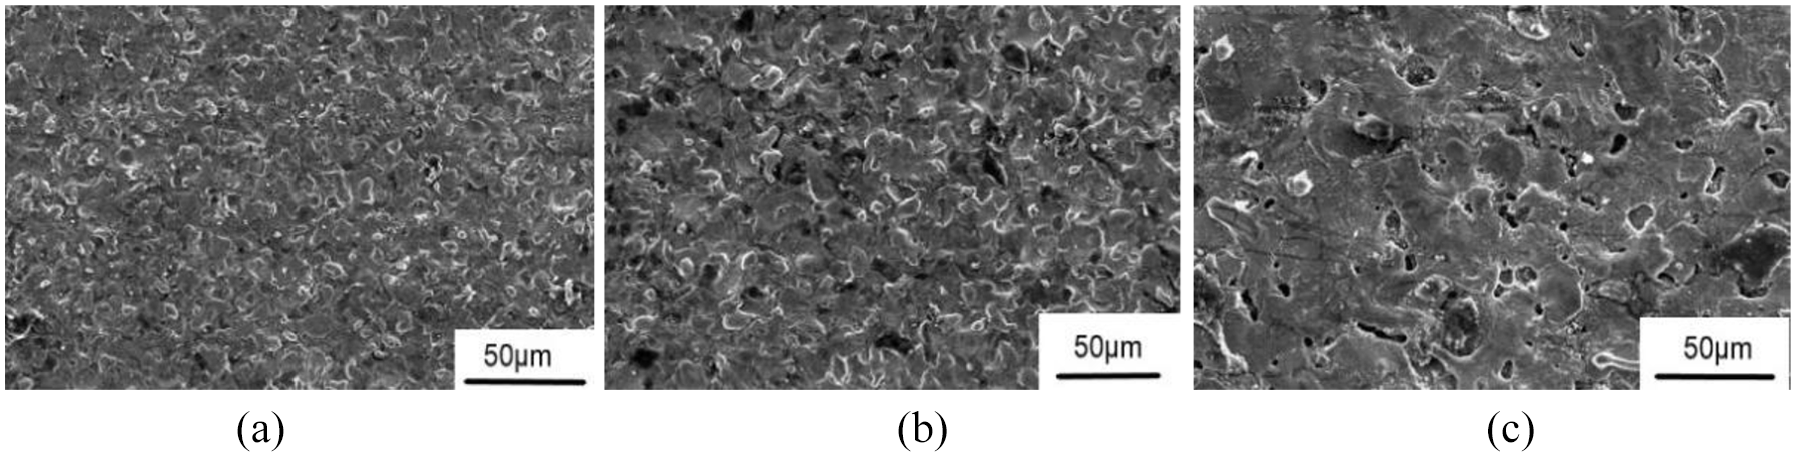
Pre-AFM surface morphologies: (a) sample B1 (Ra1.573 μm), (b) sample B2 (Ra3.175 μm), and (c) sample B3 (Ra6.293 μm).
Post-AFM surface morphologies: (a) sample B1 (Ra0.308 μm), (b) sample B2 (Ra0.486 μm), and (c) sample B3 (Ra0.578 μm).
Analysis of post-AFM chemical composition and microstructure
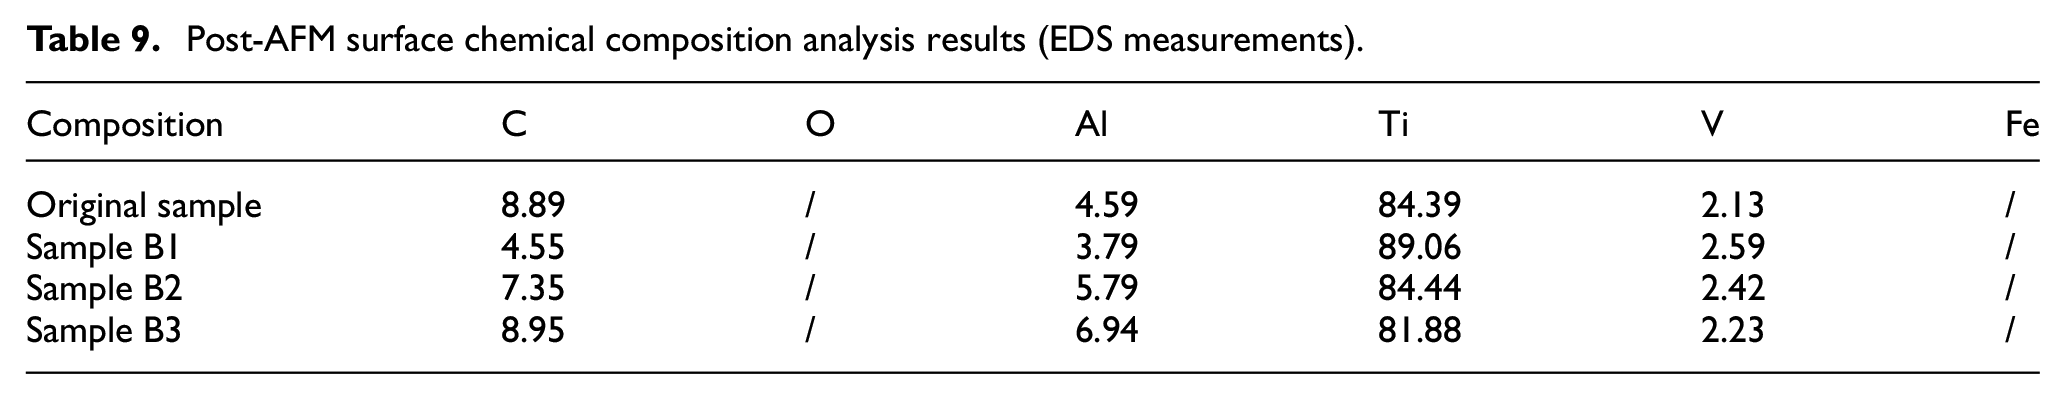
The results of chemical composition analysis of the machined surfaces of the post-AFM group-B samples and the corresponding chemical element mass ratios are presented in Figure 14 and Table 9, respectively. In each sample, the approximate 10% oxygen content found at the EDM surface has disappeared, whereas the C, Al, Ti, and V contents of the post-ADM sample surfaces are close to those of the original pre-EDM material surfaces. Further analysis of the cross-sectional microstructures shown in Figure 15 reveals that the white recasting layers on the EDM surfaces have been completely removed. These results indicate that the repeated extrusion, scratching, and plowing by abrasive grains has had an effective cutting effect on the wave crests of the EDM surfaces.
Post-AFM surface chemical composition analysis results (EDS measurements).
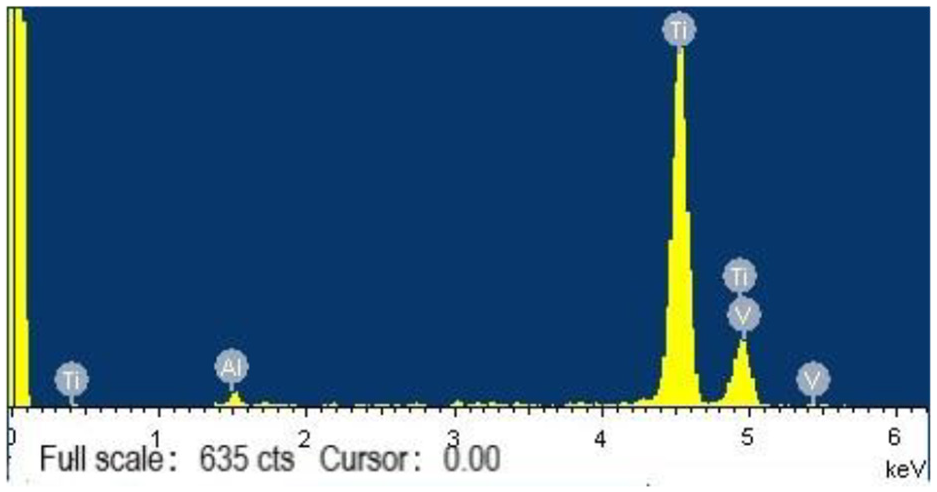
Surface energy spectrum analysis of sample B1 following AFM.
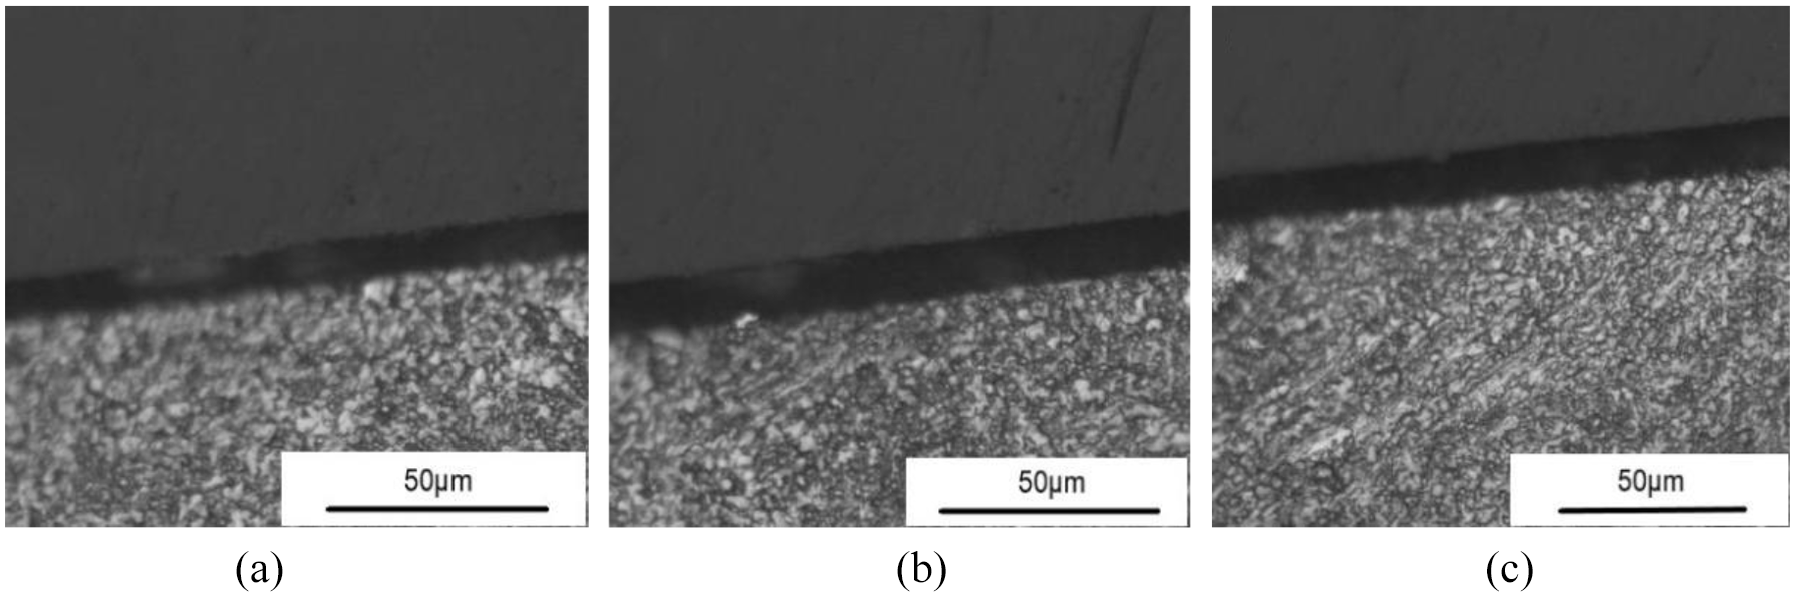
Cross-sectional microstructures of surfaces of post-AFM samples: (a) sample B1 (Ra0.308 μm), (b) sample B2 (Ra0.486 μm), and (c) sample B3 (Ra0.578 μm).
Analysis of surface residual stress and microhardness
Test method
An X-350A X-ray stress tester was used to measure the residual stress using the side tilt fixed ψ and swing method. The test conditions are as follows: CrKα characteristic radiation of chromium target, tube voltage = 20 kV, tube current = 5 mA, scanning step angle = 0.05°, and time constant = 2.0 s (see Figures 16 –18).
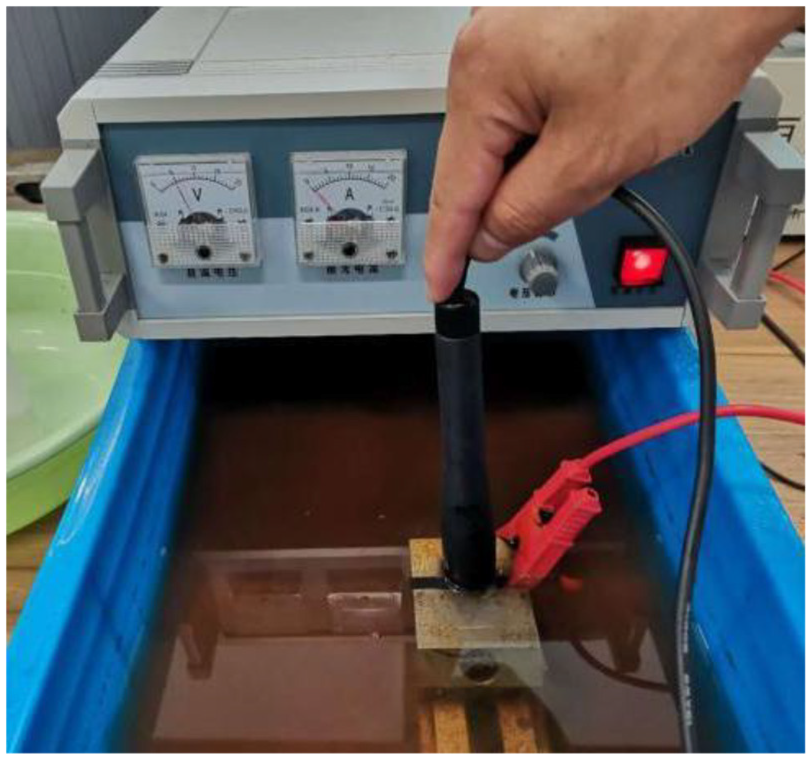
Electrolytic polishing sample.
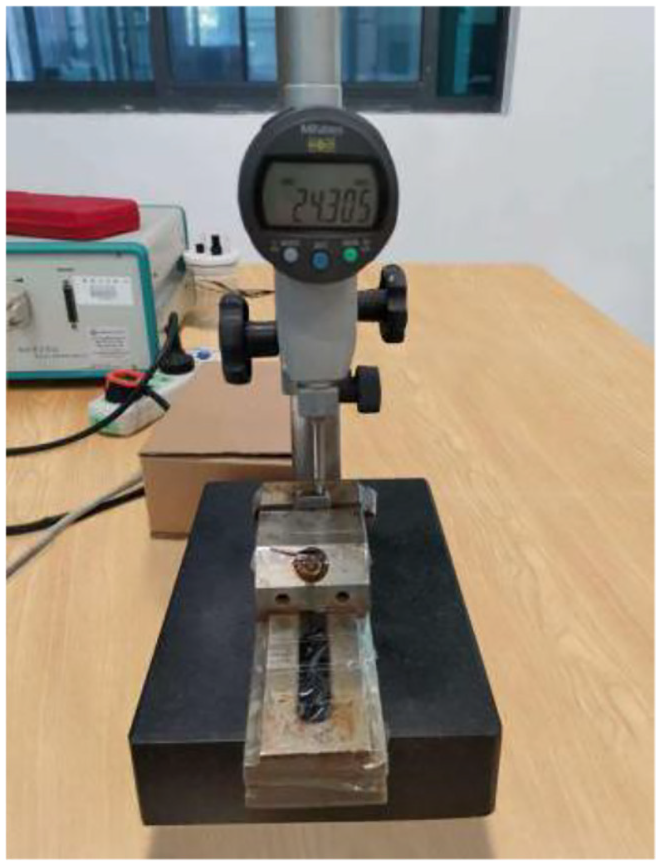
Dimension measurement of specimen after polishing.
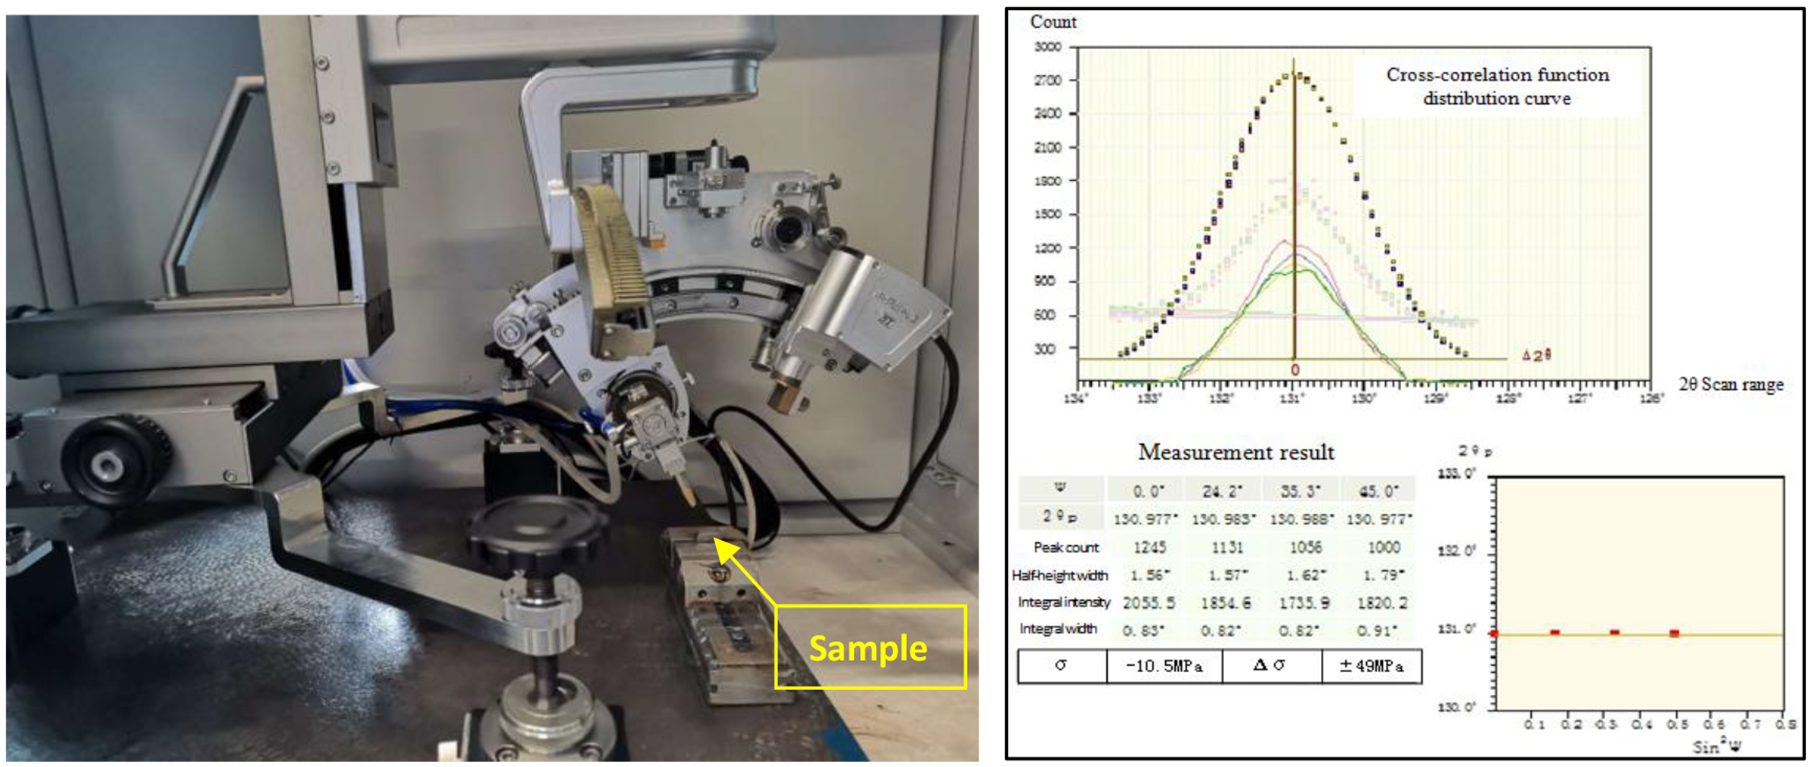
Residual stress measurement.
An HV-1008 type micro Vickers hardness tester was used to measure the micro hardness of the sample surface. The test conditions are as follows: the load and holding time are 500 g and 15 s, respectively. Three points on the surface of the sample were measured in sequence and the average value of the hardness was used.
(1) First, the residual stress on the surface and the surface microhardness of test samples B1, B2, and B3 were measured before and after the AFM.
(2) EDM sample B1 and sample B2 after AFM were selected to verify the distribution of the residual stress and microhardness along the depth direction. The distribution of the residual stress and hardness along the depth of the B1 sample before and after AFM were evaluated using an electrolytic polisher XF-1 and the electrolytic polishing method. The single corrosion depth is 4–6 μm. After each corrosion test, we measured the residual stress value and microhardness value.
Residual stress measurement results
Surface residual stress measurement results
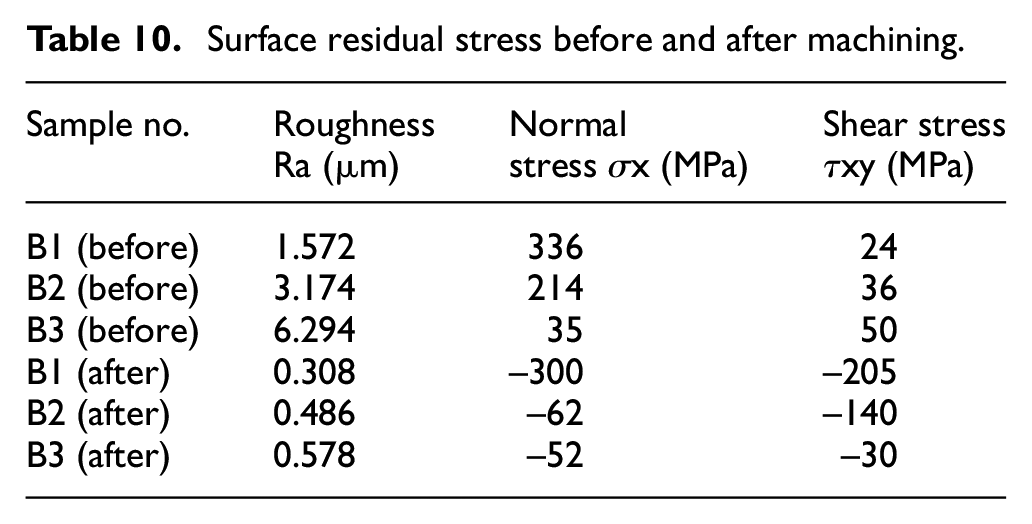
The measurement results of the residual stress on the sample surface before and after abrasive flow processing of samples B1, B2, and B3 are listed in Table 10.
Surface residual stress before and after machining.
Distribution of residual stress along the depth
Figure 19 shows the measurement results of the residual stress on the surface of the B1 sample processed by EDM in the depth direction, whereas Figure 20 shows the measurement results of the residual stress on the surface of the B2 sample in the depth direction after processing using abrasive flow.
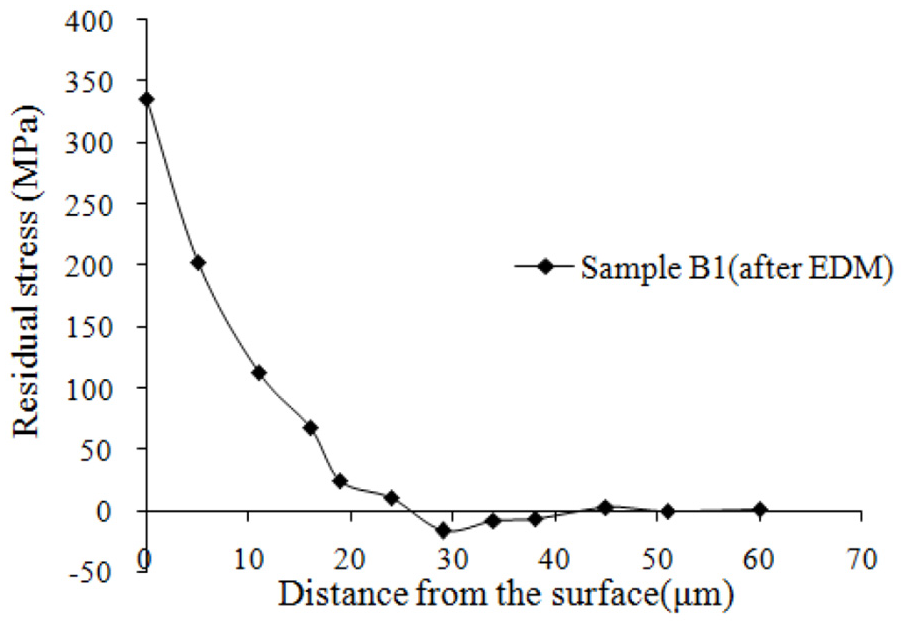
Residual stress distribution of sample B1 (after EDM).
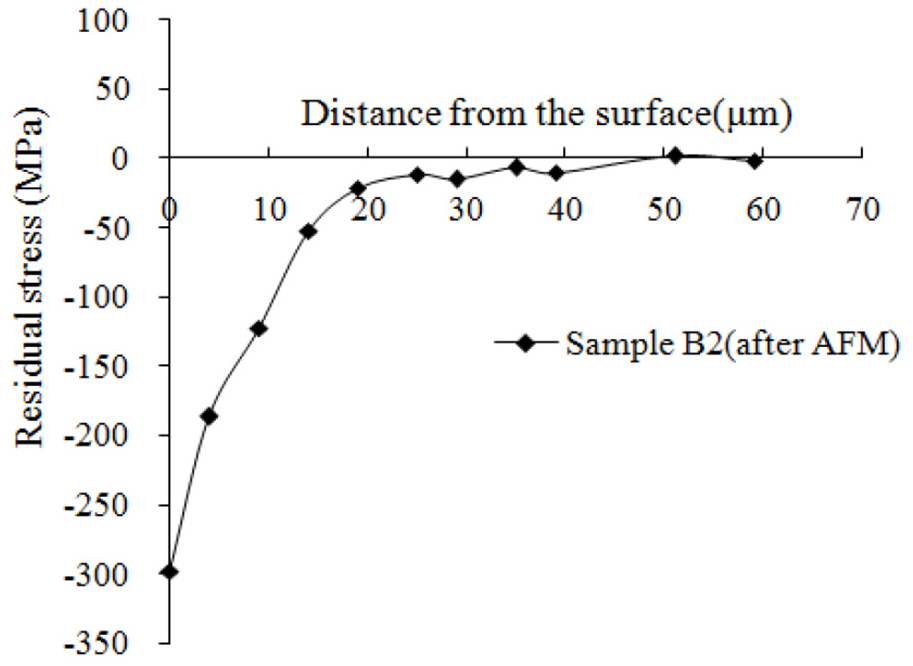
Residual stress distribution of sample B1 (after AFM).
It can be observed from the test results shown in Figures 19 and 20 that the surface of EDM sample B1 shows tensile stress before AFM. As the depth increases, the tensile stress decreases rapidly at first; the decreasing trend becomes slower at a depth of 19 μm, and then gradually changes to compressive stress, reaching an equilibrium state at a depth of 42 μm. During EDM, the instantaneous temperature of a machining component increases rapidly, causing the thermal load to increase. In this process, the temperature of the surface metal becomes higher than that of the underlying layer, resulting in a large temperature gradient on the machined surface. The molten surface metal then solidifies rapidly and cools, resulting in a large shrinkage deformation, while the slower cooling rate of the lower-layer metal results in a lower degree of shrinkage deformation. The difference between the deformations of the lower-layer metal and surface-layer metal prevents the layers from returning to their original state, resulting in a tensile stress on the surface metal, a compressive stress on the lower-layer metal, and a new residual stress equilibrium state on the surface of the workpiece. 17
The residual stress on the surface of an EDM sample becomes a compressive stress in both the flow and vertical directions of the abrasive flow medium. As the depth increases, the compressive stress decreases rapidly, and the decreasing trend becomes slower at a depth of 20 μm, reaching an equilibrium state at a depth of 50 μm. AFM is a flexible machining approach. When the abrasive grains distributed in the viscoelastic medium encounter hard points or protrusions, they produce specific rotations or retreats through the action of resistance that can adaptively adjust the cutting depth of the abrasive grains. As a result of the small positive pressure and cutting thrust of the abrasive grains, the metal lattice is not broken or damaged during the cutting process, and the reciprocating extrusion of the abrasive grains eliminates the surface residual tensile stress and microscopic defects caused by EDM. At the same time, the extrusion pressure induces a specific compressive stress on the surface that improves the fatigue strength of the metal. It can be observed from Table 9 that the magnitude of post-AFM surface residual stress is related to the initial roughness of the EDM surface, with lower initial surface roughness values resulting in higher surface residual compressive stresses.
Surface microhardness measurement results
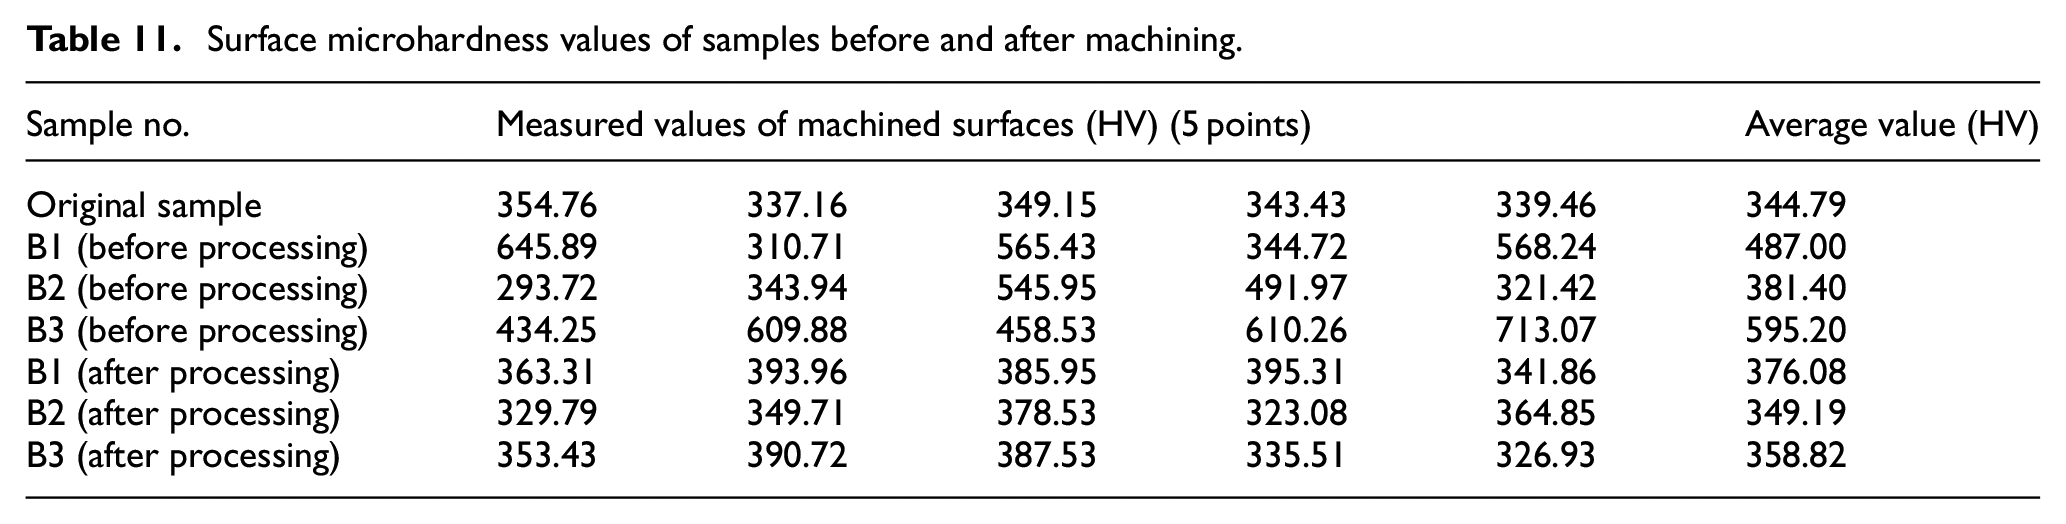
The surface microhardness test results of B1, B2, and B3 samples before and after abrasive flow processing are presented in Table 11 and Figure 21.
Surface microhardness values of samples before and after machining.
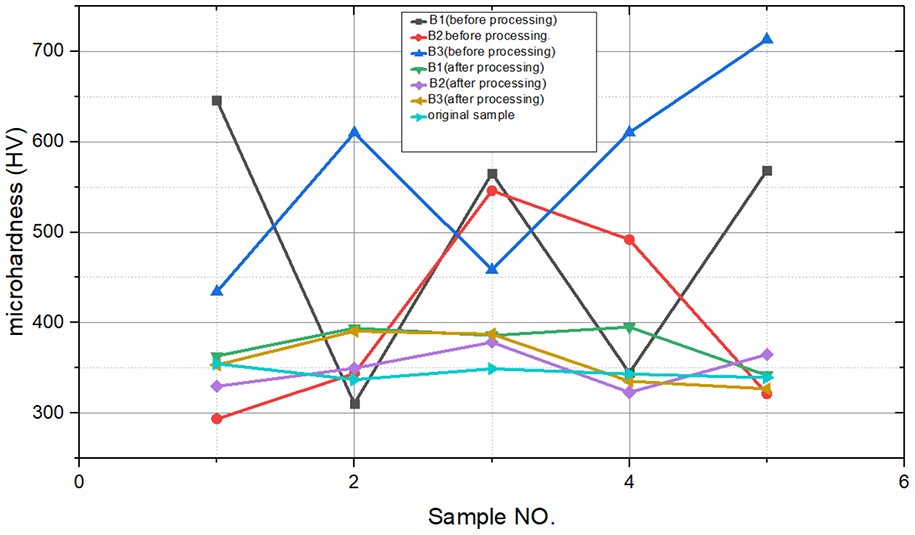
Surface microhardness test values (HV) before and after machining.
Figure 22 shows the measurement results of the surface hardness gradient of the B1 sample processed by EDM and the B2 sample processed by AFM.
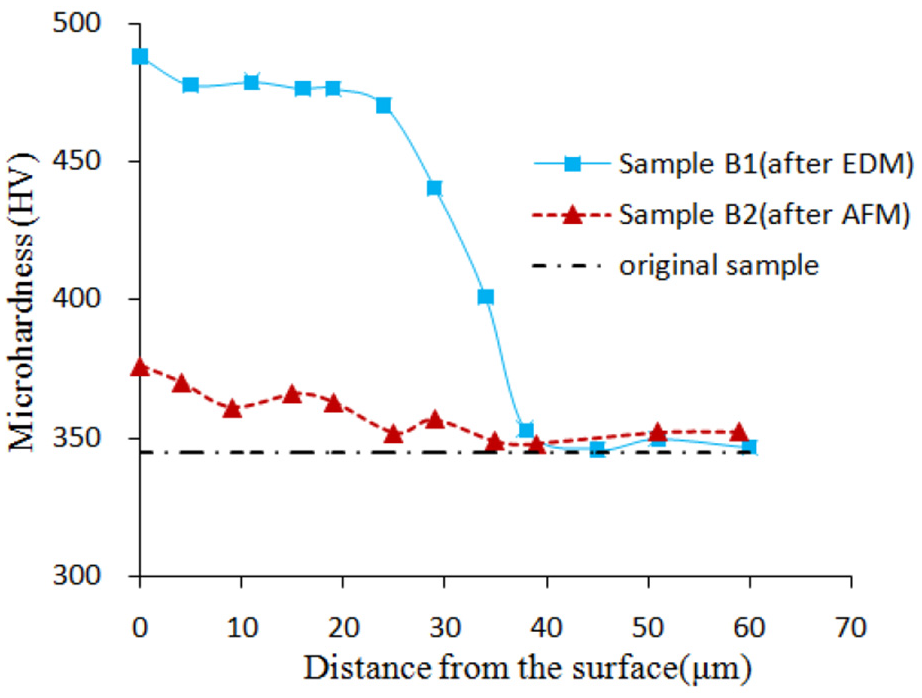
Surface hardness measurement results.
It can be observed from Figure 21 that the average surface microhardness of the three EDM samples prior to AFM was 487.87 HV, although the hardness values fluctuated significantly by point as a result of the discharge pits and surface particles produced on the sample surfaces by EDM. The carbide content of the samples was higher than that of the matrix, resulting in higher surface hardnesses but more pronounced hardness fluctuation. It can be observed from Figure 22 that the hardness value of the sample B1 processed by EDM is close to and higher within 25 μm from the surface, and the hardness value decreases rapidly within the range of 25–40 μm from the surface, and then tends to be stable. Following AFM, the average surface microhardness decreased to 361.36 HV as a result of the complete removal of hard surface particles and recasting layers and reductions in the surface roughness values following extrusion lapping. Thus, the surface hardness values increased while the average microhardness decreased. The surface hardness of the sample B2 processed by AFM decreases gradually along the depth direction and approaches the matrix hardness after a depth of 40 μm. The average hardness of the TC4 titanium alloy sample substrates was 344.79 HV, which is 4.8% higher than that of the raw material.
Under the working pressure of an abrasive cylinder, the viscoelastic abrasive particles apply shear and normal forces to the surface of a workpiece. In general, the abrasive particles that extrude and polish the surface of a workpiece are spherical. 18 The forces acting on the abrasive particles differ in magnitude and direction but can be combined to form axial and radial resultant forces Ft and Fn, respectively. A simplified schematic diagram of machining by a single abrasive particle is shown in Figure 23 in which the plastic and elastic deformation processes occur during AFM in zones A and B, respectively. Under the action of a normal pressure Fn, the abrasive grains produce a specific pressure on the surface of the workpiece that promotes plastic deformation of the workpiece. As a result of resistance to deformation within the workpiece, an elastic deformation zone B is formed between the plastic deformation zone A and the workpiece. As a result of polishing during AFM, the surface hardness of the workpiece is improved to a certain extent.
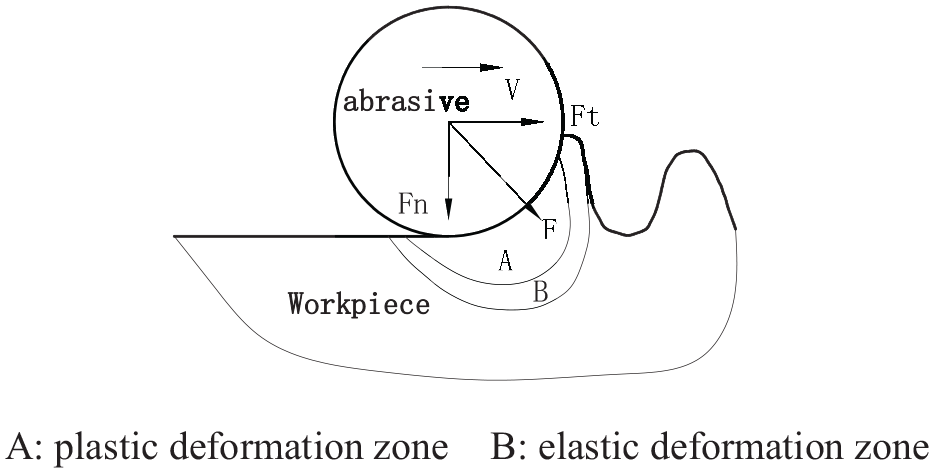
Schematic diagram of machining by a single abrasive particle.
Experimental study on machining efficiency
Experimental study on sample machining efficiency
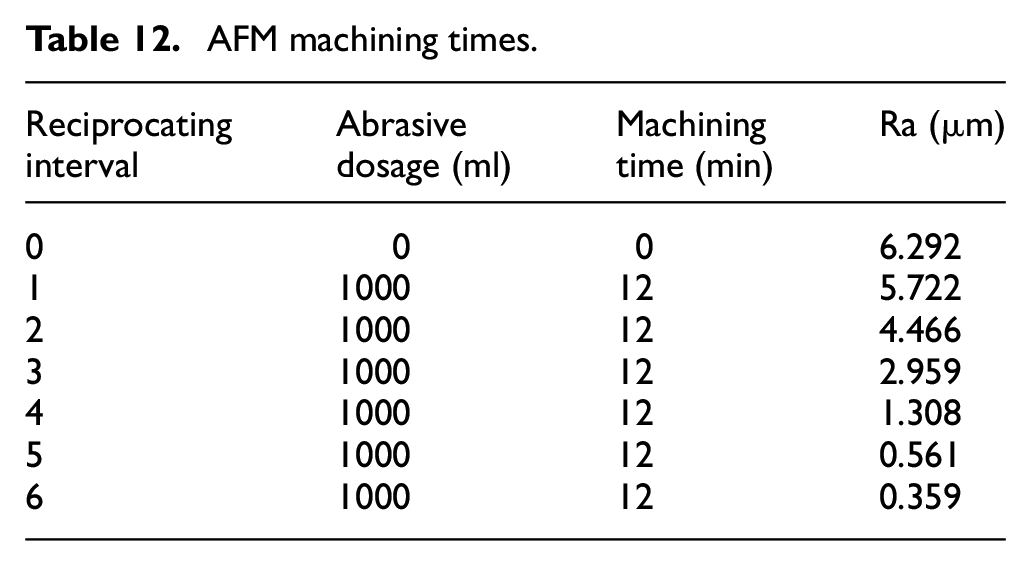
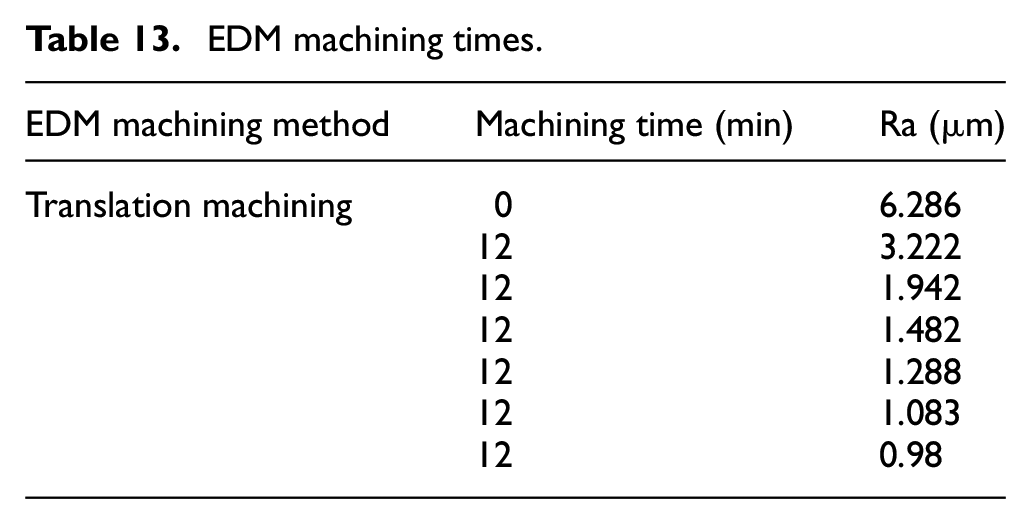
To assess and compare the effects of EDM and “EDM + AFM” on machining efficiency, two EDM samples were machined to the measured surface roughness values of Ra6.286 μm (Sample C) and Ra6.292 μm (Sample D), respectively. Based on this initial surface roughness, sample D with a surface roughness of Ra6.292 μm was then subjected to AFM using the machining parameters listed in Table 4. The sample was subjected to six intervals of reciprocating machining at an abrasive dosage of 1,000 ml per interval. After each interval, the machining time was recorded and the surface roughness of the sample was calculated as the average of the three surface roughness recordings, as listed in Table 12; sample C with a surface roughness of Ra6.286 μm continues to be processed using EDM to a surface roughness of ≤Ra1.0 μm, the changes in the surface roughness of this EDM sample were measured at the same intervals used to measure the changes in the AFM sample (Table 13). The final machined samples are shown in Figure 24.
AFM machining times.
EDM machining times.
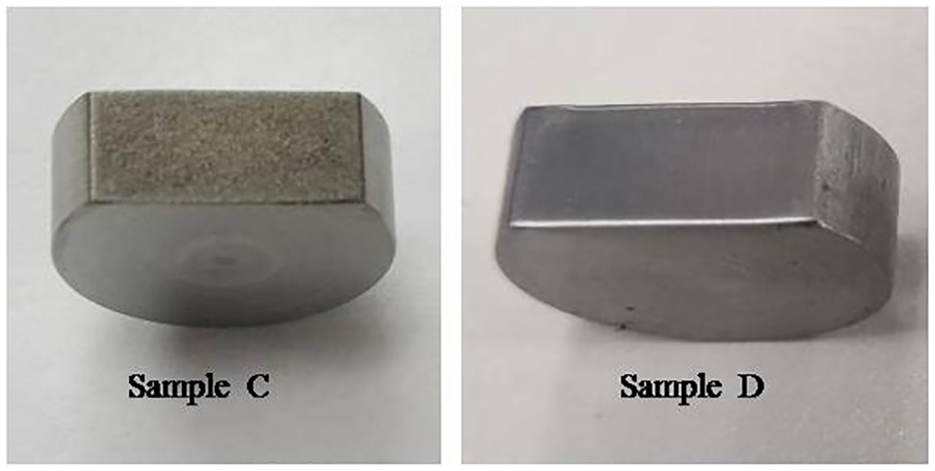
Finished samples: (a) sample C (EDM, Ra0.98) and (b) sample D (EDM + AFM, Ra0.359).
It can be observed from the roughness variation curves in Figure 25 that approximately equal times (∼48 min) are required by the respective processes to reduce the samples from approximately Ra6.286 μm to Ra1.288 μm. After this point, and below approximately Ra1.0 μm, the rates of roughness decrease became extremely slow. The AFM process was able to reduce the roughness of the sample from Ra6.292 μm to Ra0.359 μm within a total elapsed time of approximately 72 min.
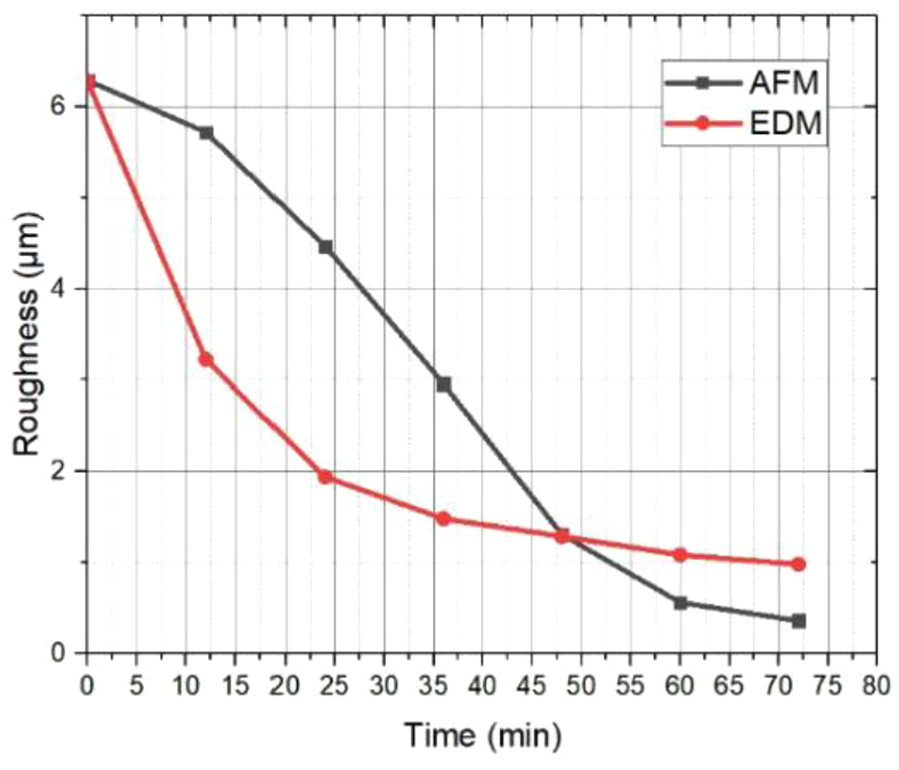
Sample roughness variation curves.
These experimental results indicate that at surface roughness values higher than Ra1.288 μm, the machining efficiency of EDM was slightly higher than that of AFM. Below Ra1.288 μm, however, the efficiencies reversed and the EDM process required a longer machining time than AFM, with the difference in efficiency increasing as the surface roughness decreased. At surface roughness values lower than Ra1.0 μm, the machining time of EDM was significantly increased. Thus, AFM had obvious advantages in terms of late-stage machining efficiency and the additional benefit of being able to completely remove the machined surface recasting layer to achieve a better surface quality.
Experimental assessment of efficiency of machining typical parts with group small holes
To further assess the effects of the selection of machining scheme on machining efficiency, several TC4 typical group hole parts were subjected to the two machining processes. Each part had 144 distributed quadrilateral holes with a size of 4 mm × 6 mm, depth of 5 mm, and surface roughness values of ≤Ra1.6 μm.
In scheme I, EDM was applied to directly complete the group hole machining. Using single rows of electrodes, rough EDM was applied to reduce the surface roughness to Ra6.3 μm and then 12 electrode translations were applied to gradually finish the machining to a surface roughness of ≤Ra1.6 μm. The peak currents for rough machining and final finishing were 33 A and 17A, respectively; the other machining parameters were the same as those listed in Table 2. The parts processed using scheme I are shown in Figure 26.
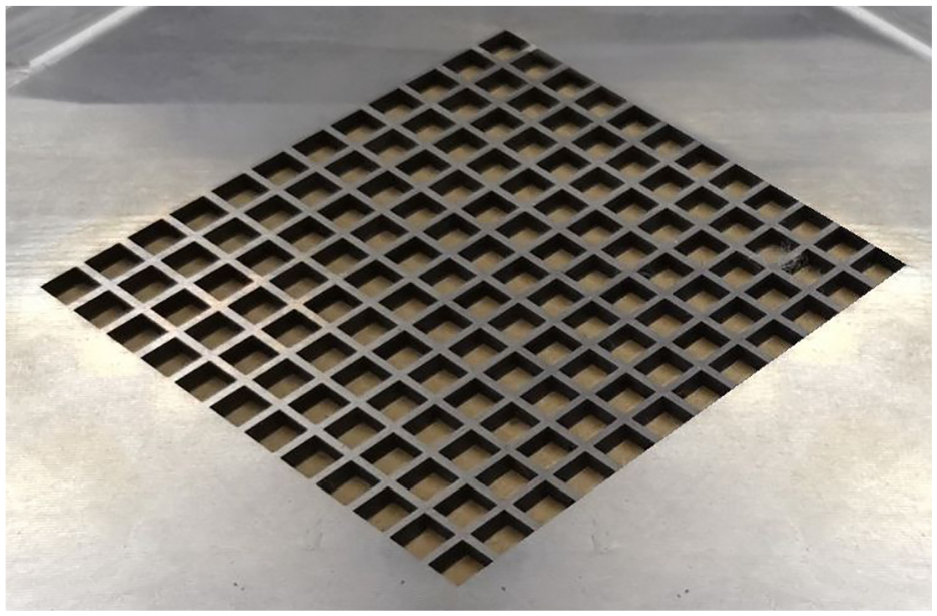
EDM-produced group holes.
Under scheme II, a combined “EDM +AFM” process was applied to complete the group hole machining. Following rough machining via EDM to a surface roughness of Ra6.3 μm, AFM was applied to reduce the surface roughness to ≤Ra1.6 μm. The EDM rough machining parameters were identical to those applied under scheme I, and the parameters listed in Table 3 were applied in the AFM process. The parts processed using scheme II are shown in Figure 27.
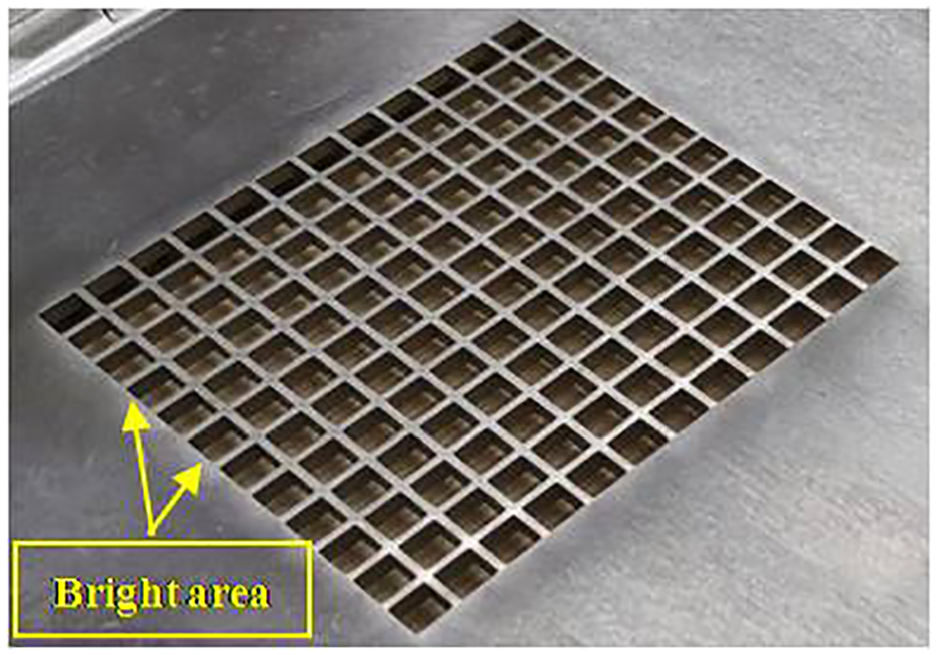
“EDM + AFM”-produced group holes.
Surface quality
The EDM holes produced under scheme I had a dark gray surface color (Figure 26), whereas the AFM holes produced under scheme II featured bright areas on the edges of the holes and surfaces with a metallic luster as a result of the abrasive polishing process (Figure 27). The measured final surface roughness values were Ra1.586 μm and Ra1.502 μm, respectively, both of which are ≤Ra1.6 μm, although the surface roughness produced under scheme II was less than that under scheme I.
Machining efficiency
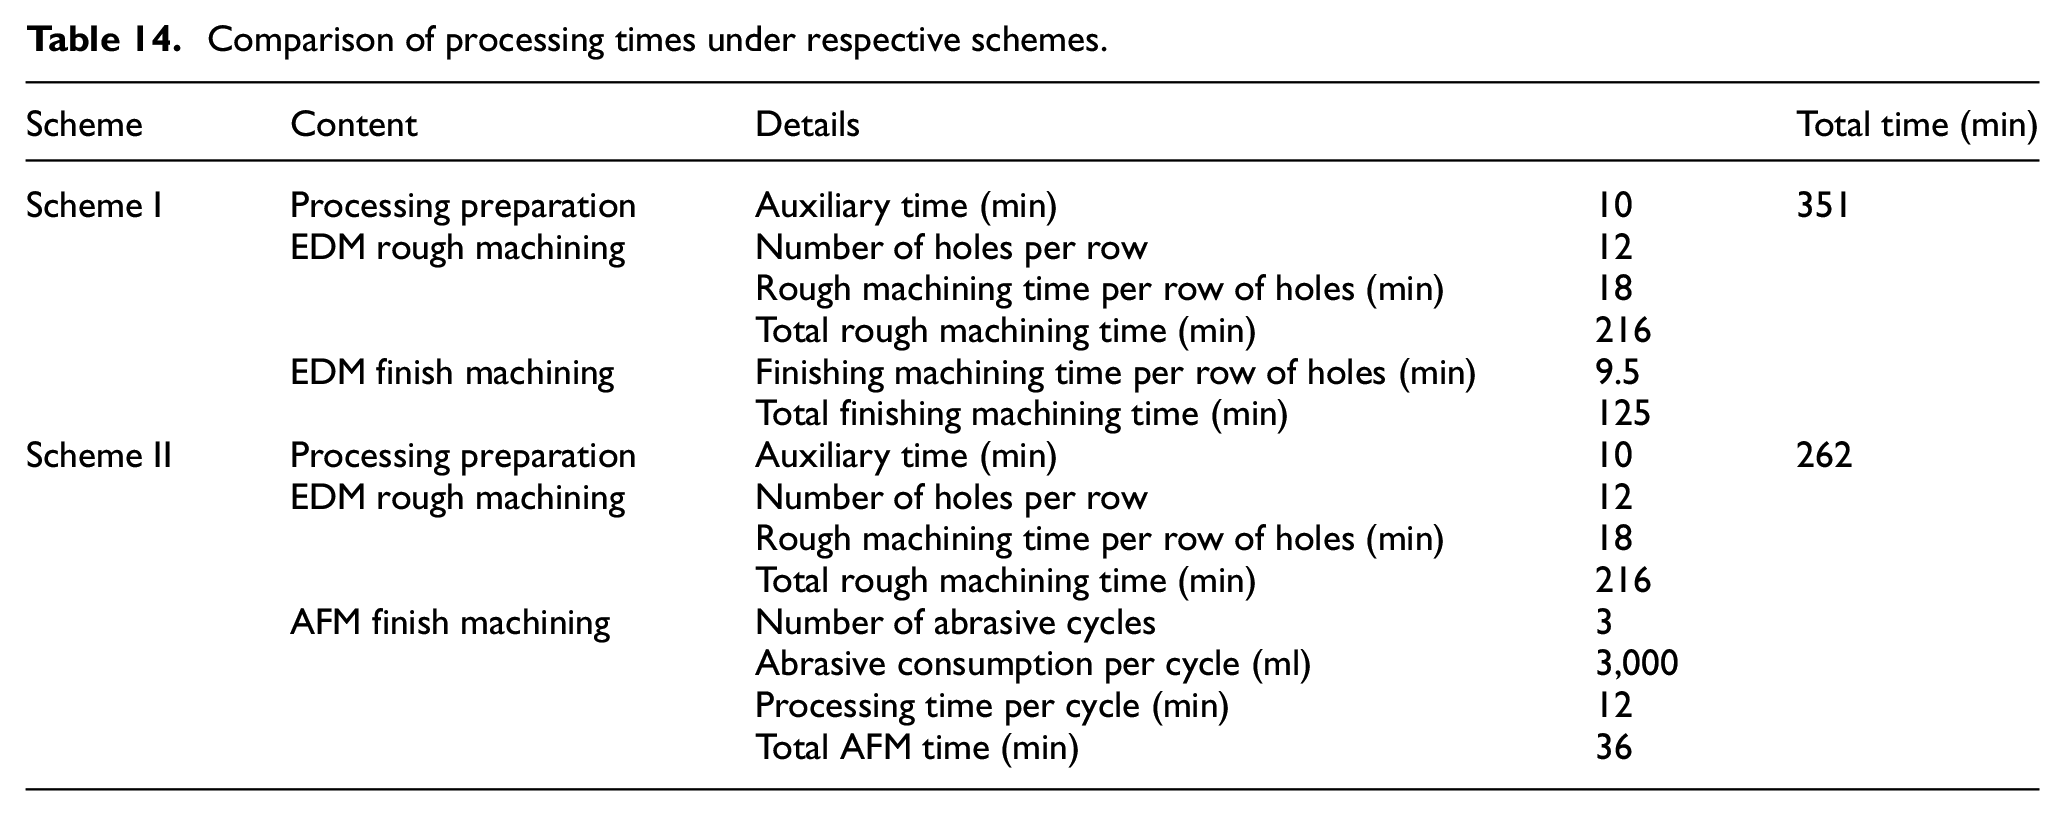
A comparison of the processing time under each scheme is presented in Table 14; the total processing times are compared in Figure 28.
Comparison of processing times under respective schemes.
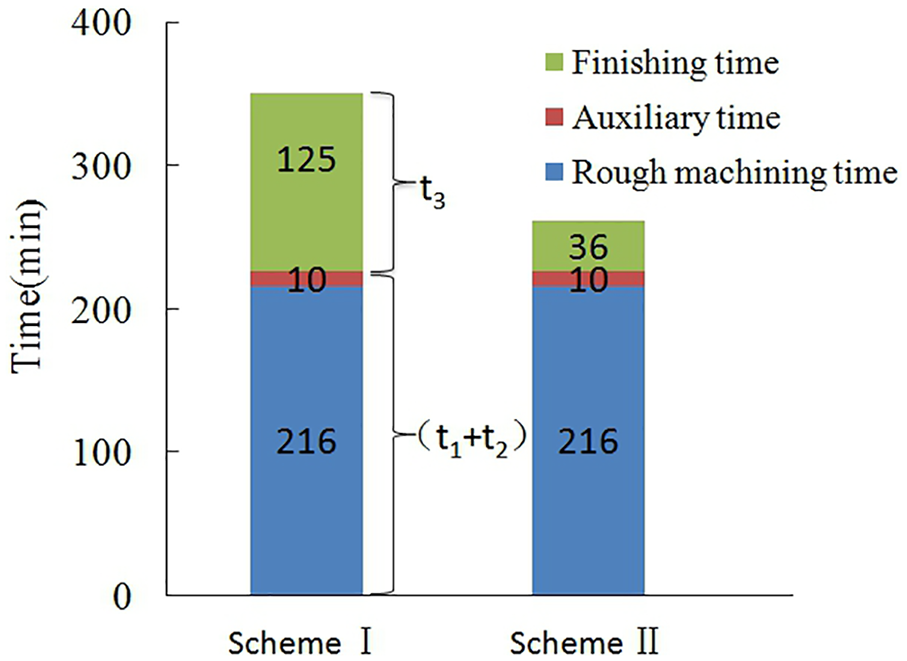
Total processing times.
The total processing time, T is the sum of three elements

where t1 is the rough processing time (min), t2 is the auxiliary time (min), and t3 is the finishing time (min).
For the two processes, t1 and t2 are essentially the same; thus, the finishing time, t3 had the most significant effect on the total processing time. Figure 29 shows a comparison of the finishing times for the respective processes.
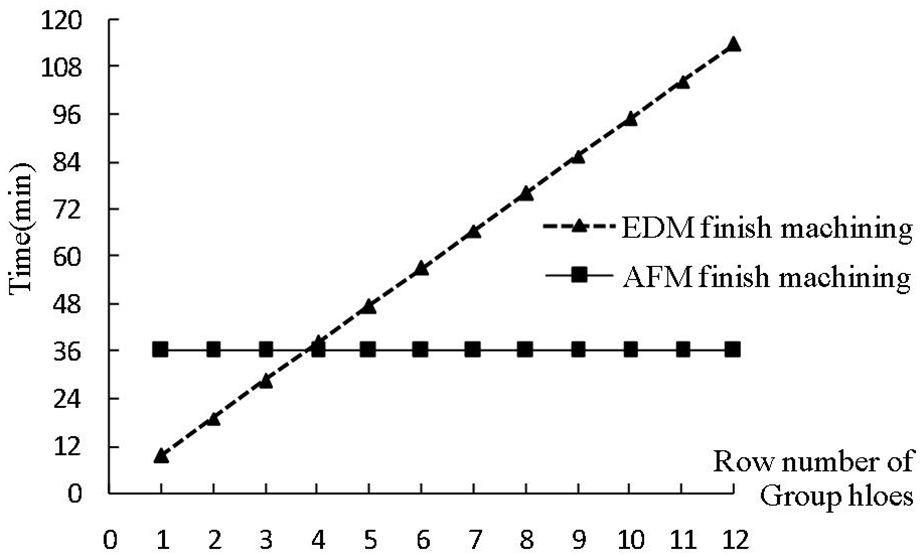
Finishing times (t3) for EDM and AFM processes.
The process of machining the quadrilateral group small hole parts assessed in this study has a balancing point in terms of machining efficiency. For three rows or fewer of group holes, scheme I has a shorter finishing time than scheme II. As the number of group holes increases beyond three rows, the EDM process takes longer than the AFM process. Machining results for typical parts indicate that using scheme II in a combined machining process reduces the finishing time from the 125 min required under scheme I to 36 min, equivalent to 71.2% increase in efficiency. Similarly, the total machining time is shortened from 351 min to 262 min, equivalent to an efficiency increase of 25.36%. These reductions occur because the machining time under EDM finishing increases with the number of channels and holes, whereas AFM can be applied to simultaneously process all group hole surfaces, resulting in a significantly enhanced machining efficiency.
This suggests that the use of a combination of rough EDM and AFM can significantly improve the efficiency of machining multi-channel and group hole parts. In the formulation of an actual process plan, it would be useful to carry out specific analyzes of the various process objectives and machining characteristics and areas. The results of these analyzes can then be used to organically combine EDM and/or AFM approaches to achieve comprehensively high quality and efficiency and low-cost results.
Conclusion
In this study, electrical discharge machining (EDM) and abrasive flow machining (AFM) approaches were analyzed and compared in terms of the physical and chemical properties of the end-product TC4 titanium alloys produced by the respective machining techniques and the advantages of a combined “EDM + AFM” machining scheme were evaluated through the assessment of the machining process time efficiency and final roughness reduction. The following observations and conclusions are provided:
(1) The roughness of the EDM surface and the thickness of the surface recasting layer obtained from graphite electrode machining of TC4 titanium alloys increased with the applied current and the pulse width; however, these parameters were found to have no significant effect on the surface chemical composition of the final alloys. AFM was found to be capable of completely removing the recasting layers from the EDM-produced TC4 titanium alloy surfaces, thereby improving the quality of the machined surface and the surface roughness by two to three grades.
(2) Following AFM, the average microhardness of TC4 titanium alloy EDM samples was approximately 4.8% higher than that of the raw material. The presence of the surface recasting layer was found to induce significant fluctuations in the surface microhardness of TC4 titanium alloys, resulting in nonuniform hardness distributions and local hard points. Following the removal of the surface recasting layer by AFM, the average surface hardness decreased and the consistency improved.
(3) Following EDM, the surface of TC4 titanium alloys had residual tensile stress. After the removal of the surface recasting layer by AFM, this surface residual stress became residual compressive stress related to the initial roughness of the EDM surface; reducing the initial surface roughness enhanced the post-AFM surface residual pressure stress.
(4) The use of a combined “EDM + AFM” machining process scheme can significantly and rapidly improve the surface quality of EDM-produced titanium alloys, although the application of this approach involves a balancing point in terms of machining efficiency. For theTC4 titanium alloy investigated in this study, EDM was found to be more efficient at reducing the surface roughness below Ra1.288 μm; if a surface roughness higher than Ra1.288 μm is required, the machining efficiency and surface quality can be improved by combining EDM with AFM. For the typical quadrilateral group small hole parts analyzed in this study, the time required for EDM finishing gradually surpassed that required for AFM finishing once the number of group hole rows exceeded three. The application of the combined machining process can improve the finishing and total machining efficiencies by 71.2% and 25.36%, respectively, making it particularly suitable for efficient machining of multi-channel or group hole parts.
Footnotes
Declaration of conflicting interests
The author(s) declared no potential conflicts of interest with respect to the research, authorship, and/or publication of this article.
Funding
The author(s) received no financial support for the research, authorship, and/or publication of this article.