
Abstract
To explore the effects of cutter path orientations on milling force, temperature, and surface integrity, end ball milling experiments of TC17 titanium alloy were accomplished derived from different cutter path orientations. The experiment results of milling force and temperature were obtained. Combining with the thermo-mechanical coupling, this paper analyzes the impact of the cutter path orientations on the surface roughness, surface topography, in-depth residual stress, microhardness distributions, and microstructure. The results indicate that the maximum milling force is 224.24 N and the temperature is 672°C under vertical downward milling path, while horizontal downward orientation provides the lowest cutting force of 81.12 N and temperature of 493°C. The surface topography of the four cutter path orientations is basin-like shape, and the minimum surface roughness of 1.128 µm is achieved under vertical upward mode. Moreover, the maximum compressive residual stress of −491.8 MPa and the maximum residual stress layer depth of 45 µm are acquired under vertical downward milling. The maximum microhardness can arrive at 390 HV0.025 under the vertical path. Additionally, the transformation of the material microstructure remains elongated, bent, and fractured. The maximum plastic deformation layer depth is 44 µm under vertical downward milling path.
Keywords
Introduction
Titanium alloys are comprehensively applied in aerospace industry for its high specific strength, low density, and corrosion resistance. Titanium alloy is a typical hard-to-cut material with high the hardness and strength and poor heat conductivity. Parallel cutting is the critical operation for metal removal in a variety of manufacturing processes, obtaining the highest machining efficiency. In rough machining, the cutting width can reach 70% to 90% of the tool diameter. In finishing processing, the tool marks are so consistent that it can gain a better surface characteristic. The parallel path has a wide range of adaptability. The ball end milling consists of four types: horizontal downward, horizontal upward, vertical downward, and vertical upward. 1 Different cutting methods produce various milling force and temperature, while thermo-mechanical coupling effects can form different surface state characteristics.
Many researches aimed at cutting force, temperature, and tool wear, which were generated by diverse workpiece materials and processing conditions. Han and Zhao 2 revealed the effect of different inclination angles and cutting paths on the resultant cutting force. It indicated that the cutting force increased slightly when the tool inclination angle decreased. When the milling width was less than the tool’s diameter, Pimenov et al. 3 studied the influence of the relative position of the face milling cutter and the workpiece, and the milling orientation on the cutting force components and the surface roughness. It was denoted that the cutting force of down milling was greater than that of up milling. Tian et al. 4 concluded that under the condition of the same cutting speed and material removal rate, the rake face peeling was aggravated under the down milling compared with up milling. To obtain small tool wear, the up milling was available for Inconel 718 alloy high speed milling. However, the down milling method was suitable only taken the surface roughness as the evaluation standard. The same research conclusion is that the flank wear was aggravated under down milling than under up milling was investigated by Brinksmeier et al. 5 However, the chatter was missing under down milling, and the surface roughness was better. It was interpreted as that downward cutting was a bright choice for fine surface roughness. Moreover, the Ti6-Al-4V milling force enhanced significantly for the increasing of the feed and cutting depth, which was denoted by Wu and Zhang 6 and Polini and Turchetta. 7 Polini and Turchetta pointed out that the temperature and stress influence zone produced by the tool’s tip was more extensive under down milling. The increasing of the radial cutting depth improves the surface uniformity and surface quality, but hardly affect cutting force. The combined effect of cutting force and cutting temperature causes the surface characteristic to change. Köklü et al.8,9 has developed the research of alloy machining to manufacturability of composite materials functionally graded composite (FGC) materials. The results show that the effect of material direction on delamination can reach 89.5%, but the influence on vibration and thrust are 8.4% and 0.1%, respectively. It is revealed that the feed rate is the main factor affecting the thrust and vibration. The feed speed is proportional to the thrust, while the spindle speed is inversely proportional to the thrust.
There are many excellent reviews in the literature dealing with the basic concepts of the surface state characteristics under different cutting methods. The effects of different tool paths strategies in pocket machining of AZ91 magnesium alloy were studied by Basmacı et al. 10 Approximately equal cutting force and surface roughness were obtained from inside to outside and from outside to inside. The machining angle was the most serious factor affecting cutting force and surface roughness. Pimenov et al.11,12 carried out the experiment of AISI1045 steel end face milling using T5k10 cemented carbide fly milling cutter. The influence of feed rate, cutting speed, and tool wear on surface roughness was analyzed. Aiming at surface roughness, material removal rate, and power, the grey relational analysis method was used to optimize the process parameters. Michalik et al. 13 established prediction models for the roughness Rz of C45 steel thin-walled parts according to the processing length in up and down milling, respectively. Aslantas et al. 14 focused on the effects of milling parameters on the surface roughness and burr width of TC4. It found that plough occurred at low feed resulting in surface quality decreasing. And under up milling, the burr width was larger than that under down milling. At the same time, Karkalos et al. 15 employed RSM to establish the relationship between parameters and Ra during peripheral down milling of titanium alloy. Besides, the application and validity of the prediction model were analyzed. The cutting force and surface roughness prediction models with an error as low as 3.752% were proposed by Bolar et al. 16 It also indicated that the surface quality was the best at low-level parameters, although it was subject to chatter and intermittent engagement of the cutter and the workpiece. Yang and Liu 17 reviewed the various metal structure transformation in cutting processes and pointed out that the surface defects of TC4 were mainly feeding marks, scratches, and particles of adherent materials. The combination of high cutting speed, low feed and small radial width produced good surface quality. Toh18–20 comprehensively and systematically investigated the influence of different cutting path orientations on chip temperature, tool wear, and workpiece surface integrity in high-speed milling of hardened steel. It deduced vertical downward orientation provided the long tool life, and vertical upward orientation achieved the best workpiece surface texture, and the chip temperature of up milling was lower than that of down milling. The relationship between cutting edge radius and surface characteristic was denoted by Wyen et al. 21 The work proposed that the burrs and surface residual stress increase with the growth of edge radius. The surface roughness under different milling path was also analyzed by Dotcheva et al. 22 And the research showed that the surface roughness of down milling was 0.01 µm which was smaller than that induced by up milling. It was equally revealed that down milling was the best way for machining in accuracy and efficiency.
Considerable research efforts have been devoted to discussing the surface integrity under different milling orientations. Tan et al. 23 indicated the tool wear, residual stress, and roughness under different cutting paths. The main wear forms of ball end milling were flank wear and bond wear. The best tool life appeared in vertical downward, which can extend cutting length by 90% to 380%. Otherwise, the horizontal upward was the best choice considering the surface integrity. As a result of allowable cutting length was 270 m, the surface roughness Ra was 1.46 µm, and the surface residual compressive stress was −300 MPa. In thin-walled workpiece milling, Li et al. 24 focused on the surface roughness, surface residual stress and surface microhardness of TC11 milling. The results showed that the surface roughness and the surface microhardness in horizontal upward were greater than vertical upward. On the contrary, the surface residual stress and its influence layer depth under horizontal upward were deeper than horizontal upward. It is commonly known that surface integrity plays an important role in fatigue life, so Laamouri et al. 25 evaluated the influence of the milling path on surface integrity and fatigue strength of X160CrMoV12. The surface showed tensile residual stress, and metal wrinkles and short microcracks occurred in up milling. In contrast, work hardened, compressive residual stress, and carbide precipitation were found in down milling. Furthermore, three-point bending fatigue test reported that the fatigue life of down milling was 2 × 10⁶, which was 26% higher than up milling.
All the review of the literature remarked the existence of some works, which dealt with the systematic and comprehensive comparison of different milling path configurations in terms of cutting force, temperature, surface roughness, and surface residual stress. However, it is only a few studies systematic that considering the residual stress, microhardness, and microstructure below the surface conditions were published. In the article, different tool paths strategies are proposed. Then it describes the measurement methods of cutting force, cutting temperature, and surface integrity. Surface integrity includes surface roughness and morphology, residual stress, microhardness, and microstructure. Finally, the output responses of cutting force, cutting temperature, and surface integrity under different tool paths strategies are analyzed and discussed in detail. The objective of this work is to provide useful guidelines for path selection, which influences not only surface roughness, but also residual stress, microhardness, and microstructure along the depth direction. The results can be exploited as potential applications theoretical basis for optimizing the tool trajectory to improve production efficiency and machining property.
Experimental details
Material
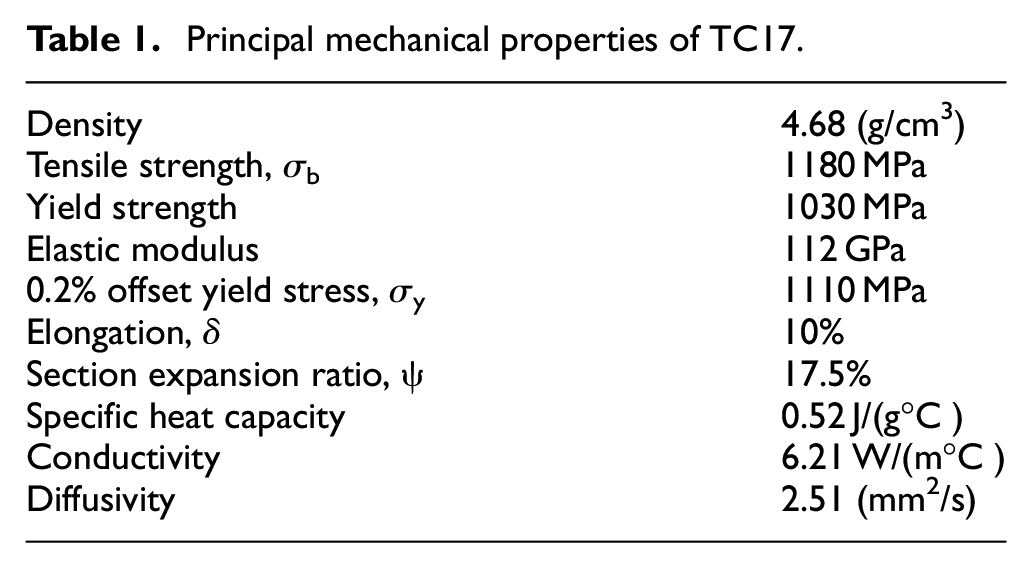
The material used in this study is TC17 titanium alloy. The main chemical compositions is Al 4.8%, Sn 1.9%, Zr 1.9%, Mo 3.9%, Fe 0.06%, C 0.01%, N 0.01%, H 0.005%, O 0.10%, and Ti balance. 26 Its principal mechanical characteristics are provided in Table 1.26,27
Principal mechanical properties of TC17.
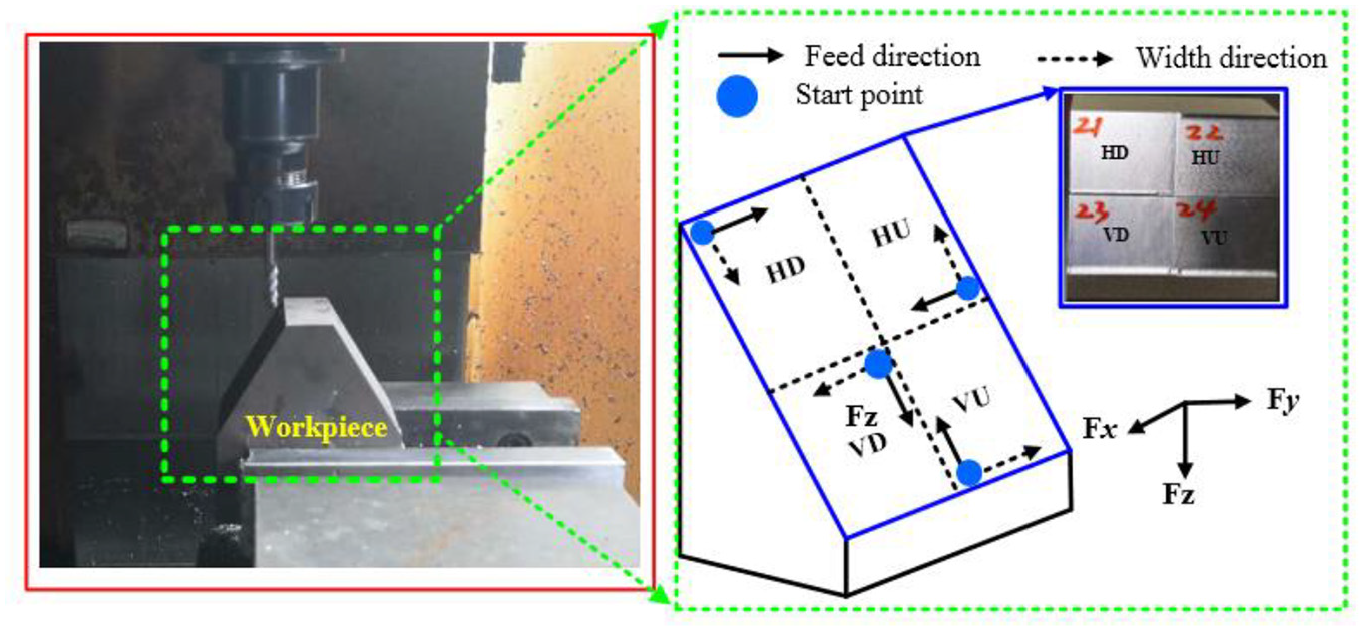
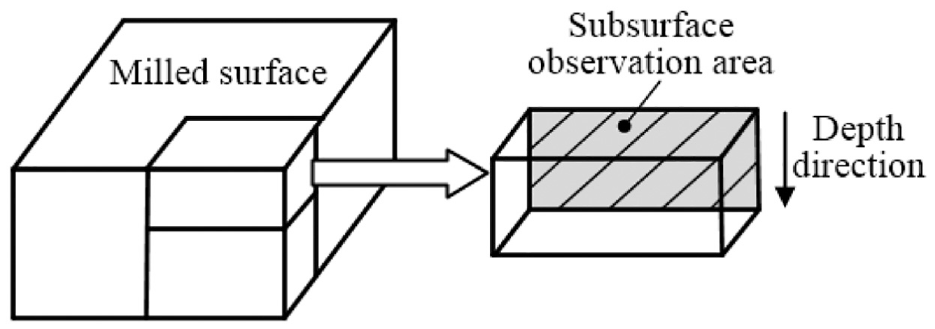
All the experiments were performed on VMC850 CNC, with a spindle power of 7.5 kW and a spindle speed ranging from 0 to 8000 rpm. The four teeth uncoated carbide ball nose end mills were employed with Φ6 mm. The selected tool is shown in Figure 1 with the rake angle of 6°, the first relief angle of 10°, the second relief angle of 12°, and the helix angle of 40°. The tool overhang is 45 mm, and inclination is 30°. A new knife is used for each milling path. The used parameters are as follows: cutting speed (vc) is 50 m/min, feed per tooth (fz) is 0.08 mm/z, milling depth (ap) is 0.25 mm, and milling width (ae) is 0.4 mm. The detailed descriptions of four milling strategies of ball nose end tool on the inclined surface are as follows: horizontal downward (plunge cut parallel to pick feed direction), horizontal upward (reverse cut parallel to pick feed direction), vertical downward (plunge cut parallel to feed direction), and vertical upward (reverse cut parallel to feed direction).1,22 The workpiece and milling path is described in Figure 2.
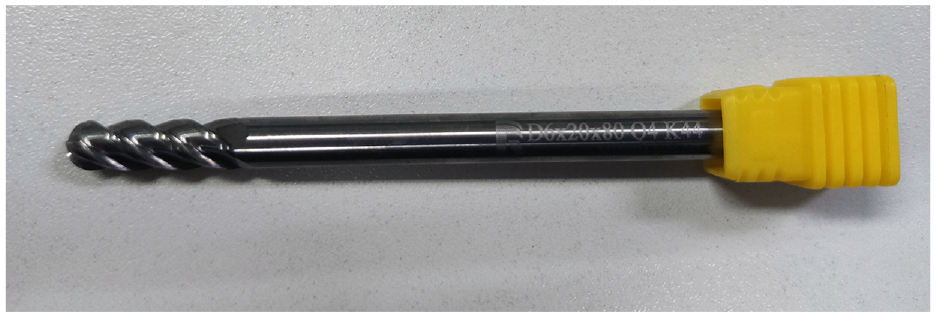
The milling tool.
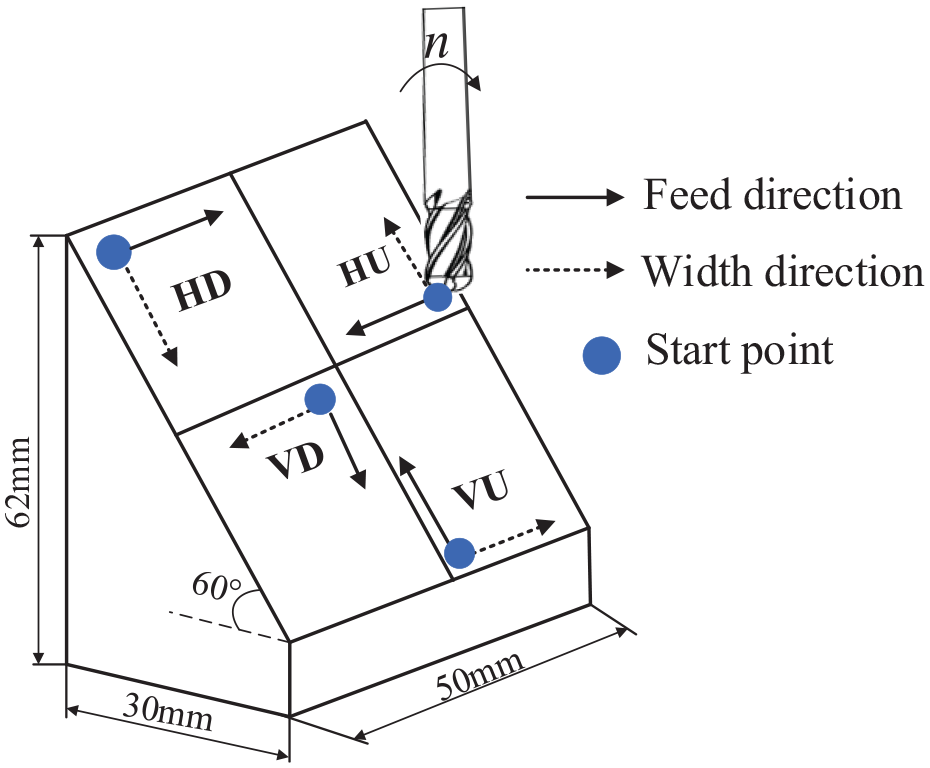
Workpiece and milling path.
Cutting force and temperature testing
Cutting force
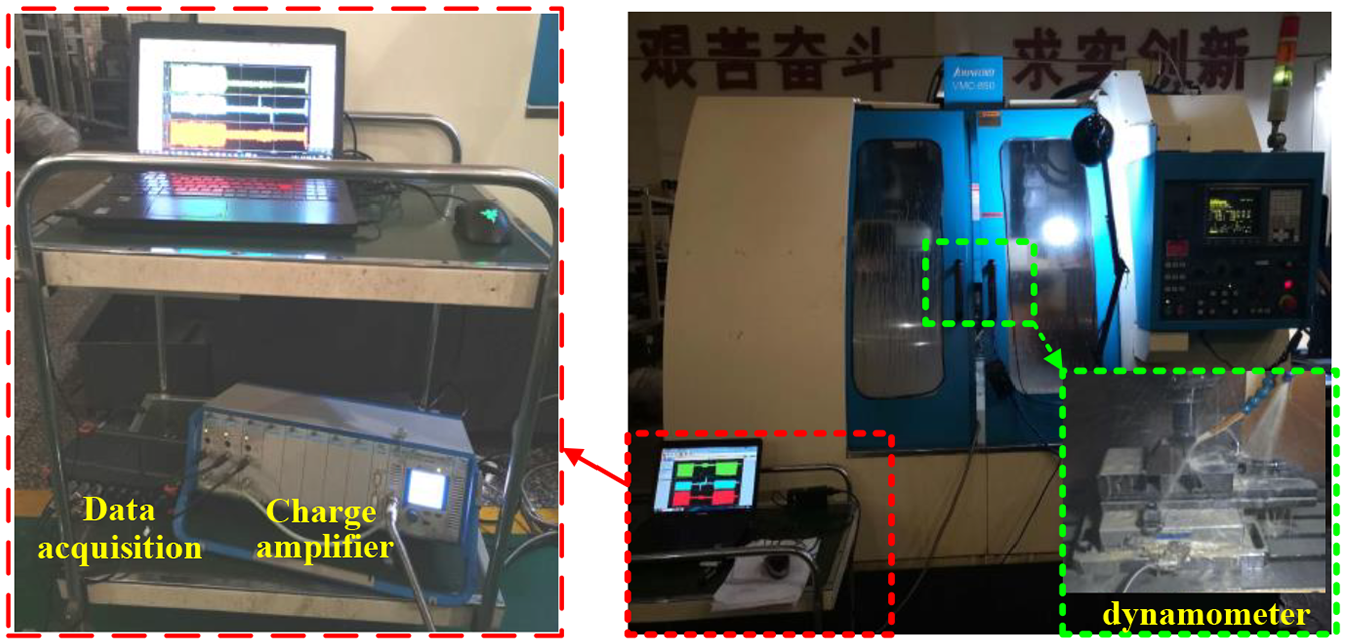
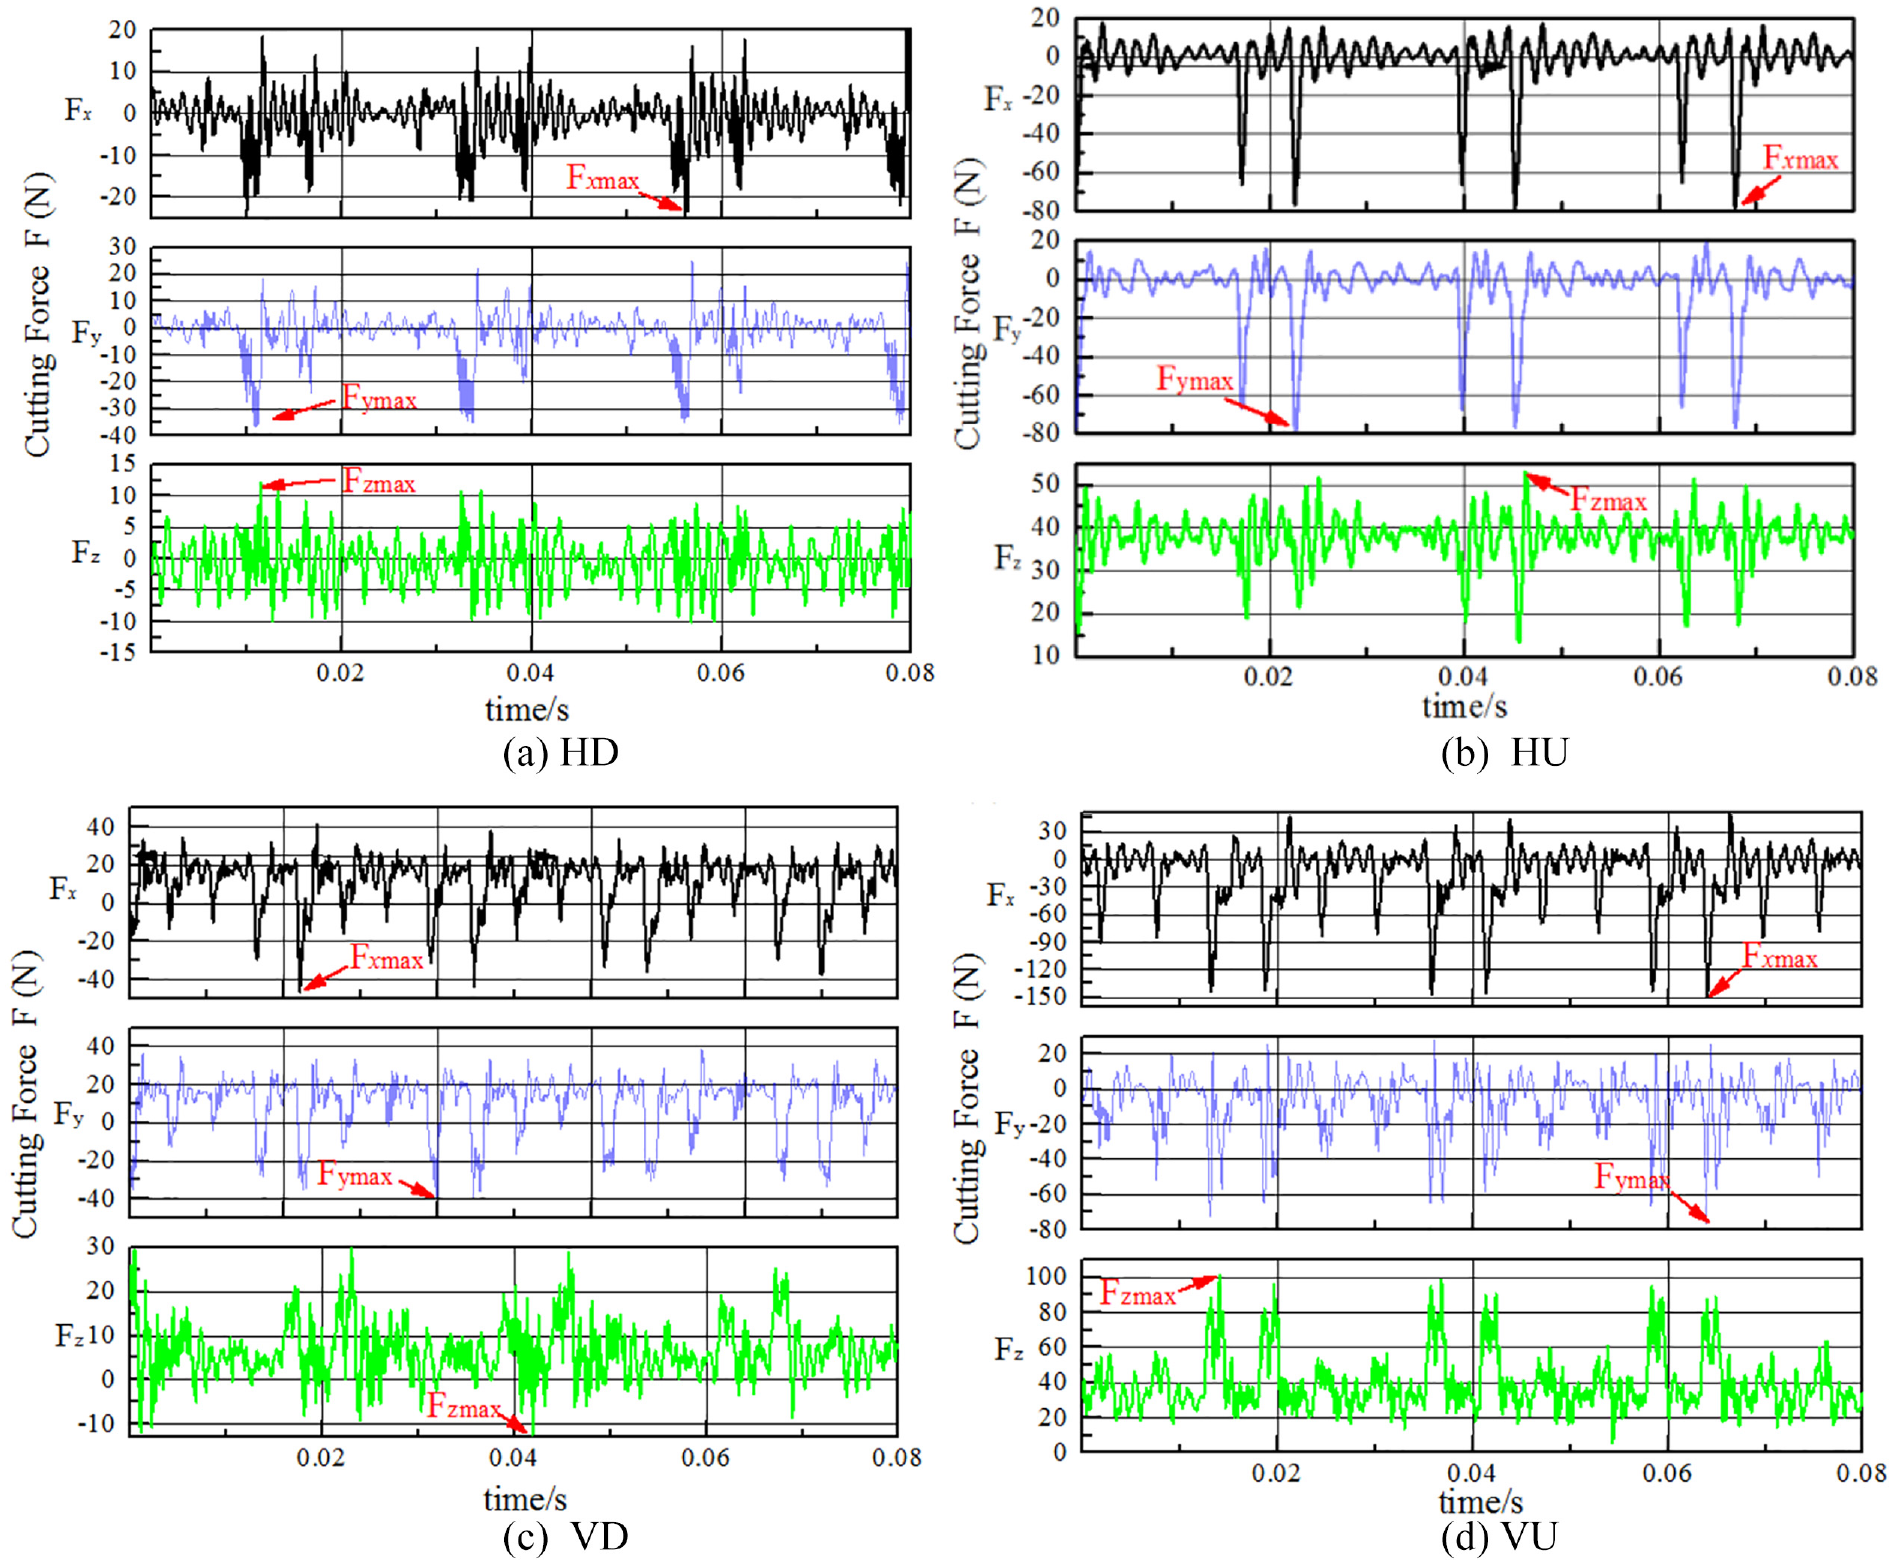
The cutting force was measured by a piezoelectric dynamometer. The basic principle of the dynamometer measurement used the piezoelectric effect of non-metallic materials. Cutting force was obtained directly from a three-way dynamic piezoelectric, which consisted of a Kistler9255B three-way dynamic piezoelectric dynamometer, a Kistler5017A charge amplifier, and a DEWE3010 data acquisition and processing system, illustrated in Figure 3. When the workpiece was subjected to the external force of the tool, the surface of the piezoelectric material in the dynamometer can generate electric charge, and the amount of electric charge was proportional to the magnitude of the applied external force. The charge amplifier was used to convert the electric charge into the corresponding voltage parameter signal. The voltage signal was converted into the force by the data collector and then transmitted to the computer for storage and illustration. It is presented in Figure 4 that the parallel to the feed direction is Fx, the perpendicular to the feed direction is Fy, and the parallel to the tool spindle direction is Fz. The final cutting force was obtained by calculating the average of 100 consecutive peaks.
Milling force procedure.
Cutting force measurement.
Cutting temperature
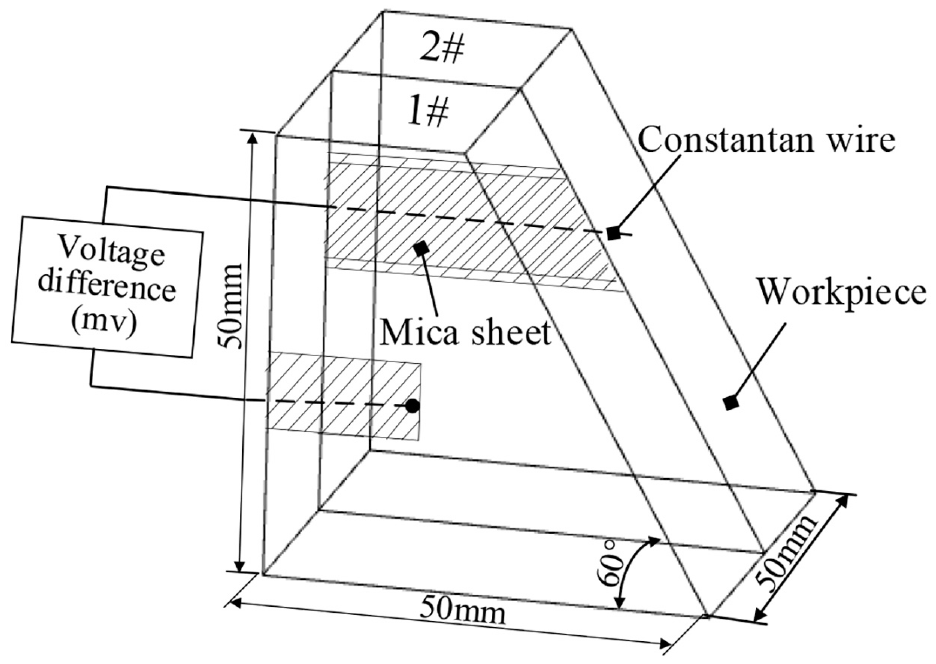
The cutting temperature measurement method adopted the semi-manual thermocouple. Its basic principle was based on the electric potential difference between the hot end and the cold end. The temperature measurement workpiece is shown in Figure 5. Firstly, the workpiece was divided into two parts by wire electrical discharge machining, and the machining surface was polished with sandpaper to remove the cutting marks. Secondly, the mica sheets were pasted on the cutting surface, and the constantan wire (Φ = 0.3 mm) was added in the middle of the two mica sheets. Most importantly, the constantan wire was extended to the surface to be milled as the hot end. Thirdly, constantan wire was embedded in the material far away from the machining surface as cold end, and mica sheet was used for insulation on one side.
Semi-manual thermocouple workpiece.
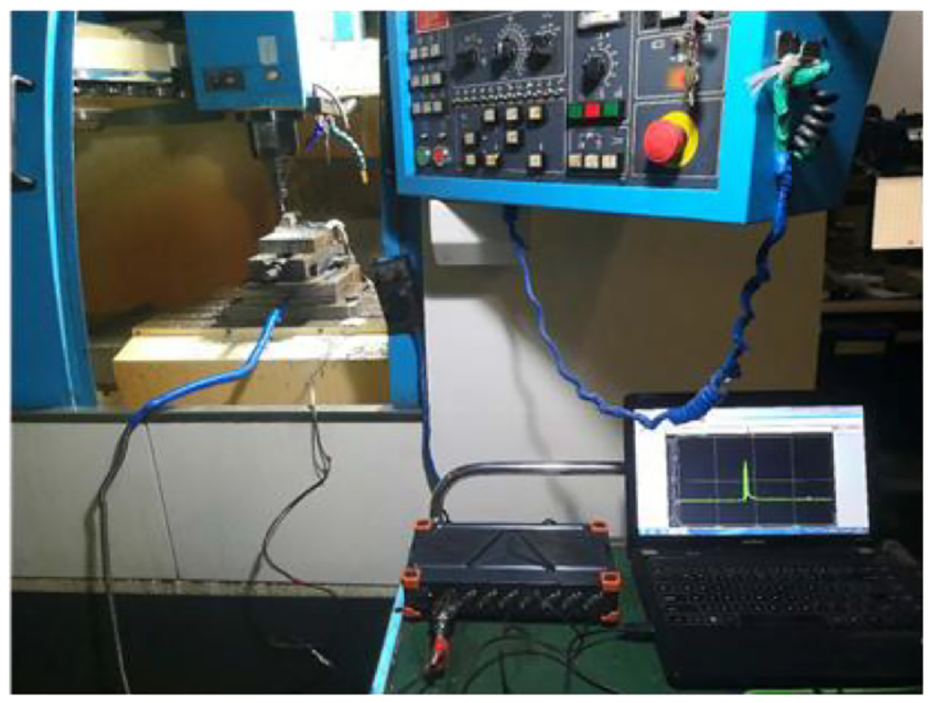
The cutting temperature test is shown in Figure 6. When the milling tool passes the constantan wire, the insulating layer between the constantan wire and the workpiece is destroyed to form an instantaneous thermal junction, which constitutes the hot end of the thermocouple. Since the constantan wire and the other end of the workpiece are far away from the milling area, the temperature hardly fluctuates to form the cold end of the thermocouple. The potential difference between the hot end and the cold end is stored and displayed in the computer after being transmitted by the data collector.
Temperature measurement.
Since TC17-constantan wire is not a standard thermocouple, it needs to be calibrated to obtain the corresponding relationship between the thermoelectric potential and temperature of the non-standard thermocouple. The calibration procedure is as follows: one side of TC17-constant wire non-standard thermocouple and S-type standard thermocouple are placed in the same temperature environment, and the measured temperature by the standard thermocouple is directly converted into actual temperature value by the temperature controller. Meanwhile, the potential difference is measured at the other side of the non-standard thermocouple with voltmeter.
Finally, the temperature calculation model is obtained through regression analysis, as shown in equation (1).

where, T is the temperature in unit °C, and V is the voltage in unit millivolt.
Surface integrity measurements
Surface roughness
Surface roughness refers to the micro-geometric features with small spacing, small peaks and valleys formed on the processed surface. The arithmetic mean deviation of contour Ra and the 10-point height of microscopic unevenness Rz are the most commonly used characterization parameters. In this paper, the German MarSurf XR 20 profiler was used to measure the surface roughness and topography. The sampling length was 0.8 mm, the evaluation length was 5.6 mm. The average value measured at five different positions on the surface was decided as the final surface roughness.
Residual stress
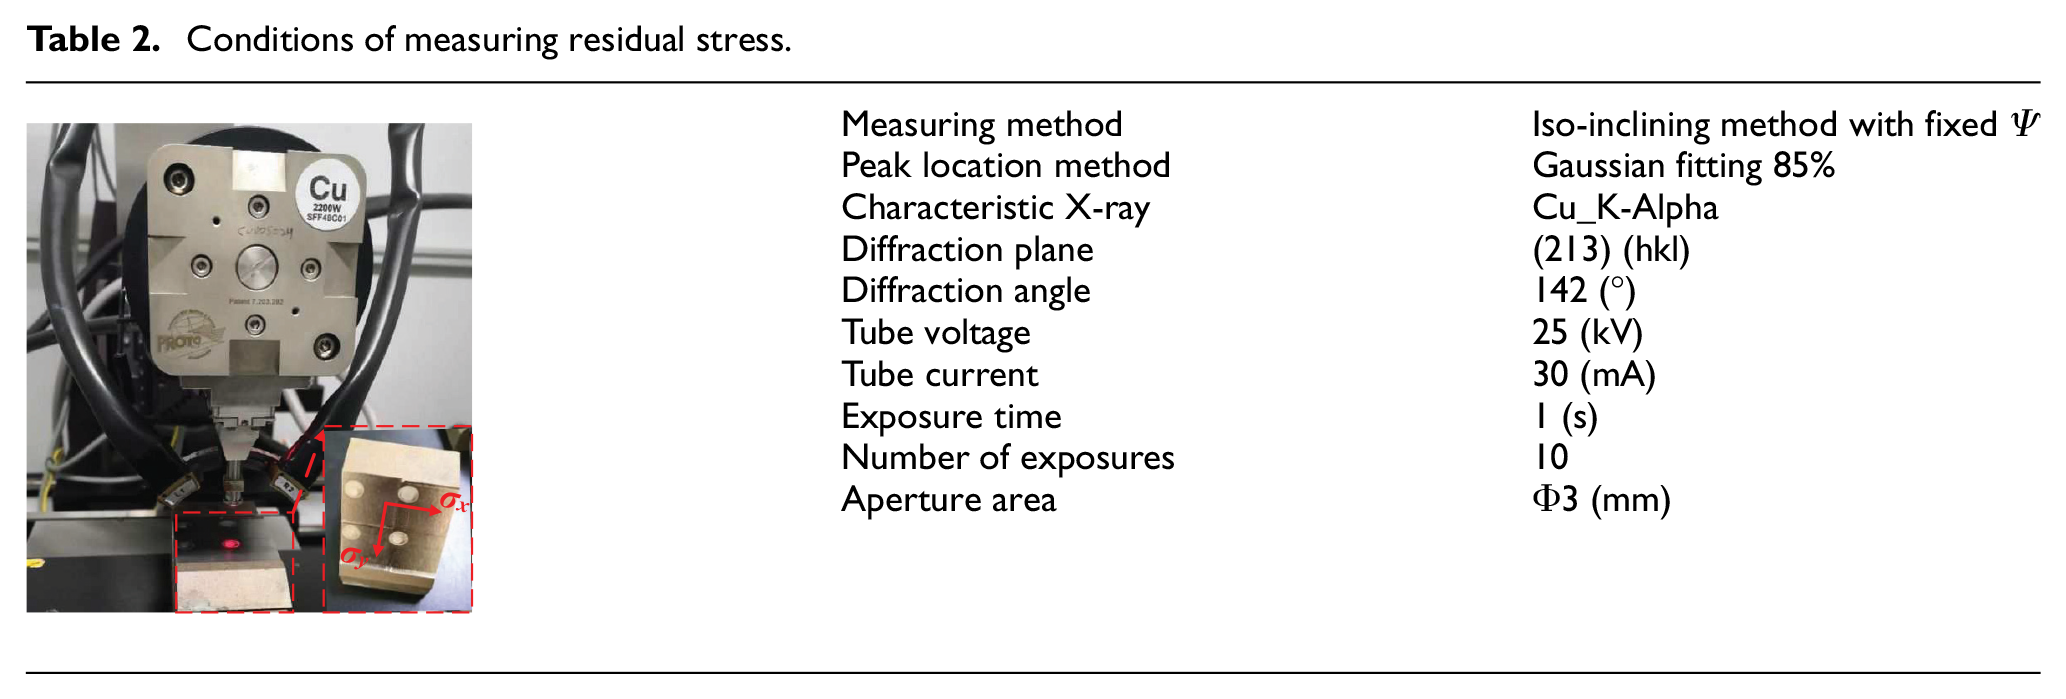
The LXRD MG2000 residual stress analysis system was used to test the surface and subsurface residual stress of the processed surface. The average of three points at different locations in the same area was taken as the final surface residual stress value. To obtain the depth distribution of the residual stress, the specimen surface was electro-polished with a saturated solution of CH3OH:C4H10O:HClO4 = 11:5:1 to expose deeper layers. The detailed conditions of measuring residual stress are described in Table 2.
Conditions of measuring residual stress.
Microhardness
To measure the distribution of microhardness along the depth direction, it is necessary to prepare metallographic specimen. As shown in Figure 7, the specimen (5 mm × 4 mm × 3 mm) was obtained along the vertical direction of milled surface through wire electrical discharge machining. The metallographic specimen with the diameter of 30 mm was mounted on the XQ-2B metallographic specimen machine, and it was experienced coarse grinding, precise grinding and polishing. During the grinding process, the sample surface should be kept straight and the sample should be rotated 90° before replacing the sandpaper. Water soluble diamond grinding paste with particle size of w2.5 was coated on the velvet cloth to polish the sample until the mirror surface appeared, indicating that the sample was successfully prepared.
Cutting scheme of metallographic specimen.
As presented in Figure 8, the successfully prepared metallographic specimen was tested on microhardness measurement system FUTURE-TECH FM800 with a test load of 25 g and a dwell period of 10 s. Five measurements were made at each depth and an average value was proposed to explain the material inhomogeneity and measurement error.
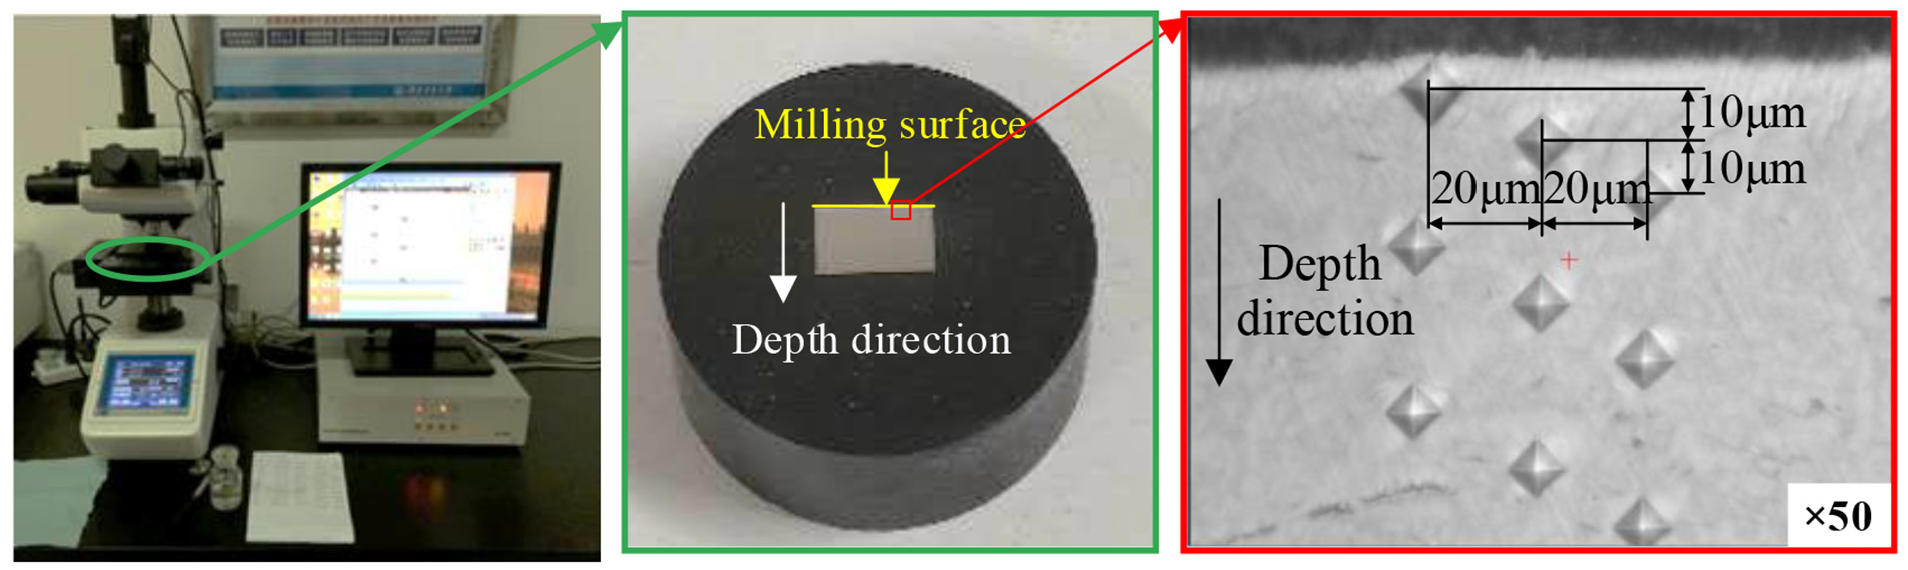
Microhardness experiment.
Microstructure
The microstructure changing was observed by Ion/Electron Double Beam Electron Microscopy (Helios G4 CX) after the corrosion insert specimen. The composition specific gravity of the corrosive liquid was HF:HNO3:H2O = 1:5:14. It was worth ensuring that the sample must be cleaned immediately after corroding for 20 s. The metallographic specimen was observed at 2000×, 5000×.
Results and discussion
Milling force and temperature
It is generally known that milling is an intermittent cutting process, and the cutting edge successively cut the material when the tool rotates for one cycle. According to the thickness change of the material to be cut, the milling force signal waveform is formed. Extract the cutting force under four different cutting modes as shown in Figure 9.
Force signal generated by ball end milling.
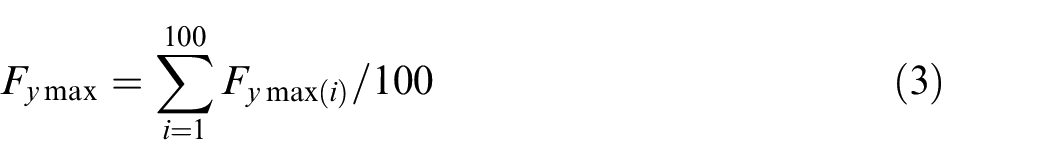
Comparing the four cutting paths, it can be seen that the cutting force increases from zero to the maximum at the beginning of the cutting, and then decreases to zero at the end of the cutting. The vibration range of vertical milling is larger than that of horizontal machining. The main reason is that the thickness of the cutting layer during the milling process directly affects the resistance to deformation caused by the elastic-plastic deformation of the metal and the frictional resistance between the chip and the tool. 28 With the milling tool gradually entering the material, the cutting force increases with increasing of the thickness of the chip layer. In finishing cutting, the chip deformation resistance decreases so that the cutting force in all directions starts to decrease. Due to the coupling effect of various uncontrollable factors such as machine tools and cutting tools, there is a certain vibration interference on the uniformity of cutting speed distribution in the contact area of cutting tools and workpieces.29,30 All the distractions would bring about the fluctuation of cutting forces in different periods during machining. Therefore, the final cutting force is the maximum value of cutting force in each direction, which is taken as the average value of 100 consecutive cutting force peaks or valleys, as shown in equations (2), (3), and (4). The total cutting force (Ftotal) is the square sum of cutting forces in each direction, and it is given in terms of the specific calculation formula as equation (5).

Milling force and temperature are the significant factors for the surface integrity formation. The formation of surface integrity is the result of cutting force and temperature. Besides, the workpiece can obtain better surface roughness, lower stress and smaller hardened layer depth on low force condition. Moreover, the tensile residual stress on the workpiece generated by temperature is smaller, which critically reduces the tensile residual stress on the subsurface to expand the fatigue crack and accelerate the fatigue failure. Simultaneously, the softening degree of the workpiece surface is essential reduced, and the durability of the workpiece is crucially improved.
From Figure 10, the cutting force and temperature vary greatly for different milling methods. Vertical downward (VD) obtains the maximum cutting force (224.24 N) and temperature (672°C), indicating that the cutting edge participates in the cutting, and the speed is close to zero near the cutting edge during the down milling process, which causes the cutting state to deteriorate and the cutting force and cutting temperature to increase. 23 It can also be revolved that the milling force and temperature of horizontal downward (HD) and vertical upward (VU) are less than those of vertical downward (VD) and horizontal upward (HU). This is mainly because the width of the chip along the cutting-edge direction is wider when the milling cutter cuts in, and narrower when the milling cutter cuts out under horizontal downward (HD) and vertical upward (VU) cutting orientation. However, it is exactly the opposite of using the horizontal upward (HU) and vertical downward (VD) methods. Furthermore, the horizontal downward (HD) and vertical upward (VU) cutting modes can obtain long wedge-shaped chips, and the stress at the blade edge is well released in this state. 31 Therefore, a better cutting state is obtained, and the cutting force and temperature in the cutting process are effectively controlled, which contributes to obtaining a better cutting state.
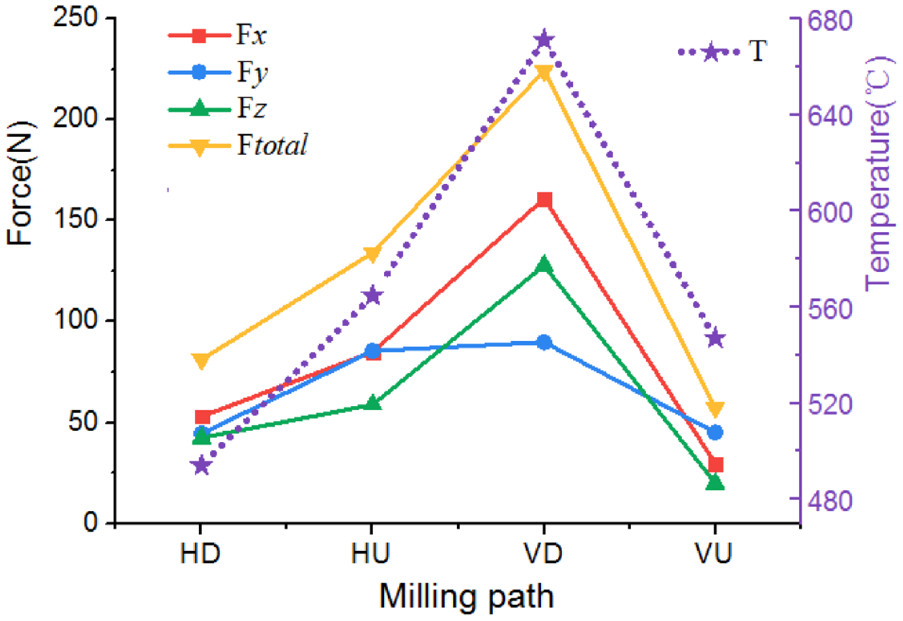
The cutting force and temperature under different milling orientation.
Surface roughness and topography
Figure 11 indicates the impact of milling path on surface roughness, which includes arithmetical mean deviation (Ra) and the 10-point height of irregularities (Rz) of the profile. The surface roughness is measured along the feed direction. The results conclude that using vertical upward (VU) cutting mode gives the lowest surface roughness in which Ra is 1.128 µm and Rz is 6.336 µm. The second is the horizontal upward (HU) milling path with the result that Ra is 1.197 µm and Rz is 5.92 µm respectively along the feed direction. It is followed by horizontal downward (HD) with the result that Ra is 1.481 µm and Rz is 6.561 µm. The value of Ra and Rz is 1.648 µm and 7.429 µm with vertical downward (VD) along the feed direction, which is given the worst surface roughness. Ra and Rz have the same change pattern in different milling orientations, and the maximum value emerges in vertical downward (VD). This outcome can be interpreted as follows. During the vertical downward (VD) machining process, the cutting temperature and cutting force exist at the same time. Thus, built-up edge and microcracking appears on the cutting edge and then copies onto the machined surface. The minimum surface roughness generates in vertical upward (VU) mode. This phenomenon would be explained as that milling force and workpiece vibration are smaller, and the cutting system is more stable. Regardless of the horizontal or vertical direction, the surface roughness in upward is better than downward. This is because the contact area at the top of the ball end mill brings high cutting temperature, which in turn leads to low friction coefficient and surface deformation. Besides, the upward movement can decrease the high temperature and vibration caused by the tool shaft, and prevent chips from scratching the machining surface.23,32
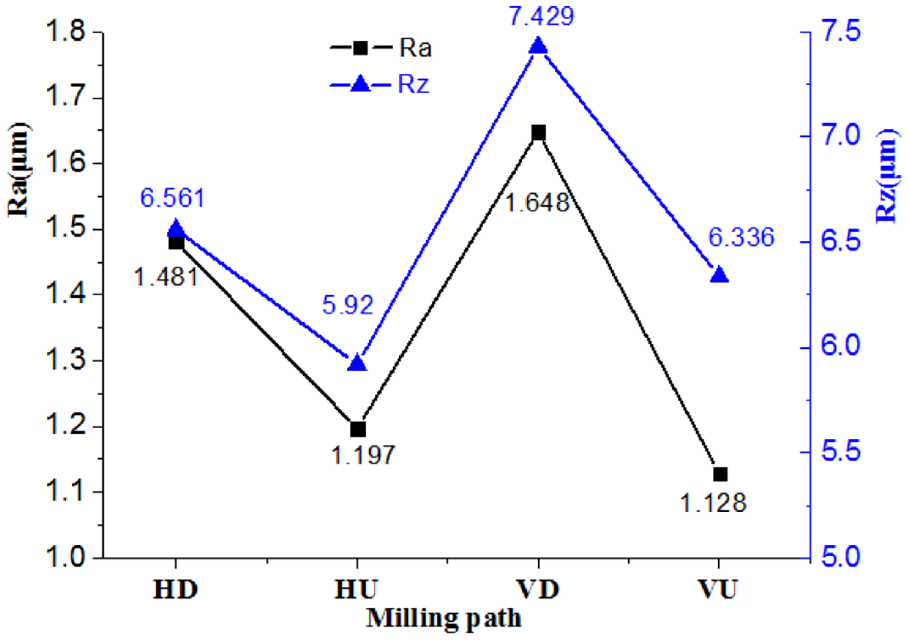
Effect of milling path on surface roughness.
The surface topography represents the relative movement of the milling tool and workpiece, displayed in Figure 12. The distance of the peak height along the feed direction is equivalent to the feed value, and the length between the two ridges is approximately equal to the milling width. 33 Milling is a continuous cutting motion, and the rotation speed is much higher than the feed speed. Therefore, ridges on the surface have more opportunities to contact with the milling cutting edge. At the same time, the plowing action makes the metal material in peak position flow to both sides. Besides, the material with a considerable height on the surface also has a chance to contact with the tool edge. If their contact depth does not reach the minimum cutting thickness, the convex portion is cut down without chips. Moreover, the valley location would be raised with metal slip. As it can be seen that the morphologies under the four milling strategies are all concave basins shapes. In vertical upward (VU) cutting mode, the surface morphology is uniform, and the protrusion is small. The surface has the largest convexity in vertical downward (VD) orientation because the chip is easy to stick to the tool rake face and increase the surface roughness in the next machining cycle.
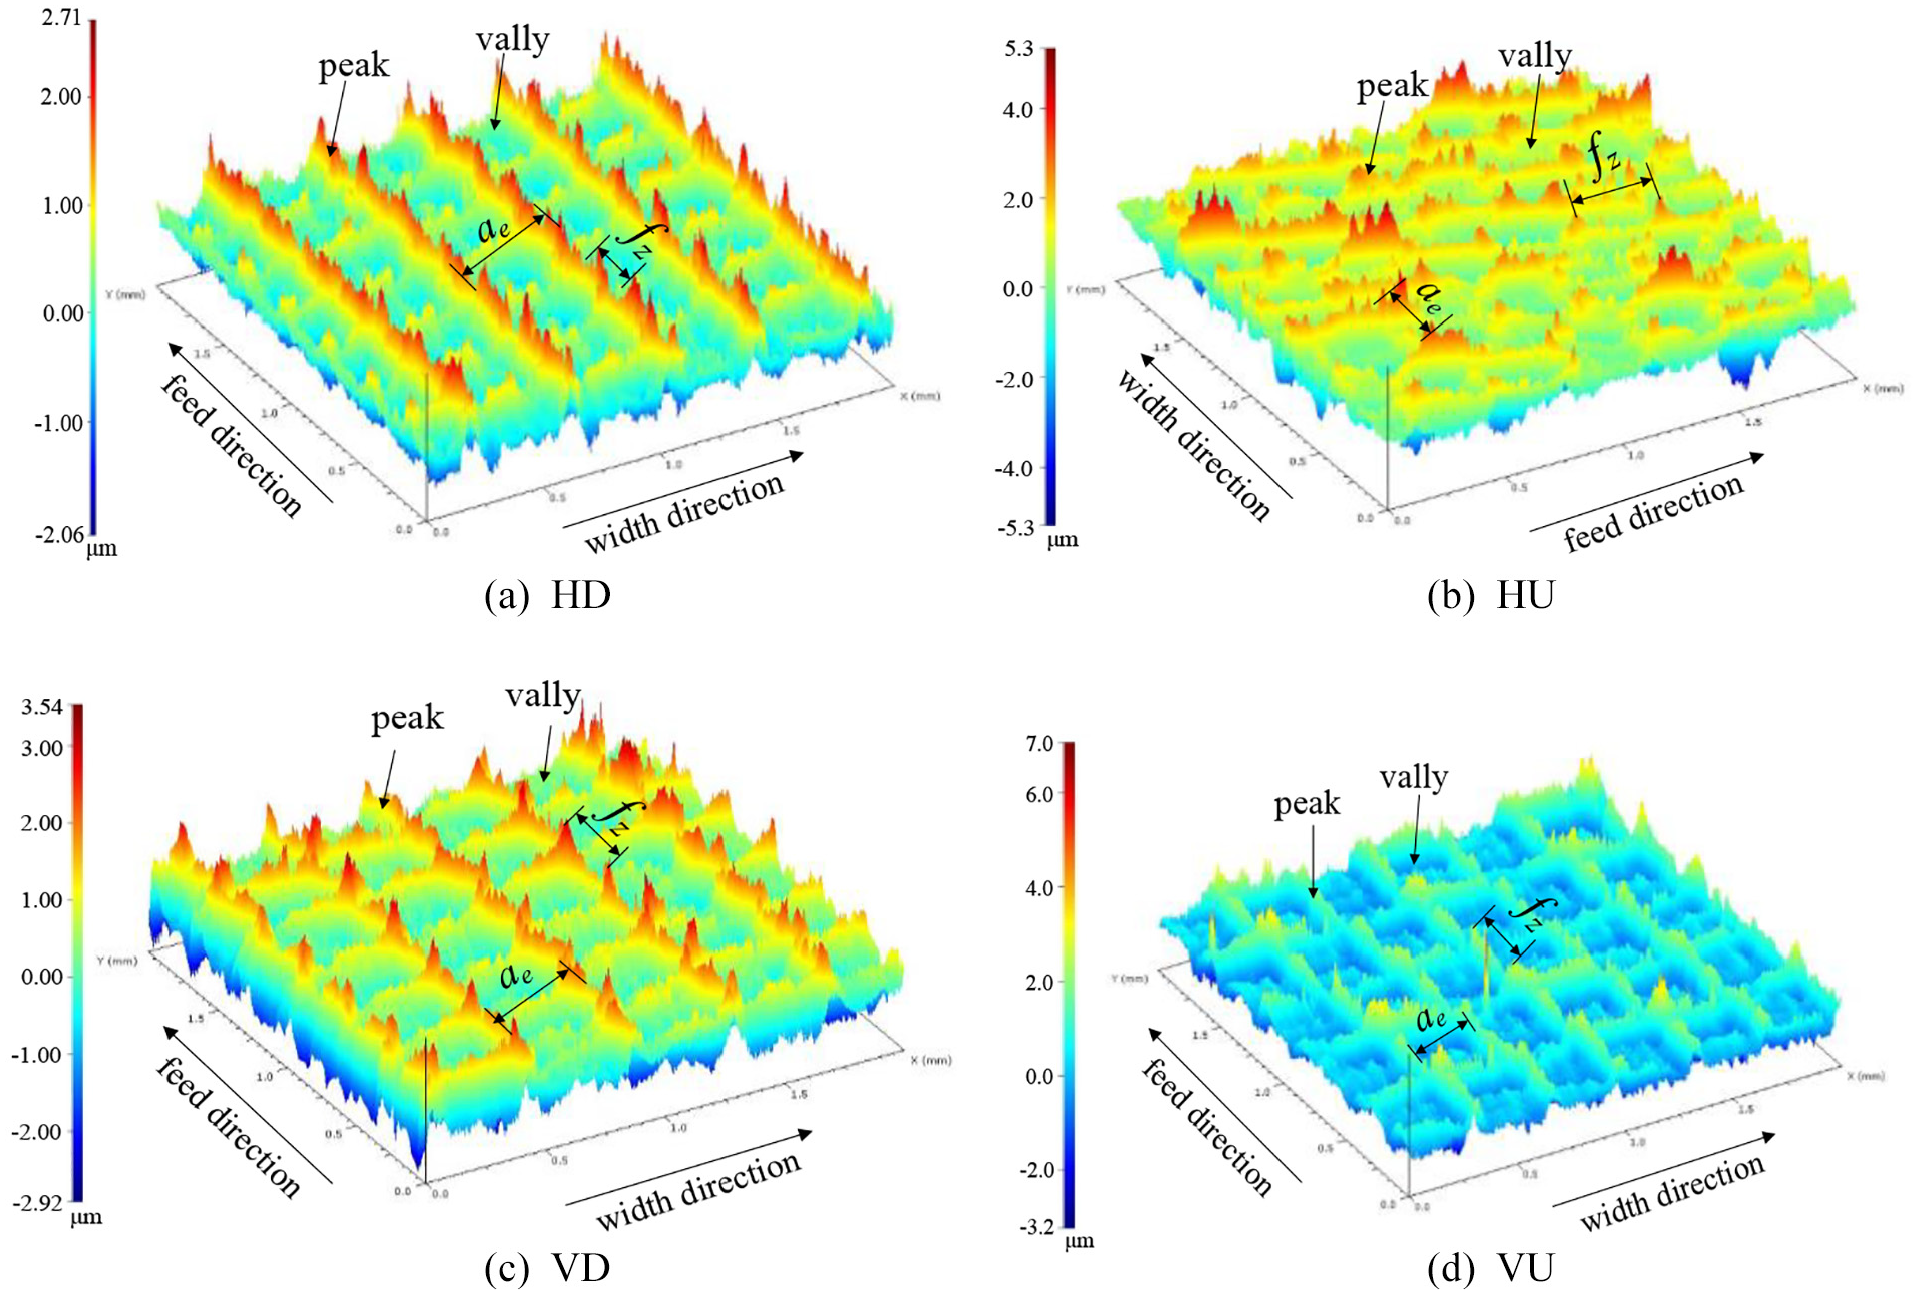
Surface topography.
In-depth residual stress distribution
The residual stress is usually generated by the transfer of thermal-mechanical coupling from surface to subsurface. The tensile residual stress is usually implied as plastic protrusion effect and high temperature, instead the compressive residual stress is generally closely related to mechanical force, extrusion effect and low temperature.34,35 In other words, the magnitude of the associated physical effects determines the relative differences in workpiece residual stress. Residual stresses distributions both in x direction and y direction after different milling paths are described in Figure 13. The surfaces show compressive residual stress in x direction and y direction, which ascribes the distinctive milling paths. After vertical downward (VD) milling, surface residual stress is −346.05 MPa in x direction and −388.3 MPa in y direction. The maximum compressive residual stress in x direction is −393.4 MPa at a depth of 10 µm approximately, while it is almost 500 MPa at a depth of 5 µm in y direction. The compressive residual stress layers are 40 µm and 45 µm, respectively. After horizontal upward (HU) milling, surface residual stress is −177.95 MPa in x direction and −121.8 MPa in y direction. The maximum compressive residual stress in x direction is −276.3 MPa, which is located at 5 µm below the surface. The residual stress in both directions are stable at 15 µm and 25 µm beneath the surface. The maximum residual stress is in the surface with vertical upward (VU) and horizontal downward (HD) machining in x and y directions. The surface residual stress obtained by vertical upward (VU) is −382 MPa in x direction and −300.1 MPa in y direction. The residual stress layer depth is 35 µm in x direction, which is 5 µm shallower than y direction. With horizontal downward (HD) milling path, the surface residual stress is −208.35 MPa and the layer depth is 25 µm in x direction. While in y direction, the surface residual stress is −208.35 MPa and the layer depth is 35 µm. The surface residual stress, the maximum compressive residual stress and the depth of the residual stress layer obtained by vertical downward (VD) are the highest among four methods, which can be attributed to the high cutting force of 224.24 N, resulting in plastic deformation and squeeze effect between the side and the machined surface. It can be seen from the analysis of Figure 10 that the change in cutting temperature is not obvious and the highest temperature (670°C) does not exceed the phase transition temperature (897°C), 36 so the residual stress of TC17 titanium alloy is dominated by mechanical stress. In addition, the lower cutting speed acting on the lower part of the ball end mill may produce lower temperatures, thereby encouraging higher compressive residual stress. 24 It reveals that the deepest residual stress layer is obtained in y direction of vertical downward (VD), because the cutting force and the plastic deformation is the largest in y direction corresponding to the feed direction. Generally speaking, the compressive residual stress can prevent the expansion of fatigue cracks and delay the occurrence of fatigue damage. It is deeper compressive residual stress influencing layer that is beneficial to improve the fatigue strength of the workpiece.37,38 Therefore, vertical downward (VD) is the best milling path taking residual stress as criteria.
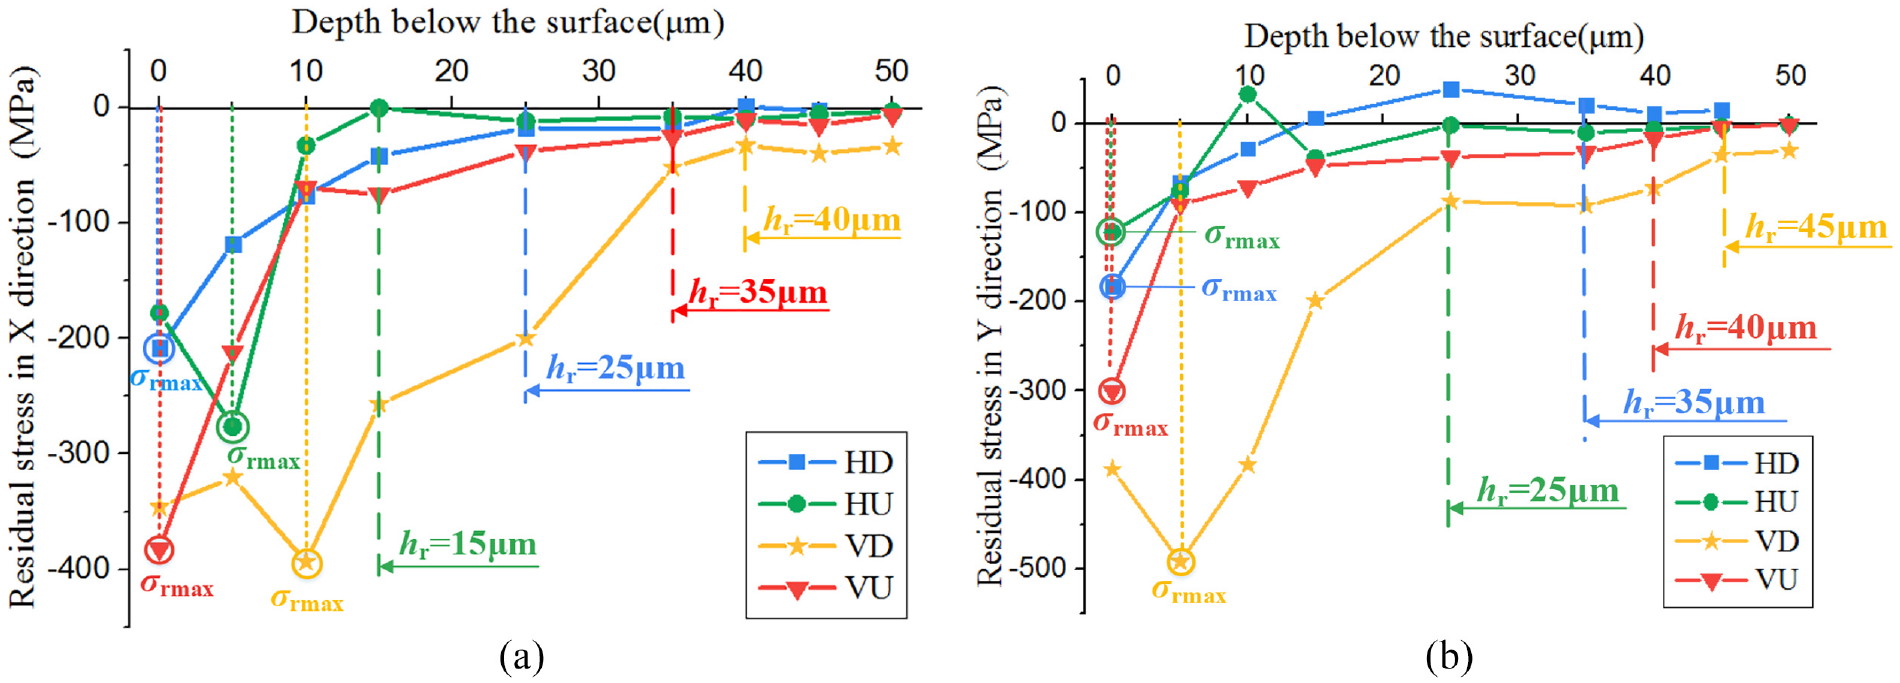
Residual stress distributions in different milling path: (a) residual stress in x direction and (b) residual stress in y direction.
In-depth microhardness distribution
The microhardness distributions below the surface along feed direction with different cutting modes are shown in Figure 14. It illustrates that with the increase of the depth under the surface, the microhardness in horizontal downward (HD) and horizontal upward (HU) paths approximately is stable regardless of milling orientations applied, which depicts the weak strengthening effect. It can be found that work hardening appears in the vertical downward (VD) and vertical upward (VU) orientations. Furthermore, the maximum microhardness of the subsurface can achieve 390 HV0.025 and the degree of hardening is about 7%. According to the analysis of Figure 10, the temperature during processing doesn’t reach the dynamic recrystallization temperature and phase transition temperature (897°C). 36 Therefore, the milling hardening of TC17 titanium alloy is the main result of strengthening caused by cutting force and weakening produced by cutting temperature. The thermo-mechanical coupling effect is the strongest under the vertical downward (VD) cutting mode. With the increase of cutting force and equivalent plastic strain, the plastic deformation zone of the material extends to the subsurface. The rebound effect of the material deforms the friction between the excess material on the machining surface and the tool, leading to the change in the crystal structure of the material. However, the hardness of the material increases to resist these changes. The greater processing strength will generate more heat, but the cutting heat is concentrated in the processing area of the workpiece because of the low thermal conductivity. As a result, the significantly increased surface temperature makes the material softened, and the degree of work hardening is gradually reduced.
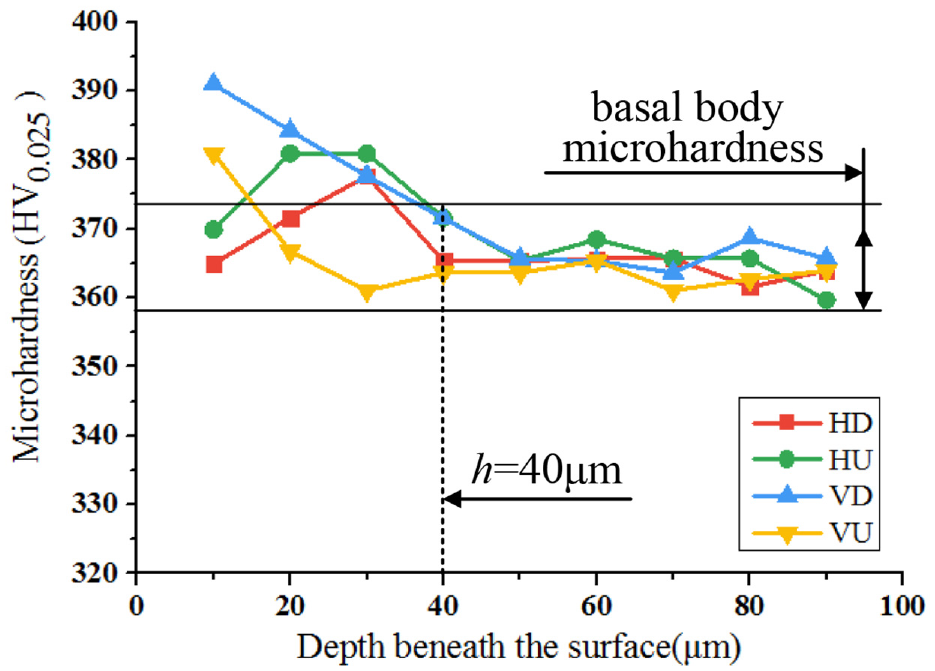
Microhardness distributions below the surface.
Microstructure observation
Observation of the workpiece microstructure under different cutting methods is manifested in Figure 15. The microstructure of TC17 titanium alloy is woven into a basket shape by two interlaced arrangements phases. It includes original β grains with coarse strip-shaped and α phases with a fine needle or strip-shaped. 39 The changing state of the material microstructure is the same under the four processing methods, and the grains are observed elongation, bending and fracturing. Since milling is an intermittent machining process, a thin layer of metal below the cutting surface is not removed, but it is squeezed past the radius of the milling edge resulting in a large additional plastic deformation. 39 Subsequently, the flank of the milling tool continues to rub with the processed surface to generate frictional heat due to the elastic recovery, which caused the sheared deformation of the processed surface again. After extrusion and shear deformation, the lattice of the subsurface material is twisted, and the grains are elongated and broken. 40 The analysis illuminates that the plastic deformation layer depth is various in horizontal downward (HD), horizontal upward (HU), vertical downward (VD), and vertical upward (VU) milling orientation, which are 24 µm, 33 µm, 44 µm, and 34 µm, respectively. The plastic deformation layer depth obtained by vertical milling is larger than that by horizontal milling, and the maximum plastic deformation layer depth is obtained by vertical downward (VD) path of 44 µm. This is mainly because the milling force and milling temperature are large in vertical modes, measuring 224.24 N and 670°C, respectively. Moreover, the strong squeezing effect of the cutting force on the workpiece surface induces the material to reach the yield limit, which in turn causes tissue changes. In this process, the material also generates a lot of cutting heat attributable to deformation and friction. The temperature increasing makes the internal diffusion activation energy of the TC17 titanium alloy enhanced, and the material is easy to diffuse. However, the maximum temperature of milling titanium alloy is about 670°C (depicted in Figure 10) without reaching the phase transformation temperature of 897°C. 36 Therefore, the grains are only elongated, broken and bend under the effect of thermo-mechanical coupling.
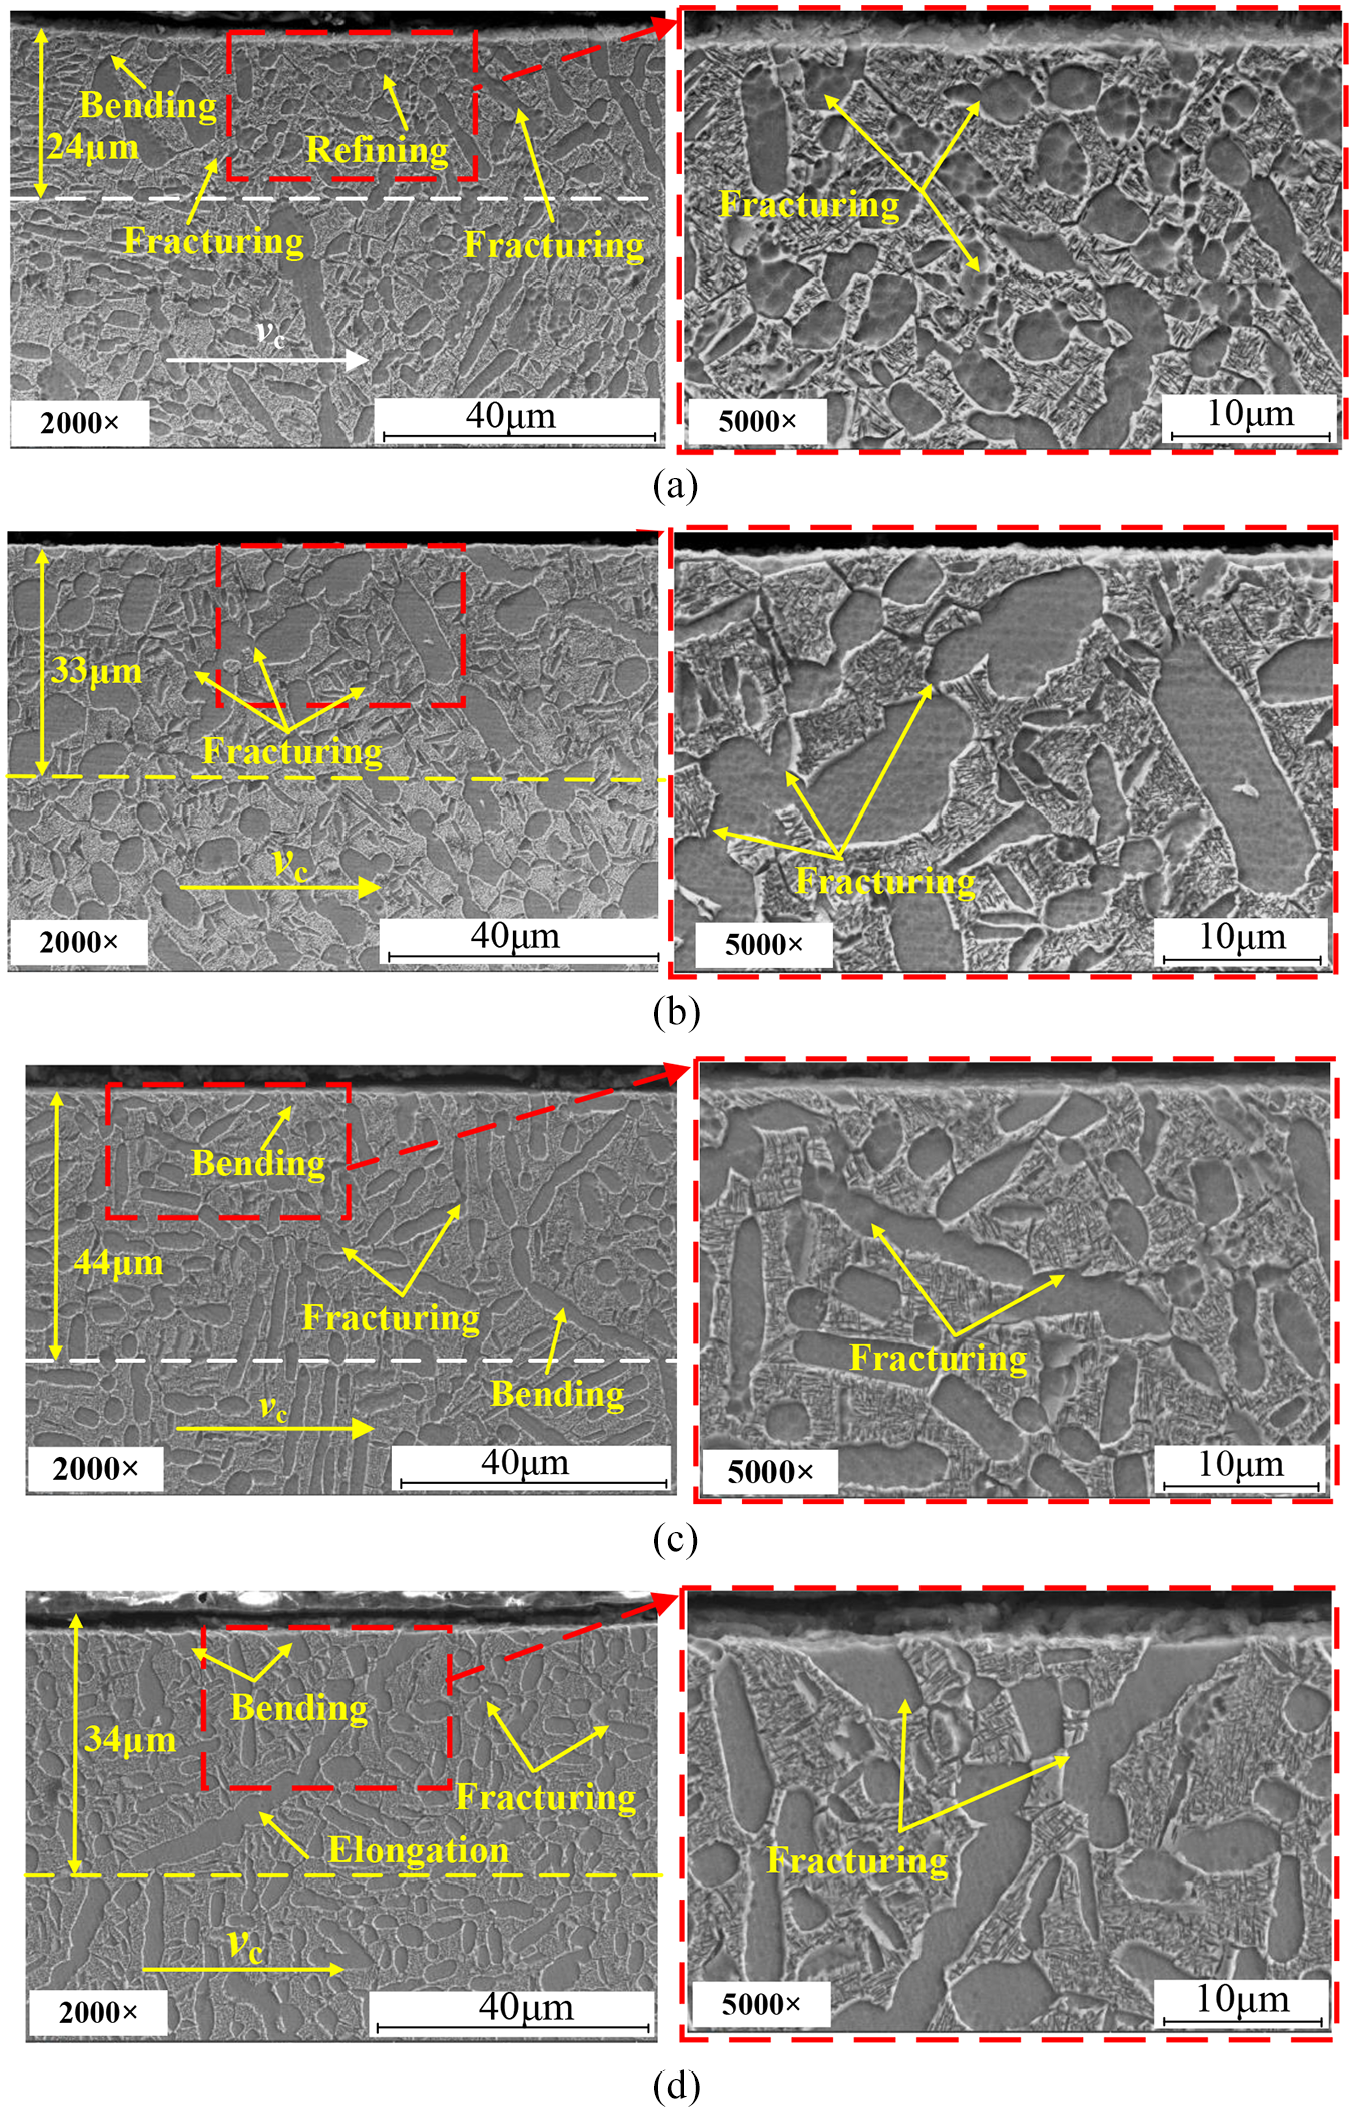
Microstructure in different milling paths: (a) horizontal downward, (b) horizontal upward, (c) vertical downward, and (d) vertical upward.
Conclusion
Through the 60° incline surface milling tests of TC17 in different milling paths, this paper analyses the changes in the milling force, temperature, surface characteristics, in-depth residual stress, microhardness distributions, and microstructure. The conclusion can be generalized as follows:
In horizontal downward(HD) and vertical upward(VU) modes, the cutting force increases slowly when the tool cuts into the workpiece, but decreases rapidly when it cuts out. The other two milling paths are just the opposite. It is vertical downward (VD) orientation that acquired the maximum cutting force (224.24 N) and temperature (672°C). While the minimum is achieved as 81.12 N and 493.946°C by horizontal downward (HD) path.
The largest surface roughness is observed by vertical downward (VD), in which Ra = 1.648 µm and Rz = 7.429 µm. While the smallest is discovered by vertical upward (VU), in which Ra = 1.128 µm and Rz = 6.336 µm. Regular basin features generated from shearing mechanism are exhibited under different orientations.
The maximum compressive residual stress in x direction is −393.4 MPa at a depth of 10 µm approximately, while it is almost −500 MPa at a depth of 5 µm in y direction under vertical downward (VD) mode. The compressive residual stress layers are 40 µm and 45 µm, respectively. The maximum residual stress of vertical upward (VU) and horizontal downward (HD) are located on the surface, and the residual stress layer depth in y direction is larger than x direction.
The microhardness is approximately stable in the horizontal orientation, while work hardening and finally tending to stabilize are detected in vertical profiles. Furthermore, the maximum microhardness of the vertical downward (VD) milling path can reach 390 HV0.025, and the hardening degree is 8.4%.
The plastic deformation layer depth which obtained by vertical milling is larger than that by horizontal milling, and the maximum plastic deformation layer depth is obtained by vertical downward (VD) milling path of 44 µm.
The optimal cutting condition is vertical downward (VD), based on the surface integrity output results obtained in four different milling paths.
Footnotes
Appendix 1
Declaration of conflicting interests
The author(s) declared no potential conflicts of interest with respect to the research, authorship, and/or publication of this article.
Funding
The author(s) disclosed receipt of the following financial support for the research, authorship, and/or publication of this article: This work was supported by the National Natural Science Foundation of China [grant number 91860206, 51875472], the Fundamental Research Funds for the Central Universities [grant number 31020200502002], the National Science and Technology Major Project [grant number 2017-VII-0001-0094], and the Natural Science Basic Research Plan in Shaanxi Province of China [grant number 2020JQ-186].