
Abstract
It is known that adequate knowledge of the sensitivity of acoustic emission signal parameters to various experimental parameters is indispensable. According to the review of the literature, a lack of knowledge was noticeable concerning the behavior of acoustic emission parameters under a broad range of machining parameters. This becomes more visible in milling operations that include sophisticated chip formation morphology and significant interaction effects and directional pressures and forces. To remedy the aforementioned lack of knowledge, the effect of the variation of cutting parameters on the time and frequency features of acoustic emission signals, extracted and computed from the milling operation, needs to be investigated in a wide aspect. The objective of this study is to investigate the effects of cutting parameters including the feed rate, cutting speed, depth of cut, material properties, as well as cutting tool coating/insert nose radius on computed acoustic emission signals featured in the frequency domain. Similar studies on time-domain signal features were already conducted. To conduct appropriate signal processing and feature extraction, a signal segmentation and processing approach is proposed based on dividing the recorded acoustic emission signals into three sections with specific signal durations associated with cutting tool movement within the work part. To define the sensitive acoustic emission parameters to the variation of cutting parameters, advanced signal processing and statistical approaches were used. Despite the time features of acoustic emission signals, frequency domain acoustic emission parameters seem to be insensitive to the variation of cutting parameters. Moreover, cutting factors governing the effectiveness of acoustic emission signal parameters are hinted. Among these, the cutting speed and feed rate seem to have the most noticeable effects on the variation of time–frequency domain acoustic emission signal information, respectively. The outcomes of this work, along with recently completed works in the time domain, can be integrated into advanced classification and artificial intelligence approaches for numerous applications, including real-time machining process monitoring.
Introduction
Acoustic emission (AE) is a terminology used for the generation of transient elastic waves through the quick release of energy from one or more sources (e.g. plastic deformation and crack generation) when a material is stressed. 1 In the past decades, primary research works on AE sources created a considerable amount of interest, which eventually led to the rapid evolution of techniques and instruments used for the characterization of AE behavior in many materials. 2 In the 1970s, AE was more commonly acknowledged for its exceptional abilities as a widely used non-destructive testing (NDT) method in various industrial applications, including monitoring dynamic processes, while its applications have been daily increased in numerous industrial sectors. Later, during the 1980s, the rapid developments in computers led to a vital and influential revolution in both instrumentation and data analysis tools. 3 In recent years, the technology of AE as applied to NDT is adequately recognized, and robust AE systems are commercially available. 1 AE has a unique capability to simultaneously monitor an entire structure often with no system stoppage required. This would provide significant benefits in comparison with other NDT techniques, such as ultrasonic. Applications of AE for NDT purposes are reported in numerous industries, including pipelines, healthcare, power generation, aircraft, offshore, oil platforms, paper mills, and structures (bridges, cranes, etc.). As stated in Govekar et al., 4 one of the initial works on AE applications in tool condition monitoring was reported in the 1970s in Japan, where the sound emitted by a cutting tool during machining aluminum alloys was analyzed. It was observed that the spectrum of audible frequency is discrete, while the range of AE signal is continuous. Thenceforth, the capability of AE sensors to monitor and detect various machining attributes including tool wear, minimum uncut chip thickness, surface quality and roughness, precision shaping, cutting energy assumption, tool breakage, chatter vibration, chip tangling, and tool life has been investigated.5–18 Iwata and Moriwaki 8 were the first to use AE signal information to assess the tool wear mode in the cutting process. They stated that the AE power increases up to 350 kHz with tool wear, and then saturation is achieved. In this condition, the AE count was closely related to tool wear. Following the reported work in Iwata and Moriwaki, 8 further attempts were focused on developing advanced indirect methods for monitoring cutting processes. Currently, a significant portion of research works in the AE technology field is focused on the intelligent control of tools and systems.19–23 This could be attributed to the high sensitivity of AE signals to tool wear and/or breakage that itself highly varies concerning the variation in signal strength. According to some studies,6,24 the capability of AE for tool condition monitoring and tool wear detection is more prominent than that observed when using vibration and environmental signals. This could be attributed to the higher frequency range of AE sensors as compared to other commercial sensors utilized in condition monitoring and NDT applications. 24 It was shown in some studies that AE can be widely used in machining and micromechanical process monitoring with high precision along with other sensors and modeling approaches.13,23,25–27 However, the proper use of AE signals requires an adequate understanding of the signal behavior under different mechanical and physical conditions. As it is believed by XiaoQi et al., 6 the behavior of recorded AE signals from machining operations is highly relevant to multiple direct and indirect factors, including the cutting parameters, cutting tool, and work part properties. Moreover, the sensitive time series and frequency domain AE parameters under different experimental levels must be identified. This could be revealed that, under different machining conditions, the effective values of time–frequency domain AE signal parameters may vary when tool wear progresses, thus affecting the machining performance. 9
Despite the extensive utilization of the AE technique for condition monitoring and control of variegated machining, micromechanical, and industrial processes, a lack of knowledge is still noticeable concerning the sensitivity of time–frequency features of AE parameters to a broad range of machining parameters. This becomes more apparent when dealing with milling operations that contain sophisticated chip formation modes and substantial interaction effects and pressures in several directions. To remedy the aforementioned lack of knowledge, the influence of the broad range of cutting parameters on AE signal parameters featured in time and frequency domains needs to be investigated. Part A of this article investigated the sensitivity of time series AE parameters to the variation of machining parameters and governing cutting factors on time series AE signals. Based on the results of part A, several time series AE parameters are sensitive to the variation of (a) cutting speed, (b) feed rate, and (c) depth of cut. The main goal of this article, part B, is therefore focused on presenting the cutting factors governing the variation of AE signal parameters featured in the frequency domain and also determining the frequency features of AE signals which are sensitive to the variation of machining conditions when milling aeronautical aluminum alloys. To that end, an advanced methodology is proposed based on AE signal segmentation, advanced signal processing, and statistical analysis. The stability of dynamic processes and tool vibration, deviations in AE signals, and background noise were carefully evaluated and controlled. In section “AE signal,” the theoretical background of AE is presented. The experimental set-up is described in section “Experimental procedures.” The research methodology is comprehensively discussed in section “Research methodology.” Section “Results and discussion” is devoted to results and discussion. Finally, the article is concluded in section “Conclusion.”
AE signal
Definition and sources of AE
As mentioned above, AE is referred to the produced elastic wave inside a specimen, subjected to applied stress. 28 The primary sources of AE in metals are plastic deformation and crack generation. Each model of AE generation, as noted earlier, may lead to energy dissipation, presented as an AE event (Figure 1), which takes in general no longer than a millisecond. Most of the relevant parameters to AE are AE sensor/receiver, AE signal, AE characteristics, AE waveguide, background noise, coupling, and machine tool. As noted earlier, AE signals are appeared as elastic waves with high frequency range of 100–1000 kHz. To detect the generated waves and convert the dissipated energy into an electrical signal, piezoelectric sensors are commonly used.
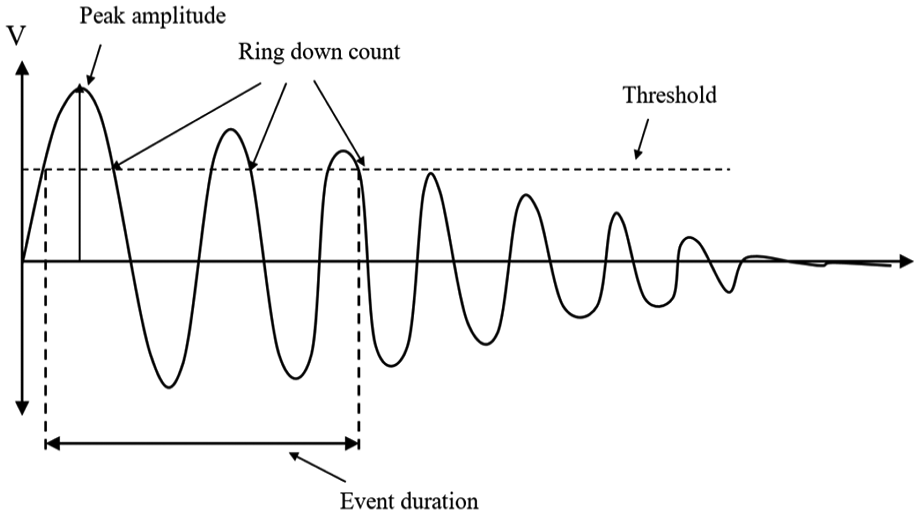
AE signal attributes. 2
Sources of the AE signal
Extensive research works were conducted to determine the sources of AE in deformed/machined materials.28–32 As pointed out in Liang and Dornfeld, 28 the vital sources of AE in the metal cutting process are (a) plastic deformation in the work part as a result of the cutting process; (b) plastic deformation that occurs in the chip; (c) frictional contact between the tool flank face and the work part, resulting in flank wear; (d) frictional contact between the tool rake face and chip, leading to crater wear; (e) chip breakage; (f) tool fracture; and (g) collisions between chip and tool chip breakage. The extracted AE signals from the metal cutting process are generally presented as continuous and transient (burst) signals, 32 which have distinctly different features. Continuous signals result from shear deformation, as well as the wear on the rake and flank sides of the cutting tools, while the tool fracture and chip breakage are considered as the sources of burst or transient signals. Thus, it can be inferred that continuous AE signals are generated from sources (a)–(d), while transient AE signals (Figure 2) are generated from processes (e)–(g).
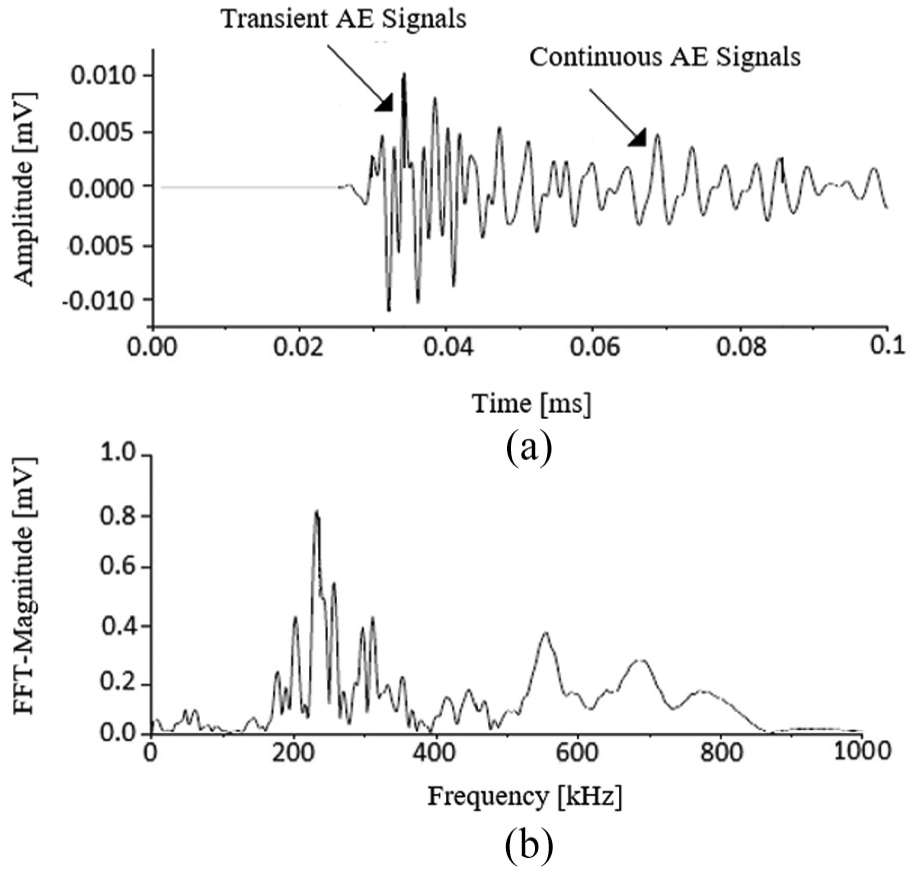
Examples of AE signal features in (a) time and (b) frequency domains.
AE parameters
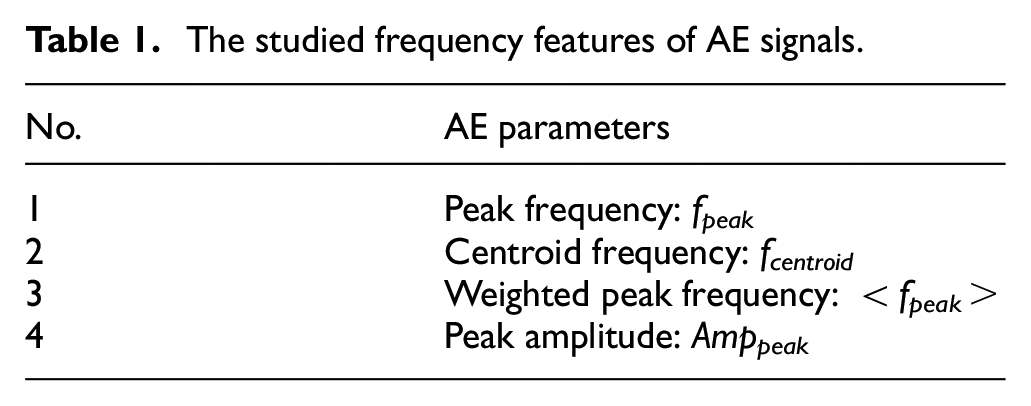
Several parameters can be computed from AE signals in time and frequency domains. Table 1 lists the extracted frequency domain AE signal parameters. The related formulas are presented in Appendix 1. The investigation on the wavelet domain analysis of AE signals is the subject of forthcoming articles.
The studied frequency features of AE signals.
Experimental procedures
Experimental plan
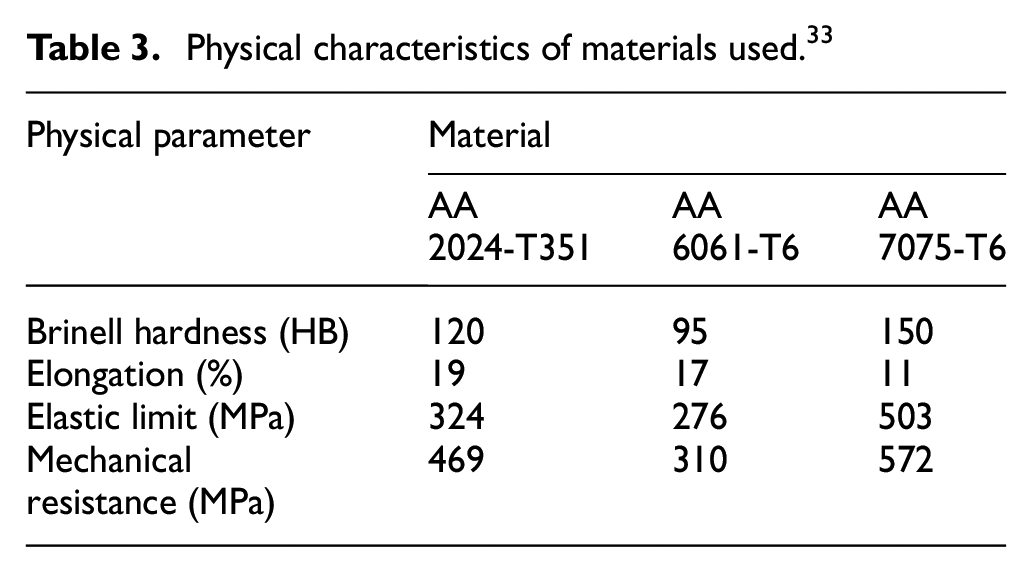
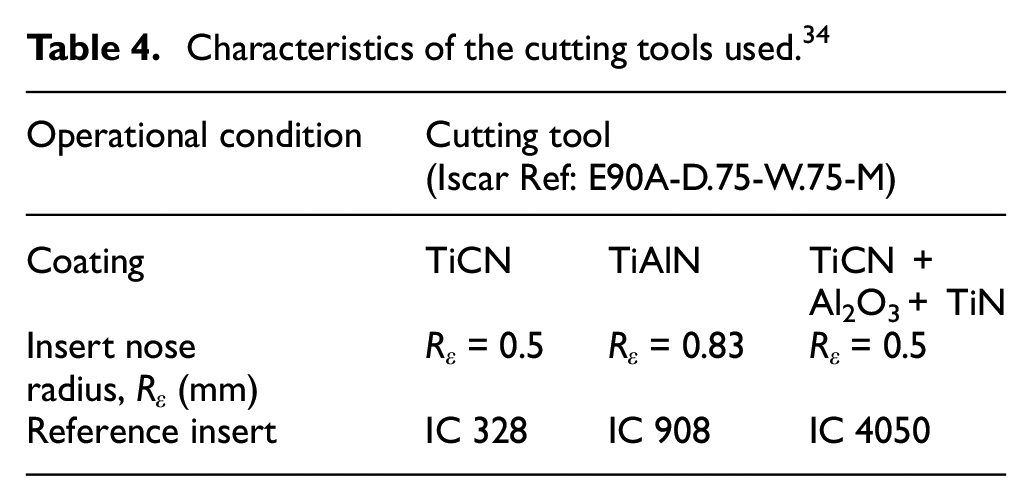
The experimental plan used in this work is the multilevel full-factorial design of experiment. Table 2 presents the experimental factors and their levels used. In total, 162 (34× 21) tests were conducted on a three-axis computer numerical control (CNC) machine (power: 50 kW, speed: 28,000 r/min; torque: 50 N m) using the process variables listed in Table 2. The research methodology, including signal processing and result analysis approaches, is presented in the next section. The stability of the cutting process, machine and tool vibration, and dynamic behavior were carefully controlled in preliminary tests. Using the rigid tool and workpiece fixtures, a negligible deflection was observed in the cutting tool and workpiece. To avoid possible deviations in AE signals that might occur due to tool wear, a new insert was used after each cutting test. Moreover, to examine background noise, one AE sensor was placed 2 m away from the chip formation zone. A high signal-to-noise ratio (SNR) between the first and second sensors confirms the poor effects of background noise on the signal accuracy recorded from the first sensor placed adjacent to the chip formation zone. The characteristics of the work parts and cutting tools used are presented in Tables 3 and 4, respectively.
Cutting parameters and their levels used.
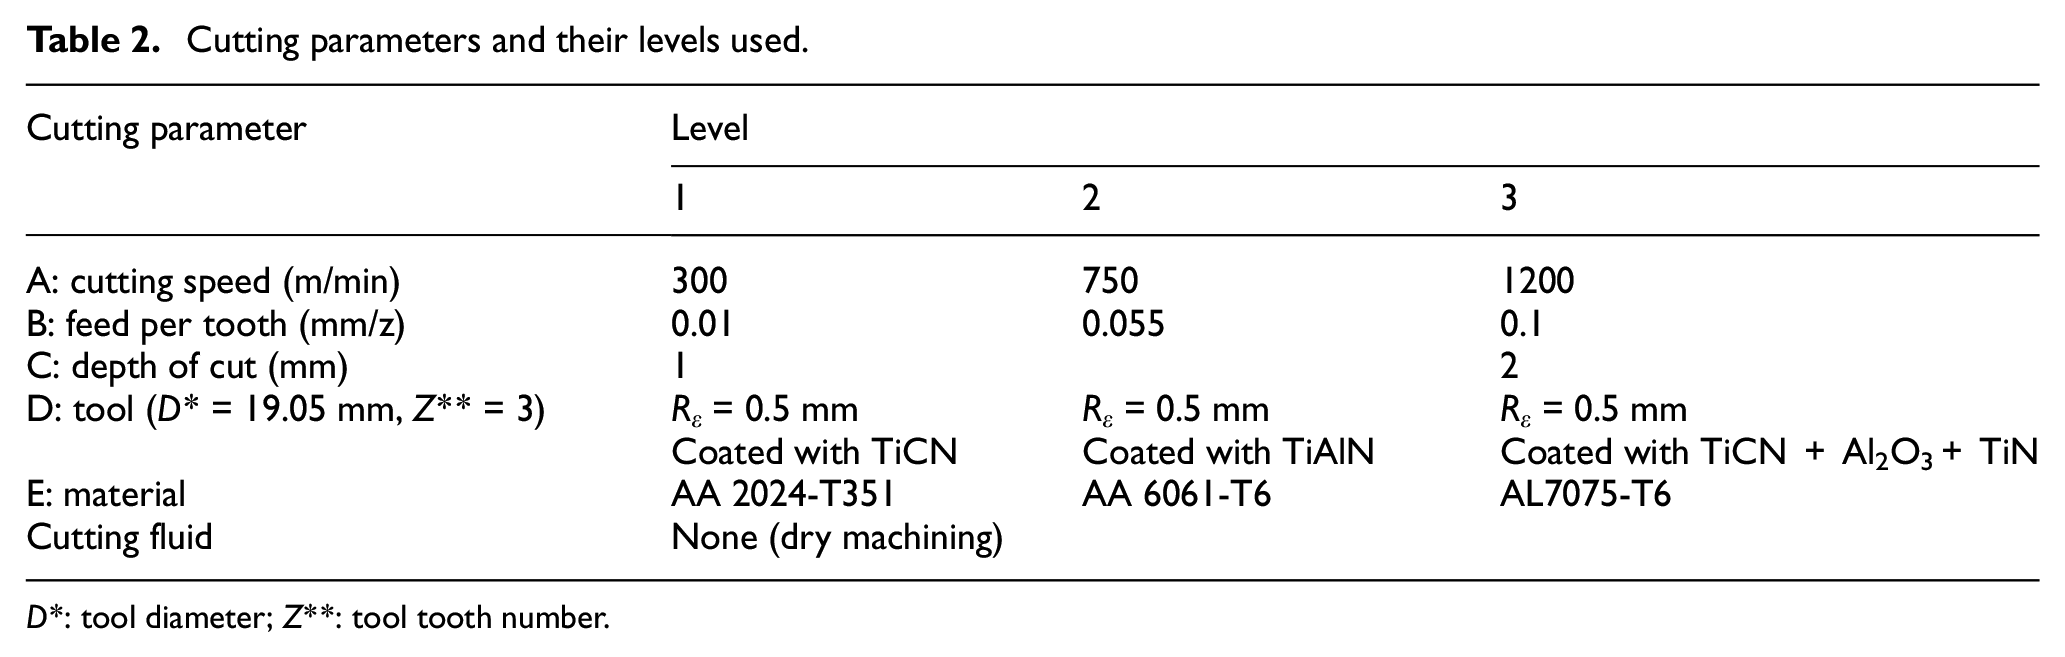
D*: tool diameter; Z**: tool tooth number.
Physical characteristics of materials used. 33
Characteristics of the cutting tools used. 34
AE signal monitoring system
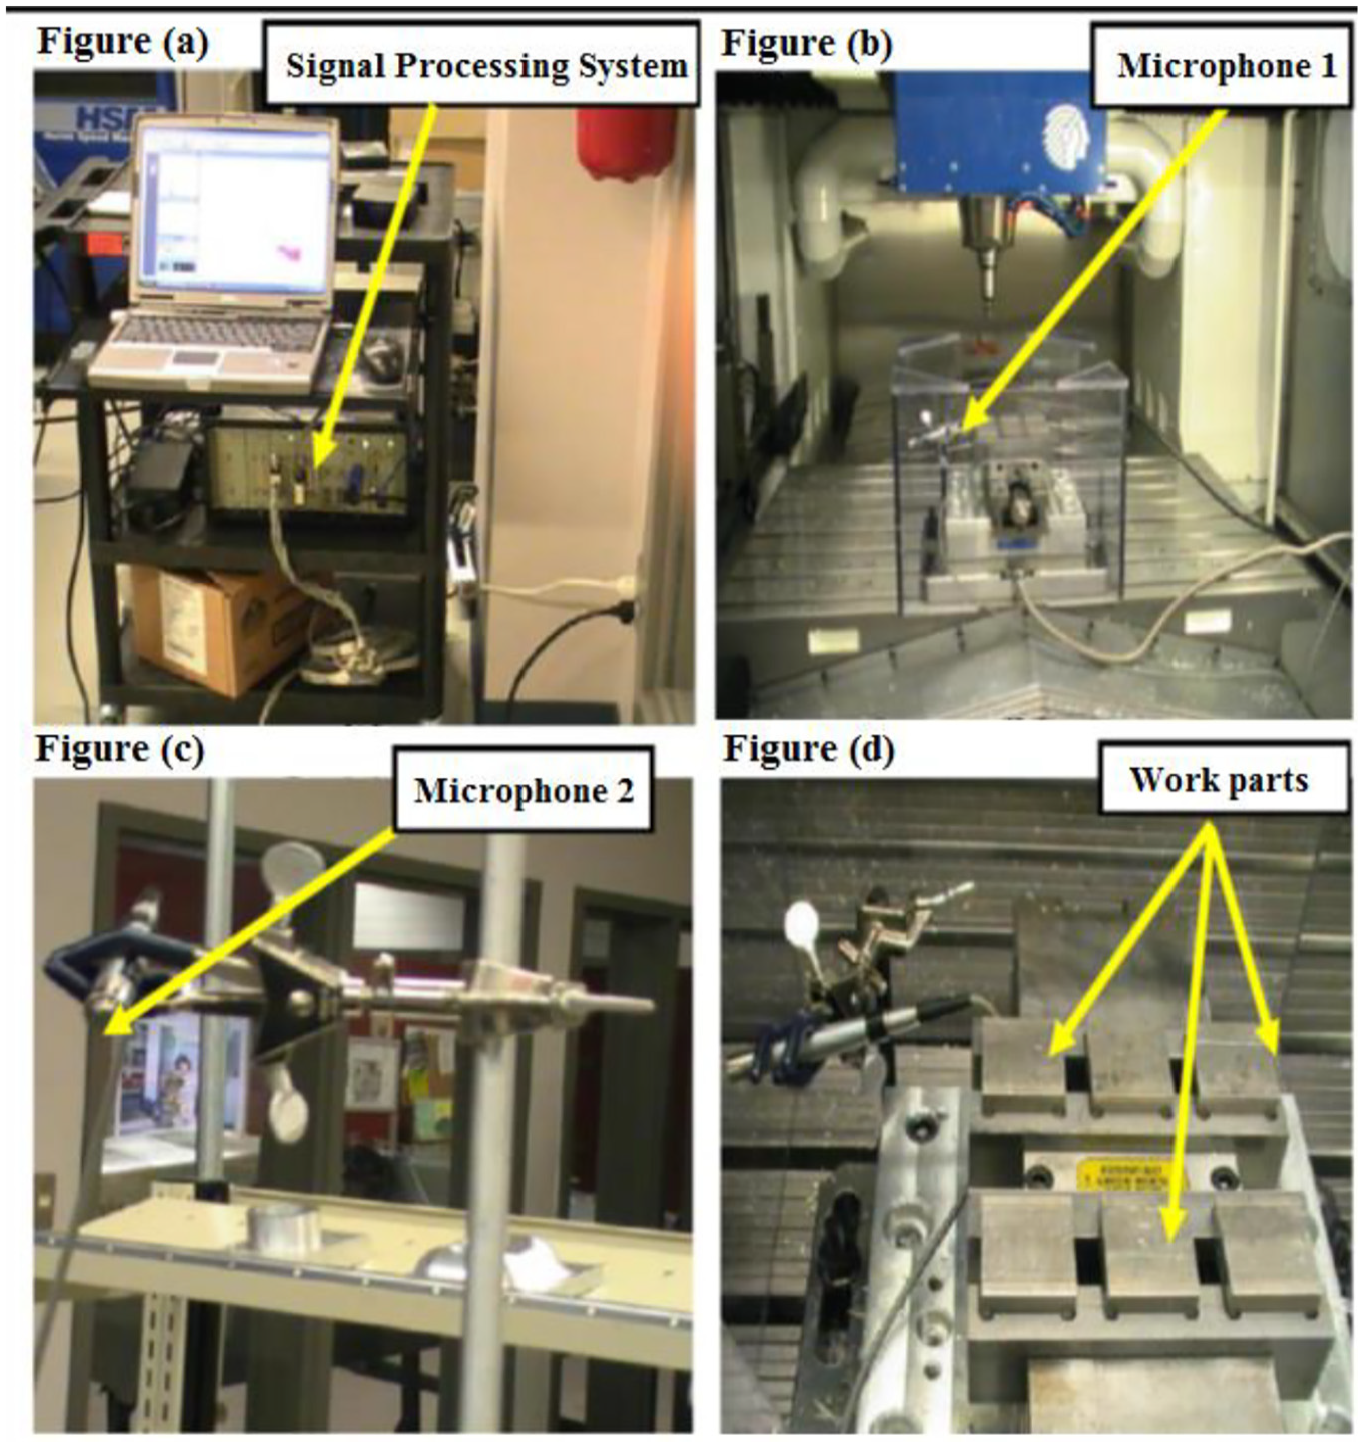
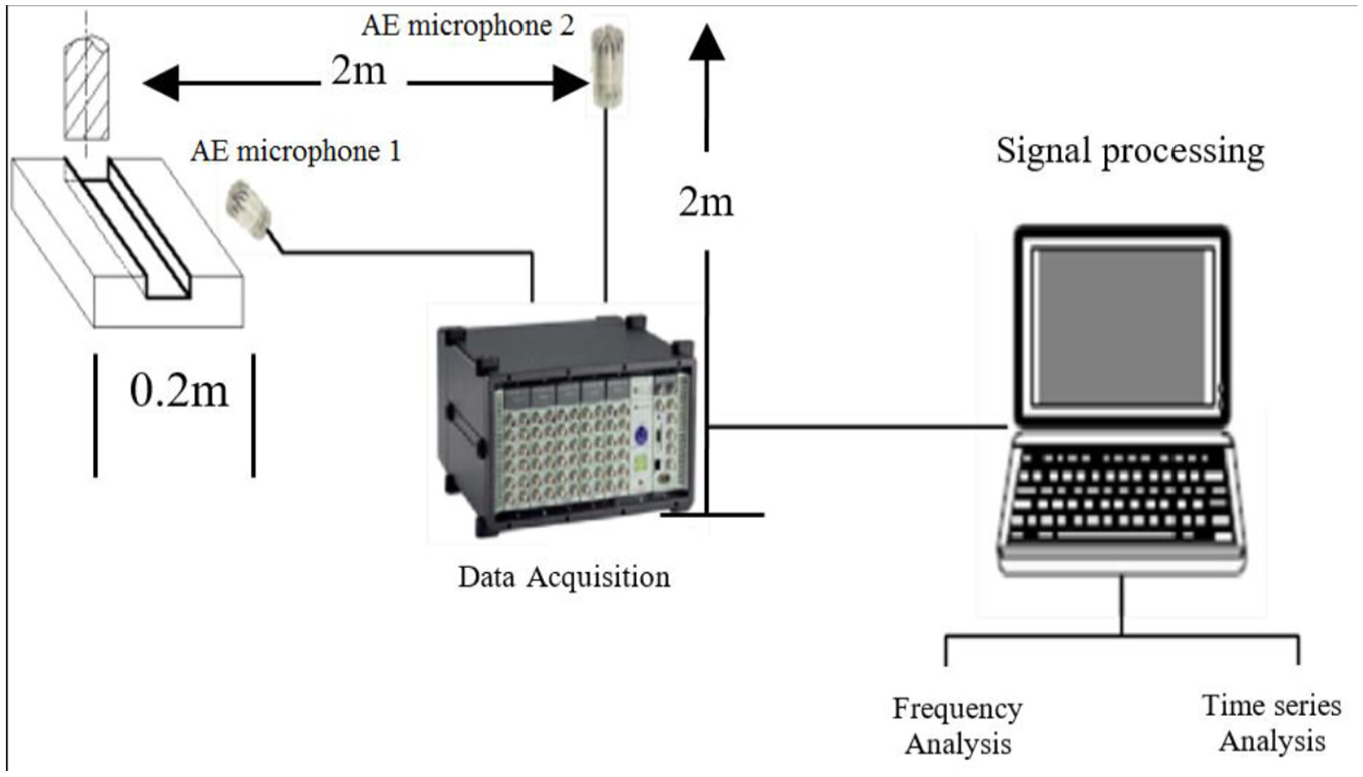
According to Figure 3, the AE data acquisition system used in this study consisted of two AE TEDS microphones. Figure 3(b) presents the implemented microphone (ref: 2564023) installed at a very close distance to the machining area, and Figure 3(c) shows the second microphone (ref: 2564024) placed 2 m away from the chip formation zone along with a data preprocessing unit (Figure 4). The second sensor is used to track the background noise. Figure 3(d) displays the work part arrangement during machining tests. Once the experimental system in Figure 3 was implemented, the microphones were first calibrated with a 10,000 ± 100 Hz signal to ensure their reliability and measurement capabilities.
AE acquisition system.
Applied AE measurement system in the milling operation.
Research methodology
To acquire more significant results concerning various machining modes, the recorded AE signals were divided into three sections (Figure 5) associated with the cutting tool progress in the work part. The first stage describes the entry signal that is related to the cutting tool entrance into the work part (Figure 5(a)). The second section is focused on the cutting stage (Figure 5(b)), while the third section is devoted to the period that the cutting tool leaves the work part (Figure 5(c)).
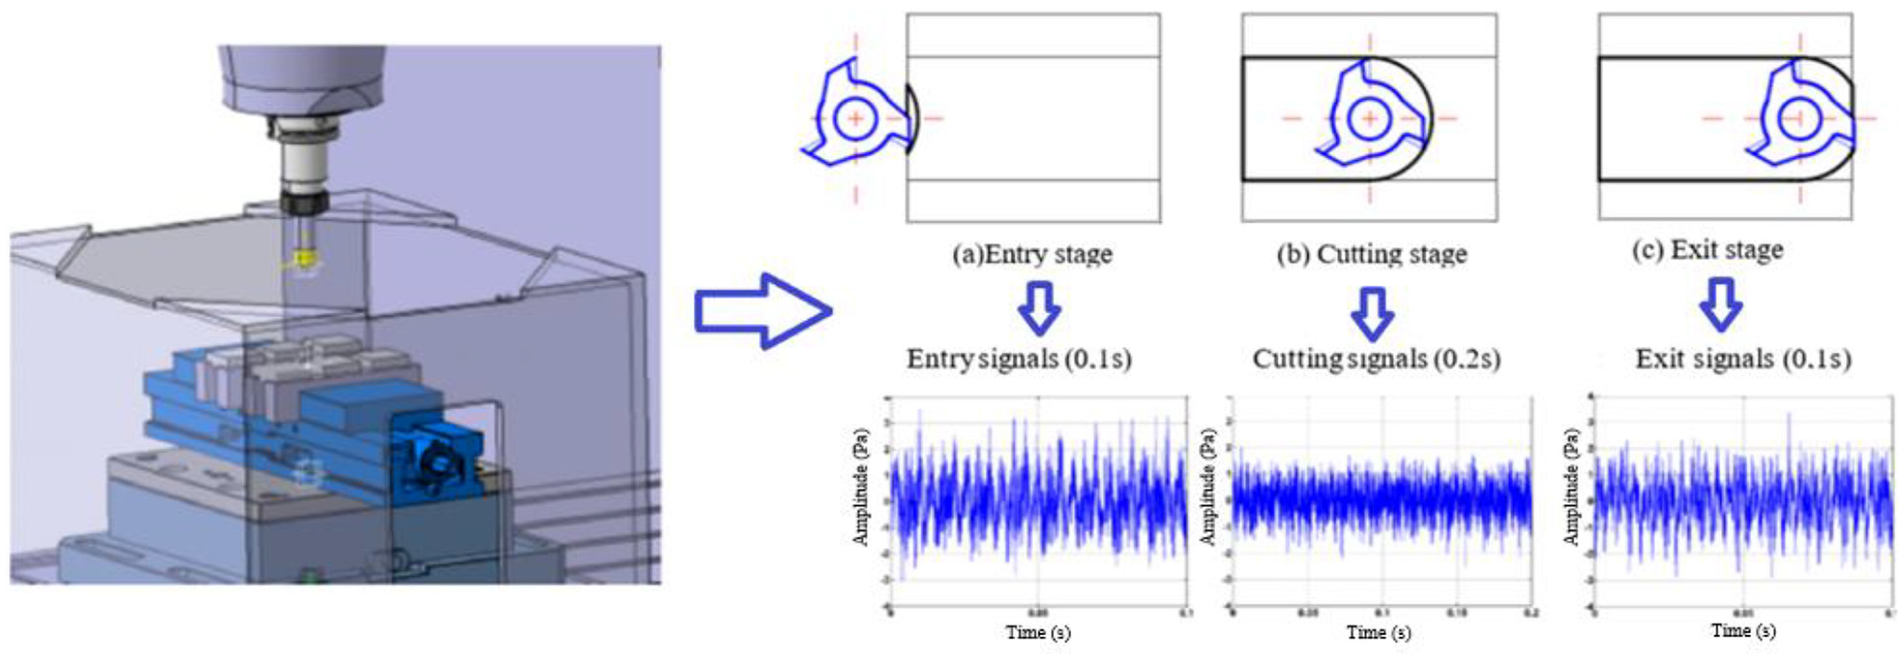
Schematic of the breakdown of recorded AE signals.
To complete this study, the following research strategy is proposed (Figure 6):
Data acquisition using AE sensors (fs = 100 kHz) placed near the chip formation zone and a three-axis dynamometer (Kistler-9255B; fs = 48 kHz) for cutting force measurements (Figure 4);
AE signal, x(t) extraction in each cutting trial concerning the cutting tool progress and exit from machined parts (Figure 5);
Converting time-domain data (x(t)) into frequency domain data (U(f)) using fast Fourier transform (FFT) analysis;
Signal processing of AE signals (four AE parameters) extracted from each cutting stage in the frequency domain;
Feature extraction based on statistical analysis on recorded results to determine the governing machining parameters on AE signal parameters;
Listing the most statistically sensitive frequency features of AE signals and the cutting parameters used.
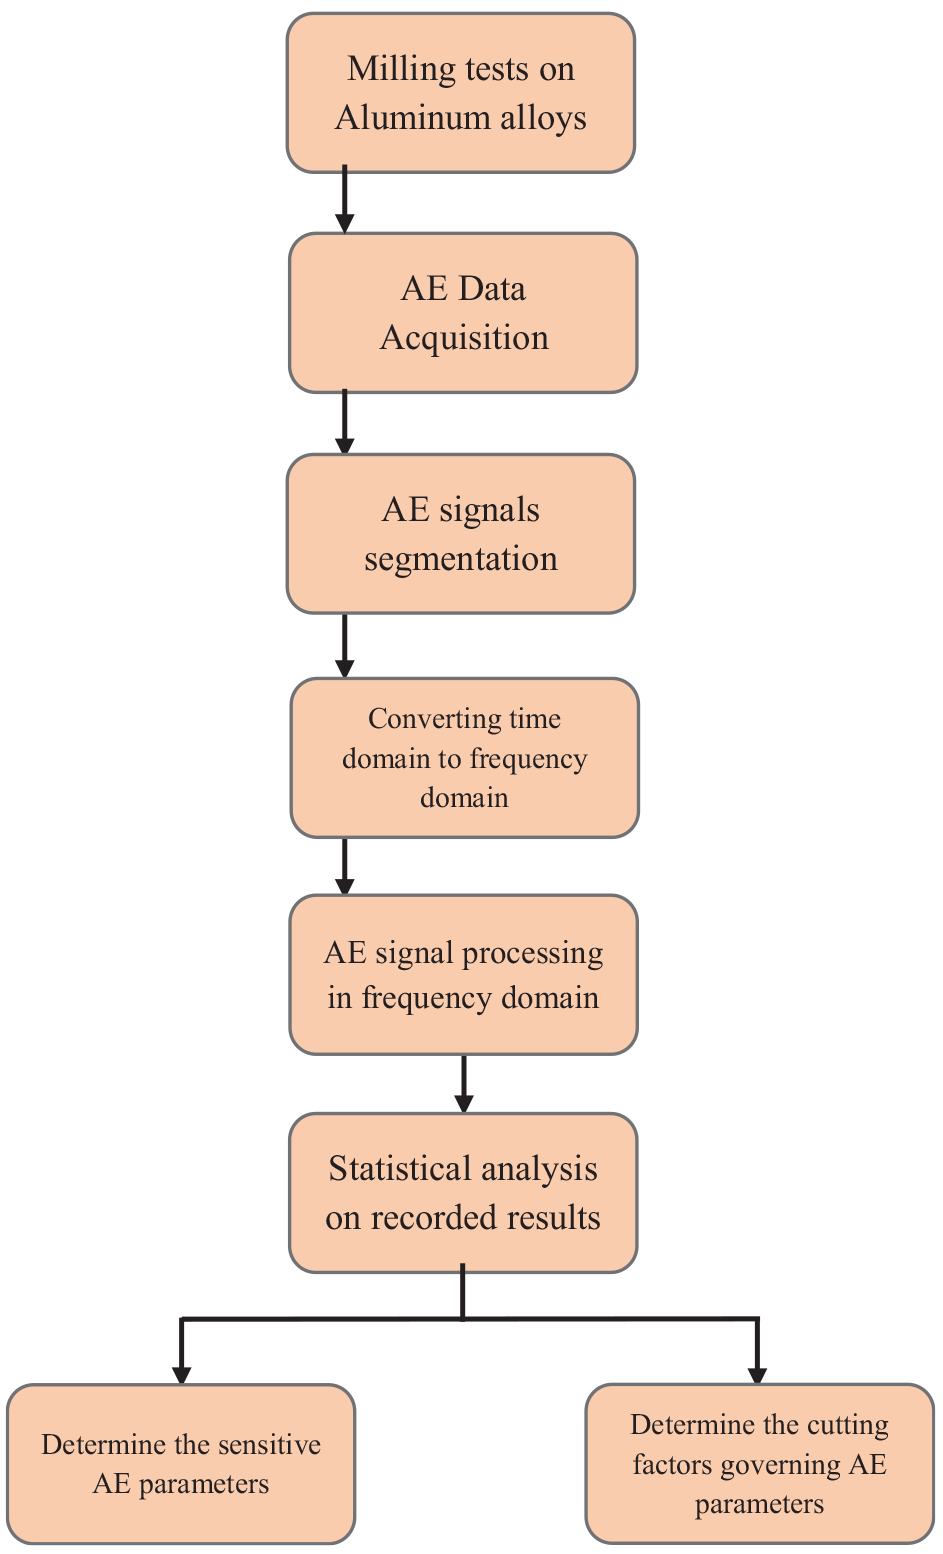
Scheme of the proposed methodology.
The significant and insignificant variables and models are identified using statistical parameters, including p value, R2, and
As previously noted in Songmene and his colleagues,35–38 machining aluminum alloys is associated with a certain amount of difficulties including burr formation, built-up edge (BUE), and work part adhesion to the cutting tool. Therefore, to decrease the risk of the aforementioned issues and avoid harmful effects into the experimental set-up and recorded results, the following assumptions were proposed:
Based on preliminary experimental tests, the stability of the machining process was evaluated. The cutting tool and fixture were found free of deflection. Also, no chatter vibration was observed in machining tests.
To reduce the risk of deviation on experimental results and improve the accuracy of the cutting process, new inserts were employed in each cutting test.
Method of analysis
To evaluate the effects of cutting parameters on the computed values of AE parameters, the following experimental techniques and settings were used. A complete overview of the statistical terms used is presented in Phadke: 39
Analysis of variance
The analysis of variance (ANOVA) examines the effects of experimental parameters (controllable) and their combined effects at 95% confidence interval (CI).
The coefficient of determination (R2) presents the degree of variability of the observed response as a function of controllable parameters and their interactions. R2 > 0.75 indicates that the anticipated model is sensitive to the variation of experimental parameters, while, if R2 < 0.75, the predicted models are considered unresponsive to the variation of experimental parameters.
p value is used to determine if each individual experimental variable, as well as the presented model in either second-order degree, linear or two-factor interactions, is either significant, moderately significant, or insignificant. To that end, the following assessment criteria are used: p value > 0.10—the experimental variable/model is insignificant; 0.05 ≤p value ≤ 0.10—the experimental variable/model is moderately significant; p value < 0.05—the experimental variable/model is significant.
Pareto chart
This chart applies the statistical analysis to demonstrate the distinction of the main and interaction effects between the experimental parameters and their combined effects on the responses by means of decreasing contribution.
The significant and insignificant variables were identified using statistical parameters, including p value, R2, and
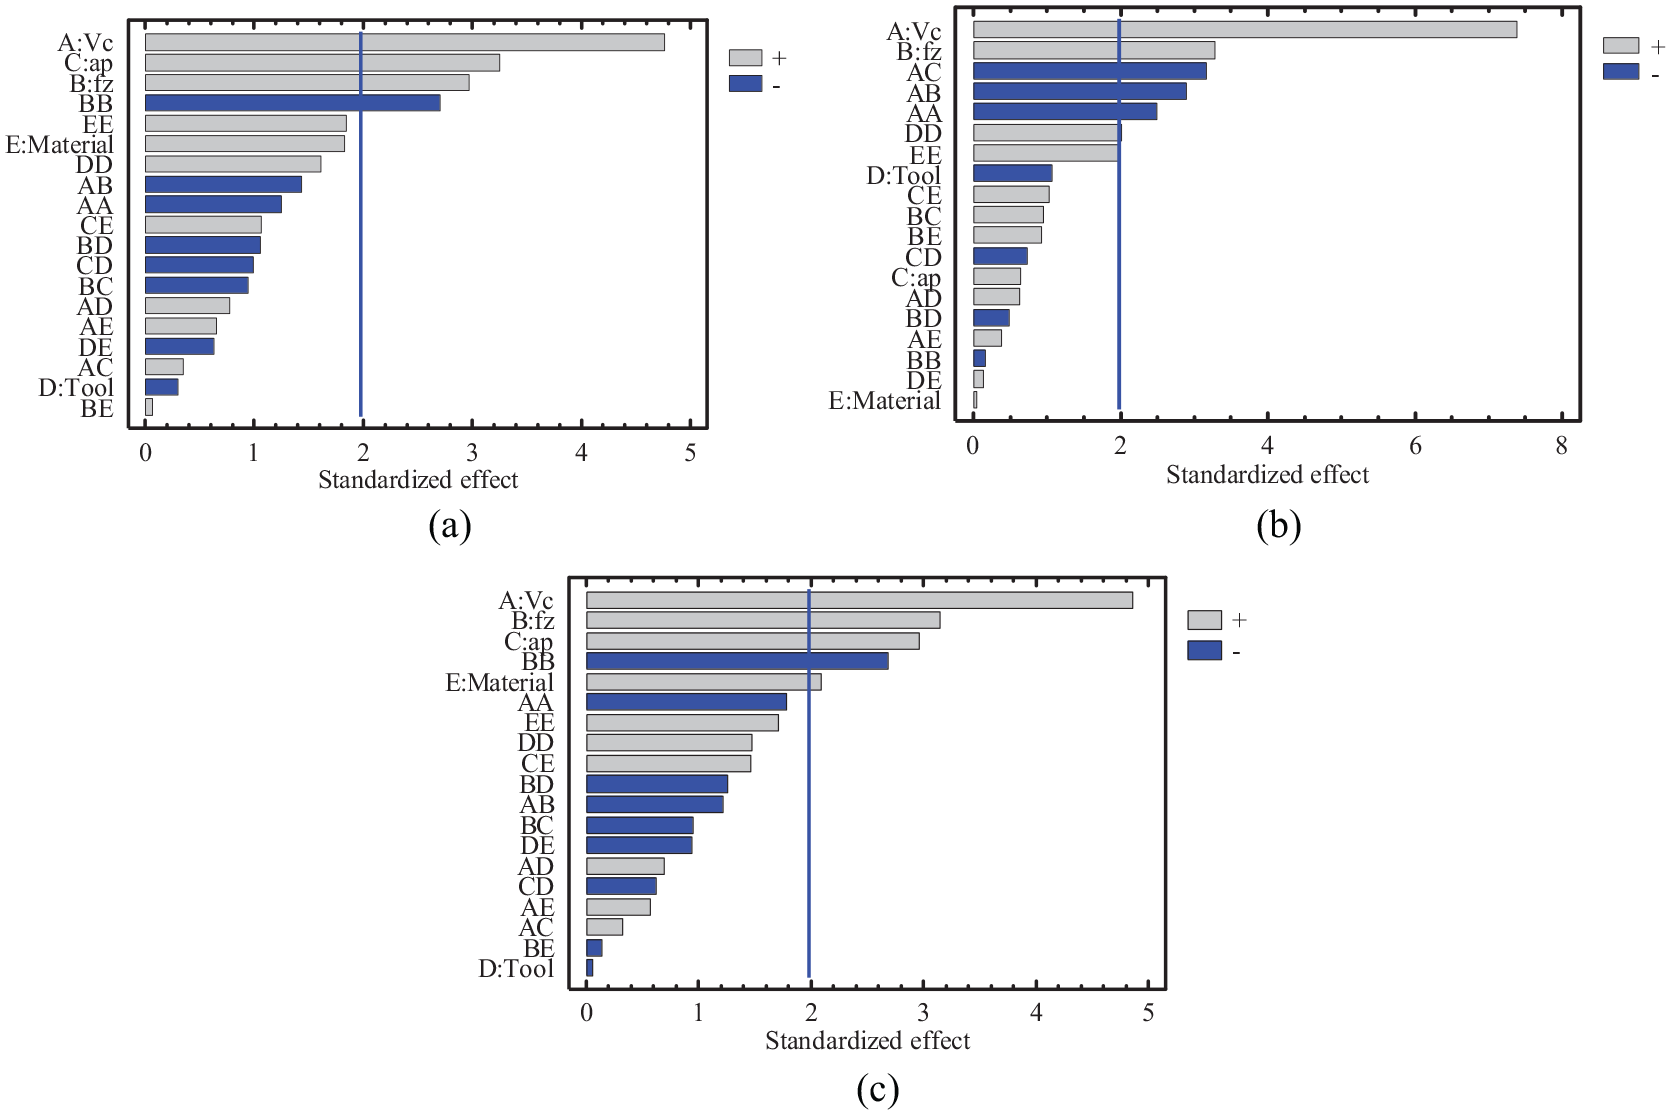
Standardized Pareto chart for Amppeak: (a) entry stage, (b) cutting stage, and (c) exit stage.
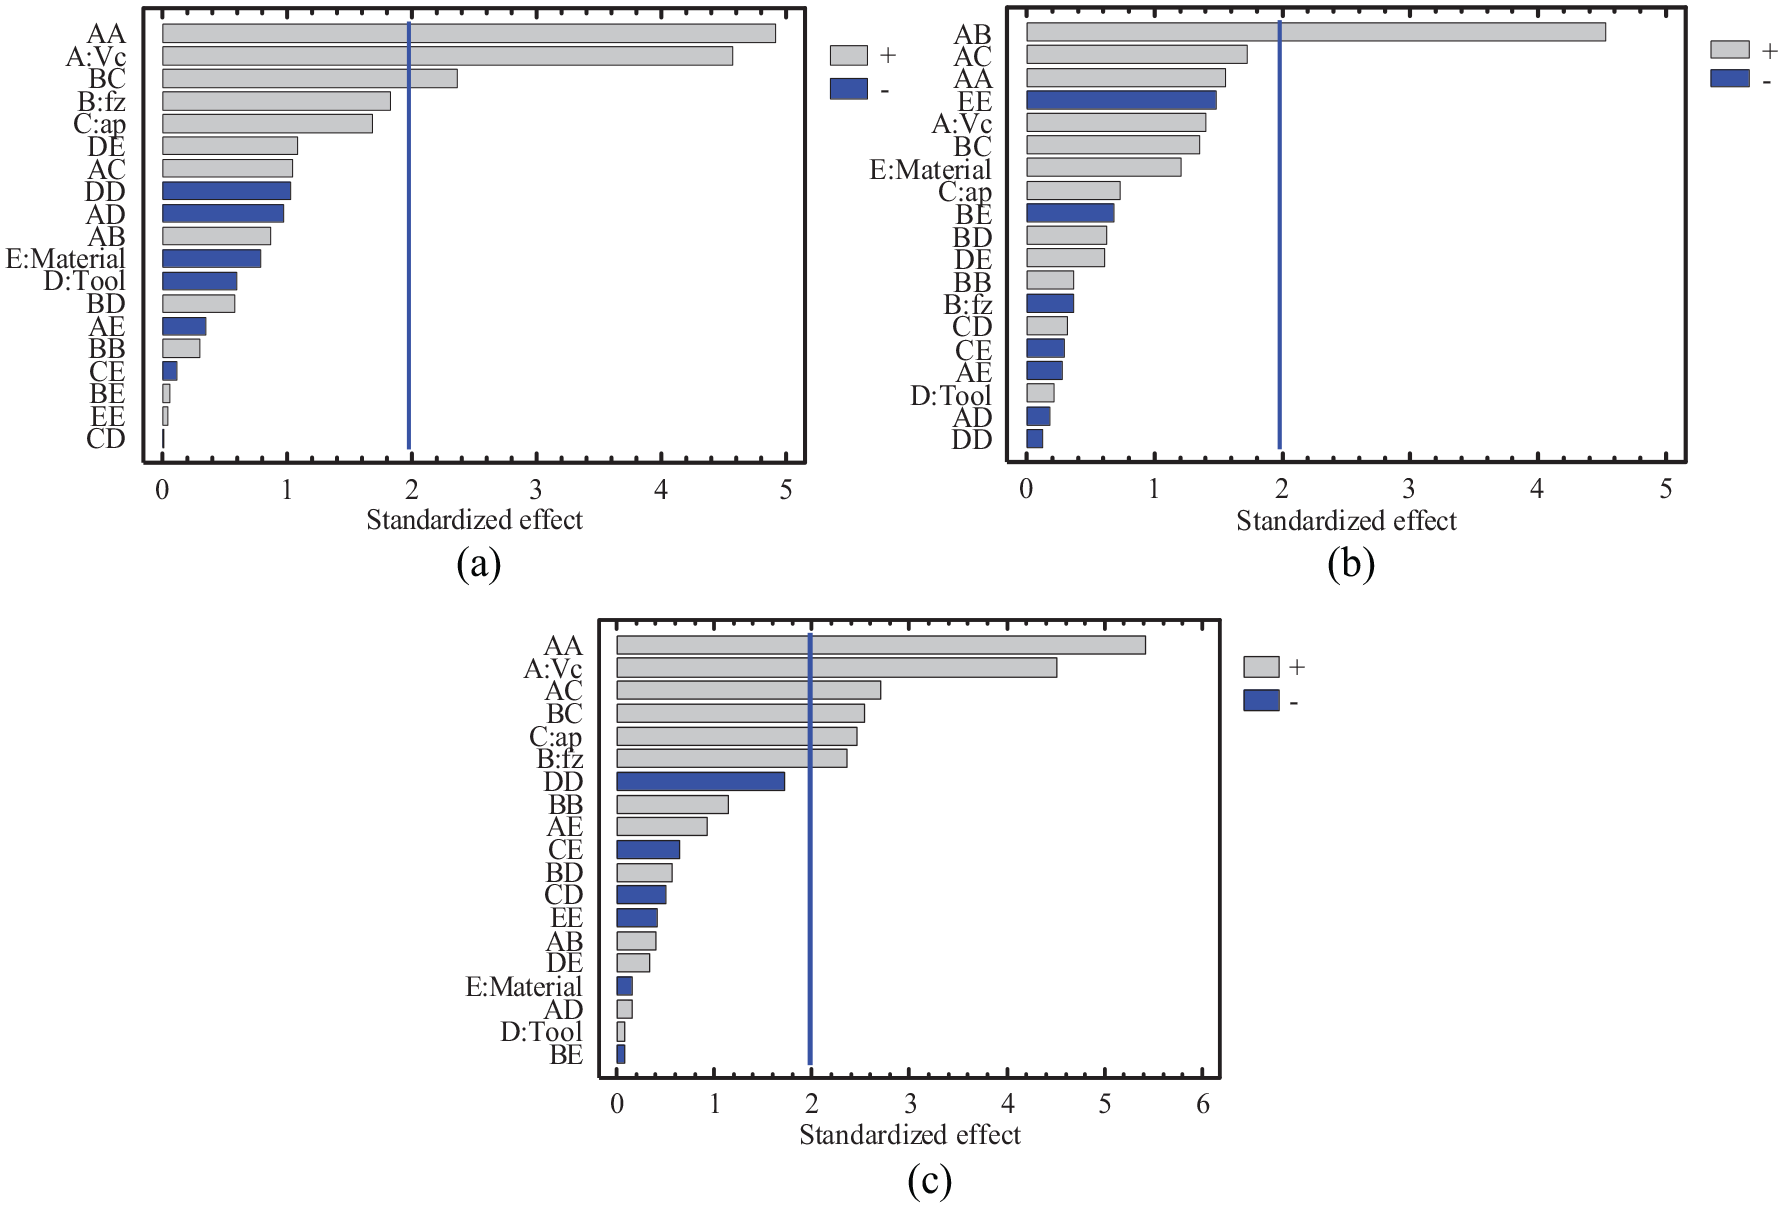
Standardized Pareto chart for <fpeak>: (a) entry stage, (b) cutting stage, and (c) exit stage.
Results and discussion
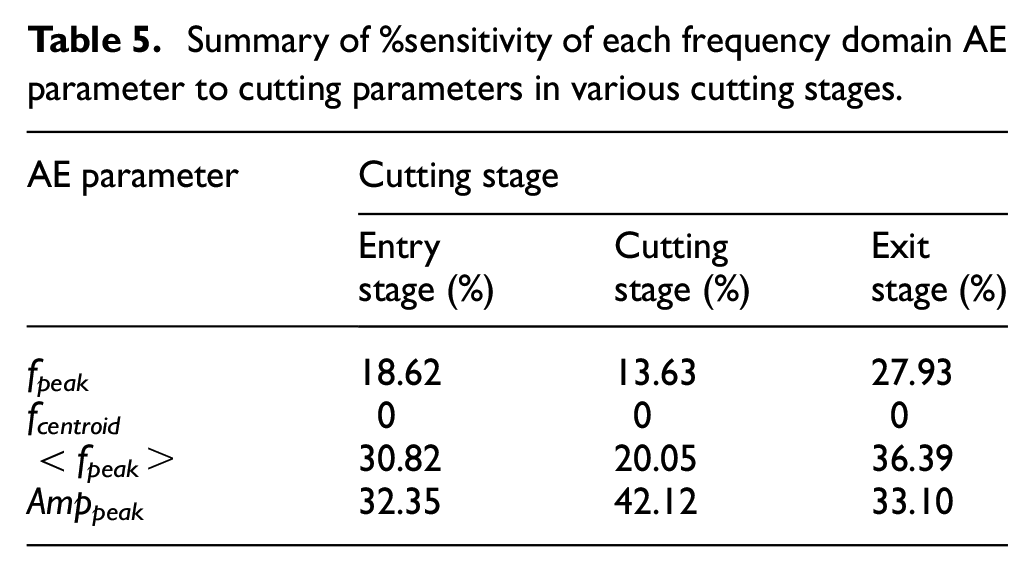
Upon using signal processing and feature selection strategies noted in Figure 6, the sensitivity of frequency domain AE signal parameters to the variation of tested cutting parameters was evaluated using statistical approaches as mentioned above. To that end, the effects of cutting parameters on the computed values of AE signal parameters featured in the frequency domain were presented in second-order degree models. Table 5 shows the coefficient of determination (R2) of the extracted AE parameters and Table 6–8 present the relative effectiveness of each cutting parameter on the computed responses., Table 5 denotes that, regardless of the cutting stage studied, the frequency features of AE signals are not sensitive to the variation of cutting parameters. In other words, the variability of frequency domain features to the variation of cutting parameters is lower than 75%. In this case, they cannot be considered a statistically significant response. It is noticeable that, among the insensitive AE parameters, Amppeak and <fpeak> are the ones with the highest values of R2 in comparison with other AE parameters. Figures 7 and 8 illustrate the Pareto charts of Amppeak and <fpeak> (with the highest values of R2) in three corresponding stages. Based on the presented charts, regardless of the cutting stage investigated, Amppeak is highly controlled with the variation of the cutting speed (A), feed per tooth (B), and depth of cut (C). Higher levels of cutting speed, feed per tooth, and depth of cut led to higher levels of Amppeak, with the most effects belonging to cutting speed (Vc). This observation can also be referred to the statement made in Dornfeld 40 that the generation of AE signals in most cutting operations is likely related to the consumed energy level and material removal rate (MRR). It is observable that depth of cut (ap) is not a governing factor on maximum amplitude at the cutting stage. Other governing factors on Amppeak are the interaction effects between feed per tooth (BB) for both entry and exit stages, while for the cutting stage the next governing factors are the interaction effects between cutting speed and depth of cut (AC), cutting speed and feed per tooth (AB), and cutting speeds (AA). The most visible factors affecting the weighted peak frequency <fpeak> at entry and exit stages are AA (the interaction effect between cutting speeds) and Vc (cutting speed), respectively. The interaction effect between cutting speed and feed per tooth (AB) is the only governing factor on weighted peak frequency at the cutting stage. It is interesting to note that the material and tools are considered statistically insignificant parameters.
Summary of %sensitivity of each frequency domain AE parameter to cutting parameters in various cutting stages.
Influencing cutting factors on AE parameters in the entry stage.
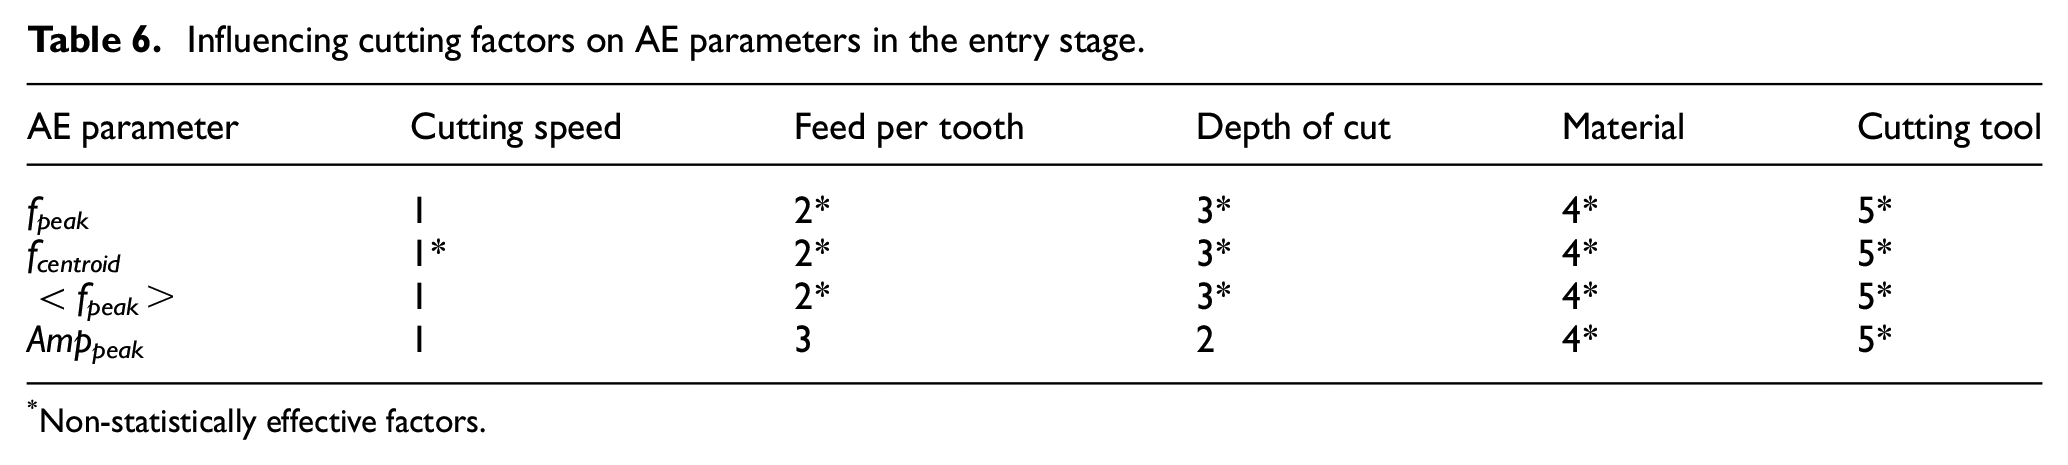
Non-statistically effective factors.
Influencing cutting factors on AE parameters in the cutting stage.
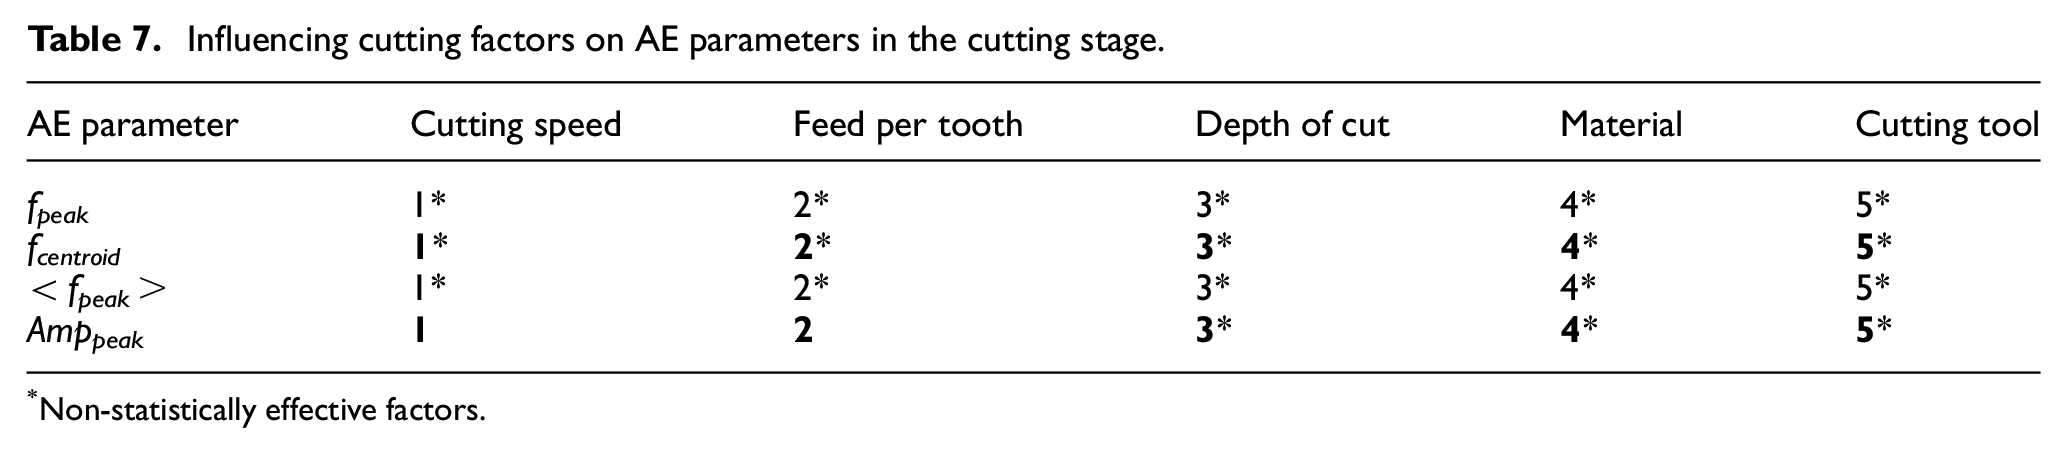
Non-statistically effective factors.
Influencing cutting factors on AE parameters in the exit stage.
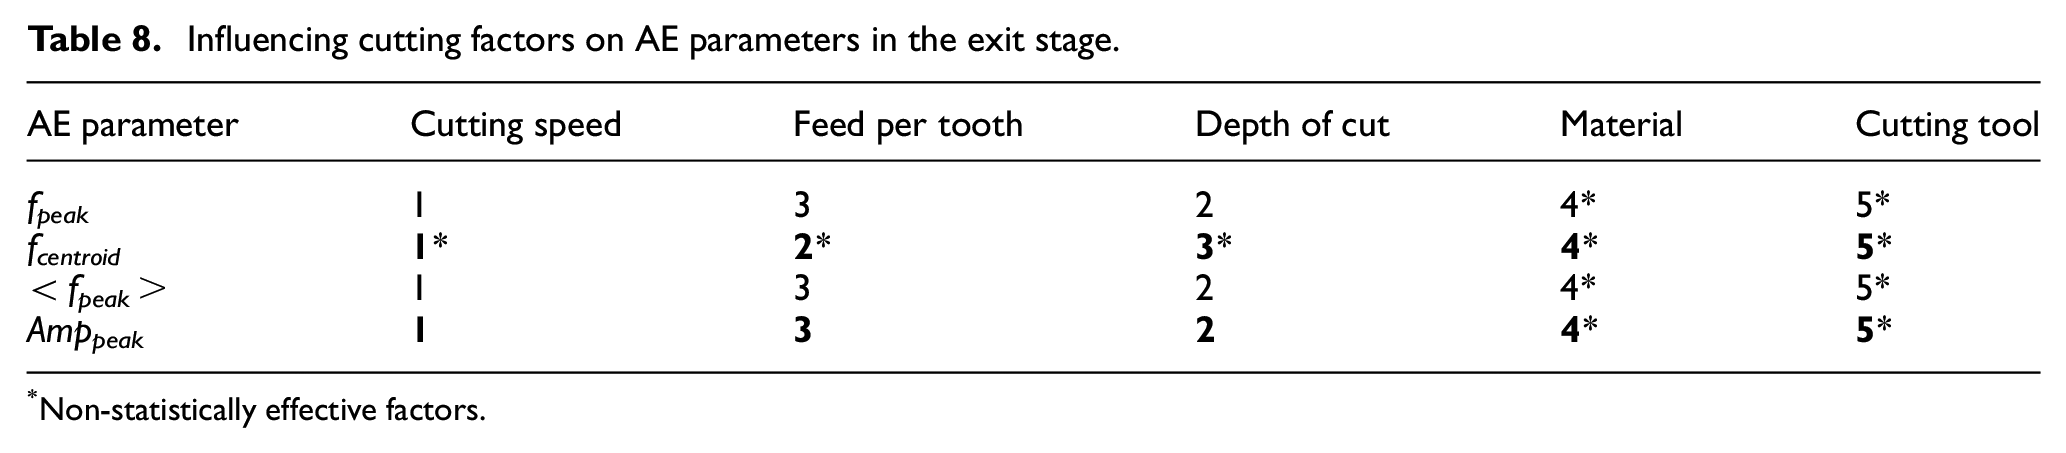
Non-statistically effective factors.
It was already observed (based on the R2 value) that most of the AE signals featured in the time domain, especially AERMS and AEmax, are highly controlled with the variation of cutting speed, feed per tooth, and depth of cut. It was also shown that the material has no apparent effect on time-domain AE parameters, except in the entry stage. However, according to the observation made in this study, it can be revealed that the frequency features of AE signals are insensitive to the variation of cutting parameters. Still, the very low p value (≪0.05) of cutting speed, feed per tooth, and depth of cut when considering Ampmax indicates that these cutting parameters significantly control the variation of the maximum amplitude. The presence of a high correlation rate of cutting speed and feed per tooth with AE signals featured in time and frequency domains confirms that adequate selection of AE signals and cutting parameters can be beneficial for machining process monitoring.
It should be emphasized that the signals acquired from machining centers (e.g. CNC) may comprise certain levels of mechanical, electrical, and acoustic noises. These signals can be highly affected by possible deviations in the system. Generally, more complex signals can be observed in milling compared to those in many other non-traditional machining operations. As noted earlier, a certain number of difficulties including burr formation, BUE, and work part adhesion to the cutting tool are considered as frequent observations when machining AAs,35–38 in principle the milling operation. To reduce the risk of the abovementioned issues, system stability and background noise were evaluated and controlled in preliminary experimental tests and new tool inserts were used after each cutting test. One proposed solution to more thoroughly avoid signal deviations is to use advanced filtering and anti-aliasing algorithms. Furthermore, the use of multiple sensors, including AE and dynamometers (for cutting force measurements) that seem to contain useful information about the machining process, material deformation, and physical attributes, in particular, stress and friction, is the second proposed approach. However, this approach requires the use of advanced signal processing and data mining strategies.
Despite the aforementioned limitations and according to experimental observations, it can be revealed that the scientific observations in this study are against critics raised about the adequacy of AE signal information in the milling operation. Knowing that the material and cutting tool types are the least effective factors on AE signal parameters, it can be stated that AE signals are mostly varied when changing the cutting parameters rather than the material properties and cutting tool model. Knowing that the second-order degree model was used in this work for the statistical analysis, it is advised to use additional models to evaluate the sensitivity of AE signal parameters. This may be considered as the subject of forthcoming articles. Moreover, other signal processing methods (e.g. wavelet transform) and feature extraction methods (e.g. principal component analysis (PCA)) could be used in a broader scope in forthcoming articles.
Furthermore, the proposed approach can be integrated into artificial intelligence (AI) techniques (e.g. neural networks) to establish a practical classification model for machining process monitoring. 41 Furthermore, higher levels of frequency along with advanced filtering and anti-aliasing algorithms are recommended to record less distorted signals. To avoid the large number of experimental tests, the theoretical prediction of AE signal parameters concerning the cutting conditions used is a suitable approach.
Conclusion
By conducting milling cutting tests on an aluminum alloy workpiece and implementing the proposed AE signal segmentation and statistical analysis approach, the sensitivity of frequency domain parameters of the measured AE signals to the variation of different cutting conditions was examined. This would help overcome the significant gaps observed in the literature regarding the effect of the cutting conditions on the behavior of the AE signals for online monitoring purposes.
Through the presented results in this work, the following conclusion was made:
It was observed that although peak amplitude and peak frequency were more sensitive to the variation of cutting conditions in comparison with other frequency domain parameters, they still are not statistically sensitive to the variation of cutting conditions. In other words, each sensitive parameter may need to achieve a correlation of determination R2 of at least 80%. Otherwise, it cannot be considered as a reliable and robust element for online monitoring purposes.
It was found that the cutting speed, feed per tooth, and depth of cut are the primary governing factors on peak amplitude, and the other governing factors are the interaction effects between cutting parameters depending on the stage of cutting. At the entry and exit stages of cutting, the interaction effect of cutting speeds and the cutting speed itself were the most effective cutting conditions on the peak frequency, whereas at the cutting stage only the interaction between cutting speed and feed per tooth influenced the peak frequency. It is an obvious observation that the material properties of the tooltip and workpiece did not affect the frequency domain parameters considerably.
It is worthy to note that the observations in this study somehow prove the capability of AE signals for milling process monitoring in the frequency domain. The results, however, partially deny the critics raised against the adequacy of AE signals in milling operations, which were mostly referred to as signal deviations as a result of background noise, friction, or chip accumulation.
To improve the reliability of the proposed algorithm and to reduce the uncertainties, it is highly recommended to integrate the findings in this article and further higher frequency range of data (accompanied with advanced filtering and anti-aliasing algorithms) with AI algorithms and to use additional sensors, particularly dynamometers. Furthermore, the use of other modes of signal processing algorithms in time and wavelet, in addition to the use of adequate feature extraction and feature selection algorithms, will be a topic of interest for the upcoming articles in parts B and C.
A clear presentation of the factors governing AE signals’ elements and sensitive AE features to the variation of cutting parameters may tend to facilitate online monitoring and failure detection in various machining operations.
Footnotes
Appendix 1
Acknowledgements
The authors would like to appreciate the financial support provided by Fonds de recherche du Québec—Nature et technologies (FRQNT) and Natural Sciences and Engineering Research Council of Canada (NSERC).
Declaration of conflicting interests
The author(s) declared no potential conflicts of interest with respect to the research, authorship, and/or publication of this article.
Funding
The author(s) received no financial support for the research, authorship, and/or publication of this article.