
Abstract
The principle objective of this work is to present a methodology to evaluate the correlation between burr size attributes (thickness and height) and information computed from acoustic emission and cutting forces signals. In the proposed methodology, cutting force and acoustic emission signals were recorded in each cutting test, and each recorded original acoustic emission signal was segmented into two sections that correspond to steady-state cutting process (cutting signal) and cutting tool exit from the work part (exit signal). The dominant acoustic emission signal parameters including AEmax and AErms were computed from each segmented acoustic emission signal. The maximum values of directional cutting forces (FX, FY and FZ) were also measured in each trial. The experimental verification was conducted on slot milling operation which has relatively more complicated burr formation mechanism than that in many other traditional machining operations. Among slot milling burrs, the top-up milling side burrs and exit burrs along up milling side were largest and thickest burrs which were studied in this work. To evaluate the correlation between signal information and burr size, the computed signal information (5 parameters) and their interaction effects (10 parameters) were used to construct the input parameters of the multiple regression fitted models. Statistical methods were then used to assess the adequacy of individual input parameters and signal information. Using the acoustic emission and cutting force signals information in the input layer of multiple regression models, a high correlation was observed between the predicted and observed values of burr size. It was exhibited that due to complex burr formation mechanism in milling operation and strong interaction effects between cutting process parameters, no systematic relationship can be formulated between the milling burrs.
Introduction
One of the main industrial concerns is burr formation on the product edges that may cause many difficulties during inspection, assembly and manufacturing automation of precision components. There are two suggested ways to overcome these difficulties. The first approach is deburring. As pointed out by Gillespie, 1 deburring and edge finishing operations are hard to automate, and they may represent as much as 30% of the cost of finished parts.2,3 Thus, it is necessary to limit the burr formation rather than deburring them in subsequent finishing operations. The second approach consists of burr size prevention, minimization and/or estimation. Investigations on burr formation have been reported in various experimental and modeling (numerical and analytical) studies.4–9 In general, burr size modeling using experimental results is only accurate for a narrow range of input process parameters, and higher-order empirical models require a larger number of experiments. Due to several factors that are very difficult to model explicitly, burr size prediction using analytical models is a complex task. In addition, burr formation models based on finite element method (FEM) are relevant to the accuracy of input boundary conditions, which are not yet advanced and, therefore, are usually simplified. Moreover, the results are strongly influenced by the software applied; time-consuming and generally experimental data are required for model validation. 7
One alternative approach is to use signal information for burr size estimation. This method has received less amount of attention 10 due to certain levels of difficulties, including (1) inadequate understanding of automated burr size measurement approaches, (2) incomplete knowledge about sensitivity of sensors to cutting parameters and (3) lack of knowledge about modeling approaches for burr formation modeling. 11 To monitor machining processes and various machining outputs (e.g. burr size), special attention has been paid to dynamometer, accelerometer, acoustic emission (AE) and current sensors. 12 Although cutting force is known as a variable that best describes the cutting process, 13 but dissimilar to AE signals, it is not independent of the tool path in cutting process. In fact, the ability to detect microscale deformation mechanisms within a relatively noisy cutting background promotes AE as a popular tool for process monitoring applications. 14 Due to noncontinuous mode of the cutting process and run-out effects in milling operations, vibration signals may not be as reliable as cutting forces and AE signals.11,15 This exhibits that according to frequency coverage of sensors and complexity of burr formation mechanism, AE and dynamometer sensors seem to perform better when used in milling burr size prediction models. Surprisingly, only few studies10,16,17 evaluated the correlation between burr size and computed information from AE and/or cutting force signals. This denotes that preliminary studies are still needed to understand better the capability of AE and cutting force signals for burr formation detection and burr size estimation. To that end, this work proposes a methodology to evaluate the correlation between exit and top burrs’ size (thickness and height) and signals information computed from AE and cutting forces signals. Experimental verifications were studied on slot milling top and exit burrs.
Background of burr formation
Burr formation is one of the major issues manufacturing industries are currently facing. 2 Among traditional machining operations, milling burr formation has a relatively more complex morphology. Milling burrs are created when the cutting tool enters and exits the machined parts. 18 The burr formation mechanism in end milling and slot milling operations (Figures 1 and 2) are even more complex than the one in face milling. Unlike in face milling, subsequent tools passing through in end milling and slot milling operations do not usually remove the burrs produced by previous tools. Consequently, side burrs and top burrs remained on the part. 8
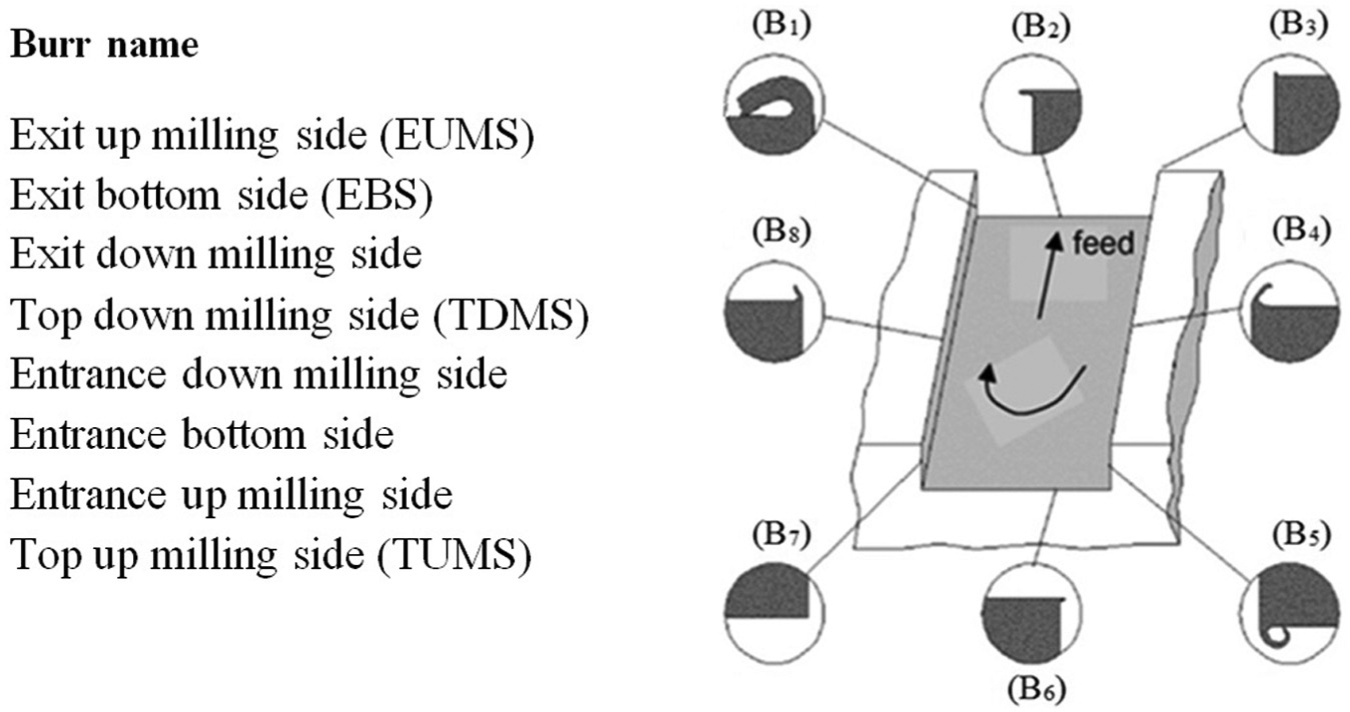
Definition of slot milling burrs. 7
Slot milling burrs: (a) exit up milling side (EUMS) burr, (b) exit bottom side (EBS) burr, (c) top-down milling side (TDMS) burr and (d) top-up milling side (TUMS) burr. 21
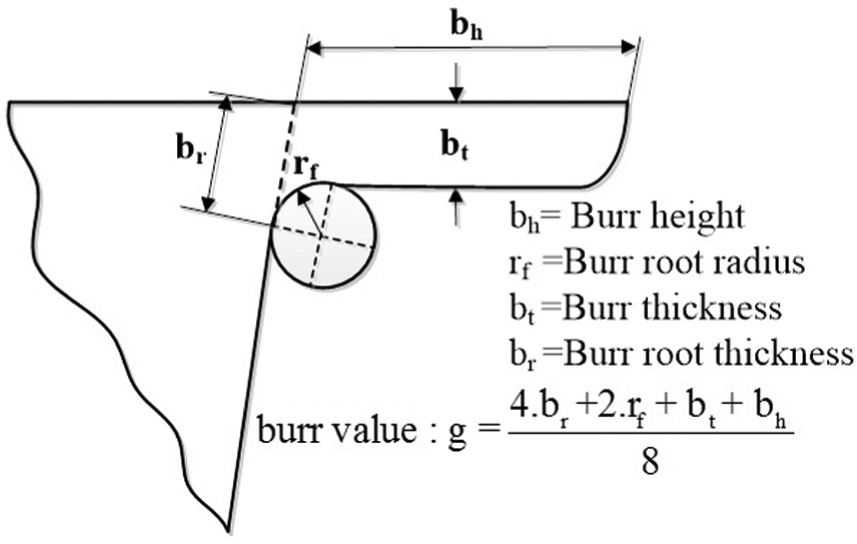
To define better the burr size attributes, a new term called “burr value” (Figure 3) was defined in Schäfer. 19 It encompasses several burr size parameters such as burr root thickness (br), burr height (bh), burr thickness (bt) and burr root radius (rf). However, adequate measurement of all above-mentioned burr size parameters to calculate the burr value is a very difficult and time-consuming approach. Furthermore, it would appear that the burr value cannot be used as an efficient parameter to better select a deburring method. Of all the burr size parameters, the burr height and thickness are used to determine the burr removal difficulties. 20 Generally, the burr thickness is mostly of interest as it defines the time and method necessary for deburring process. 21 In this article, both burr height and thickness will be studied.
Measurement values of a burr.
As presented in Figure 1, the exit burrs along bottom side (EBS) and up milling side (EUMS) are largest burrs, and the top burrs along up milling side (TUMS) and down milling side (TDMS), the entrance and exit burrs along down milling side are on a medium-scale, comparatively 22 (Figure 2). Considering the larger size of exit burrs as compared to top and entrance burrs (Figure 1), extensive studies were conducted to evaluate factors governing exit burrs.7,23–27
Research methodology
The first considerations of burr formation in metal cutting came along with investigations about chip formation, while burr formation mechanism very much depends on chip formation mechanism. Cutting force is among the governing factors on burr formation mechanism and size, which has a direct relationship with feed rate and depth of cut. 28 According to Niknam 27 and Liang and Dornfeld, 29 directional cutting forces in slot milling of AA 2024-T351 and AA 6061-T6 are mainly controlled by feed per tooth, and it was reported that depth of cut and cutting speed have insignificant effects on directional cutting forces.
As pointed out in Dornfeld, 30 the generation of AE signals in most of the cutting operations is likely dependent on material removal rate (MRR) and consumed energy level in cutting process
where A is a constant depending on process parameters such as cutting geometry, thermal properties and so on. The bar above AEpower in equation (1) indicates that the power is averaged over some time interval.
There are number of AE parameters that can be extracted from AE signals through time and frequency analysis. The behavior of AE signals in machining processes depends on variation of cutting parameters, cutting tool and workpiece. According to Niknam et al., 31 AErms, AEmax and AEvar were found as the most sensitive AE parameters to a broad range of cutting parameters in slot milling of AA 6061-T6 and AA 2024-T351. Other governing factors on burr size variation are material deformation properties as well as cutting parameters and tool geometry.8,21 Due to strong interaction effects between process parameters and lack of knowledge about dominant process parameters on burr formation in many machining operations, the relationship between the cutting parameters and burr size attributes (e.g. height and thickness) cannot be precisely formulated in mathematical equations. 26 Therefore, by considering the sensitivity of AE and cutting force signals to variation of cutting parameters, MRR and consumed energy level in cutting process, it is expected that there is a correlation between the burr size attributes and signals information.
The proposed method consists of the following steps (Figures 4 and 5):
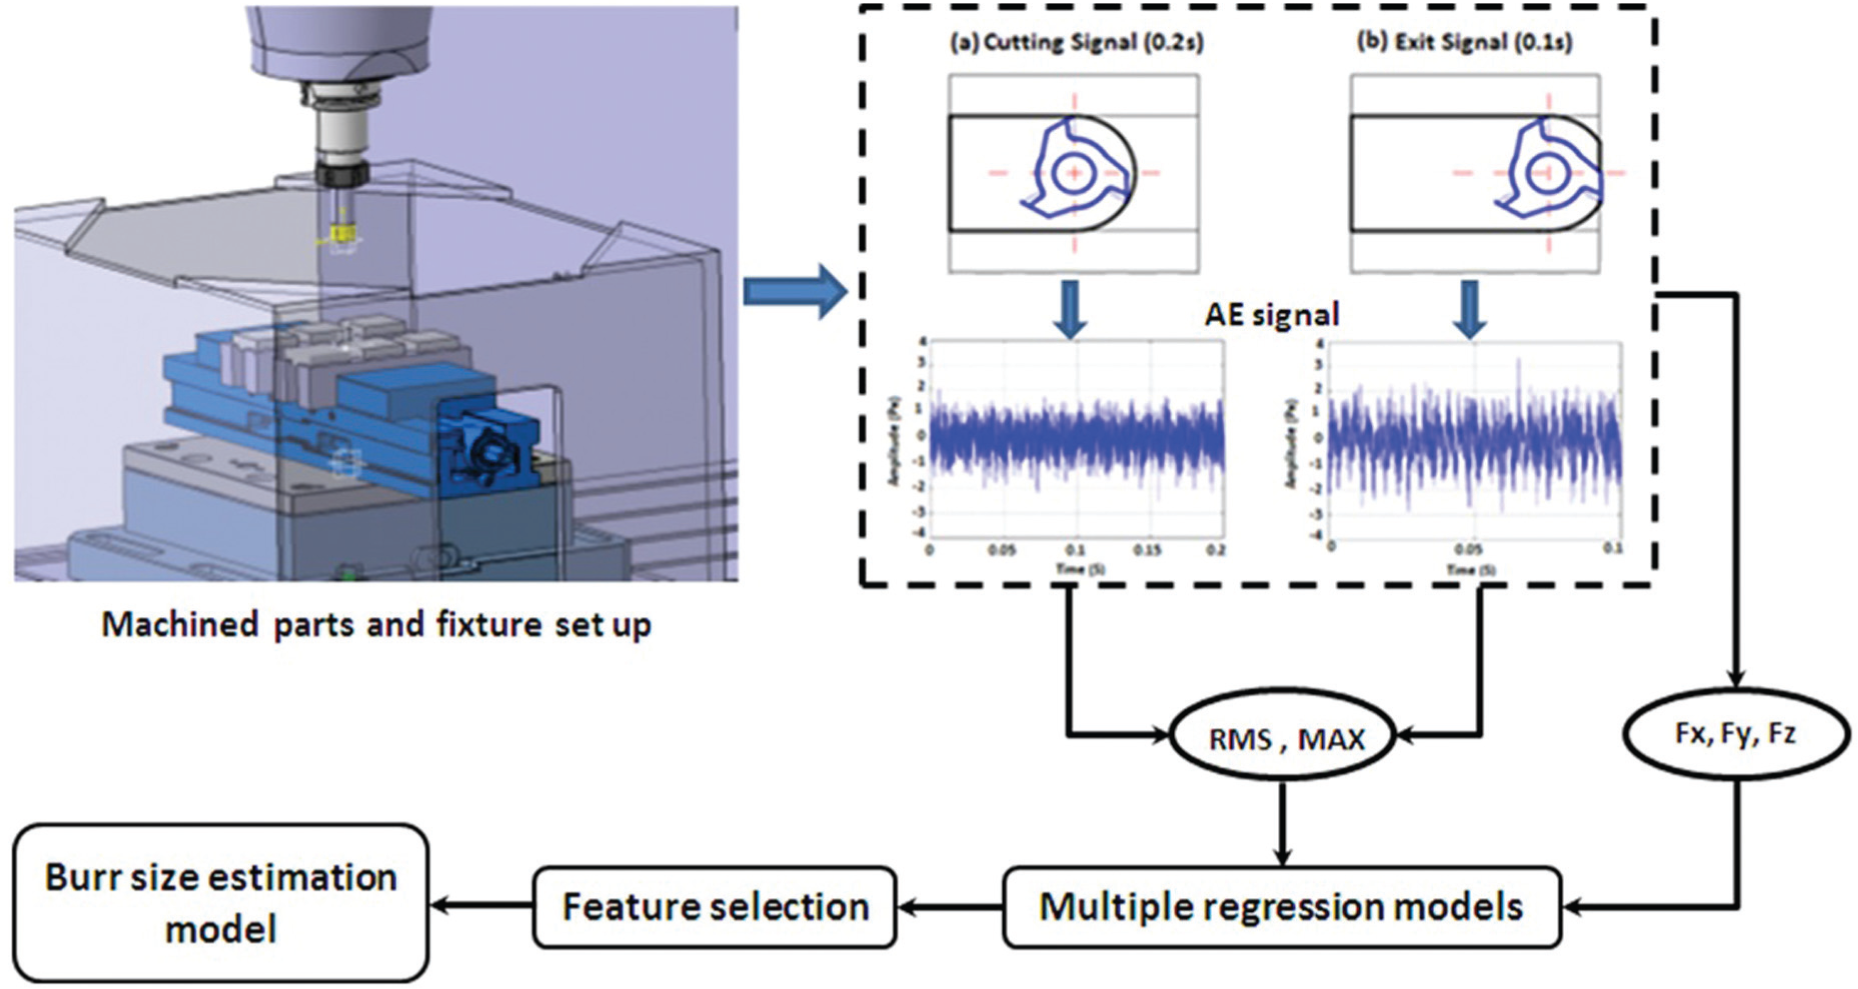
Overview of proposed approach: (a) cutting signal (0.2 s) and (b) exit signal (0.1 s).
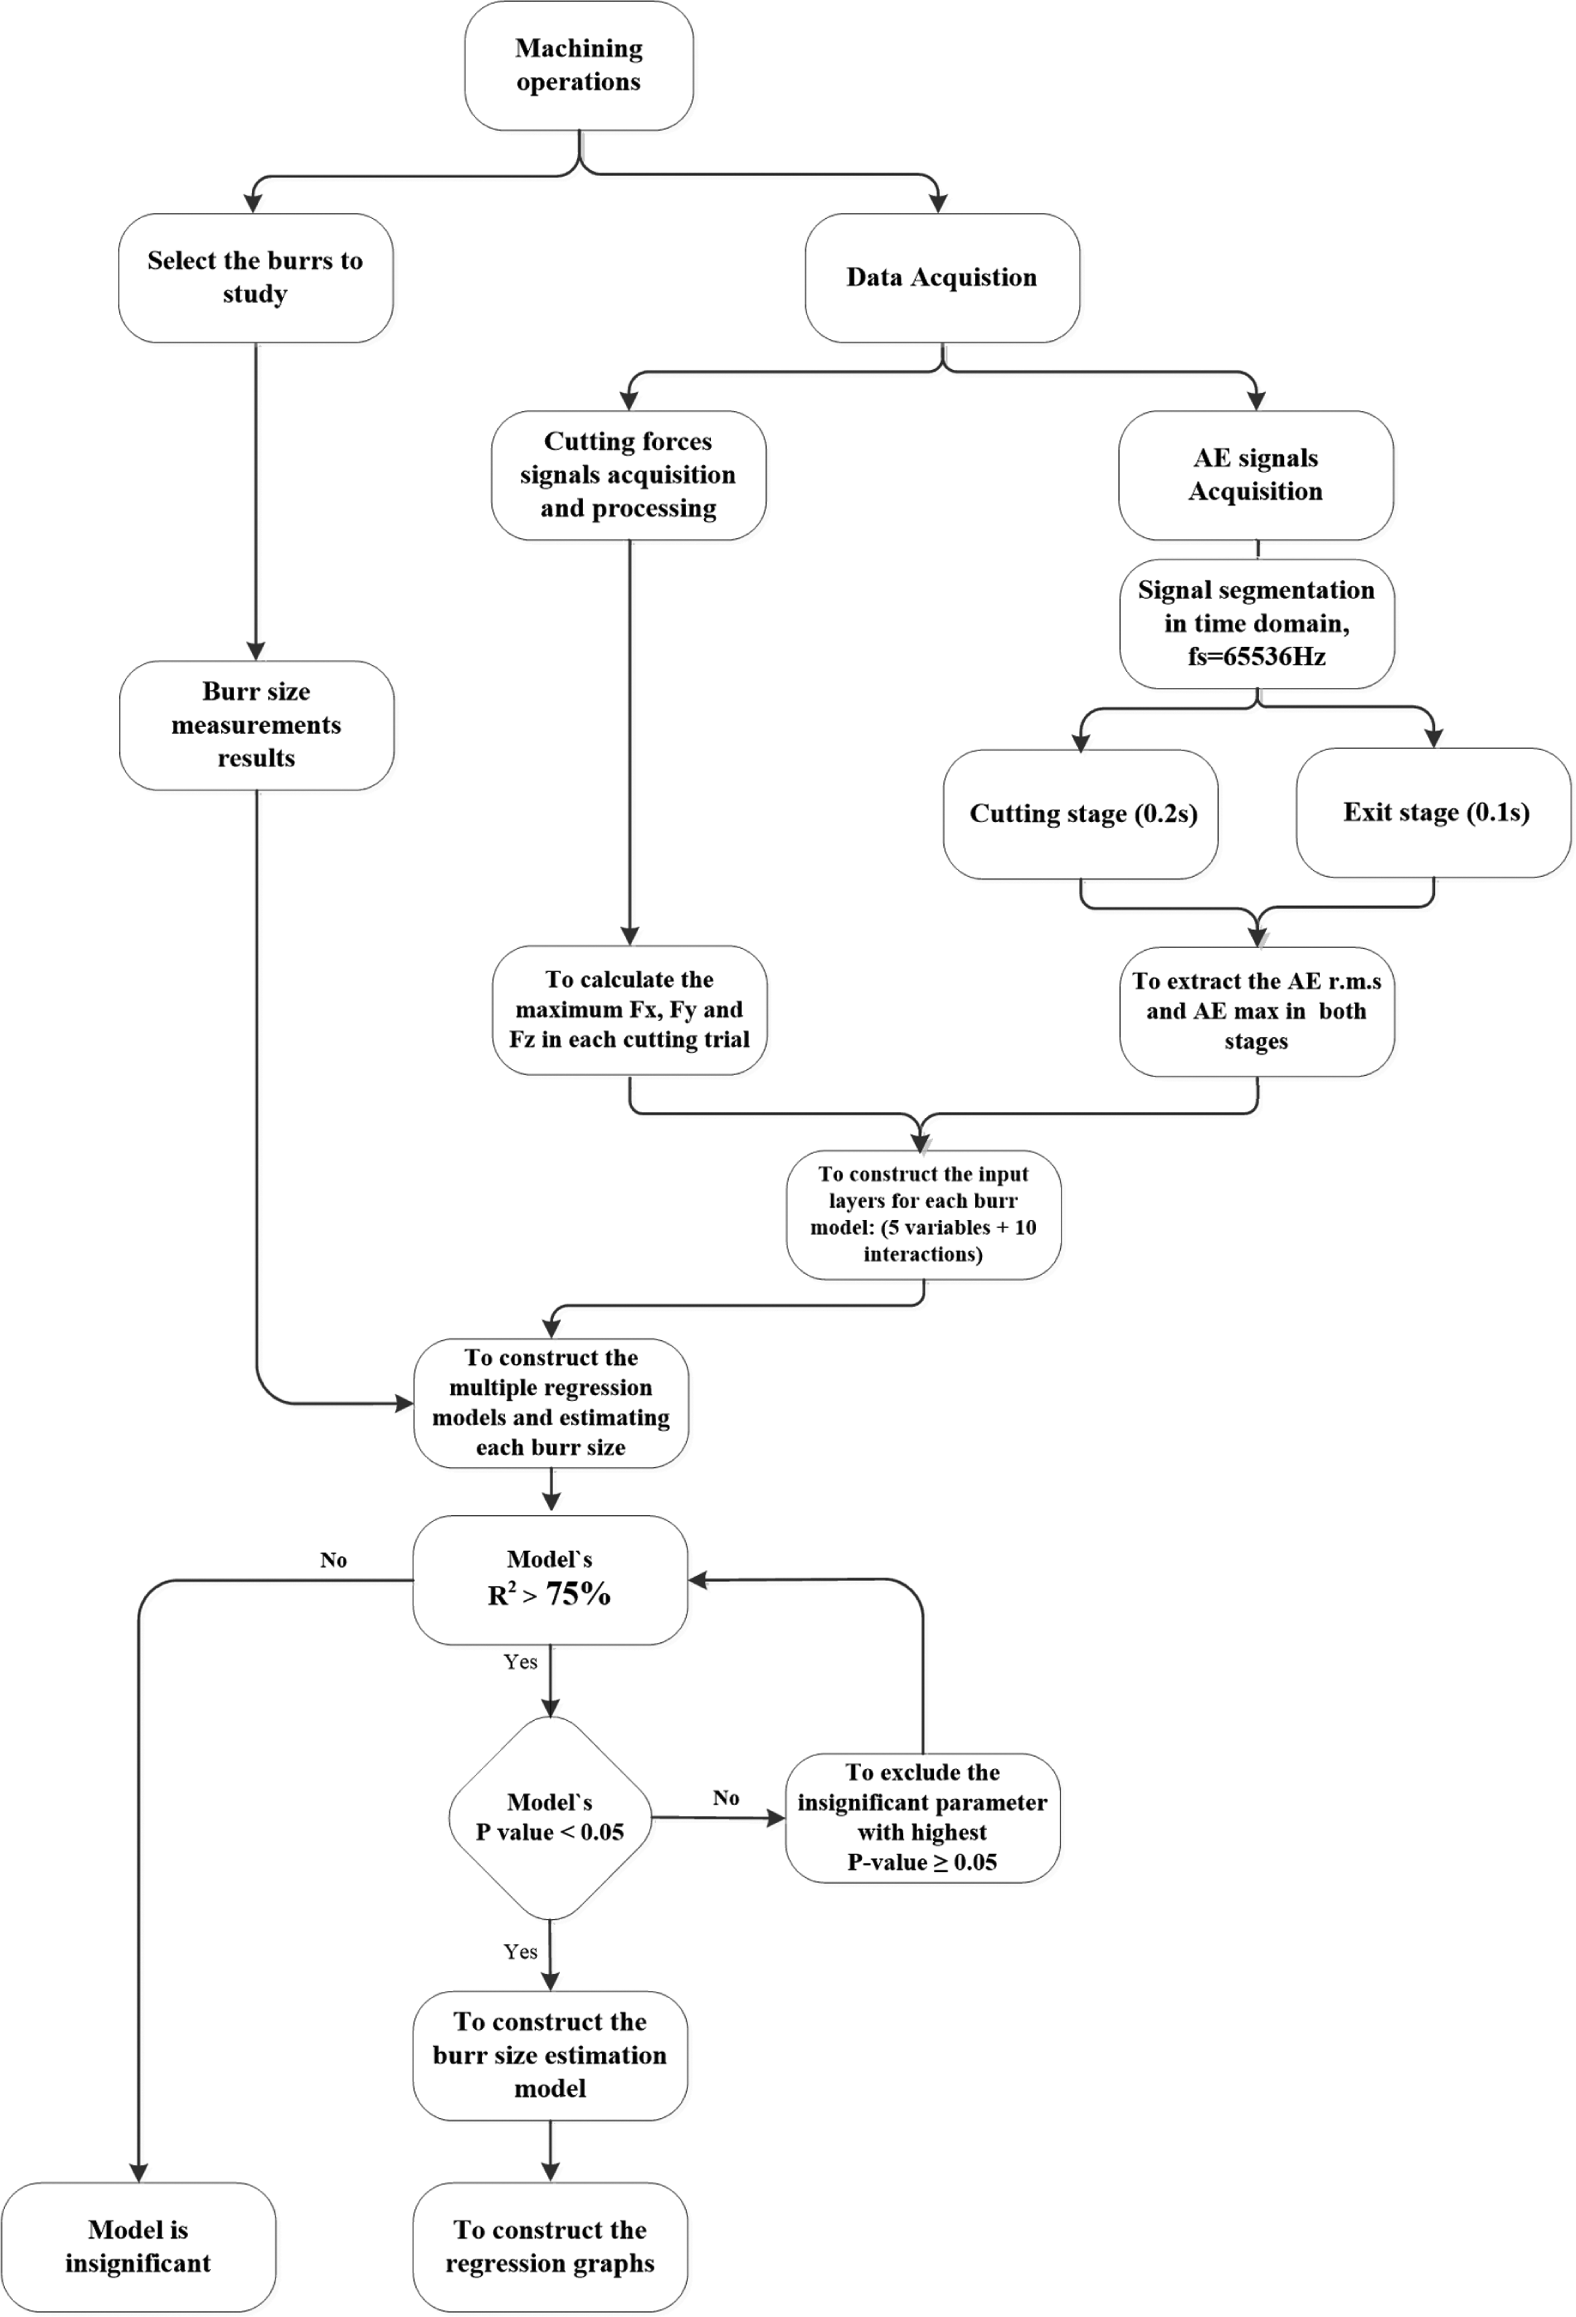
Architecture of the proposed methodology.
To extract two segmented signals from each original recorded AE signal, x(t), in each cutting trial with respect to cutting tool progress and exit from machined parts;
To perform signal processing over segmented AE signals and computing the appropriate signal features (AErms and AEmax) using a sampling frequency (fs) of 100 kHz:
AEmax is the amplitude of the segmented AE signal
AErms is used to quantify the energy of AE signal
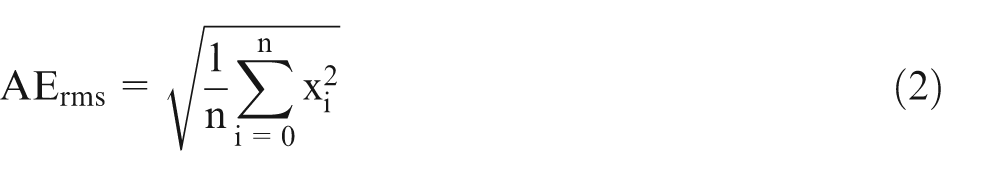
where n is the data points in each signal.
3. To calculate the maximum values of cutting forces in longitudinal (FX), vertical (FY) and axial (FZ) directions from each recorded cutting force signal;
4. To construct the input layer and then formulating the linear multiple regression models (Appendix 1), followed by feature selection approach;
5. To reconstruct the linear multiple regression models (empirical burr size estimation models) using statistical significant variables determined through feature selection approach.
The significant and insignificant variables and models are identified using statistical parameters, including P-value, R2 and
Experimental procedure
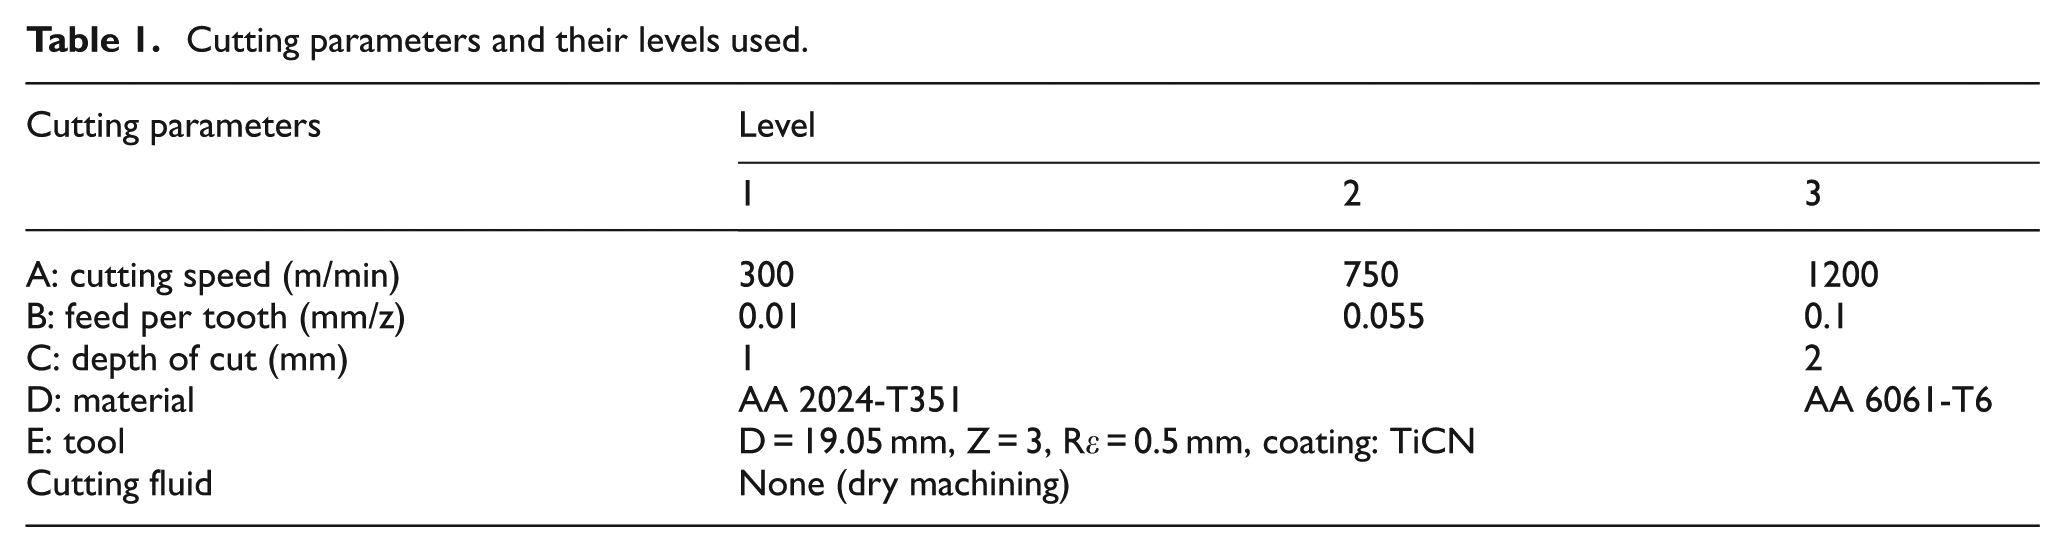
A multilevel full factorial design (32 × 22) was used as the experimental plan. The experimental factors and their levels are shown in Table 1. In total, 36 experiments are necessary to complete the study.
Cutting parameters and their levels used.
The main experimental stages are as follows:
Slot milling tests were performed on a three-axis computer numerical control (CNC) machine (power: 50 kW, speed: 28,000 r/min; torque: 50 N m) using the process variables listed in Table 1;
Data acquisition using AE sensors (Fs = 100 kHz) placed near the chip formation zone and a three-axis dynamometer (Kistler-9255B; Fs = 48 kHz) for cutting force measurements;
AErms and AEmax were measured through each segmented AE signal as presented in methodology (Figure 5). The maximum values of directional cutting forces during each cutting trial are computed through cutting force signals (Figures 4 and 5);
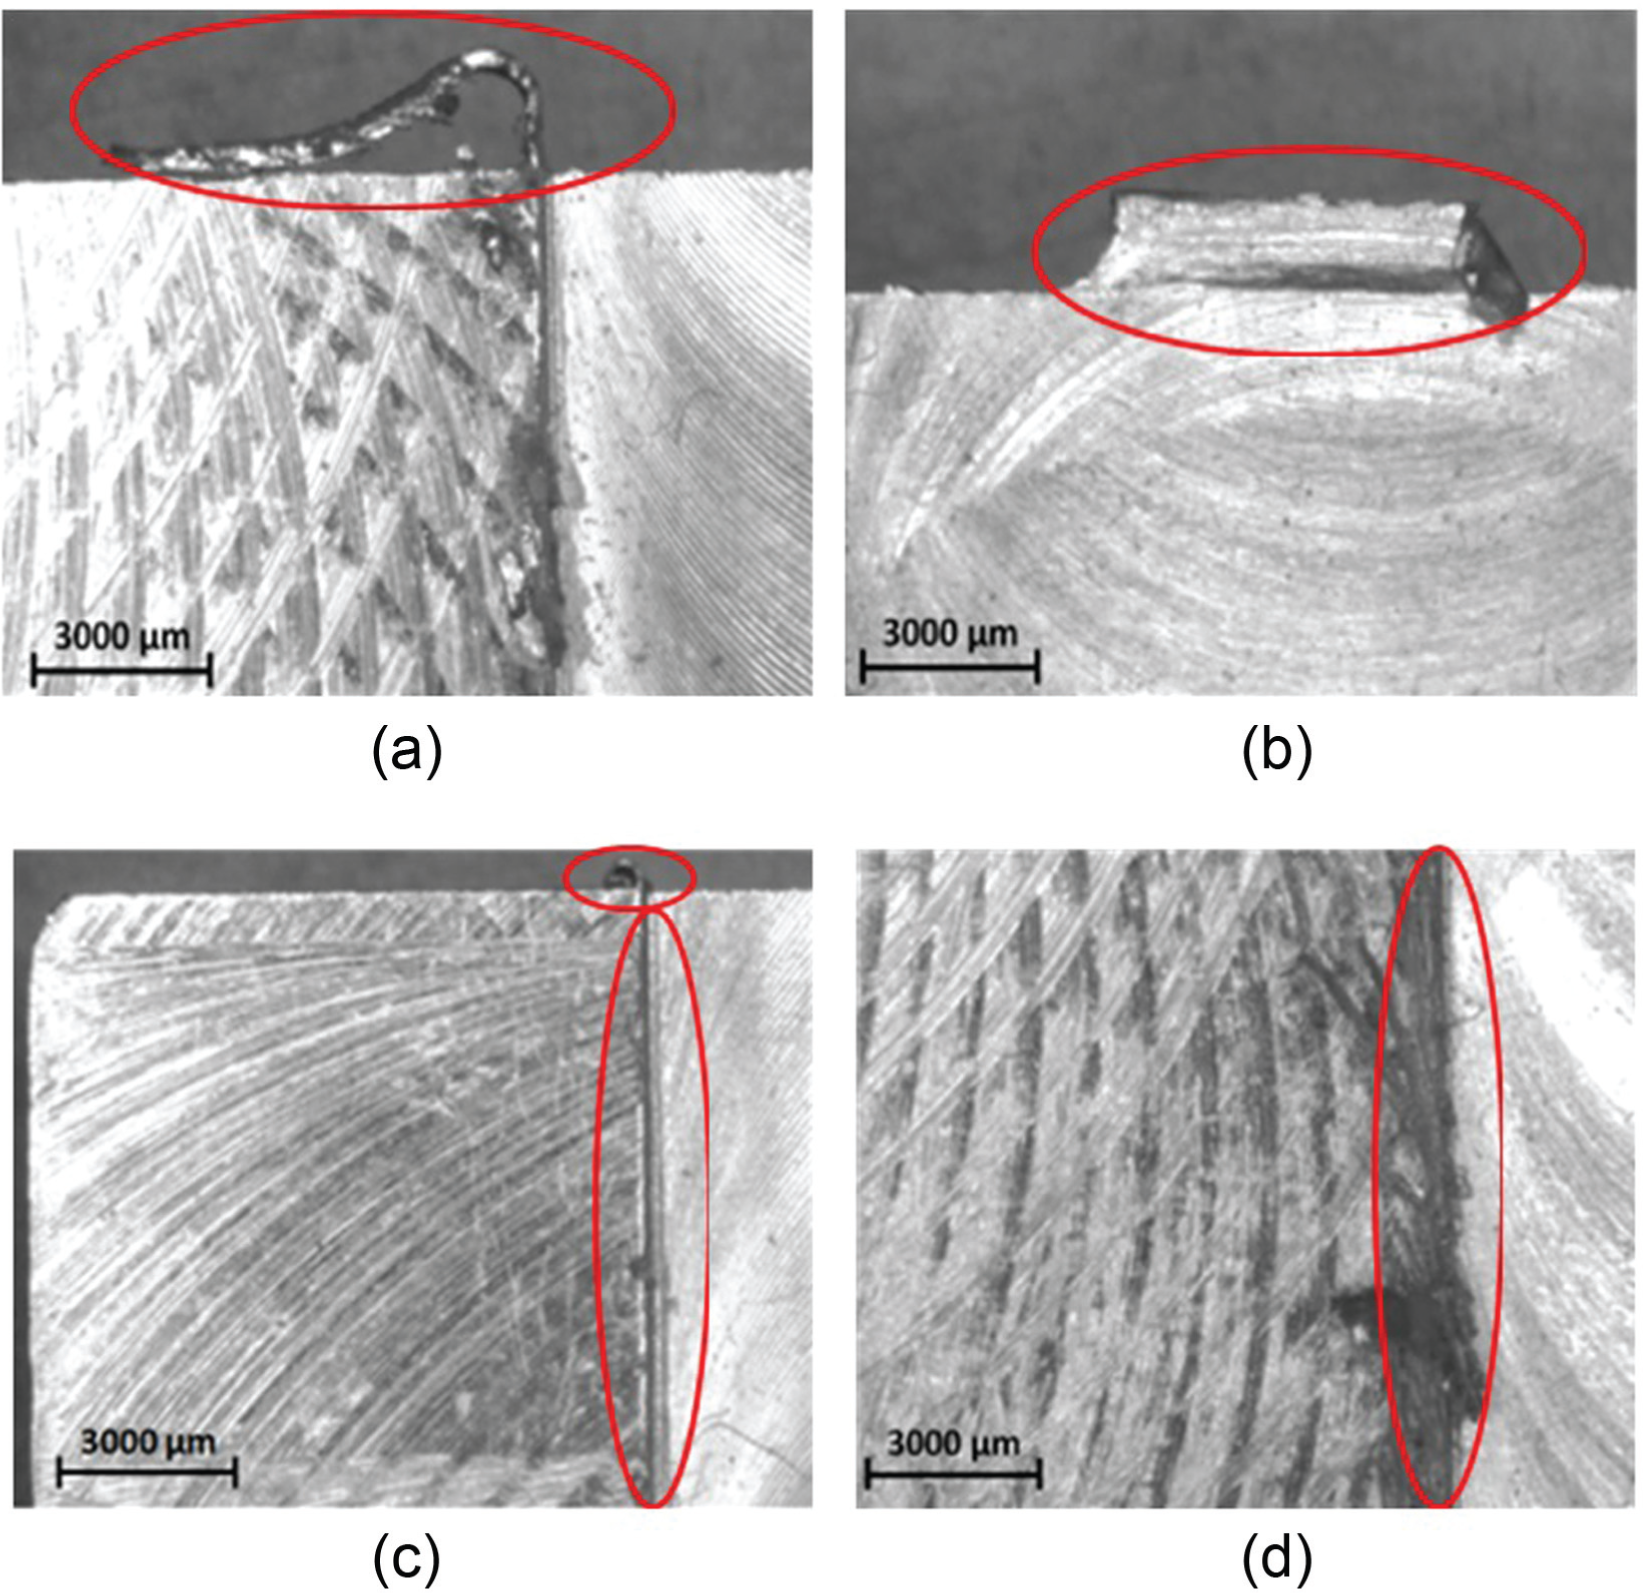
Burr size attribute (height and thickness) measurement was conducted using a high-precision optical microscope, equipped with high-resolution camera. An average of four burr thickness readings and maximum burr height were considered as the scale of burr size in this study.
To develop the experimental set up, the stability of cutting process, machine and tool vibration and dynamic behavior were carefully controlled in preliminary tests. Using rigid tool and workpiece fixtures, a negligible deflection was observed in the tool and workpiece. To avoid possible deviations in AE and cutting force signals that might occur due to tool wear, a new insert was used after each cutting test. Moreover, to examine background noise, one AE sensor was placed 2 m away from chip formation zone.
Results and discussion
The results in this article are presented in the following categories.
Comparative study between the milling burrs
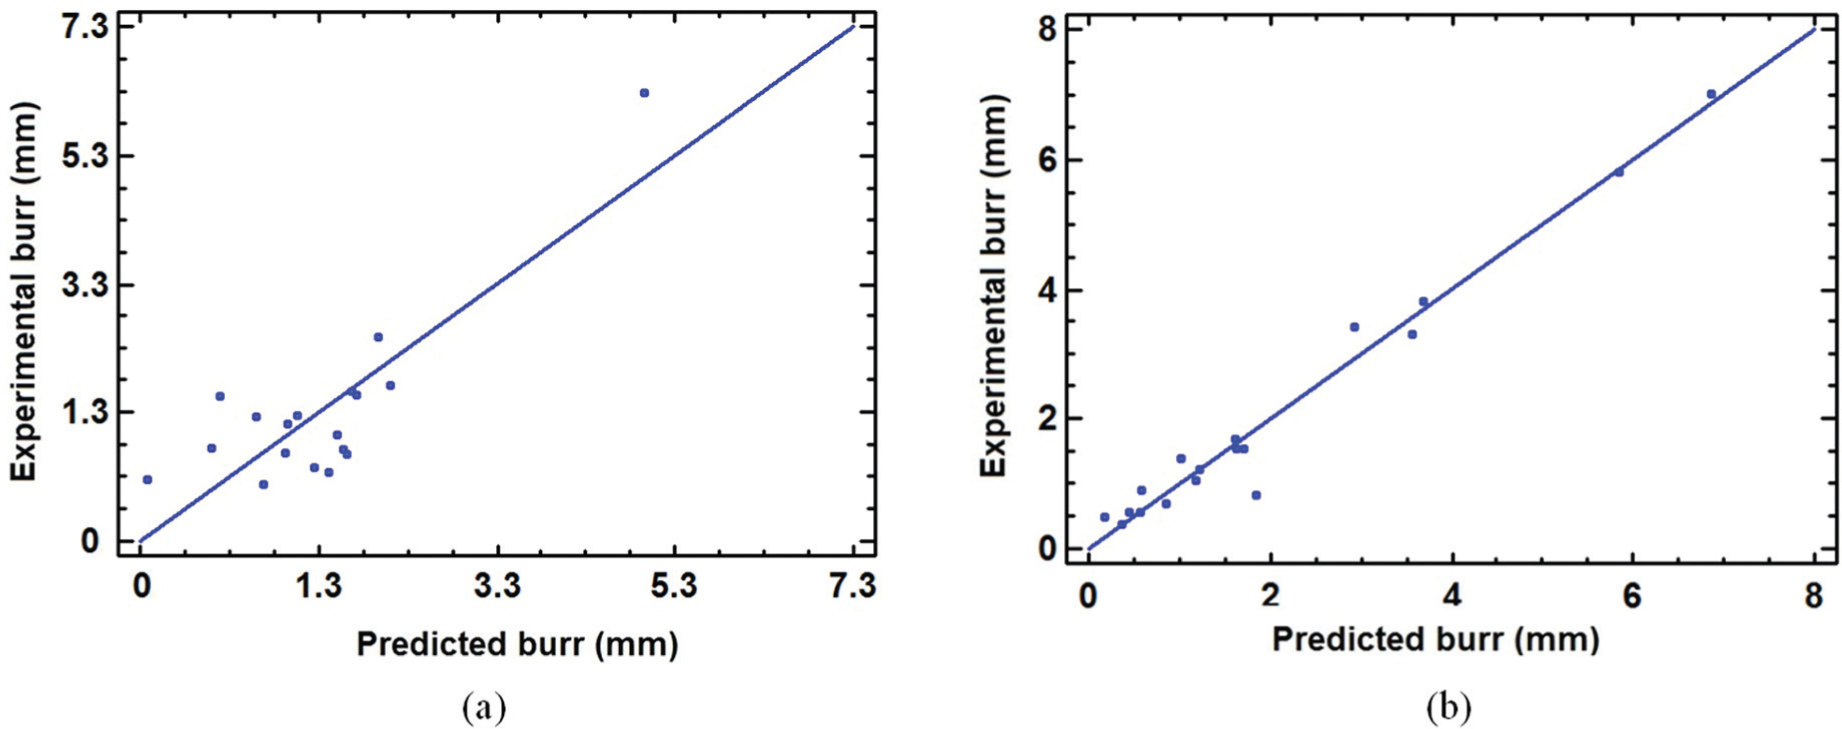
As noted in Niknam and Songmene, 8 the size of burrs that occurs in similar cutting section (e.g. exit, top and entrance) is not statistically correlated to each other. To confirm this statement with recorded experimental results, linear simple regression models (Figures 6–9) were used to study the correlation between recorded values of top and exit milling burrs along up and down milling sides. According to Tables 2 and 3 and Figures 6–9, very weak correlation is observed between exit and top burrs’ size. This exhibits that due to noncontinuous mode of cutting process and run-out effects in milling operations, complex burr formation may occur where, in fact, no systematic relationship can be formulated between exit and top milling burrs. In addition, cutting parameters and their interaction effects are other governing factors on milling burr formation mechanism.8,26 Consequently, there are severe difficulties for adequate monitoring and burr size estimation or modeling in noncontinuous machining operations such as milling and drilling operations. 21 Therefore, as mentioned earlier, to detect burr formation and/or estimate the burr size, the use of alternative approaches such as signal information is evolved.
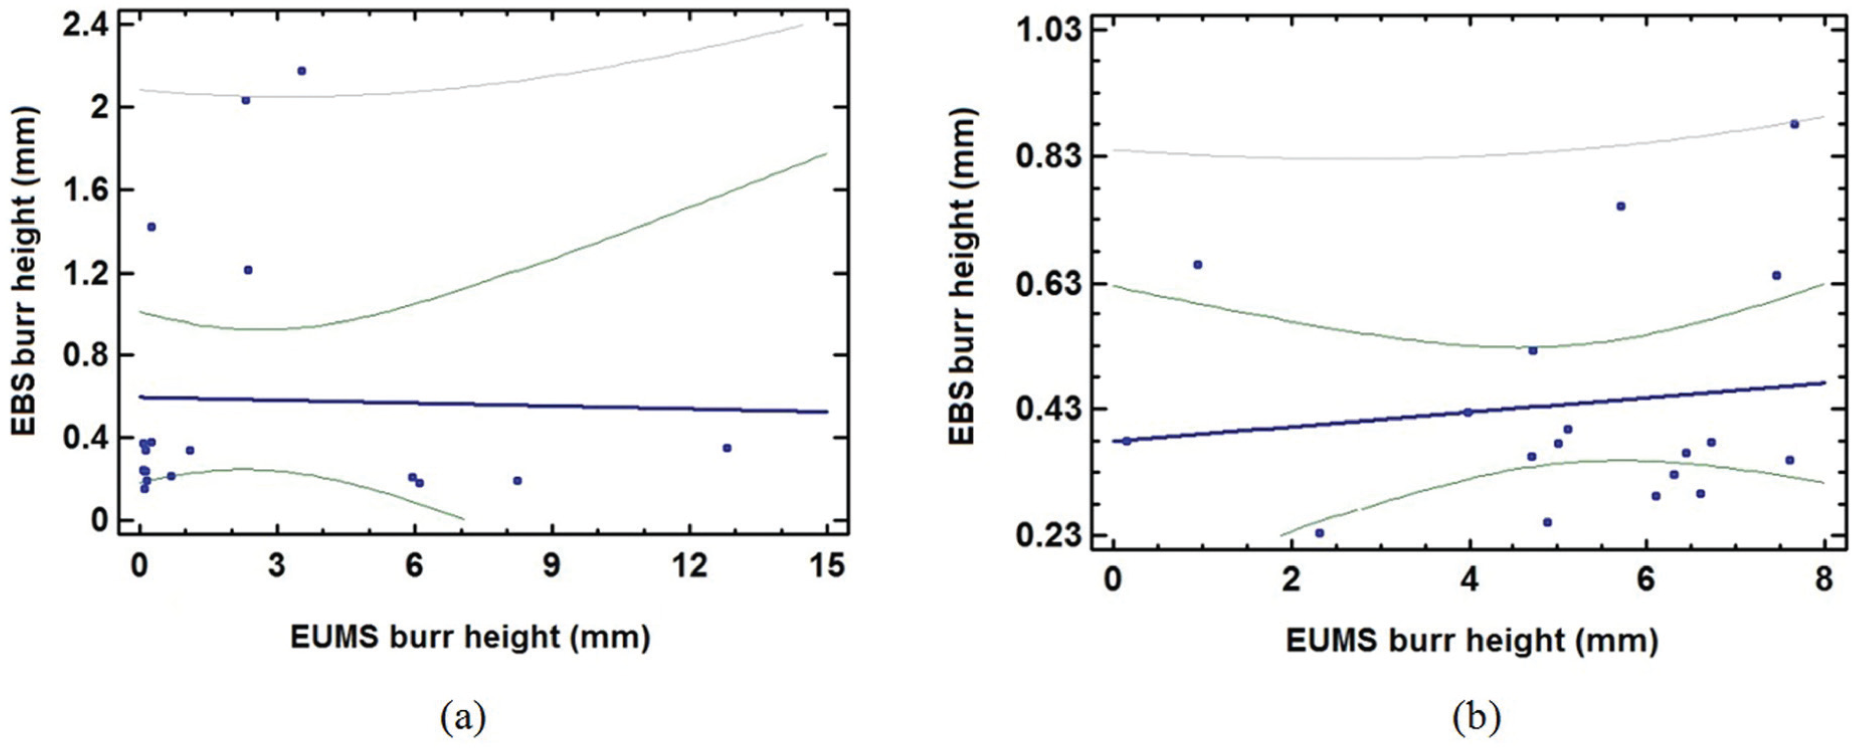
Linear simple regression models of EBS and EUMS burrs’ height in (a) AA 2024-T351 and (b) AA 6061-T6.
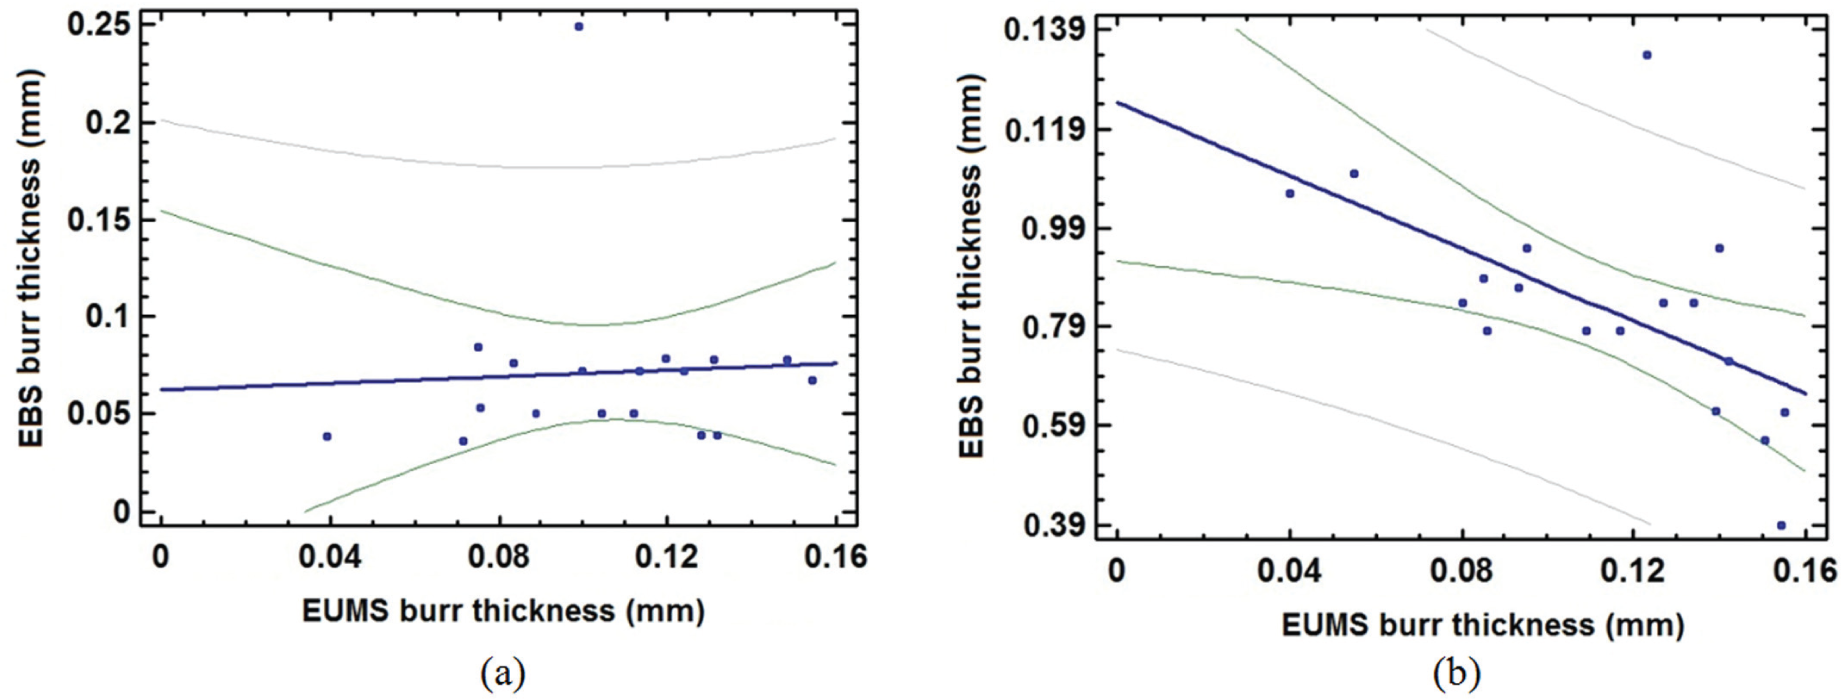
Linear simple regression models of EBS and EUMS burrs’ thickness in (a) AA 2024-T351 and (b) AA 6061-T6.
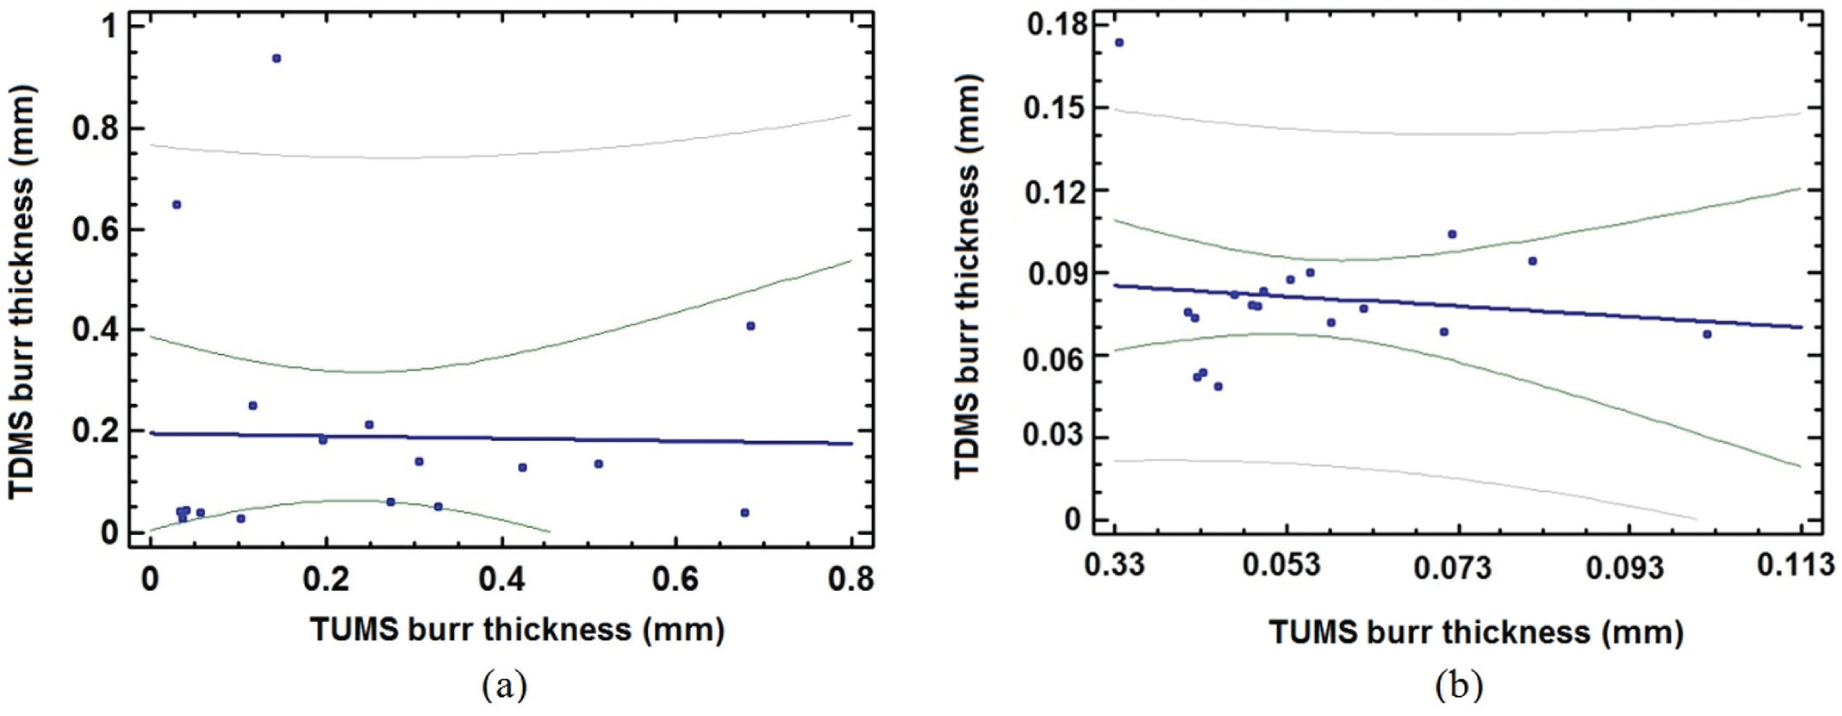
Linear simple regression models of TUMS and TDMS burrs’ thickness in (a) AA 2024-T351 and (b) AA 6061-T6.
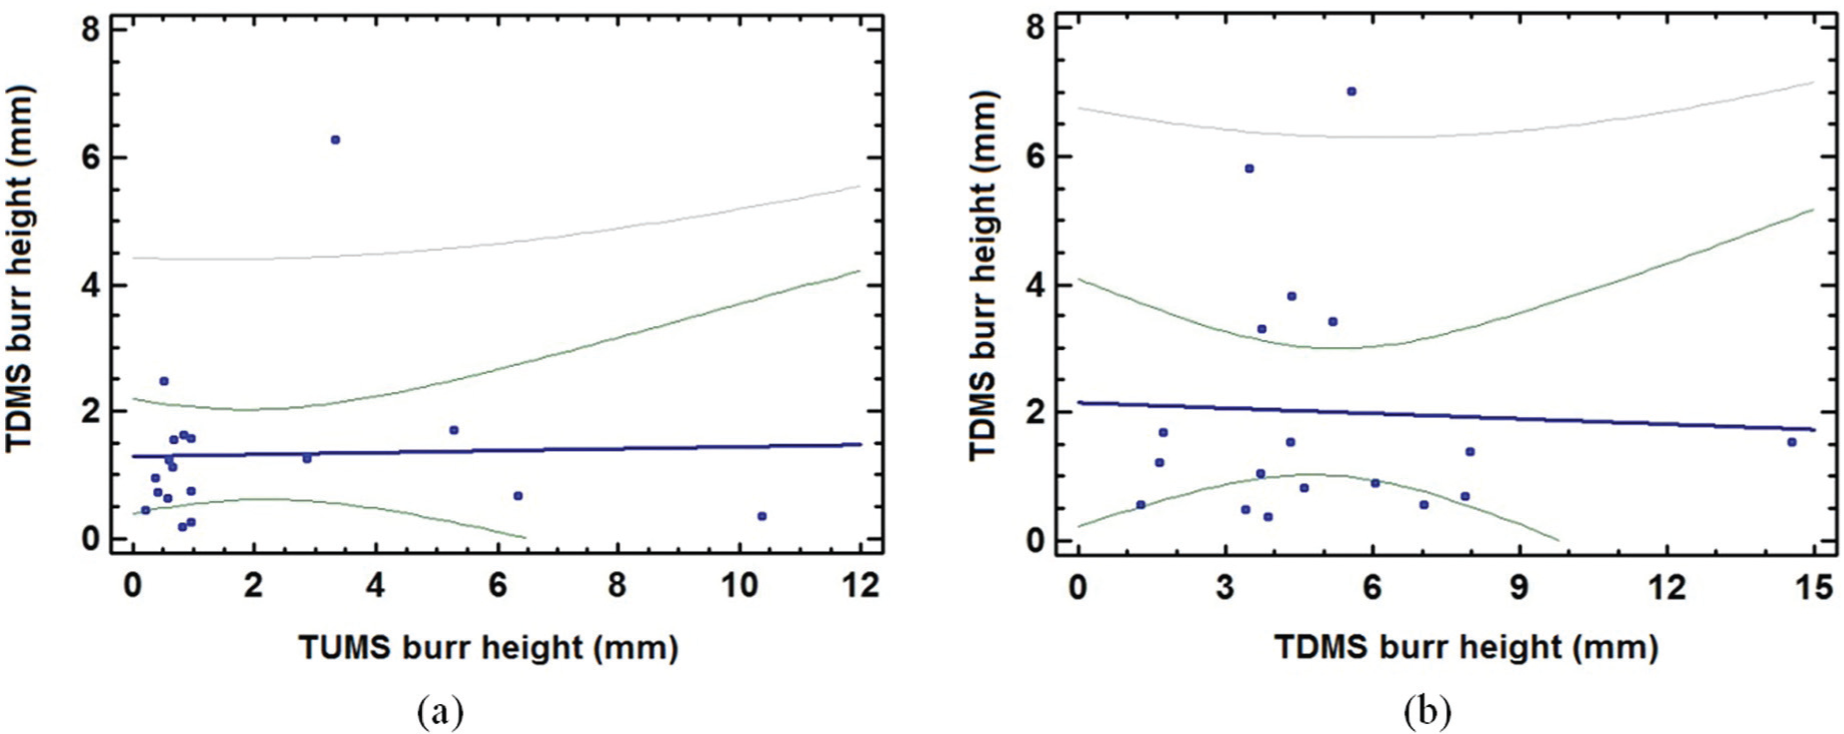
Linear simple regression models of TUMS and TDMS burrs’ height in (a) AA 2024-T351 and (b) AA 6061-T6.
Statistical summary of regression models of AA 2024-T351.
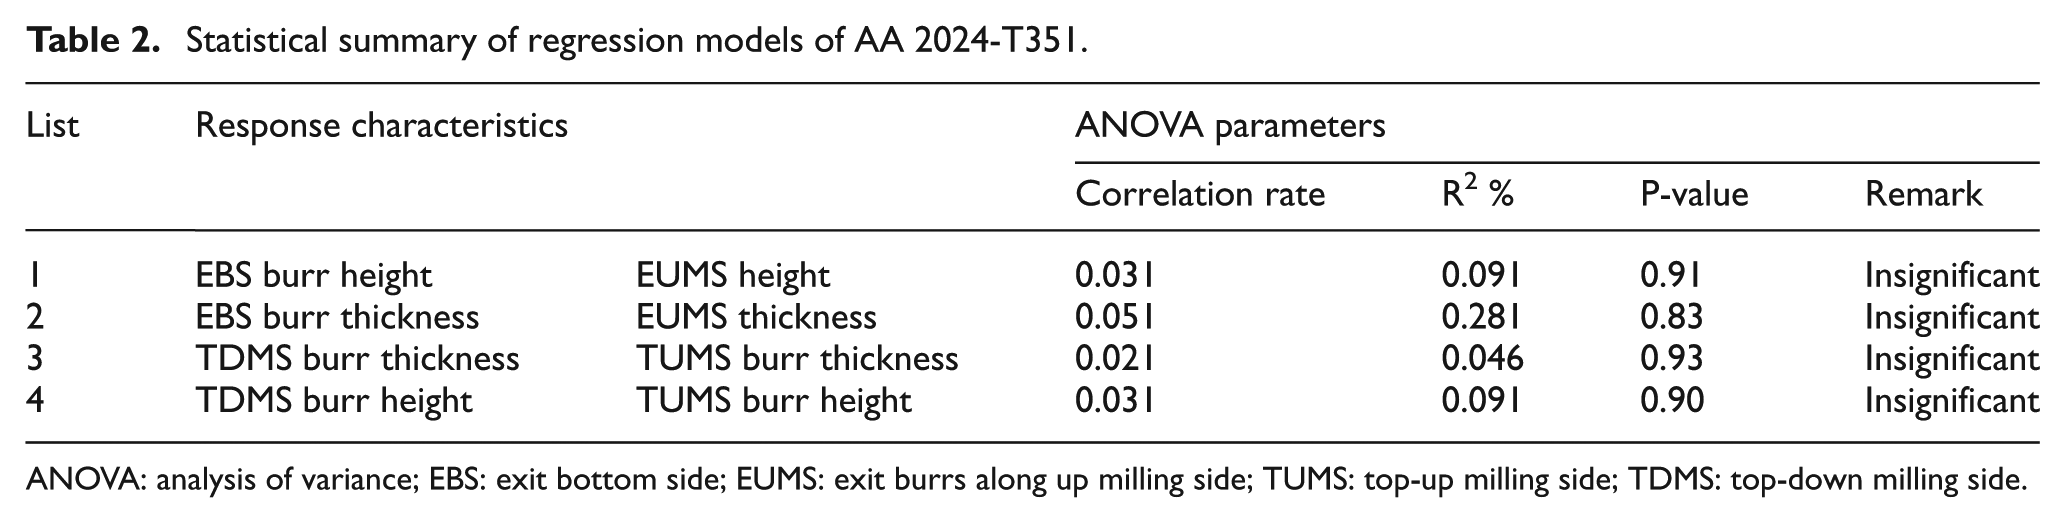
ANOVA: analysis of variance; EBS: exit bottom side; EUMS: exit burrs along up milling side; TUMS: top-up milling side; TDMS: top-down milling side.
Statistical summary of regression models of AA 6061-T6.
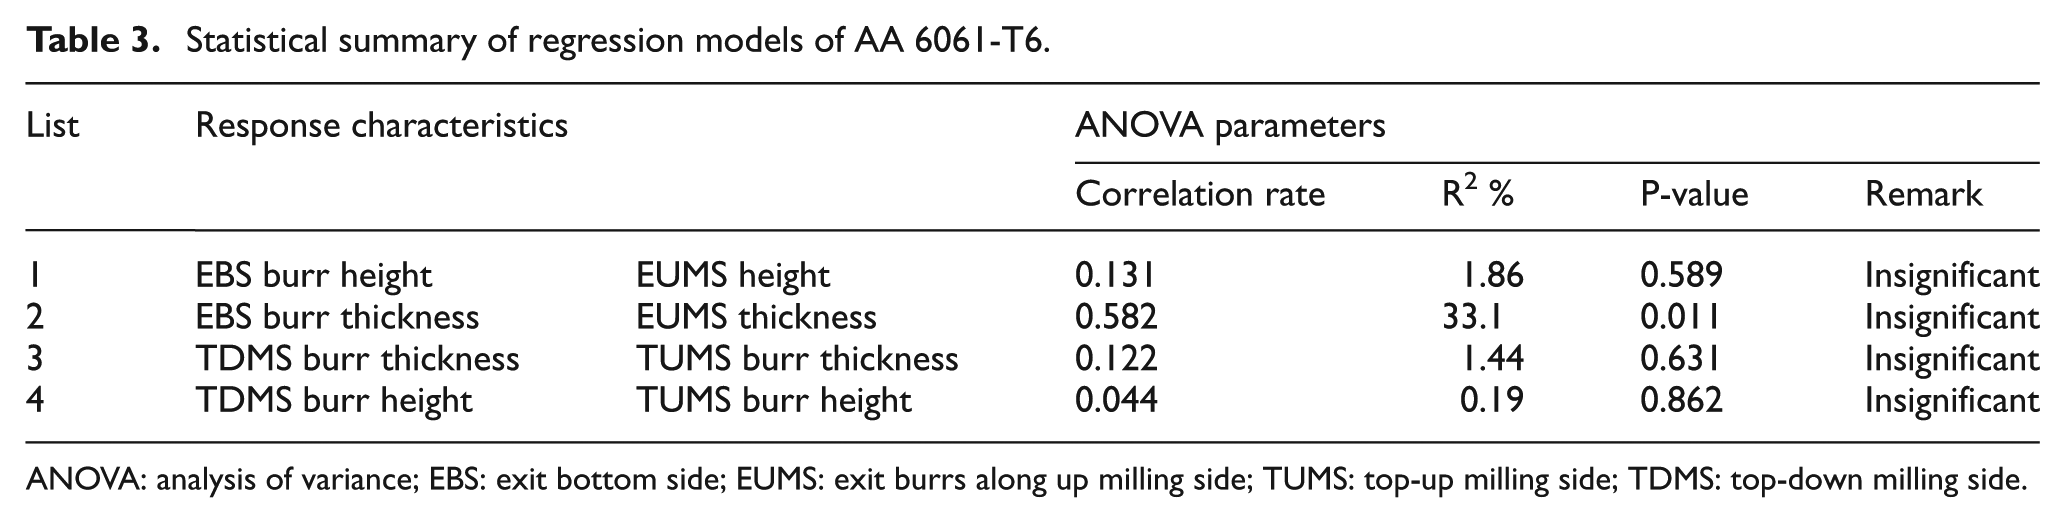
ANOVA: analysis of variance; EBS: exit bottom side; EUMS: exit burrs along up milling side; TUMS: top-up milling side; TDMS: top-down milling side.
Correlation between burr size and signal information
EUMS burr thickness
According to burr formation mechanism and by considering that there are higher levels of
Statistical summary of EUMS burr thickness models in AA 2024-T351 and AA 6061-T6.
Statistical summary of EUMS burr thickness models in AA 2024-T351 and AA 6061-T6 after feature selection.
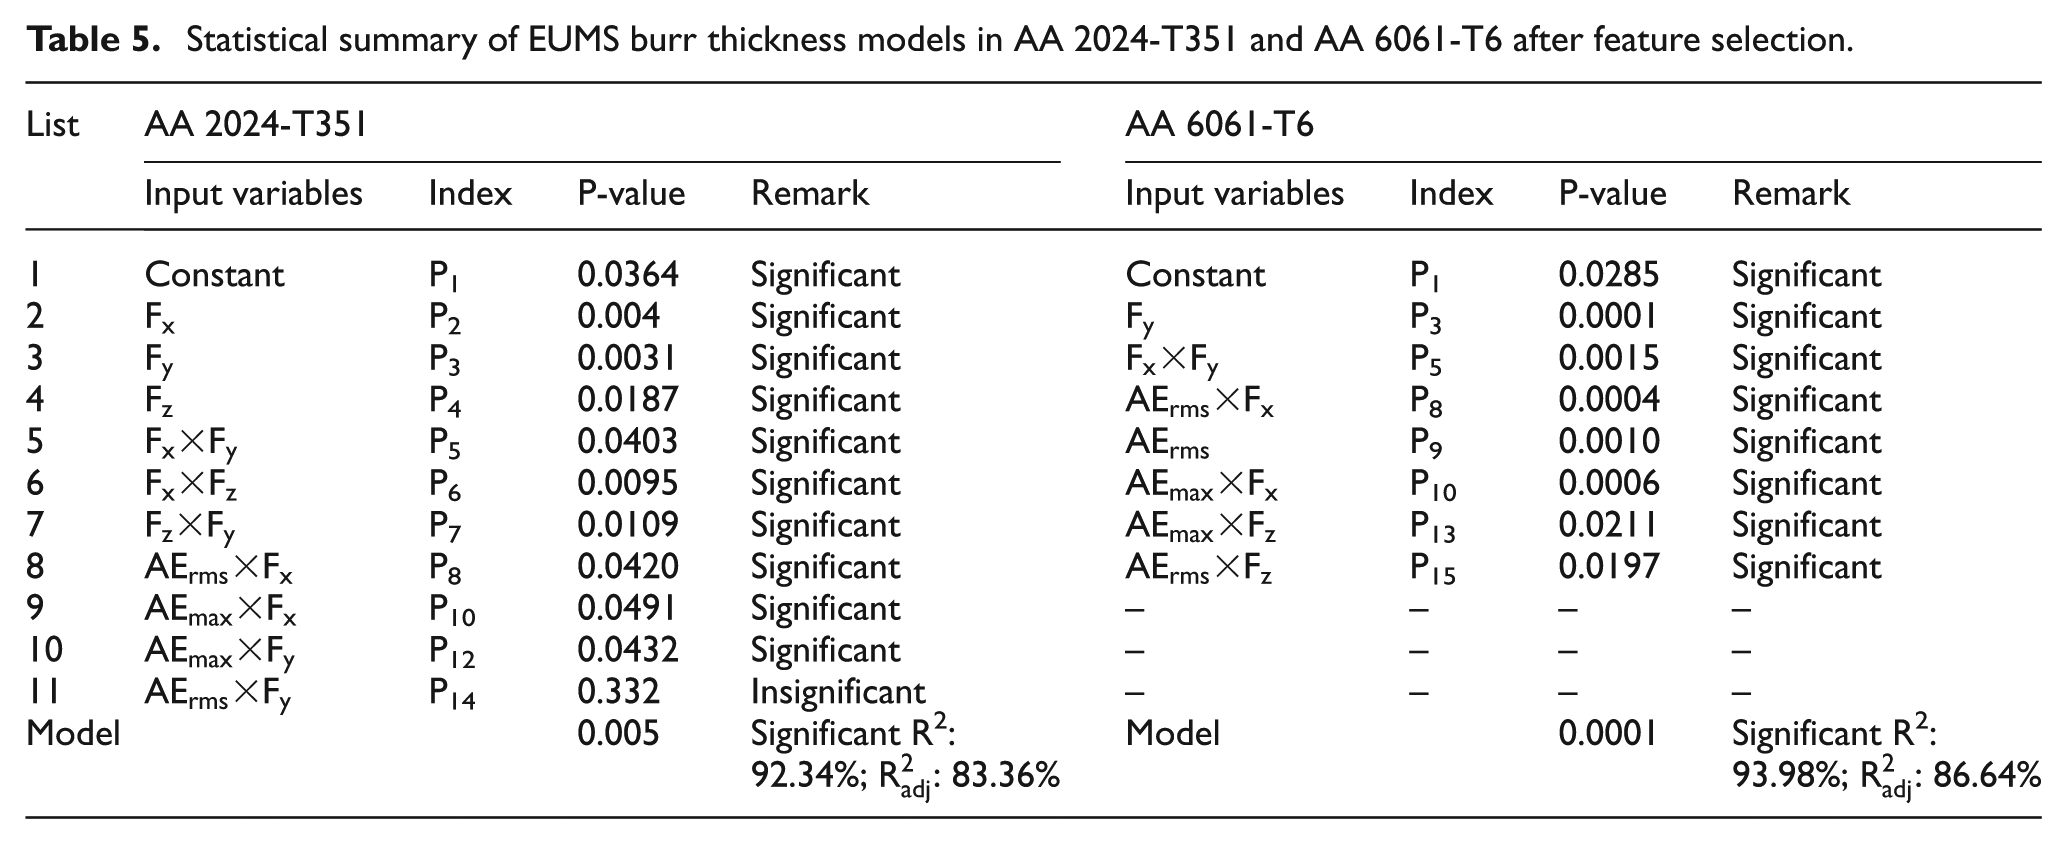
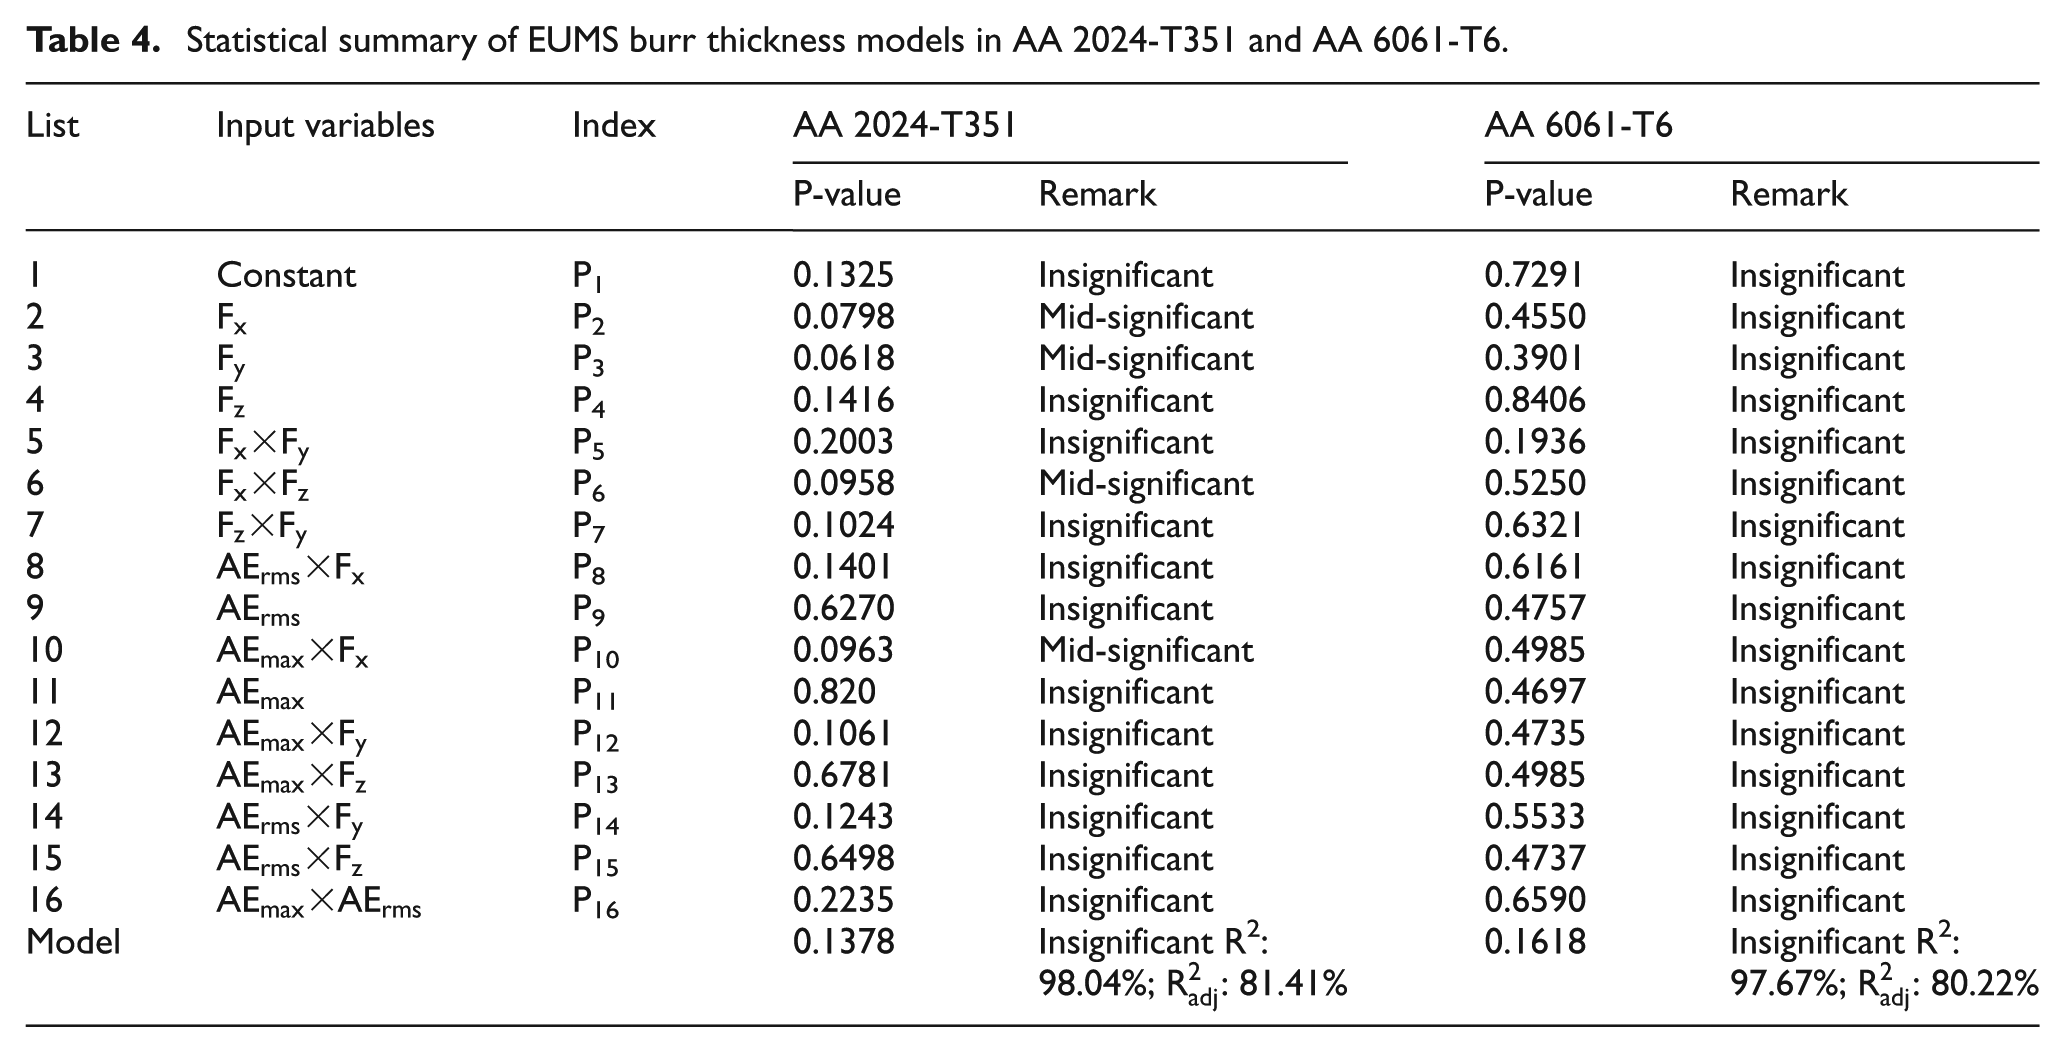
The input layer of multiple regression fitted models to estimate the thickness of EUMS burr in both tested materials is shown in Table 4. The resulted P-value, R2 and
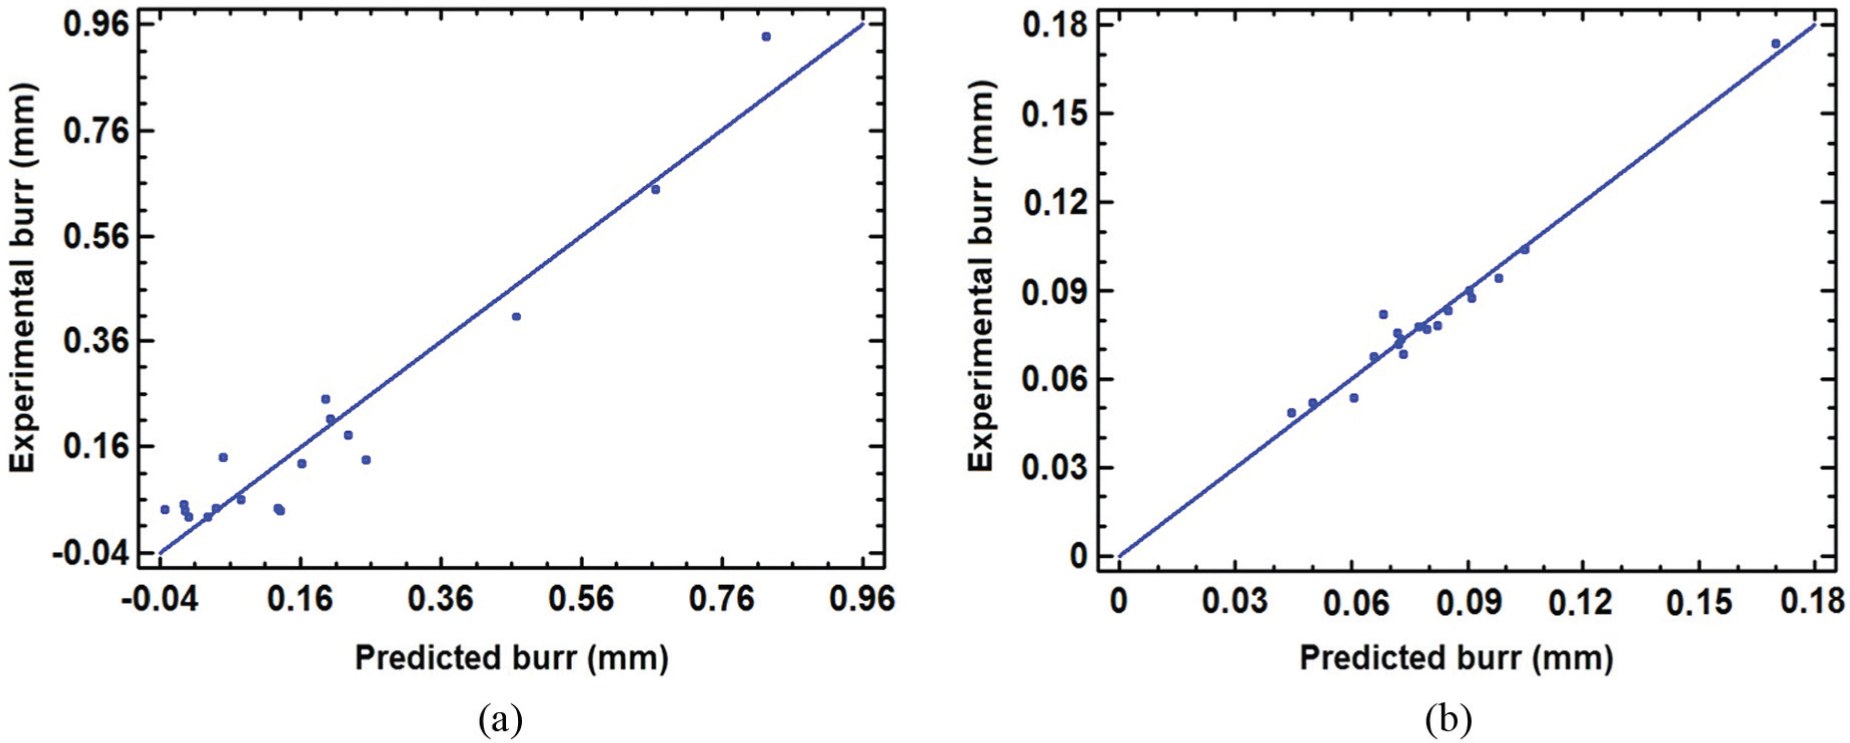
Linear simple regression models of EUMS burr thickness in (a) AA 2024-T351 and (b) AA 6061-T6.
As shown in Table 5, the same procedure was applied on AA 6061-T6 results (see Table 2), and eight insignificant input variables were then removed from the input layer. This led to significant decrease in P-value and an increase in the
Multiple regression fitted equation of EUMS burr thickness for AA 2024-T351
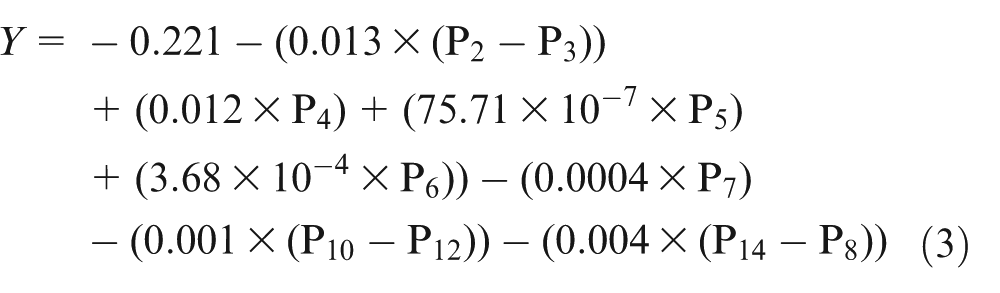
Multiple regression fitted equation of EUMS burr thickness for AA 6061-T6
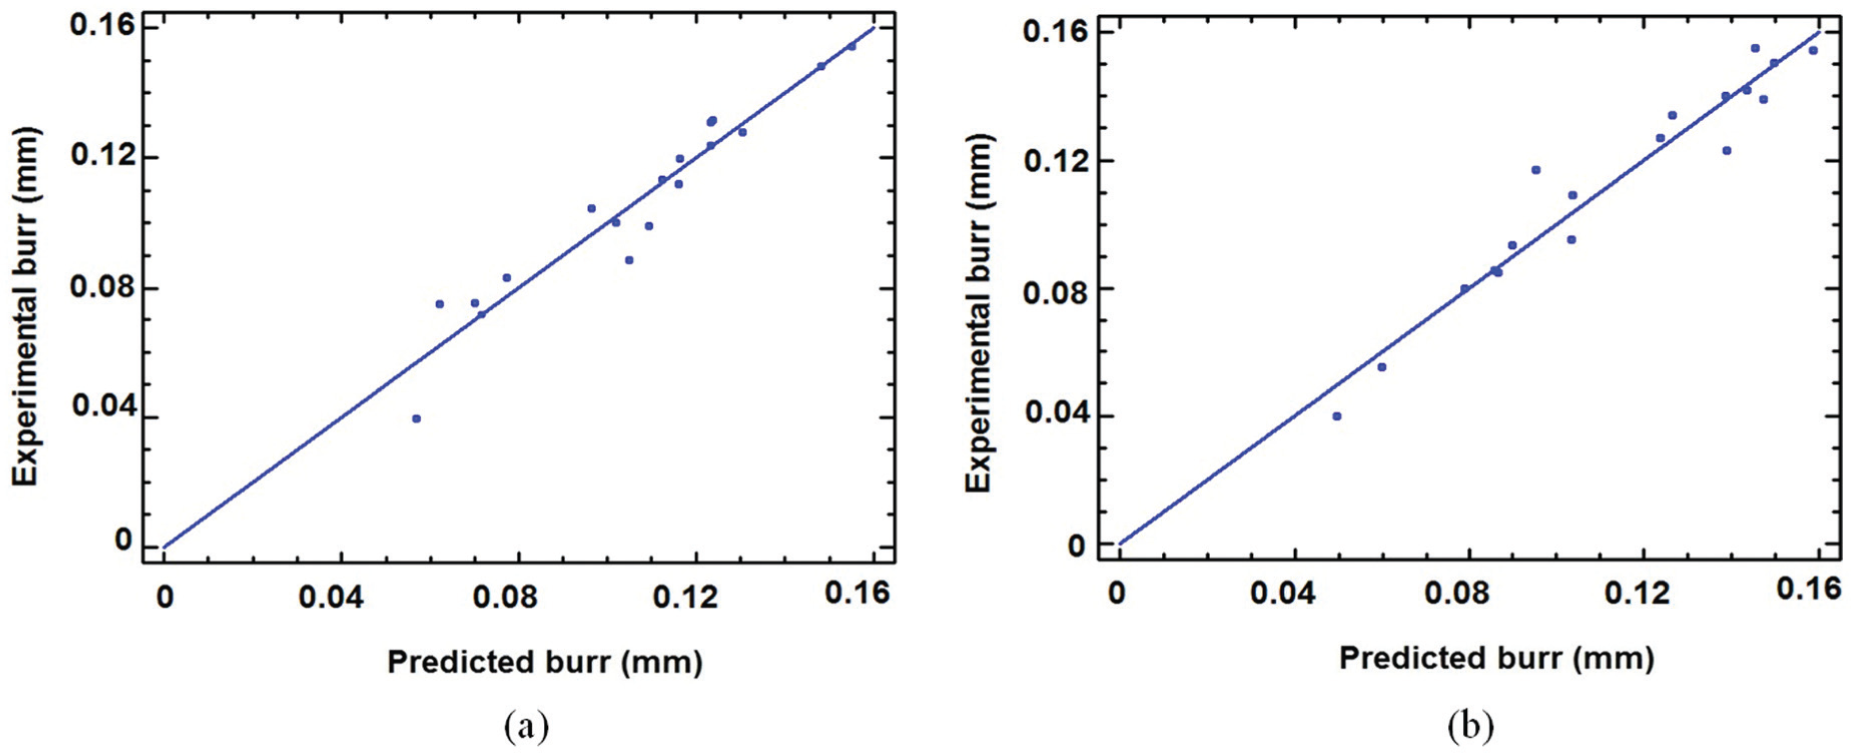
EUMS burr height
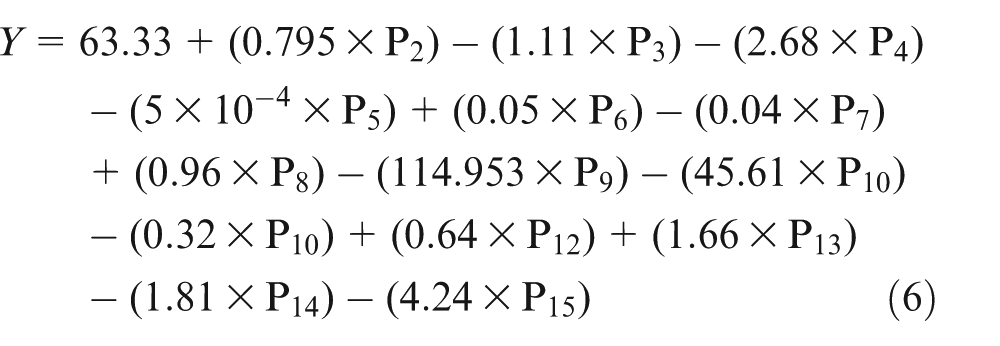
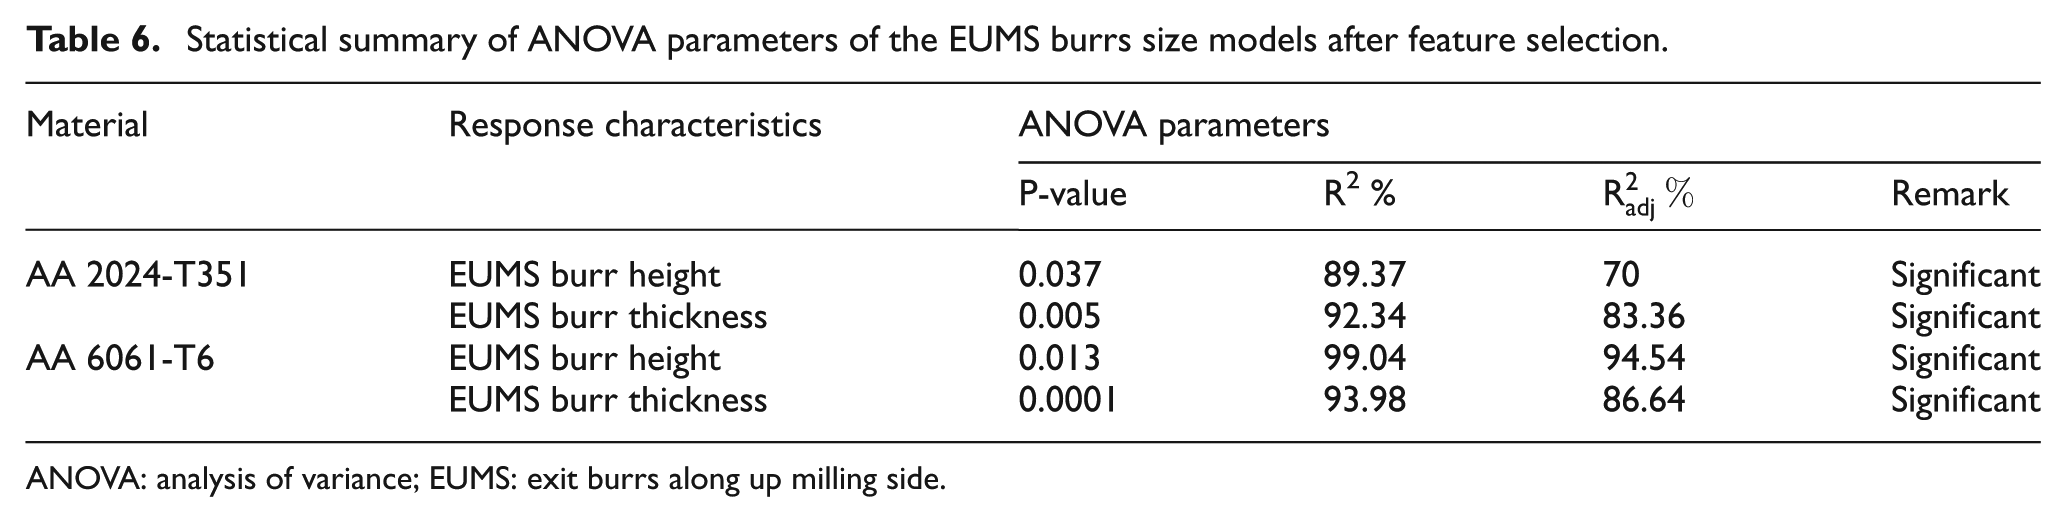
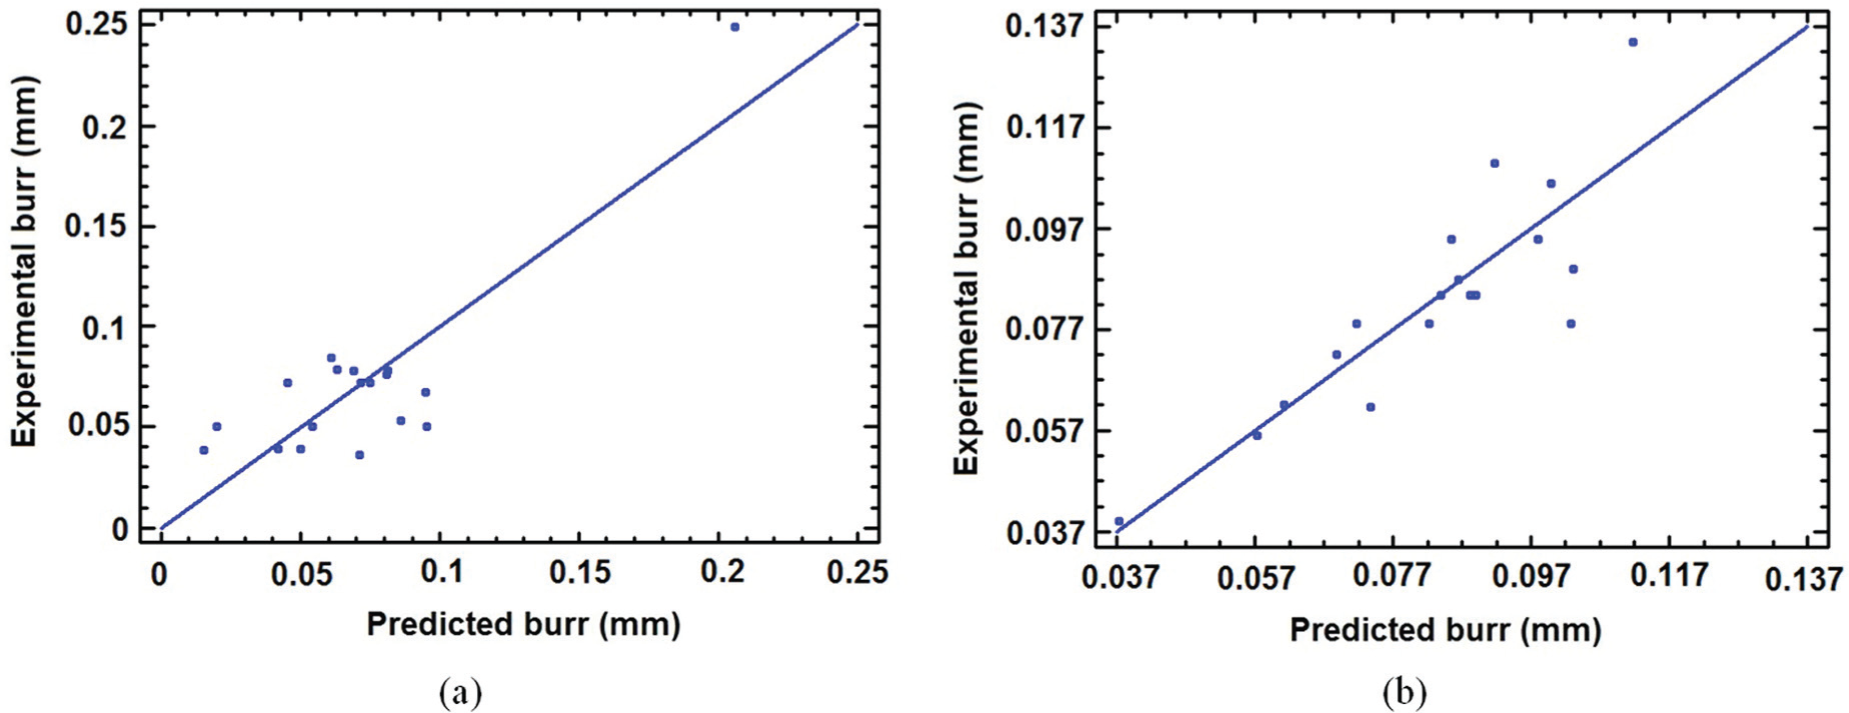
The same procedure as presented earlier was applied on EUMS burr height results in both materials, and multiple regression fitted models were formulated after feature selection (Figure 11; equations (5) and (6)). The statistical summary of EUMS burr height results is presented in Appendix 3. According to Figure 6, feature selection in both materials led to increased
Linear simple regression models of EUMS burr height in (a) AA 2024-T351 and (b) AA 6061-T6.
Multiple regression fitted equation of EUMS burr height for AA 2024-T351
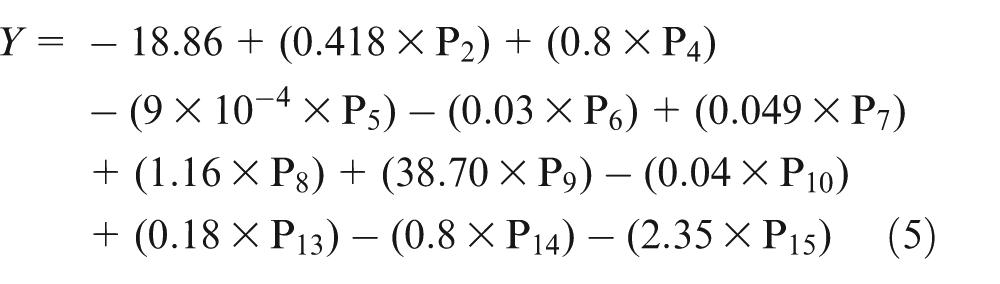
Multiple regression fitted equation of EUMS burr height for AA 6061-T6
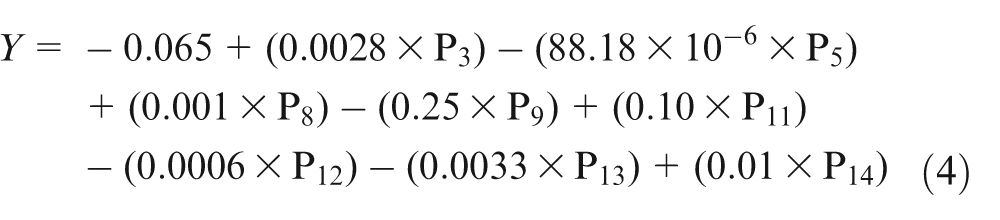
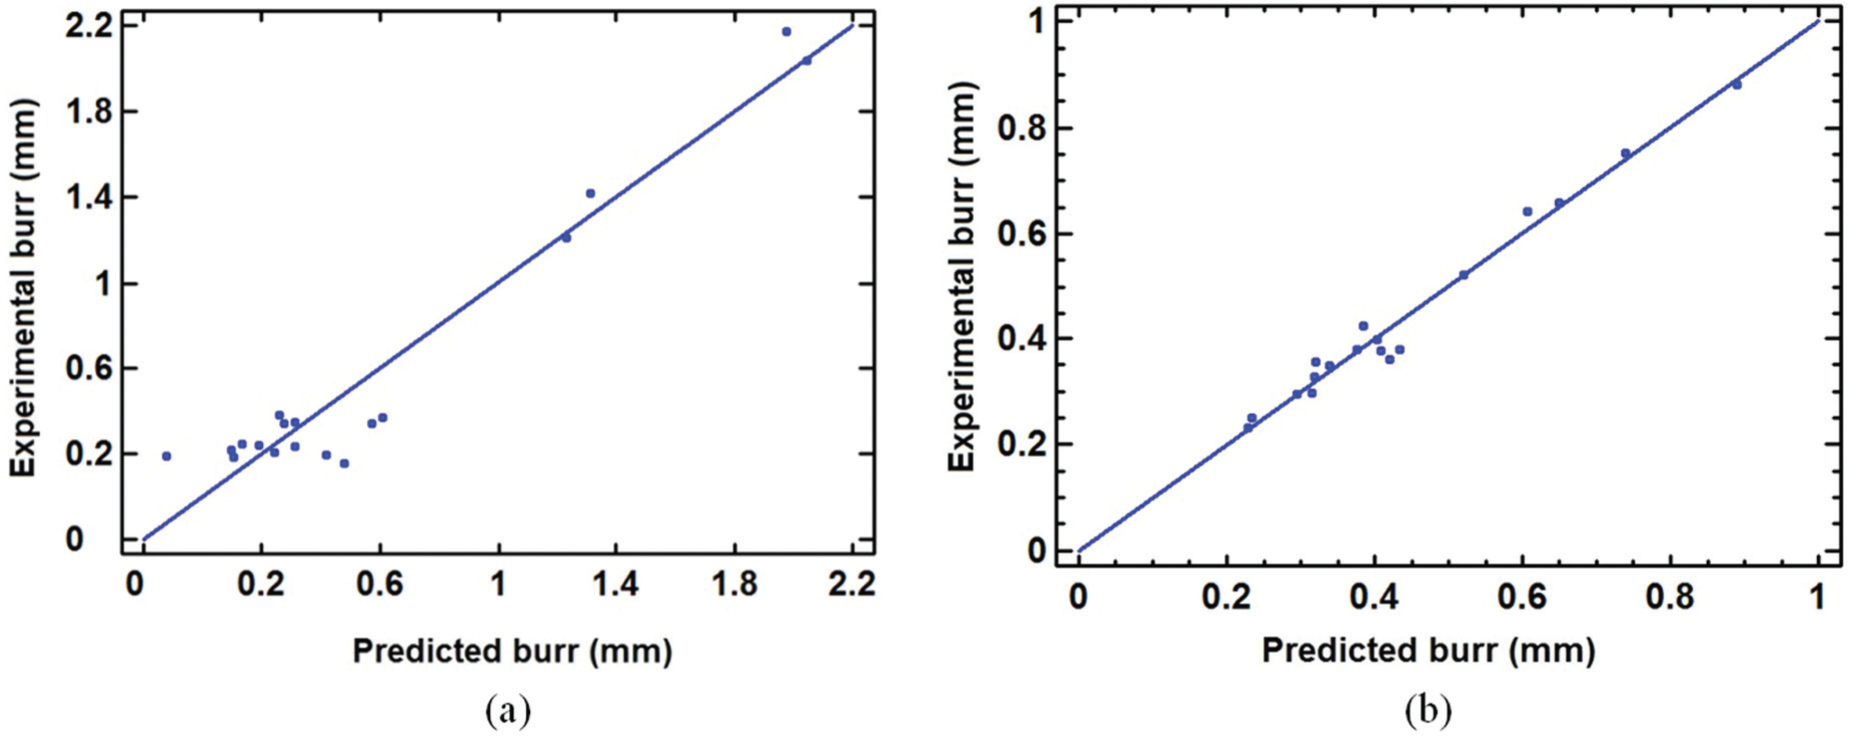
TUMS burrs
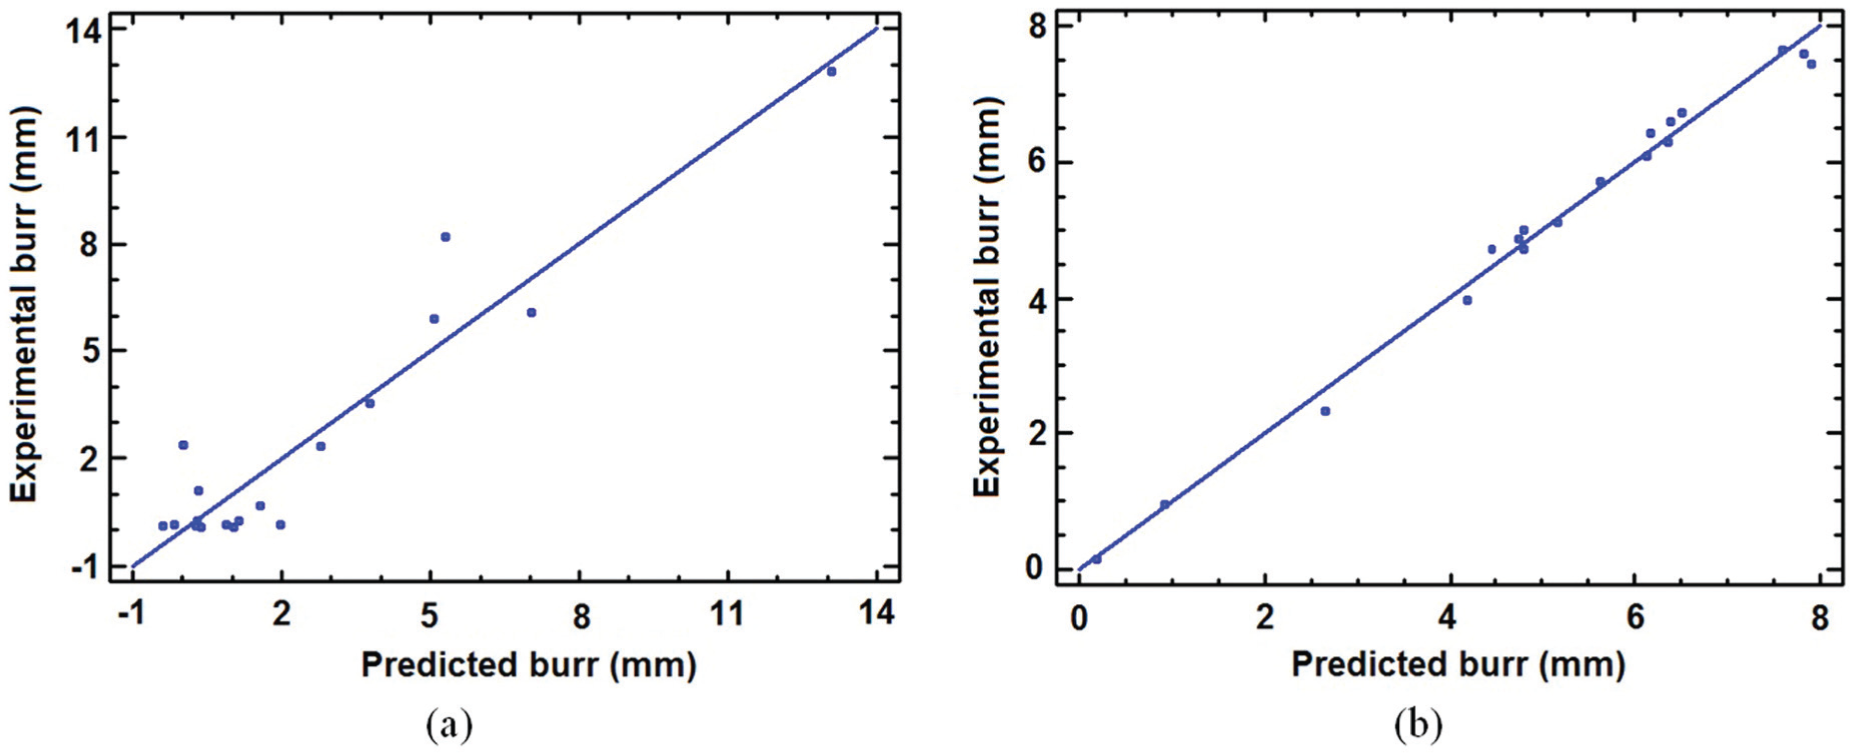
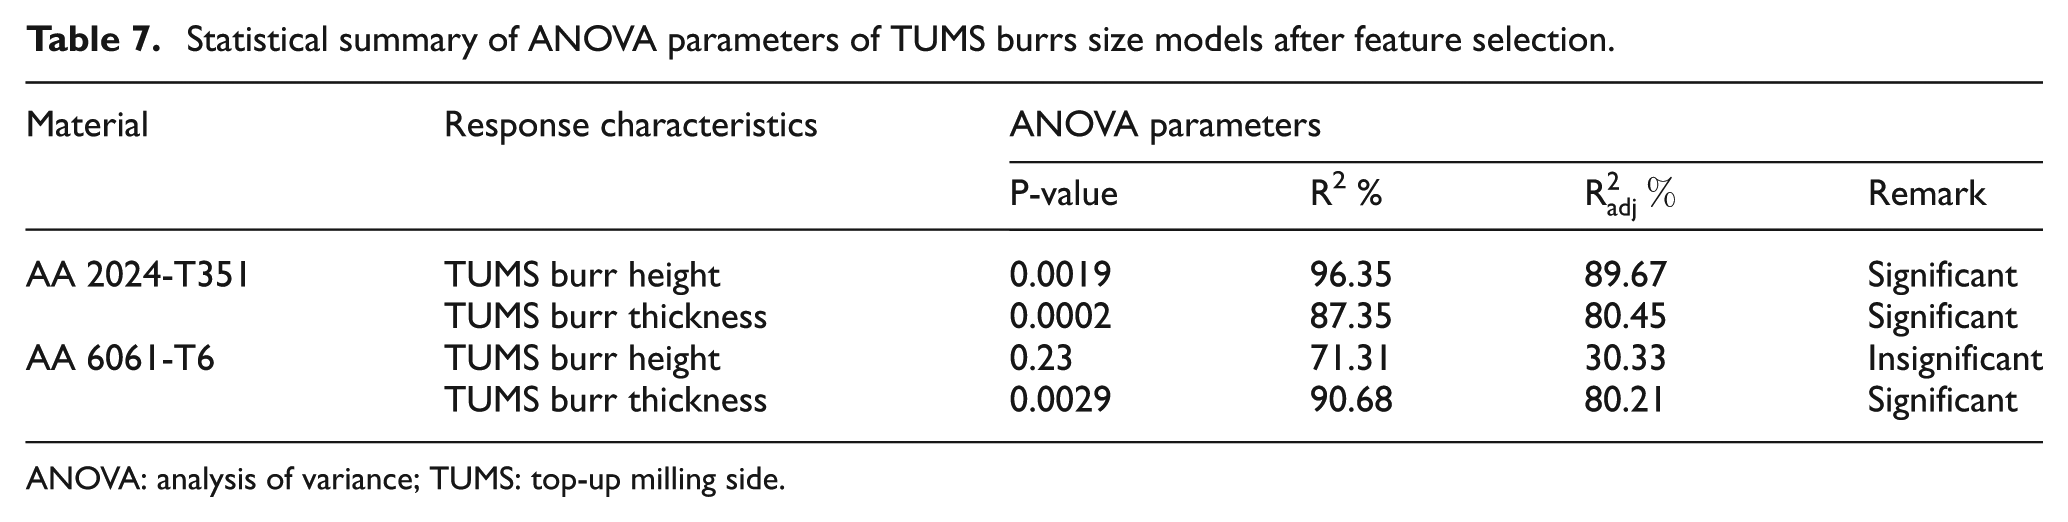
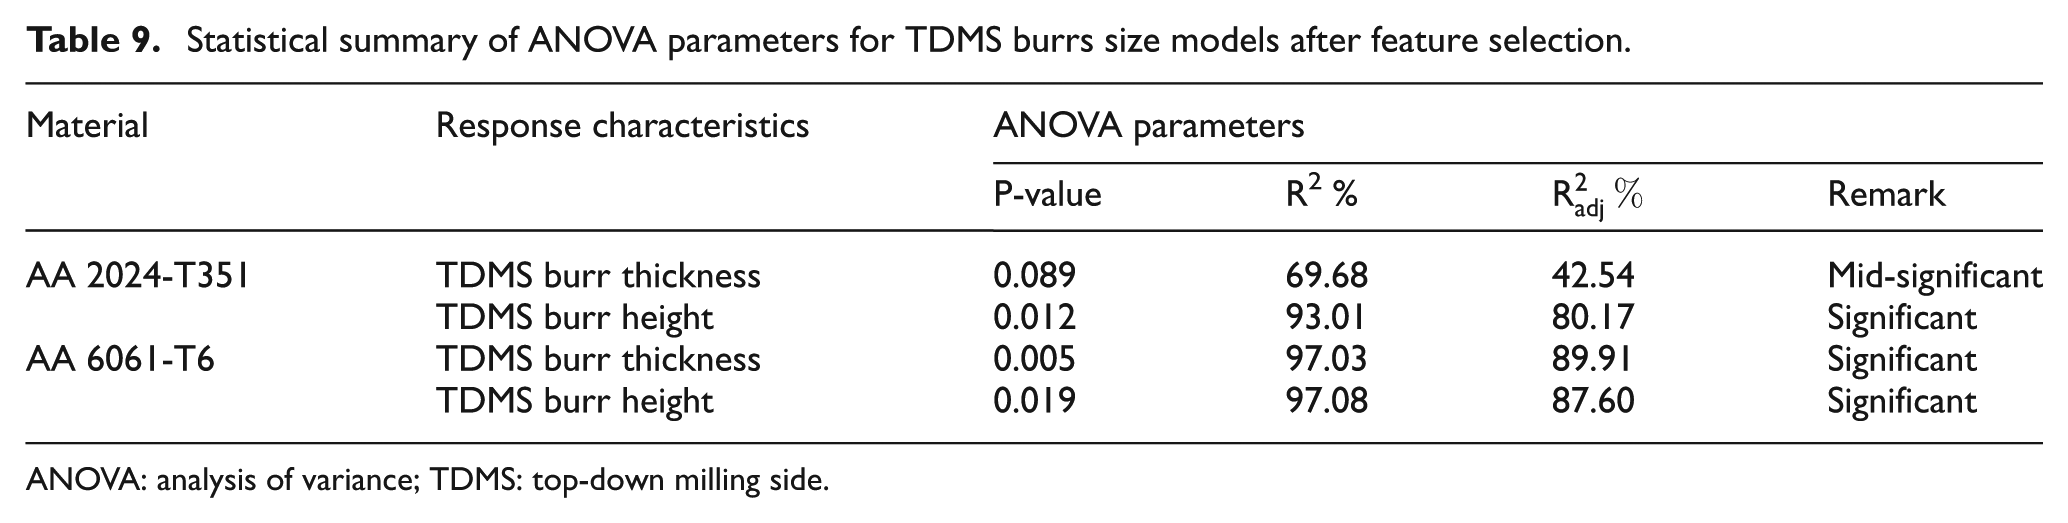
As presented in Figure 7, except the predicted fitted model of TUMS burr height in AA 6061-T6, other fitted models are statistically significant. This denotes that variation of TUMS and EUMS burrs sizes of AA 6061-T6 and AA 2024-T351 (Tables 4–7; Figures 12 and 13) can be controlled by computed information from AE and cutting forces signals. According to Liang and Dornfeld, 29 the main sources of AE and cutting forces in cutting operations are plastic deformation in the workpiece, chip formation, frictional contact between the tool flank face and workpiece resulting in flank wear, frictional contact between tool face and chip resulting in crater wear, collisions between chip and tool, chip breakage and tool fracture. To investigate better the accuracy of the proposed method, the extracted signals information from cutting and exit stages are then combined to construct the input layer of multiple regression fitted models used to predict the size (thickness and height) of TDMS and EBS burrs (see Figures 14–17). As it is evident from Tables 8 and 9, except few cases, the fused signal parameters are sensitive to variation of TDMS and EBS burrs sizes. This denotes that the above-mentioned sources are relatively similar factors governing the burr formation morphology and size.
Statistical summary of ANOVA parameters of the EUMS burrs size models after feature selection.
ANOVA: analysis of variance; EUMS: exit burrs along up milling side.
Statistical summary of ANOVA parameters of TUMS burrs size models after feature selection.
ANOVA: analysis of variance; TUMS: top-up milling side.
Statistical summary of ANOVA parameters for EBS burrs size models after feature selection.
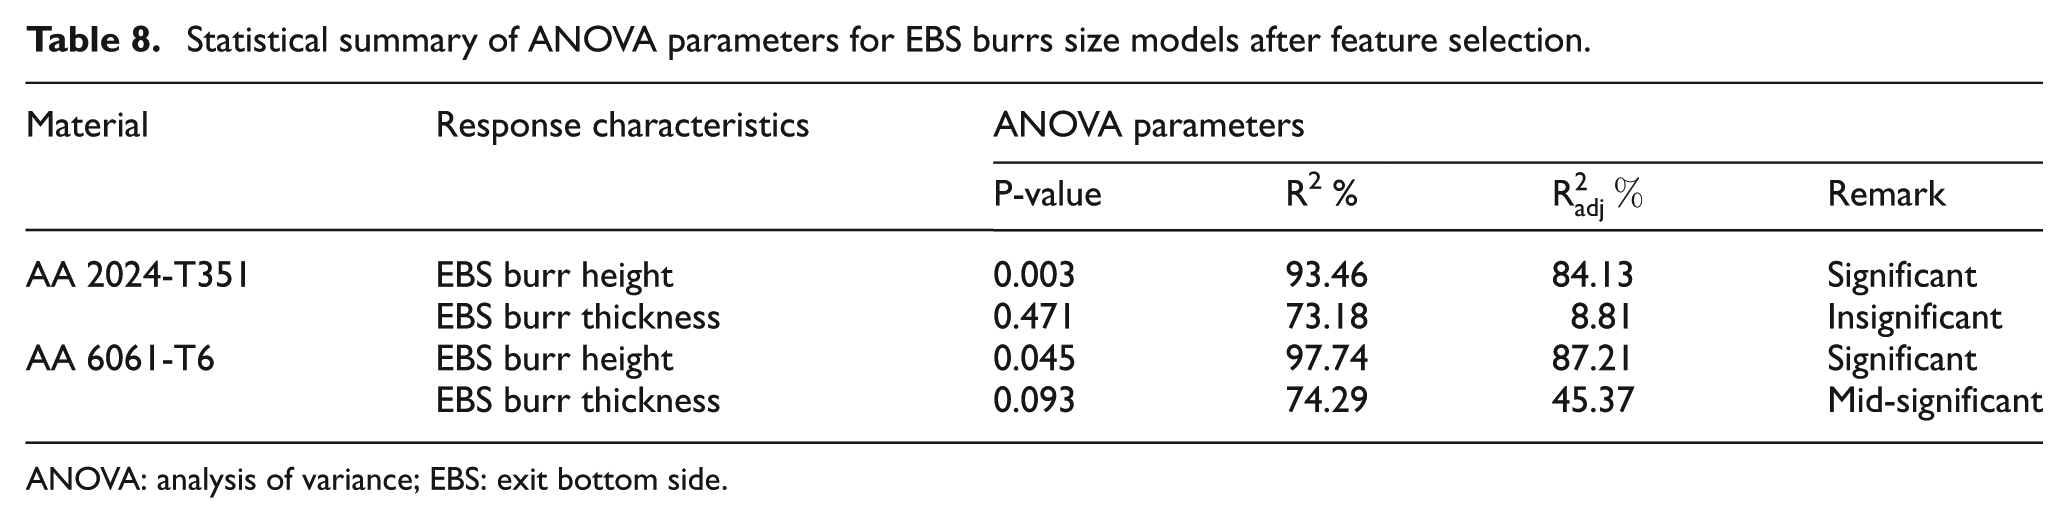
ANOVA: analysis of variance; EBS: exit bottom side.
Statistical summary of ANOVA parameters for TDMS burrs size models after feature selection.
ANOVA: analysis of variance; TDMS: top-down milling side.
Linear simple regression models of TUMS burr thickness in (a) AA 2024-T351 and (b) AA 6061-T6.
Linear simple regression models of TUMS burr height in (a) AA 2024-T351 and (b) AA 6061-T6.
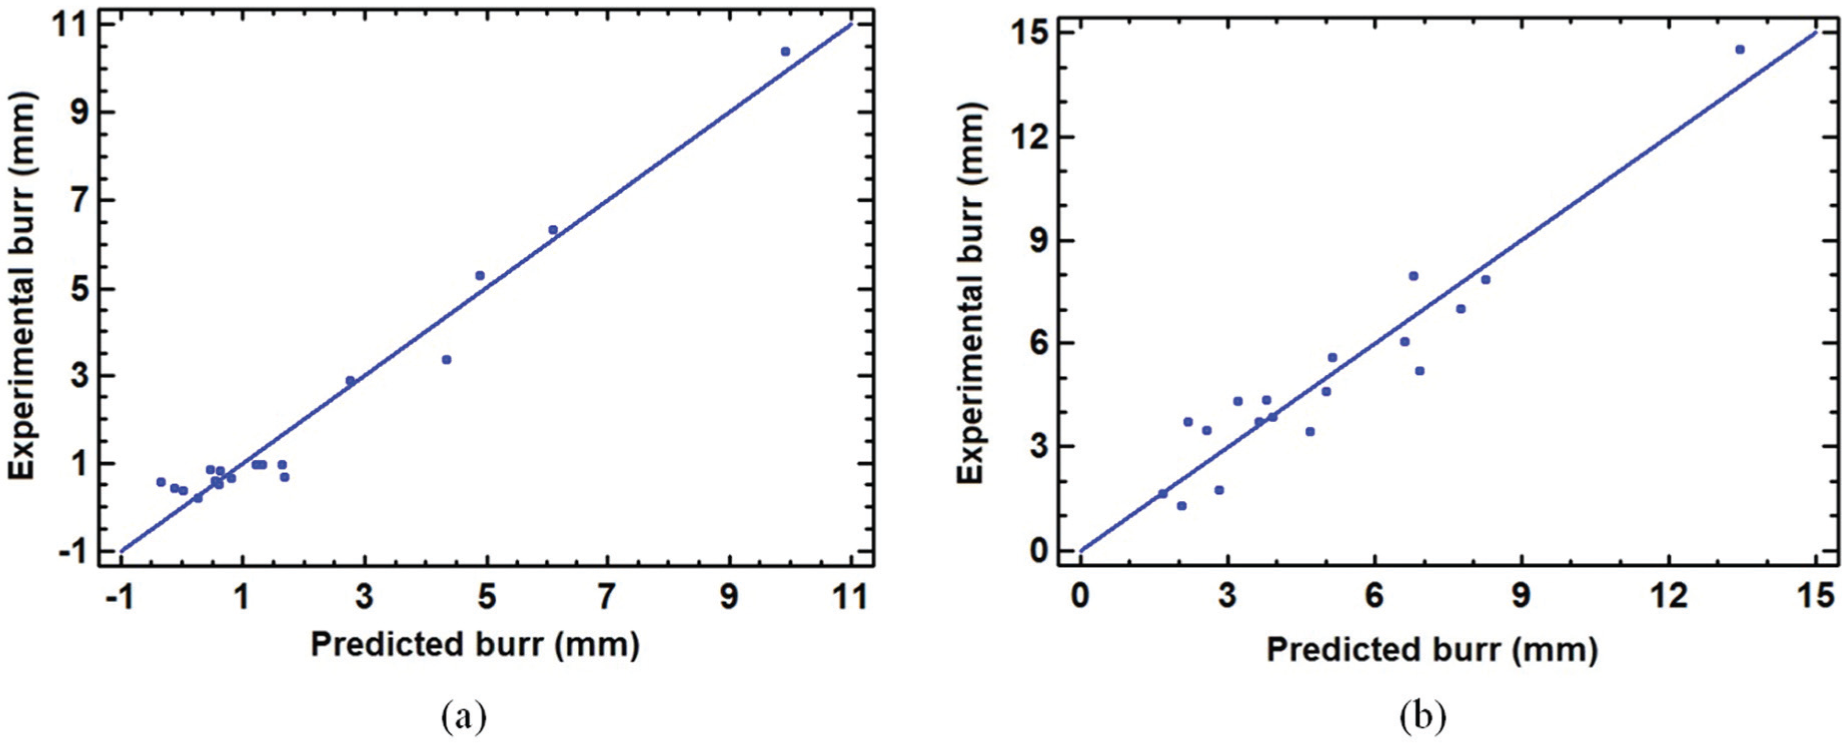
Linear simple regression models of TDMS burr thickness in (a) AA 2024-T351 and (b) AA 6061-T6.
Linear simple regression models of TDMS burr height in (a) AA 2024-T351 and (b) AA 6061-T6.
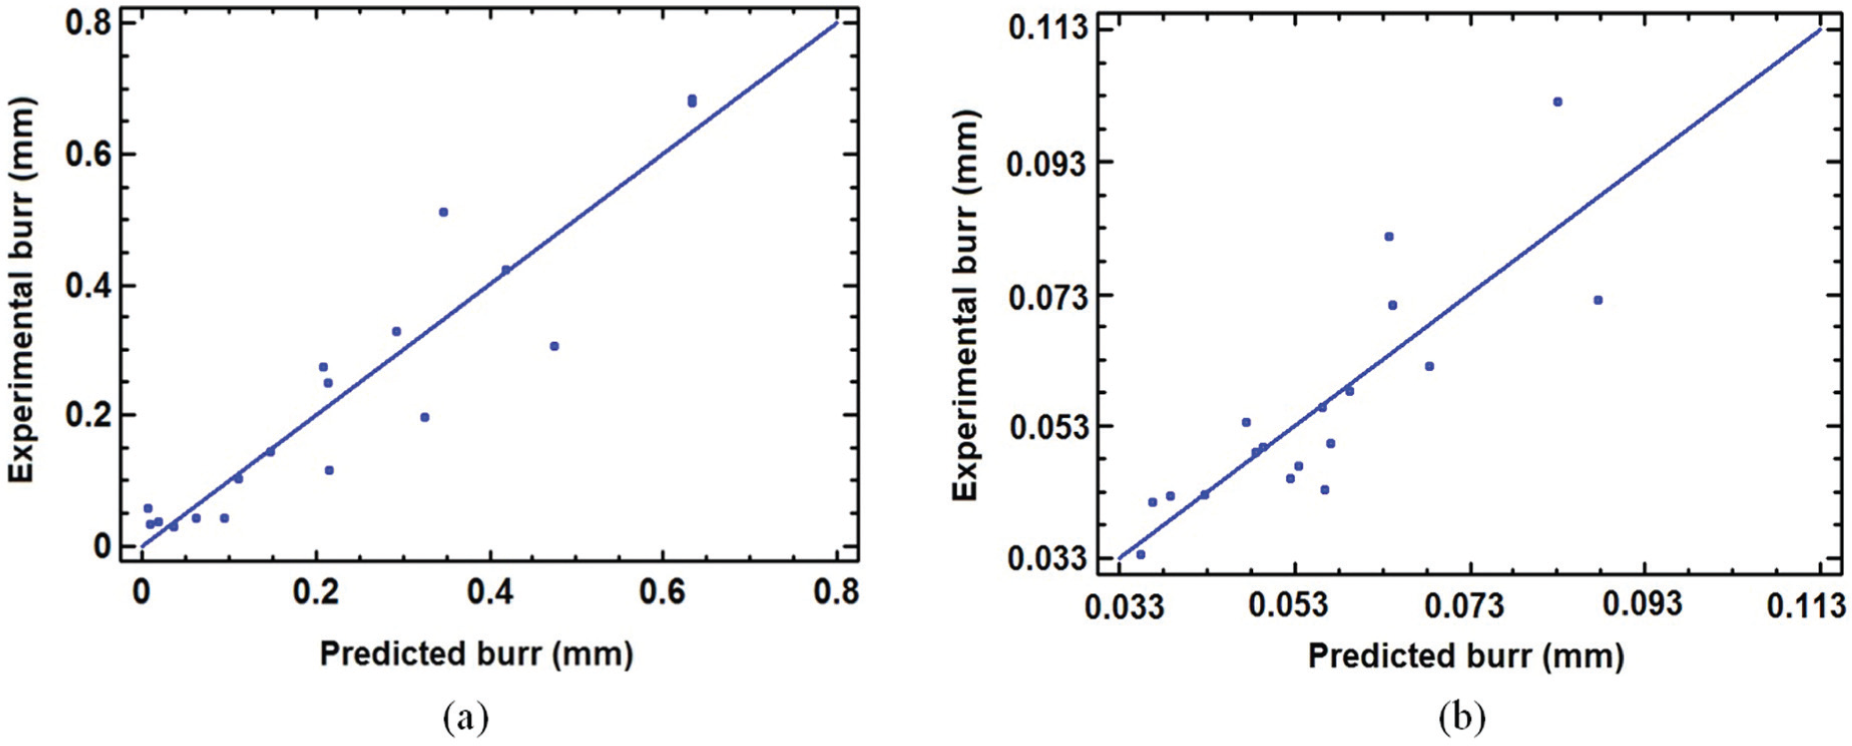
Linear simple regression models of EBS burr thickness in (a) AA 2024-T351 and (b) AA 6061-T6.
Linear simple regression models of EBS burr height in (a) AA 2024-T351 and (b) AA 6061-T6.
Expect minor cases as shown in Tables 6–9, the results in this article confirm the reliability of the proposed methodology and reveal a strong correlation between the milling burrs sizes, AE and cutting force signal information.
In low-elastic modulus materials, such as AAs, lower magnitude of AErms is expected. 32 The low modulus of elasticity is a driver for vibration in machining operations, 33 which has a negative effect on burr formation and burr size. Moreover, knowledge of material deformation properties (e.g. ductility) is also an important criterion for selecting better cutting parameters and predicting or modeling the burr size. In fact, burr size generally increases if ductile materials such as wrought aluminum alloys are used. This reveals that burr size prediction or estimation using signal information and modeling approaches (FEM, analytical, etc.) for ductile materials with low modulus of elasticity (e.g. AAs) is more complex. This denotes that although experimental verification was conducted on aluminum alloys, however, very good correlations were observed between the predicted (fitted) and experimental values of top and exit burrs size.
The findings in this work are in conflict with the critiques raised against the adequacy of AE signal information in milling operation. This denotes that the proposed method can be used as an alternative approach to detect burr formation and possibly estimate the size of top and exit burrs when adequate data acquisition and signal processing are applied. It is to underline that the signals acquired from machining centers (e.g. CNC) can contain certain levels of mechanical, electrical and acoustic noises. These signals can be highly affected by possible deviations in the system. Generally, more complex signals can be observed in milling than those in many other nontraditional machining operations. One solution is to use advanced filtering and anti-aliasing algorithms to suppress signal deviation. The proposed method could be further evaluated for automatic inspection and online burr size measurement.
Conclusion
The principle objective of this work was to present a methodology to evaluate the correlation between burr size attributes (thickness and height) and information computed from AE and cutting force signals.
Through presented results in this work, the following conclusions are drawn:
Due to noncontinuous mode of the cutting process and run-out effects in milling operations, the size of various burrs are not statistically correlated to each other. Moreover, it was observed that the size of milling burrs cannot be precisely formulated as a function of cutting parameters;
The proposed methodology is initially used to investigate the correlation between the sizes of TUMS and EUMS burrs (Figures 6 and 7) and computed information from AE and cutting force signals. Very good correlation was found between experimental and fitted values of TUMS and EUMS burrs (Figures 6 and 7) in both tested materials. It was also observed that the signal information is sensitive to the size of TDMS and EBS burrs (Figures 8 and 9), which are relatively small and thin milling burrs;
It is concluded that the computed information from multiple sensors, including AE and cutting force signals, contains useful information about machining process, tooling and material interactions to be useful for burr formation detection and burr size estimation.
This work can be later integrated into artificial intelligence (AI) techniques (e.g. neural network) to establish a practical burr size estimation model for real-time burr formation detection and burr size measurement. Furthermore, higher levels of frequency range along with advanced filtering and anti-aliasing algorithms are advised to record less distorted signals. To avoid large number of experimental tests, theoretical prediction of the cutting forces and AE signal parameters with respect to cutting conditions used is a suitable approach.
Footnotes
Appendix 1
The linear multiple regression models can be presented as follows
where Y is the dependent variable; x1, x2,…, xk are the process variables; βi determines the contribution of independent process variables xi and ε is random error.
Appendix 2
Description of statistical parameters used:
Appendix 3
ANOVA of EUMS burr height models for AA 2024-T351 and AA 6061-T6 after feature selection.
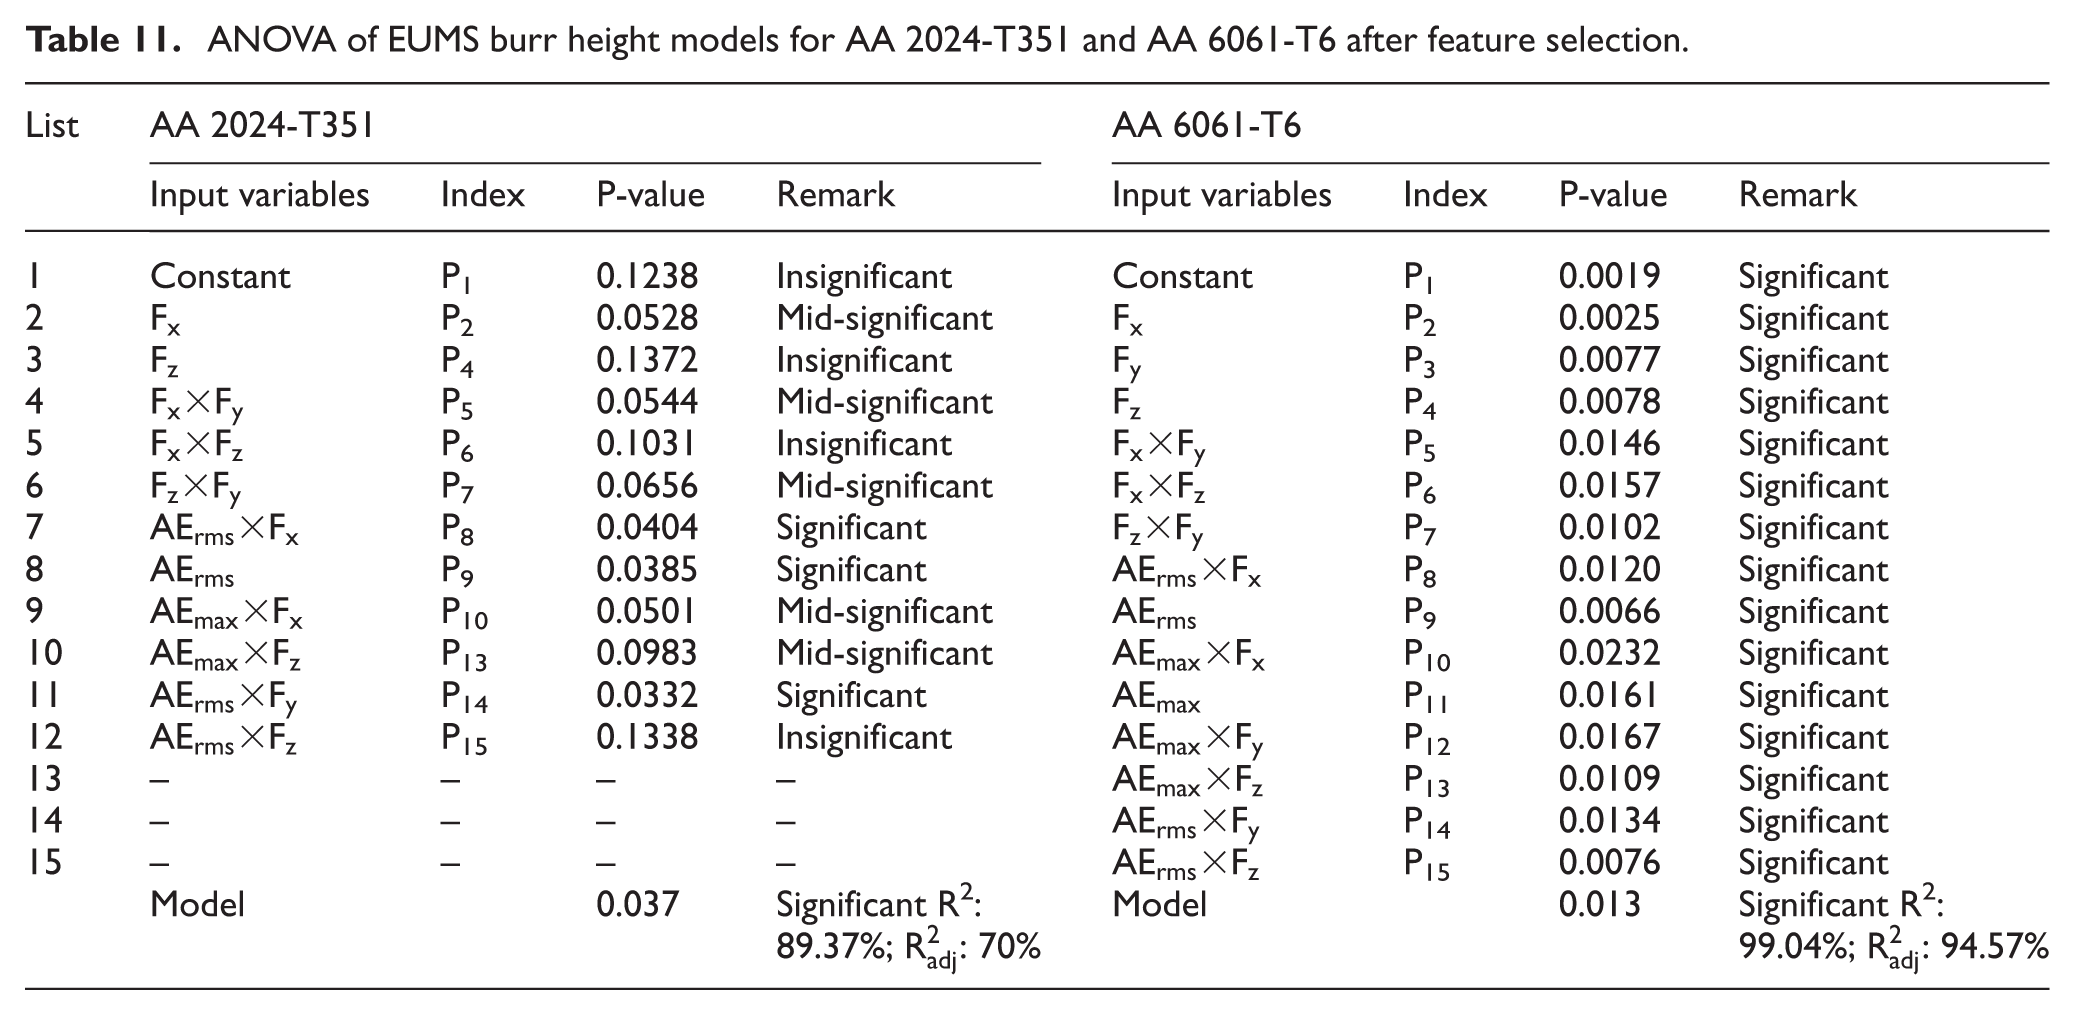
| List | AA 2024-T351 |
AA 6061-T6 |
||||||
|---|---|---|---|---|---|---|---|---|
| Input variables | Index | P-value | Remark | Input variables | Index | P-value | Remark | |
| 1 | Constant | P1 | 0.1238 | Insignificant | Constant | P1 | 0.0019 | Significant |
| 2 | P2 | 0.0528 | Mid-significant | P2 | 0.0025 | Significant | ||
| 3 | P4 | 0.1372 | Insignificant | P3 | 0.0077 | Significant | ||
| 4 | P5 | 0.0544 | Mid-significant | P4 | 0.0078 | Significant | ||
| 5 | P6 | 0.1031 | Insignificant | P5 | 0.0146 | Significant | ||
| 6 | P7 | 0.0656 | Mid-significant | P6 | 0.0157 | Significant | ||
| 7 | P8 | 0.0404 | Significant | P7 | 0.0102 | Significant | ||
| 8 | P9 | 0.0385 | Significant | P8 | 0.0120 | Significant | ||
| 9 | P10 | 0.0501 | Mid-significant | P9 | 0.0066 | Significant | ||
| 10 | P13 | 0.0983 | Mid-significant | P10 | 0.0232 | Significant | ||
| 11 | P14 | 0.0332 | Significant | P11 | 0.0161 | Significant | ||
| 12 | P15 | 0.1338 | Insignificant | P12 | 0.0167 | Significant | ||
| 13 | – | – | – | – | P13 | 0.0109 | Significant | |
| 14 | – | – | – | – | P14 | 0.0134 | Significant | |
| 15 | – | – | – | – | P15 | 0.0076 | Significant | |
| Model | 0.037 | Significant R2: 89.37%; |
Model | 0.013 | Significant R2: 99.04%; |
|||
Acknowledgements
The authors acknowledge the helps from Dr Kamguem and A. Tiabi during experimentation.
Declaration of conflicting interests
The authors declare that there is no conflict of interest.
Funding
This work was financially supported by Natural Sciences and Engineering Research Council of Canada (NSERC) and Fonds Québécois de la Recherche sur la Nature et les Technologies (FQRNT) by the intermediary of the Aluminum Research Centre Canada—REGAL.