
Abstract
An investigation was conducted to explore the mechanisms of the scratching of monocrystalline silicon carbide with a single diamond grit. The scratching was repeated on a silicon carbide workpiece to generate different wear shapes of the diamond grit. The forces were recorded during each scratching and the wear of the diamond grit together with the silicon carbide morphologies was monitored at a fixed interval. Based on the different diamond wear shapes determined through scratching experiments, a smoothed particle hydrodynamics method was used to simulate the scratching process. In addition to the items monitored in the experiments, the simulation was also used to analyze the change of subsurface damages on silicon carbide and to predict the mechanisms of diamond damage. It is shown that double-edged abrasive grits might lead to a better silicon carbide surface quality in scratching. The simulation results indicate that the maximum equivalent stress distribution might be used to predict the damage of the diamond grits during scratching. The findings of this article will be of benefit to the optimal selection of machining parameters and the optimal design of diamond tools for abrasive machining of monocrystalline silicon carbide.
Keywords
Introduction
As a semiconductor material, monocrystalline silicon carbide (SiC) has a wider band gap, higher critical electric field strength, and higher saturation mobility. Due to its high hardness, brittleness, high temperature resistance and other characteristics, it has been widely used in light-emitting diode (LED) substrates, optical devices, and many other fields. With the development of manufacturing technology, the requirements for the surface and subsurface quality of monocrystalline SiC are becoming higher and higher. In the process of manufacturing optical devices or LED substrates, ultra-precision grinding technology has become one of the key methods for processing monocrystalline SiC. However, due to the extremely high hardness and brittleness of monocrystalline SiC, the grinding processes often inevitably cause damage to the surface and subsurface of SiC, so the subsequent polishing process must be used to eliminate the damage caused by the grinding process, thereby greatly affecting the whole processing efficiency.
In order to reveal the mechanisms of the grinding of hard and brittle materials, scratching using a single diamond grit is one of the most popular methods for a thorough study of the entire grinding process. Previous studies have shown that the number of cutting edges, 1 shape, 2 different crystal planes, 3 and the geometry angle of the diamond grit 4 have significant impacts on the scratching force, crack formation and brittle–ductile transition. According to previous research, diamond abrasive grits usually show varying degrees of wear due to chemical reactions, graphitization, atomic diffusion, fatigue, adhesion, and other reasons. 5 After wear, the shape will change greatly and this change is related to the anisotropy of the diamond material. 6 During the grinding of granite using a brazed diamond grinding wheel, 7 it was found that the breakage of diamond grits is highly dependent on the exposure height of the diamond grits. Moreover, the mechanical wear of diamond grits is greatly related to the diamond size. 8
Although scratching is studied widely through experiments, there are still limitations in exploring the removal mechanism of brittle materials only through experimental methods. Even with the most advanced high-speed cameras, it is still difficult to observe the occurrence of cracks, propagation, material removal, and surface damage during scratching. The maximum value of the sampling frequency of a dynamometer limits the number of points collected in scratching, which is not enough to analyze the processing details.
In addition to experiments, simulation methods are increasingly applied to study the mechanisms of the abrasive machining of hard and brittle materials, in which case the mesh-based finite difference method (FDM), finite element method (FEM), and meshless methods are mainly used to simulate the grinding of brittle materials at the microscale. Although grid-based numerical methods have been widely used in computational solid mechanics calculations, there are still some unresolved issues in the simulation of brittle materials processing, such as large deformations, deformation boundaries, and free surface. In the case of the meshless method, a smoothed particle hydrodynamics (SPH) method has been developed relatively perfect and has achieved good performance in the simulation of machining processes.9–11 For example, crack propagation and the formation of discontinuous fragments were analyzed using SPH to simulate the cutting of K9 glass. 12 Through the simulation of the cutting of monocrystalline SiC by SPH, the maximum undeformed cutting thickness of monocrystalline SiC was found to be 0.35 μm, and it increased with the increase of the scratch speed. 13 The removal mechanism of the ultrasonic-assisted grinding of SiC ceramics was also studied by experiments and SPH simulation. 14 The SPH-FEM coupled method was proposed by Andrea et al. 15 and developed by Sun et al., 16 which has a great advantage in dealing with the two-phase fluid–solid problem.
Unlike most previous studies, a series of experiments were designed in this work to reveal the effects of diamond shape changes during a whole scratching process, in which case the scratching was repeated on monocrystalline SiC materials to generate different wear shapes of the diamond grit. Allowing for the limitation of experiments, SPH was also applied in this work to simulate the scratching of monocrystalline SiC with different shapes of diamond grits.
Experimental
Experimental set-up for scratching
Figure 1 shows a schematic diagram of the test set-up for a single-diamond-grit scratch. Scratching experiments are performed on a PLANOMAT HP408 high-precision surface grinder. The accuracy of the machine tool can reach micron levels. A steel pillar with a brazed diamond grit was fixed onto an aluminum plate of 290 mm diameter, thereby forming a scratching plate. The workpiece and fixture were fixed on the workbench by magnetic force, which could move in the horizontal direction. Before experiments, the clamping accuracy of the workpiece was checked with a dial indicator to ensure the flatness of the workpiece during the experiment. No coolant was added during the experiment.
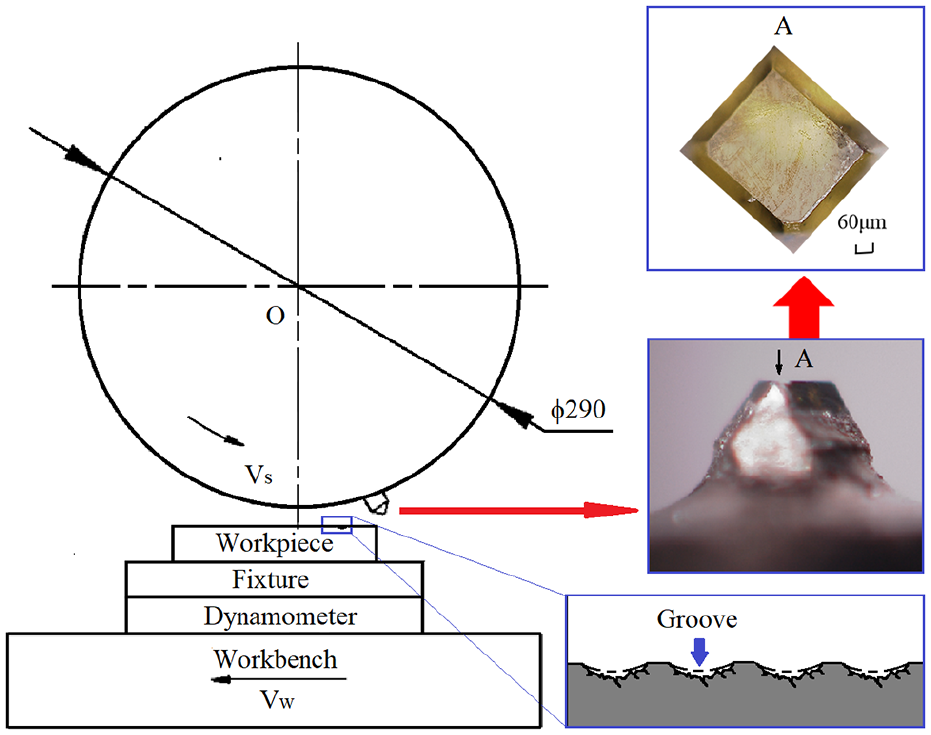
Schematic diagram of the experimental set-up.
Diamond abrasive grits (SDB1125) with the mesh size of 30/35 and a relatively complete crystal shape were selected for brazing, which was conducted in vacuum. The workpiece for the scratch test is a double-side polished monocrystalline SiC wafer of 2 in. diameter. The surface roughness of the wafer is 0.95–1.91 nm and the thickness is 5 mm. During each scratching, the forces were measured by a piezoelectric dynamometer (Kistler 9119A).
Details of scratching experiments
While the aluminum plate rotates counterclockwise, the workbench moves from left to right at a given speed. The separation interval of the grooves can be controlled by setting an appropriate speed of the workbench for the scratch experiment, thereby achieving the control of the scratch length.
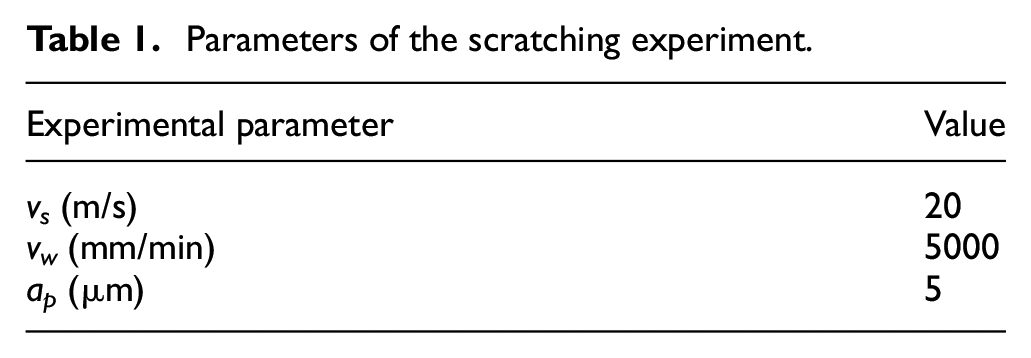
Since the diameter of the SiC workpiece is 2 in., we set the interval of the grooves to be 4 mm. As such, the scratch length can be better controlled and easily measured. The speed of the workbench can be calculated by equations (1) and (2) 17

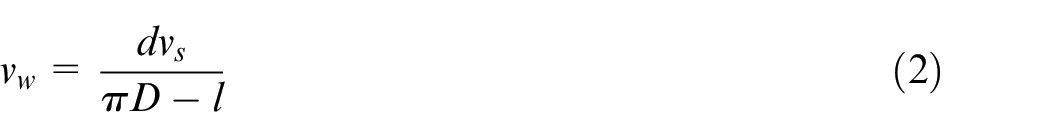
where l is the contact arc length, D is the diameter of the aluminum plate, Ds is the equivalent diameter of scratch, ap is the depth of scratch, vs is the linear velocity of the matrix, vw is the speed of the workbench, and d is the interval of the grooves. The other scratching parameters in the experiment are shown in Table 1.
Parameters of the scratching experiment.
The entire experiment was based on a continuous scratch test with a diamond grit of a complete crystal shape, and the entire process of change of the diamond grit from the complete shape to large pieces of damage was monitored. During the experiment, the single-grit scratch test and the shape detection of the diamond grit were alternately performed. In order to ensure that the scratching direction is the same during the scratching process, the calibration experiment of the scratching direction was repeatedly performed after each damaged shape detection of the diamond grit and before the scratching experiment. The corresponding shape imprint was compared with the first shape imprint. The subsequent scratch experiment can be performed until the direction of the shape imprint is the same.
The damages of diamond grits and the morphologies of the SiC wafer were observed using a HIROXKH-8700 microscope at a fixed interval.
Results of experiments
Typical damaged shapes of diamond grits at different wear stages
In order to quantitatively describe the damages of the diamond grit at different wear stages, the distance between the two cutting edges generated by the wear of the diamond grit perpendicular to the scratching direction is defined as the distance of the cutting edge. Figure 2 shows the plot of the distance of cutting edges versus scratching distance, indicating the quantitative change of grit damage. Figure 2 also indicates the changing trends at different stages, which might be used to adjust the wear process during scratching.
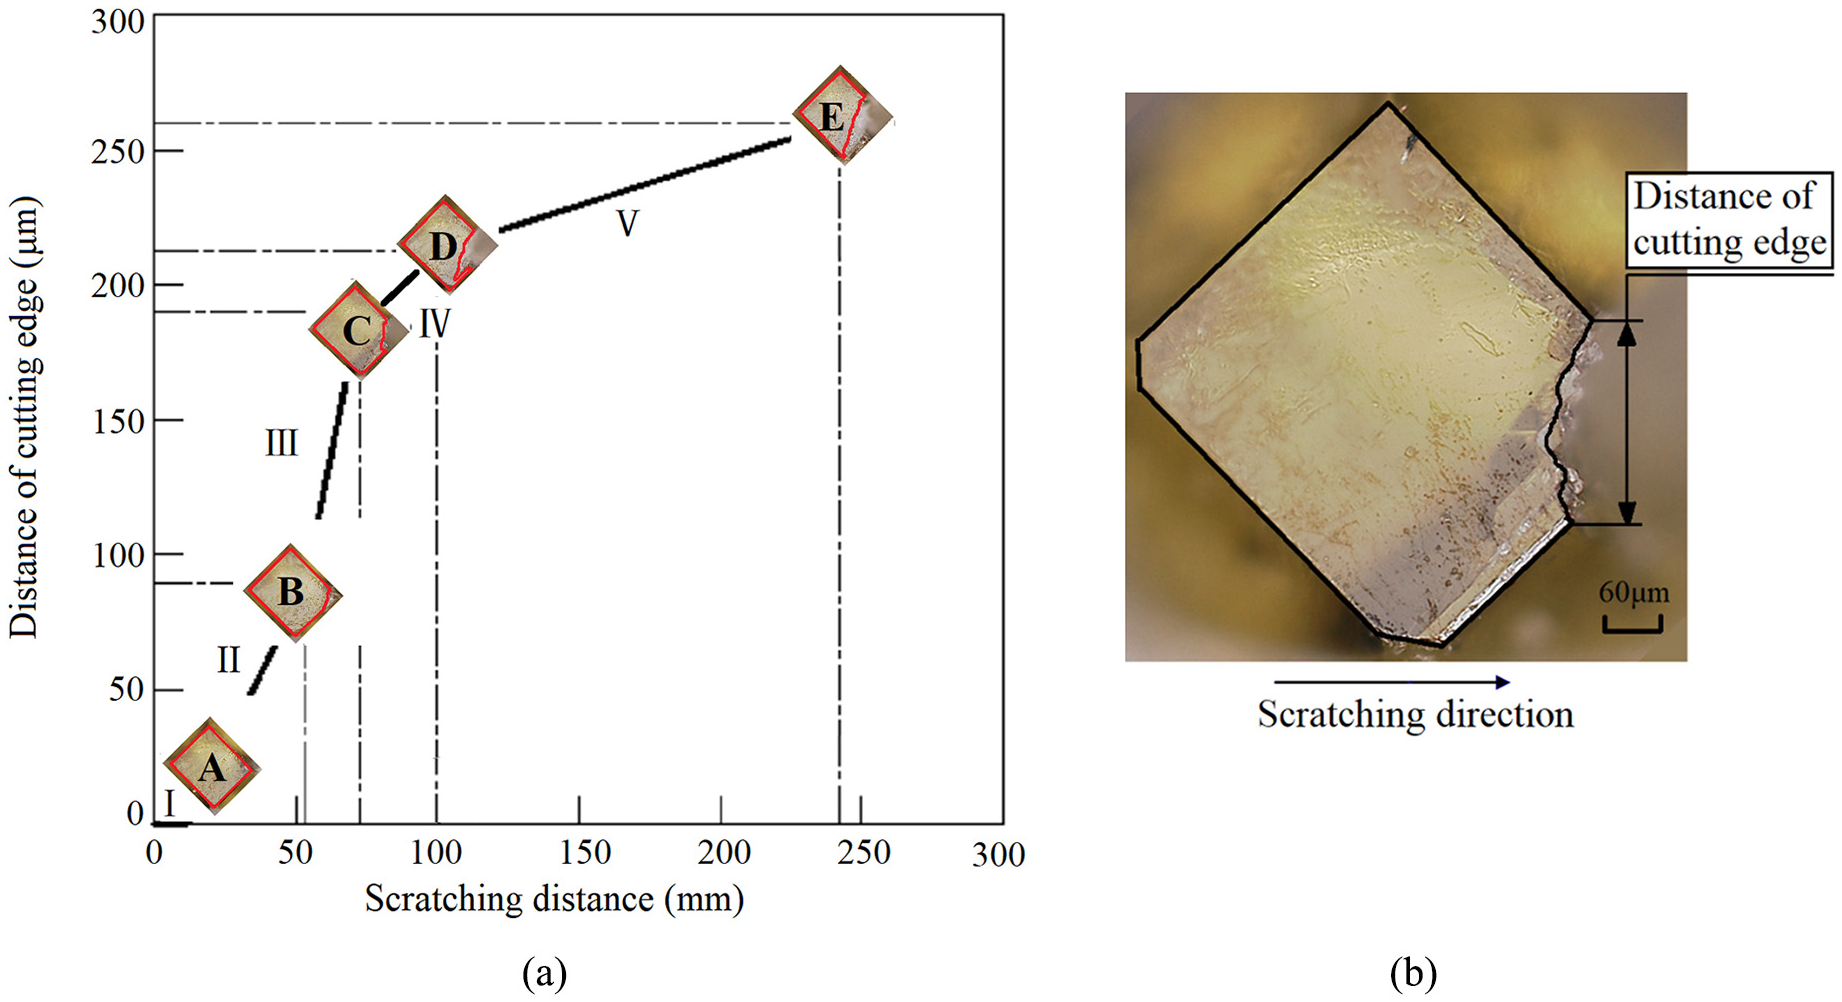
Schematic diagram of the damage process of diamond grits: (a) damage process of diamond grits and (b) definition of the distance of the cutting edge.
It can be seen from Figure 2 that, at damaged stage I, the scratch length reaches 11 mm, the diamond grit still retains its complete shape (A shape), and the scratch time is only 0.55 ms. At stage II, the scratch length reaches 52.8 mm and the diamond grit attains shape B. The time interval of the change from shape A to shape B is 2.1 ms. At stage III, the scratch length is 72.6 mm with the diamond grit attaining shape C and the time interval is 1 ms. At stage IV, the scratch length is 99 mm, while the diamond grit attains shape D and the time interval is 1.3 ms. From stage IV to stage V, it takes quite a while (7.2 ms), the diamond grit changes from shape D to shape E, and the scratch length is up to 242 mm.
From the above analysis, it can be seen that the first four damaged stages of the diamond grit occur within a time interval of less than 5 ms, and the duration of stage V is 2.5 times higher than the total time of the previous four stages.
SiC surface topographies of diamond grits at different damaged stages
The surface topographies of the SiC workpiece at different damaged stages of diamond grits are shown in Figure 3. Due to the vibration of the machine tool spindle and the errors of the fixture, the actual scratch depth differs from the nominal scratch depth. The actual scratch depth can be calculated by equation (2). By calculation, the error between the actual scratch depth and the nominal scratch depth is within the range of 0.5–1.5 μm.
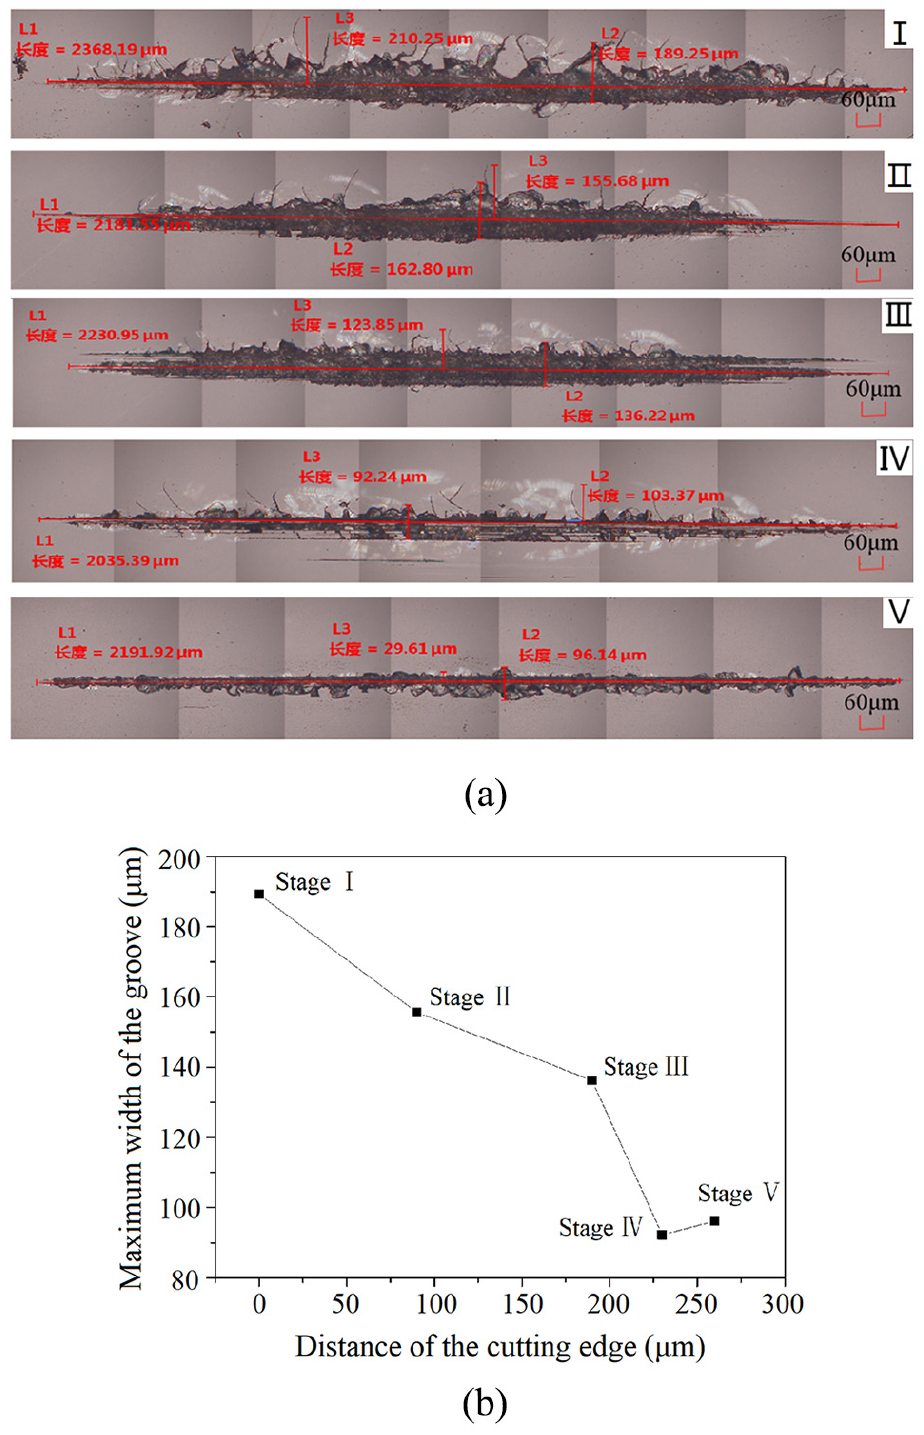
Typical surface topography of scratched grooves corresponding to the five damaged stages of diamond grits: (a) typical surface topography and (b) maximum width of the grooves.
As shown in Figure 3(a), at stage I, large pits and long lateral cracks appear on both sides of the groove, and the prevailing material removal mode is brittle. At stage II, the number of cracks in the groove is less than that at the first stage, and the size of the pits on both sides of the groove is also reduced. For stage III, the groove shows obvious double-edged marks, and the number of lateral cracks further reduced with the size of the pits on both sides being decreased to a lesser extent. Previous studies have shown that interference exists in the simultaneous removal process of two abrasive grits, which will have a great impact on the removal mechanism of brittle materials. 17 At this stage, it might be reasonable to assume that removal interference caused by the two edges also occurred. At stage IV, due to the existence of micro-cutting edges on the diamond grit, the pits on one side of the groove disappeared. This might be a result of the multiple removal interference of micro-cutting edges. The number of lateral cracks begins to increase at stage V and there are no double-edged marks on the groove. This might be because one of the two edges is the main cutting edge and there is a certain distance between the main edge and the other edge along the scratching direction. In spite of few lateral cracks on the grooves, the pits on both sides are more obvious, and the size continues to increase.
Corresponding to the different stages of grit damage, the surface topographies of the workpiece are greatly different. The smallest size of the pits on both sides of the groove is shape C corresponding to stage III. In general, compared to the first stage, the quality of the workpiece surfaces corresponding to the other four stages is better. This can also be seen from the change of the maximum width of grooves at different stages, as shown in Figure 3(b).
Scratching forces at different damaged stages
A force signal captured in one scratching stroke is shown in Figure 4(a), where Fn is the normal force and Ft is the tangential force. Under these experimental parameters, the theoretical length of a single scratch is 2.6 mm, the theoretical scratch time of each scratch is 1.33 × 10⁻⁴ s, and the theoretical scratch frequency is 7.5 kHz. The natural frequency of the 9119A dynamometer used in the experiment is 7 kHz. Therefore, a single diamond grit scratches the workpiece to deform the dynamometer piezoelectric sensor and converts it into a force signal. The piezoelectric crystal of the dynamometer and the workpiece oscillate within a certain frequency range. After the scratch depth reaches the maximum value, the oscillating force signal appears to decay. The literature18–21 also describes the phenomenon of the oscillation of the force signal at different degrees in single-diamond-grit scratching. Thus, the first wave of scratching force in Figure 4(a) was used as the force curve of this scratching, as shown in Figure 4(b). The maximum value on the curve of each scratching stroke was used as the force value of this stroke and the forces at different damaged stages are shown in Figure 5.
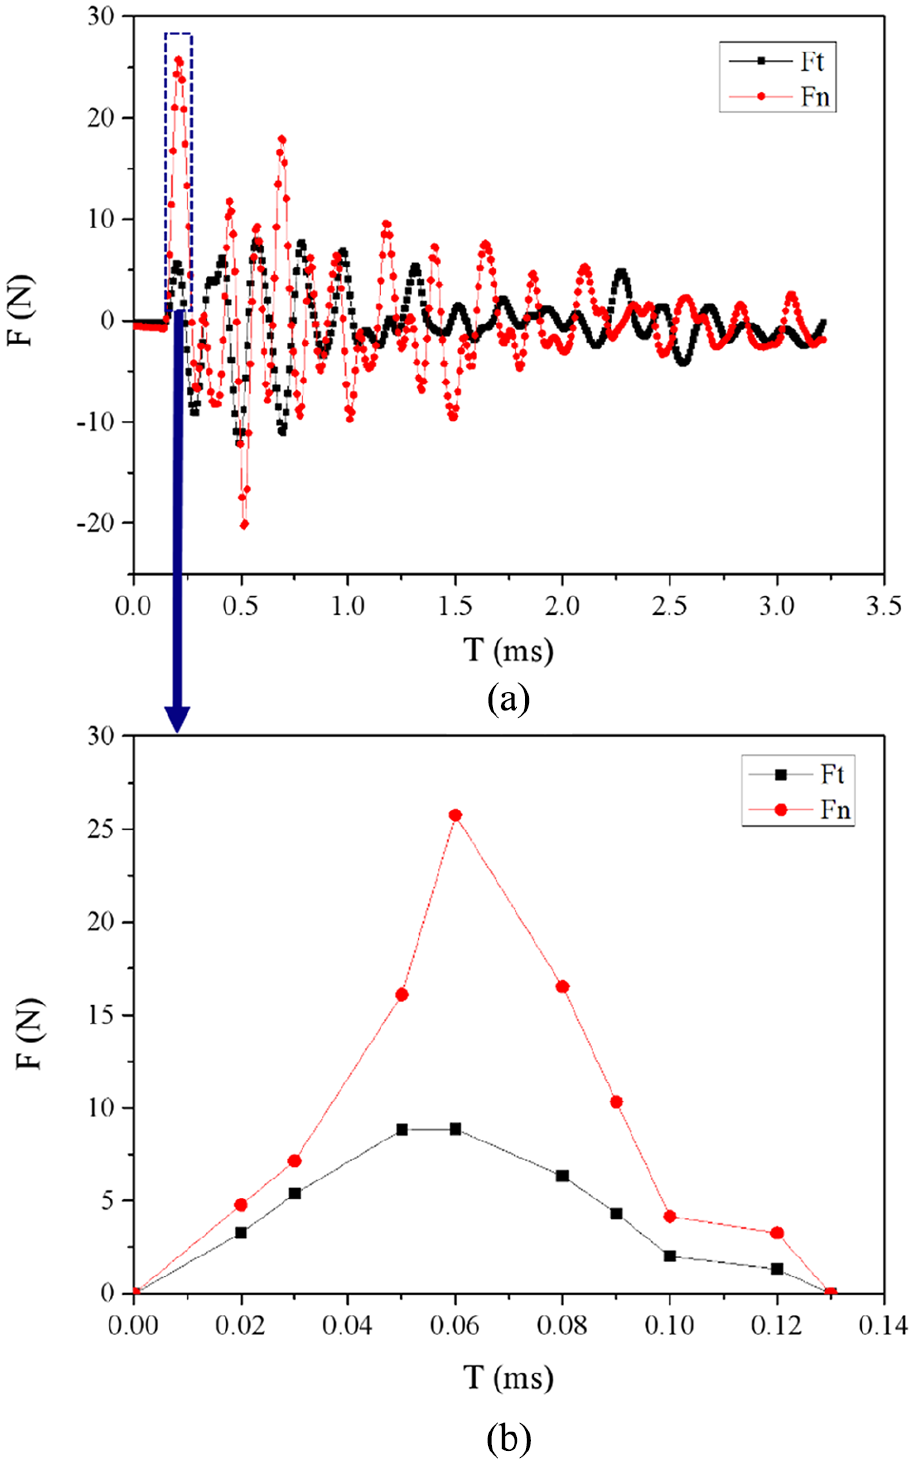
Force curves recorded in the experiment: (a) a force signal captured in one scratching stroke and (b) the first wave of scratching force.
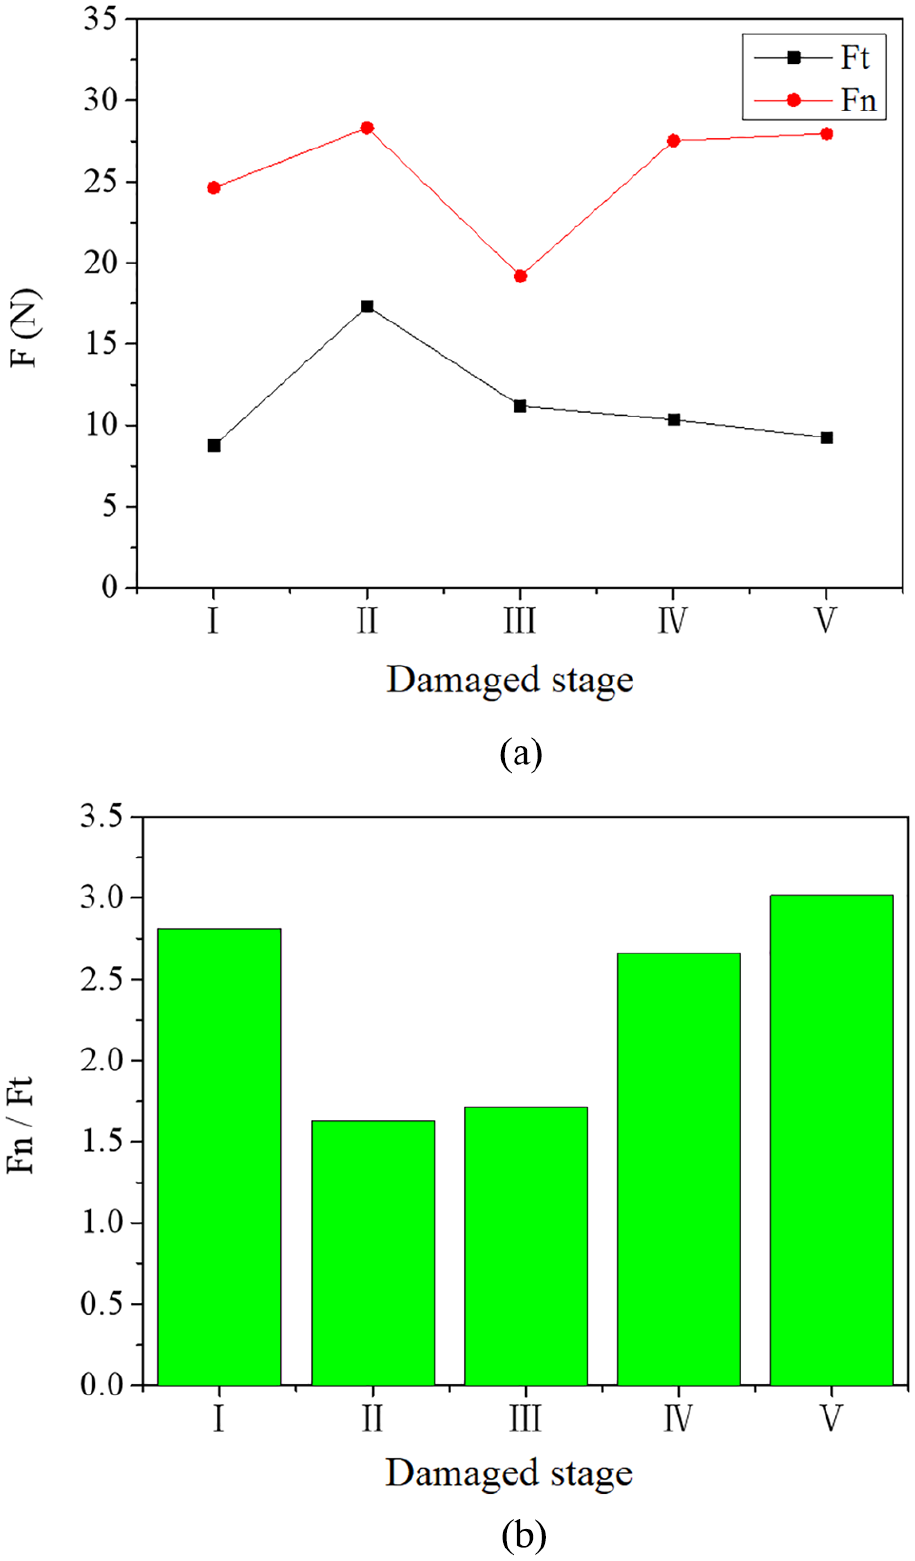
Scratching forces at different damaged stages of diamond grits: (a) Fn and Ft and (b) Fn/Ft.
As shown in Figure 5(a), the normal force Fn varies between 19 and 29 N, whereas the tangential force Ft varies between 8 and 17 N. It can be seen from Figure 5(a) that the normal force vibrates at different stages and the tangential force rises first and then decreases. For the first three stages, the changing trends of the normal and tangential forces are basically the same, and the changing trends are opposite for the fourth and fifth stages.
Figure 5(b) shows the changing trend of the scratching force ratio (Fn/Ft) at different damaged stages. It can be seen from Figure 5(b) that the force ratio ranges from 1.5 to 3. At the first stage, the diamond grit is relatively complete (shape A) and the force ratio is higher. However, the force ratio decreases first and then gradually increases when the damage of the diamond grit (shapes B–E) occurs, which might reflect the process of damage.
Simulation of scratching with different diamond grits of damaged shapes
Modeling of the scratching process
Modeling
In order to reduce the calculation, only the end of the diamond grit in contact with the workpiece is modeled during simulation. Figure 6 shows a simulation model for the scratching of monocrystalline SiC with a single diamond grit, in which case the diamond grit and the workpiece are all composed of SPH particles, and the size of the particles is set to 6 μm. The workpiece is set to be a cuboid with the dimensions of 3 mm × 0.6 mm × 0.12 mm. A particle-to-particle contact model is established for the diamond grit and workpiece. The modeling process of a diamond grit is shown in Figure 6.
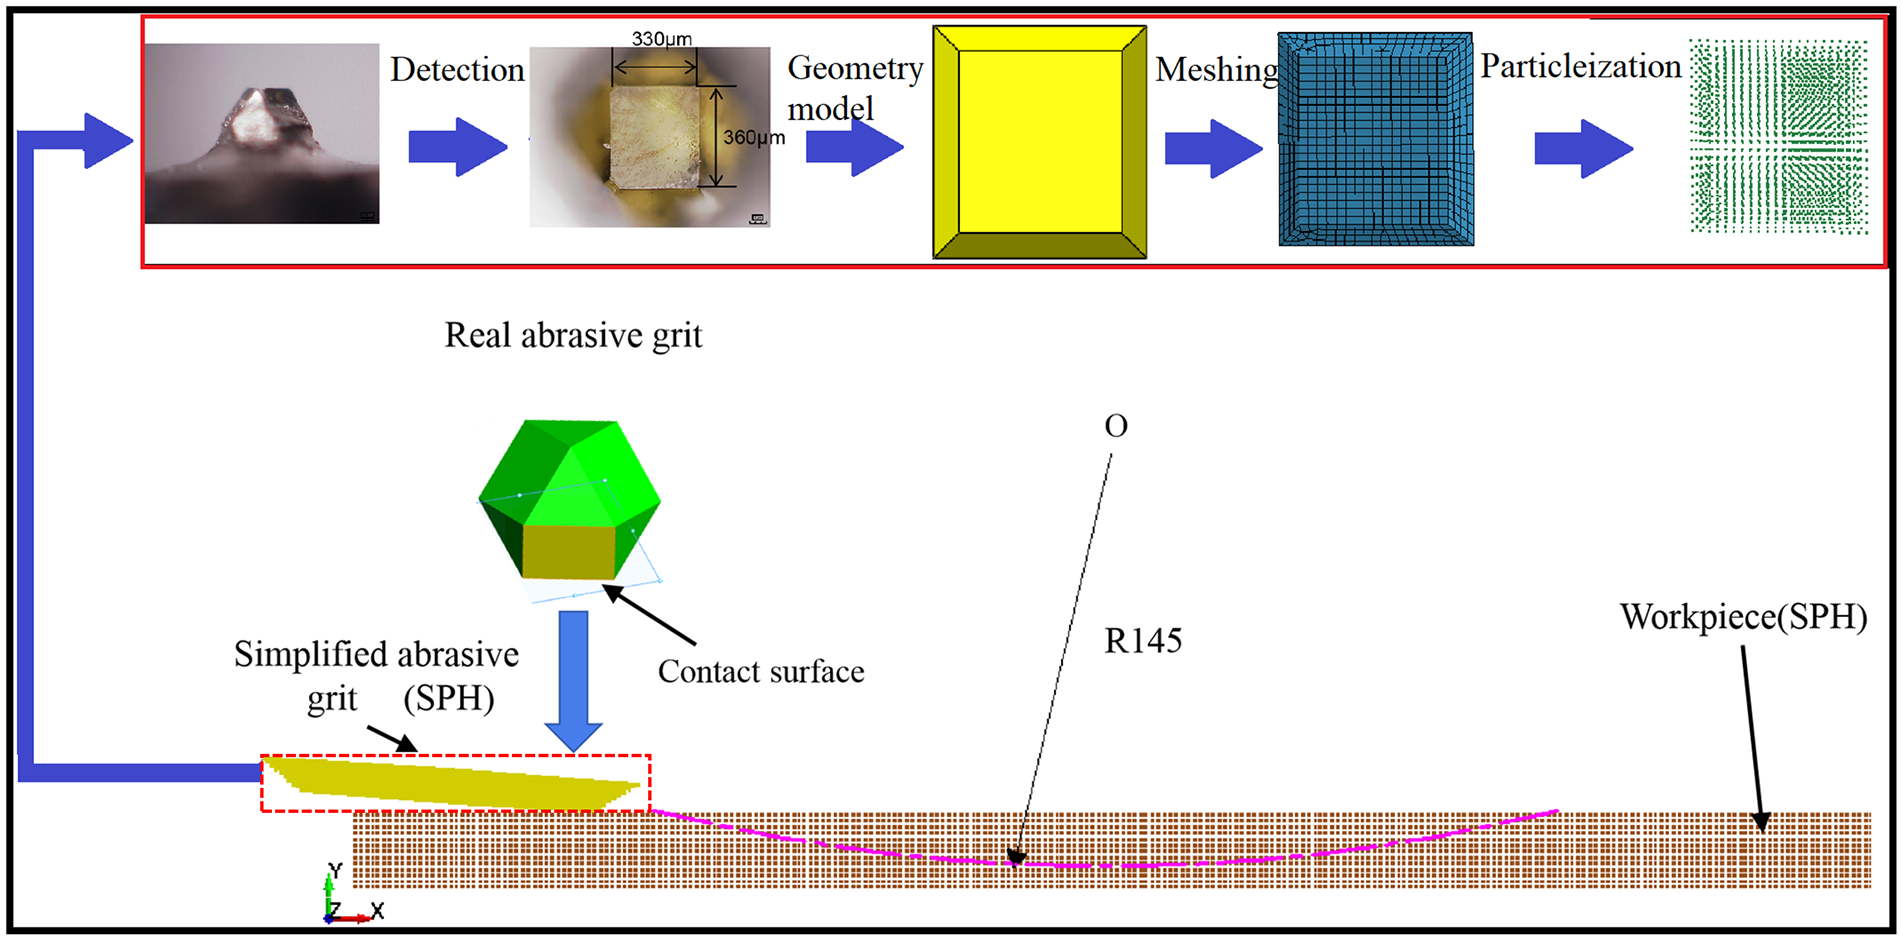
Model of scratching with a single diamond abrasive grit.
The parameters of the scratching process in the simulation are the same as those in the experiment. Since the linear speed of the grinding wheel is much larger than the moving speed of the workbench, the impact of the moving speed of the workbench is negligible. Therefore, the boundary conditions of the simulation are that the bottom of the workpiece is fixed, and the diamond grit only performs circular motion on the XOY plane.
Material constitutive equation
To better simulate the damage of diamond grits, the grits are defined as an elastomer, and Steinberg’s constitutive equation which is suitable for high strain rates (>105/s) is used as the material constitutive equation for diamond. 22 Steinberg’s constitutive model can be expressed using equations (3) and (4)
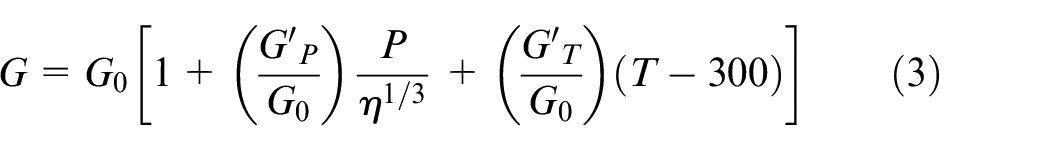
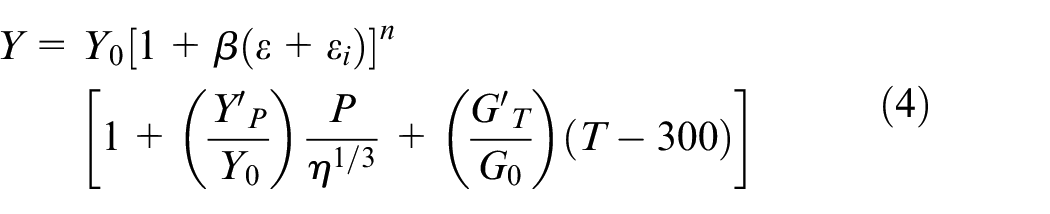
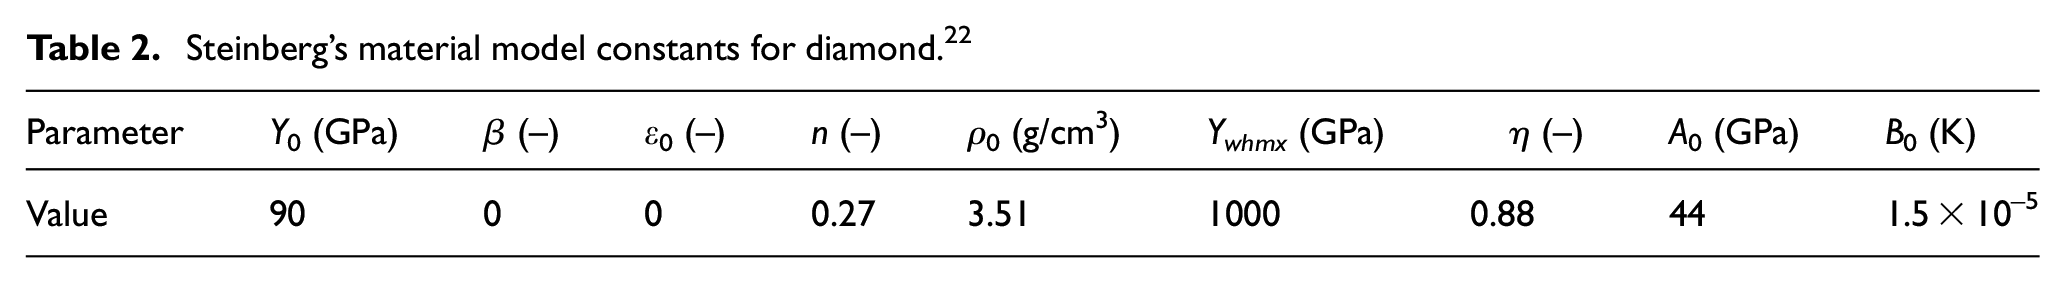
The parameters of Steinberg’s constitutive equation for diamond are shown in Table 2.
Steinberg’s material model constants for diamond. 22
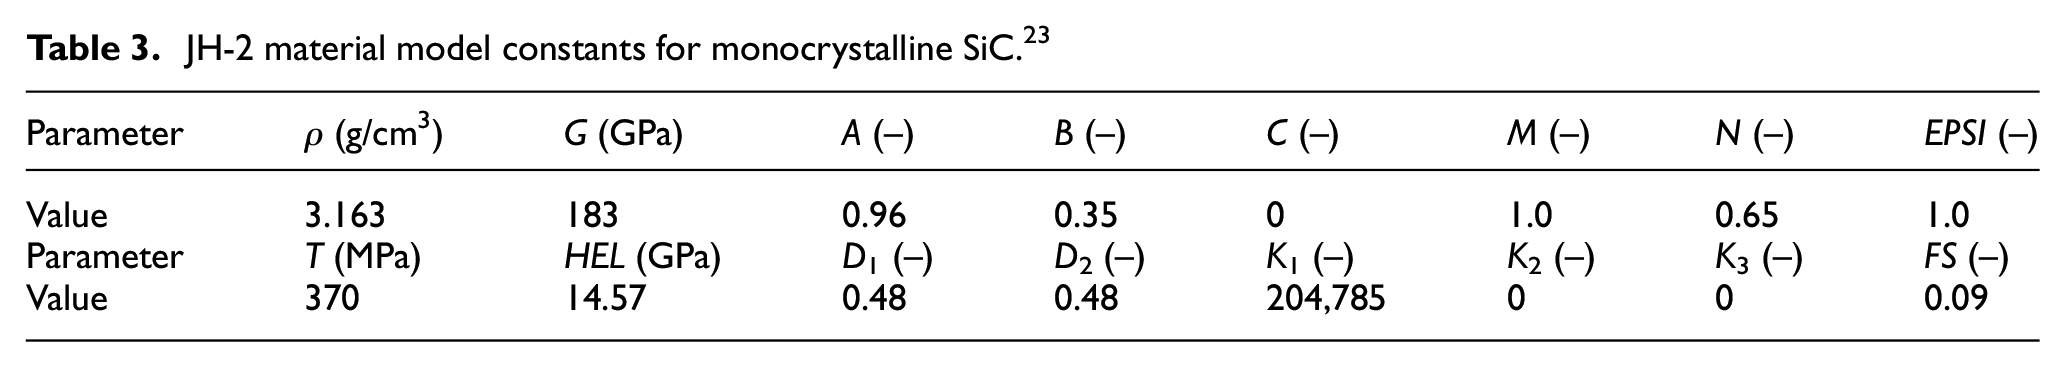
The Johnson–Holmquist model (JH-2) is used as the material constitutive equation for monocrystalline SiC, for which the constitutive equation parameters are listed in Table 3.
JH-2 material model constants for monocrystalline SiC. 23
Comparison of simulation and experiments
In order to verify the validity of simulation, the simulation results for surface damage on SiC and scratching forces are compared with the experimental results for shape A.
Surface damage
Figure 7 shows the material damage distribution for scratching with the diamond grit of shape A. It can be seen that a large number of obvious cracks and pits appear on both sides of the groove. The size of the cracks at the two ends of the groove is small. At the middle of the groove, the size of the cracks becomes significantly larger, and the material damage intensifies. This is consistent with the experimental results as shown in Figure 3(a). And the surface damage in the simulation is similar to the surface topography in the experiment (see Figure 4(a)). The maximum width of the groove is 264 μm, and the size of cracks is two to three times the size of microcracks. Compared with the experimental results, the deviation is about 25%.
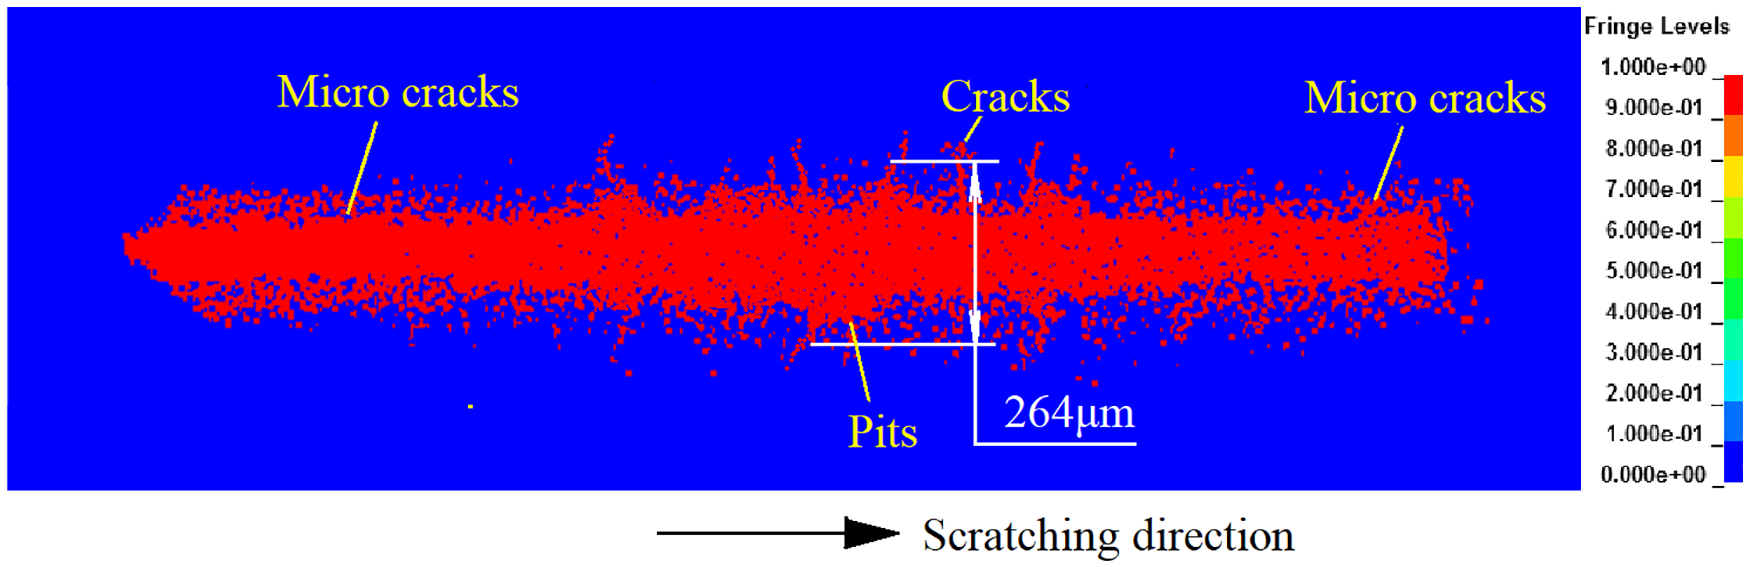
Damage distribution of monocrystalline SiC for single scratching with a diamond grit of shape A.
Scratching force
Figure 8 shows the scratching force curves for both the experiment and simulation at the first stage, which corresponds to the diamond grit of shape A. To obtain more force data, a much smaller time step was set for the simulation.
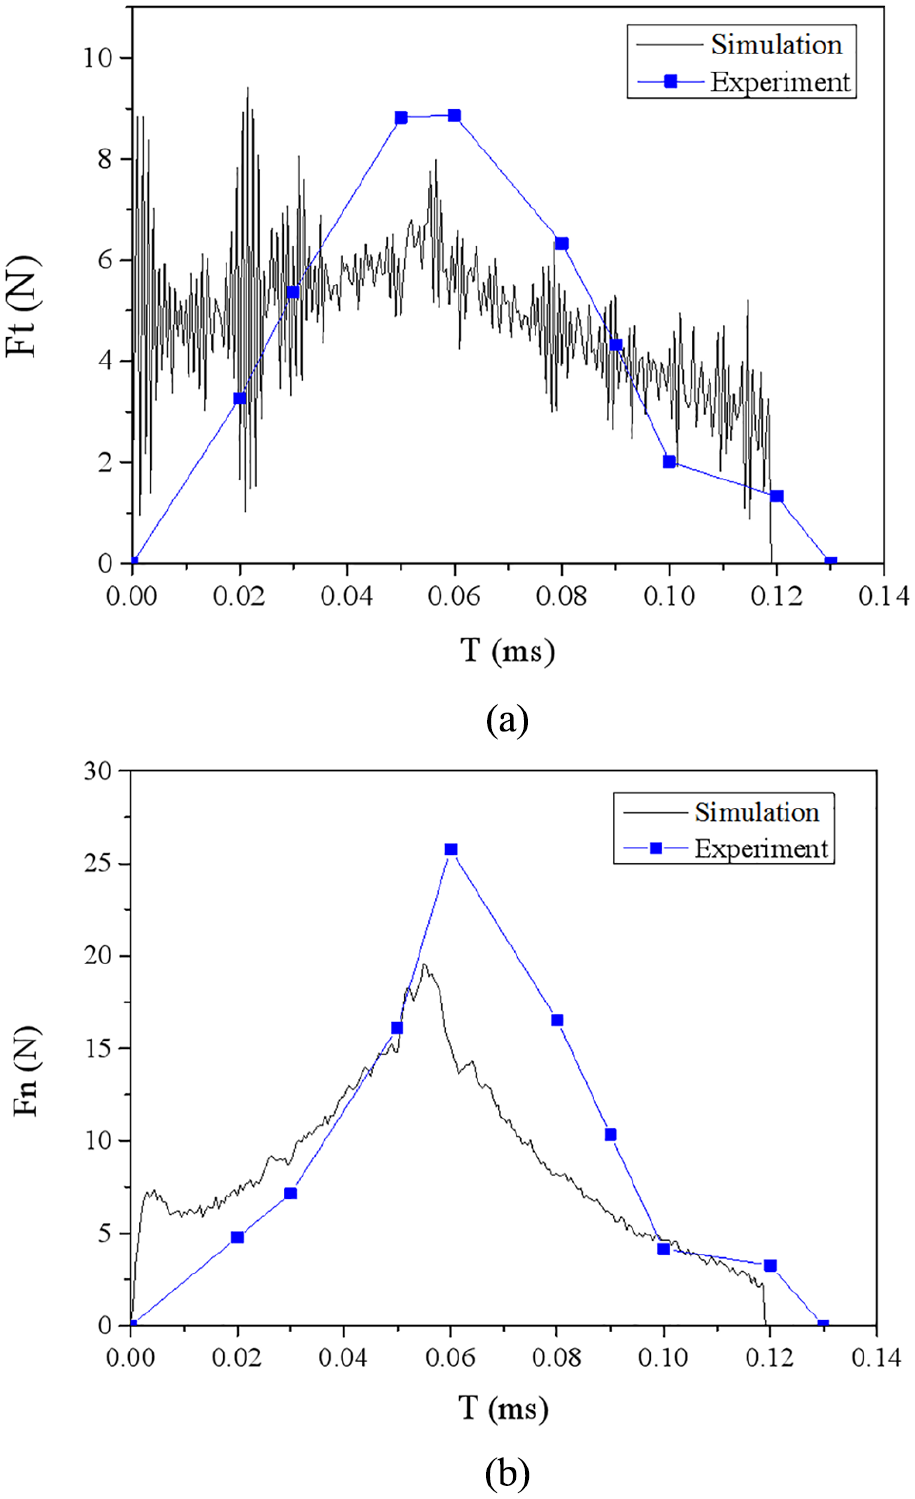
Comparison of scratching force in simulation and experiment: (a) Ft and (b) Fn.
As shown in Figure 8(b), the normal force rapidly increases at the beginning of the scratching process. Subsequently, it basically shows an upward trend in spite of fluctuation. At the middle of the scratching process, the normal force is up to the peak value and then basically decreases. The amplitude of the normal force in the experiment has a deviation of about 20% from that of the normal force in the simulation. The normal force curve shows first a rising and then a falling trend in the experiment. The changing trend of experimental results is basically consistent with the simulation results.
Deeper understanding of the scratching through simulation
Through simulation, much more items, which are quite difficult to reveal only by experiments, can be studied. As such, subsurface damages of SiC, details of scratching forces, and equivalent stress distributions on diamond grits are simulated in this work to gain a deeper understanding of the scratching process.
Subsurface damage
Figure 9 shows the subsurface damage distribution of the main section of the groove corresponding to different diamond grits of damaged shapes (A–E). The red-colored area indicates where the density of the particle changes. The yellow arrow indicates the central crack in the depth direction.
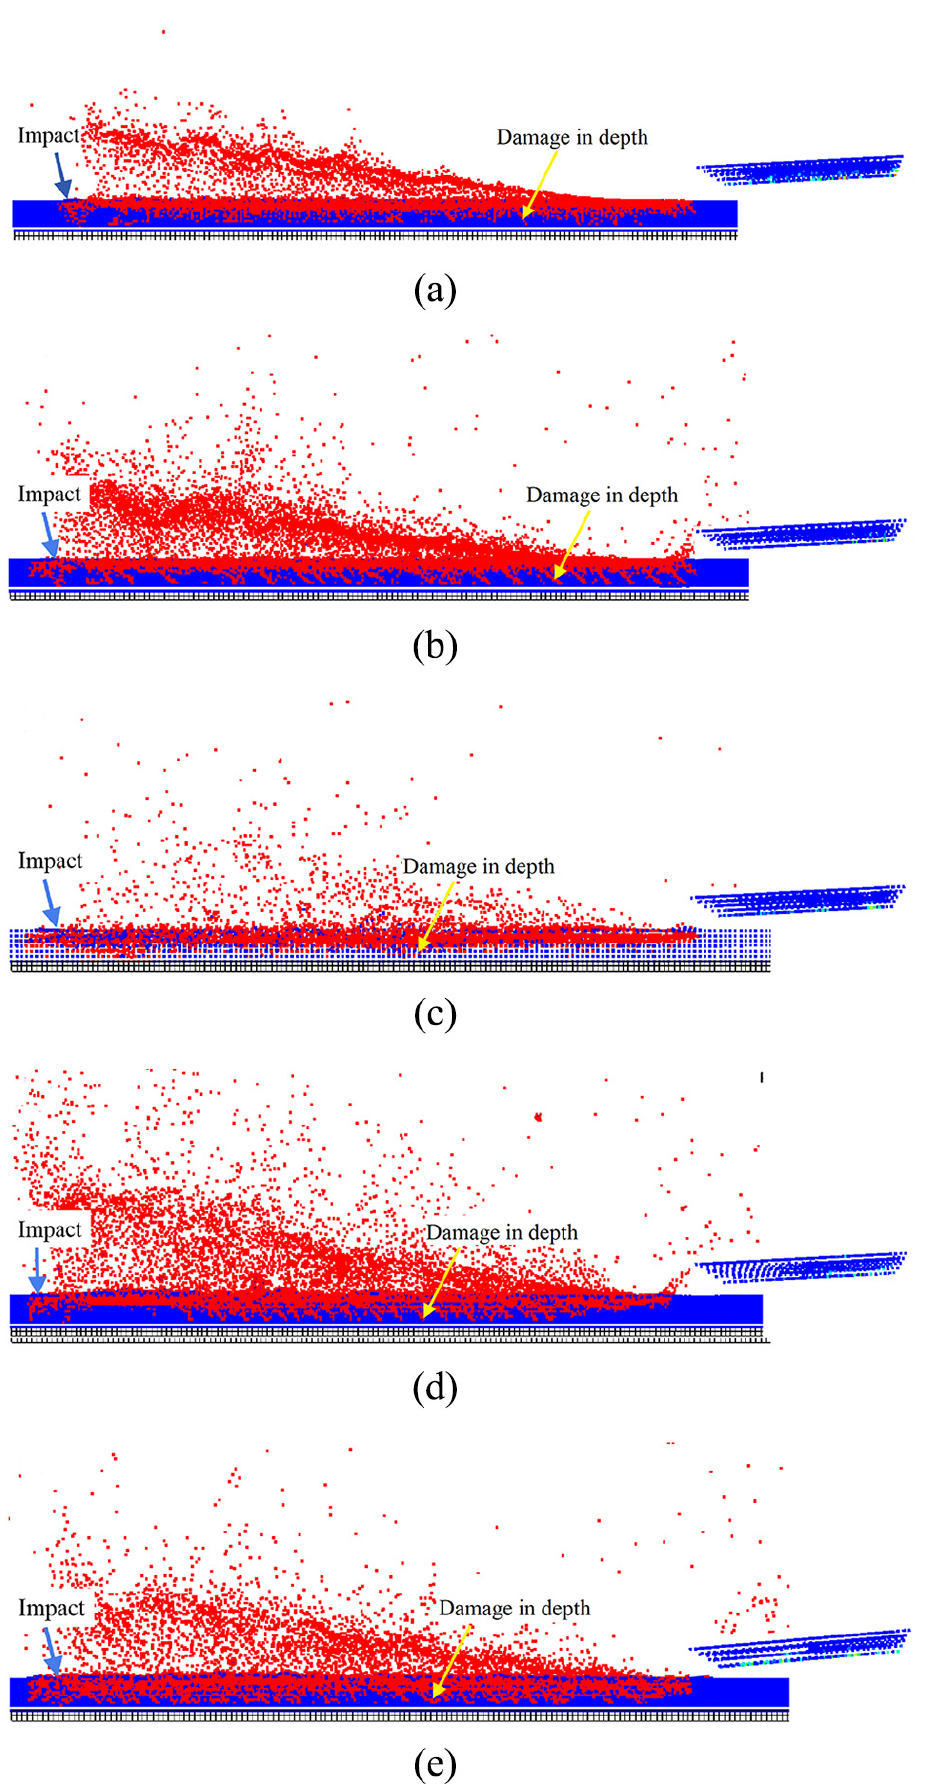
Subsurface damage after diamond grit scratching with different damaged shapes on monocrystalline SiC: (a) shape A, (b) shape B, (c) shape C, (d) shape D, and (e) shape E.
As shown in Figure 9(a), due to the initial impact, deep subsurface damages occurred in the area where the diamond grit of shape A contacted with the workpiece. After the entire scratching process is finished, the central crack is intermittent and disordered. Figure 9(b) shows that there are more central cracks in the grooves scratched by the diamond grit of shape B, and central cracks distribute regularly. Almost all the central cracks exhibit the same direction, and the size of the cracks is larger than that of the diamond grit of shape A.
Due to the early wear of the diamond grit, the tip of the diamond grit of shape C has been worn, as shown in Figure 9(c). Except for the larger area of damage caused by the initial impact, the size of the central cracks is smaller, and the degree of damage in the depth direction as a whole is the least among the five damaged shapes.
As shown in Figure 9(d), the number and size of the central cracks corresponding to the diamond grit of shape D increase obviously. The directions of the central cracks are basically consistent with those in the groove corresponding to the diamond grit of shape B, but the number of central cracks generated by the diamond grit of shape D is relatively less. It can be seen from Figure 9(e) that a large number of central cracks appeared in the material, and the size of the cracks increased continuously, indicating that the damage degree of the groove corresponding to the diamond grit of shape E increases. Compared with the experimental results, the trend of the damage degree along the depth direction is consistent with that of the normal force in the experiments (see Figure 5).
Further analysis of scratching force
Figure 10 shows the trend of the scratching force corresponding to different diamond grit shapes. As shown in Figure 10, at the initial stage of scratching, the scratching force corresponding to the diamond grit of any shape fluctuated severely, indicating that the diamond grit has an impact on the workpiece while being in contact with the workpiece. Therefore, the scratching force increased instantaneously. This can be used to explain the deep damage of the workpiece material at the initial stage of scratching shown in Figure 9.
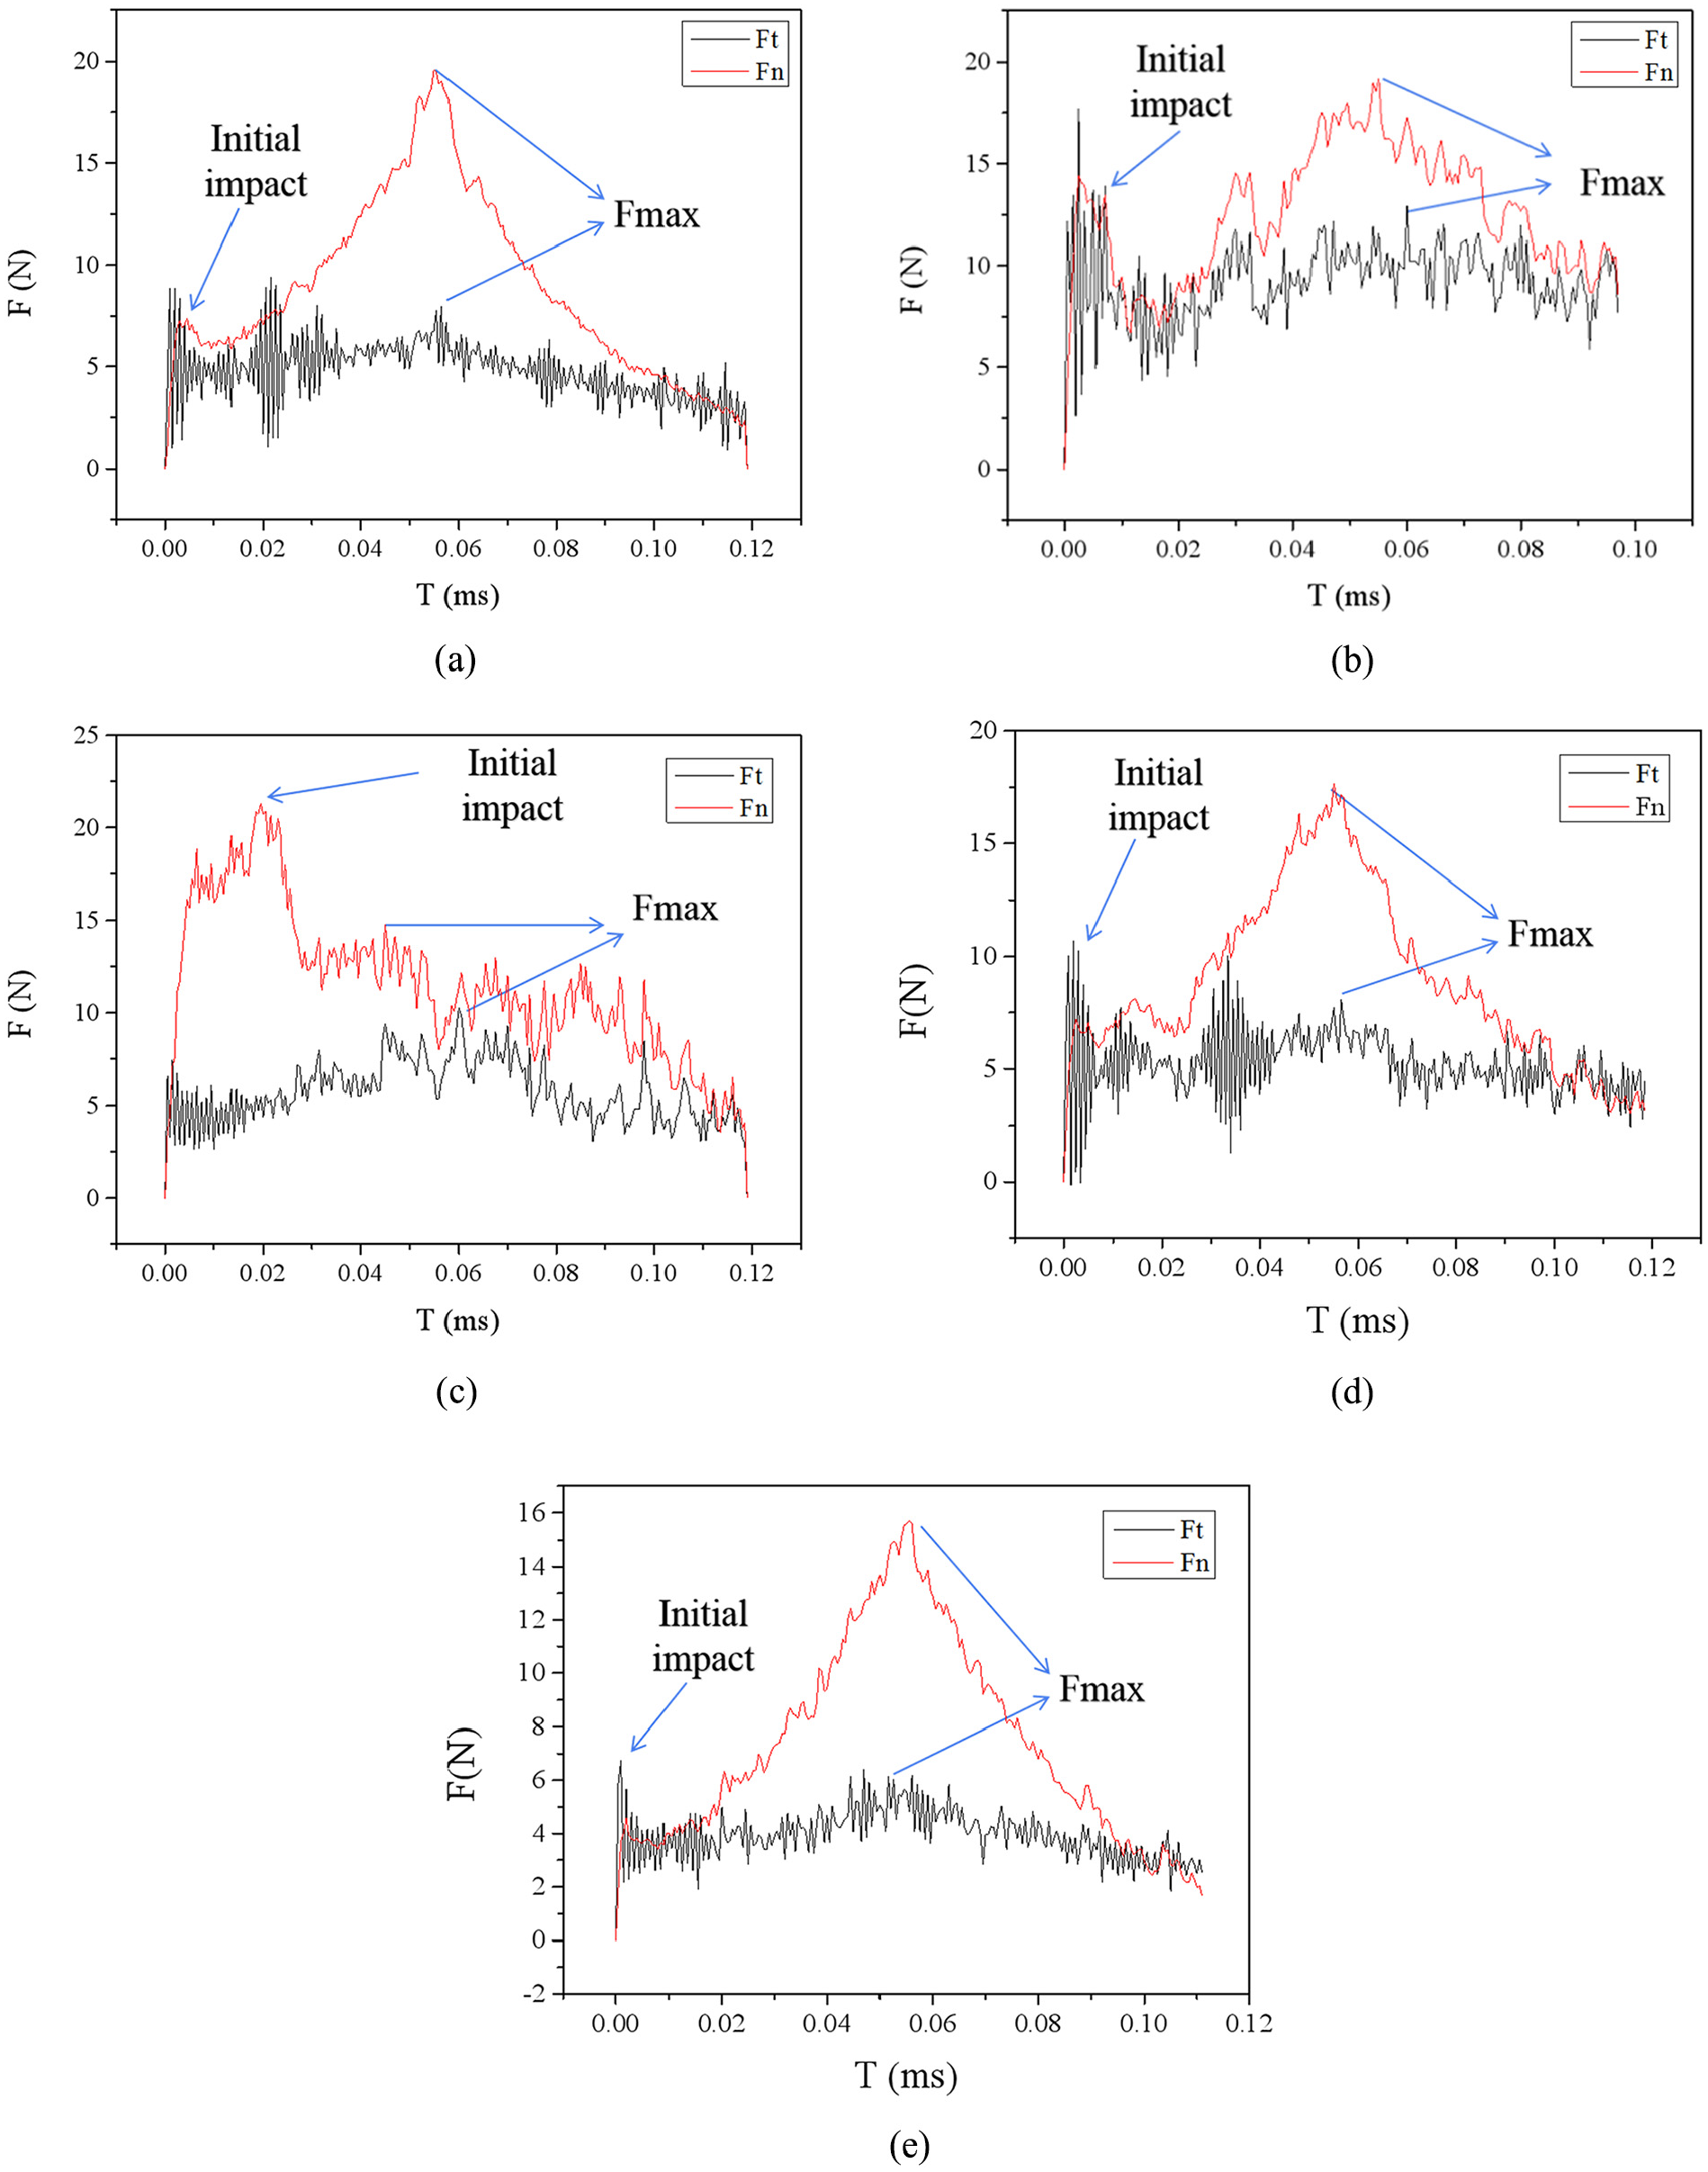
Scratching force of diamond grit scratching with different damaged shapes on monocrystalline SiC: (a) shape A, (b) shape B, (c) shape C, (d) shape D, and (e) shape E.
With regard to shapes D and E, the distance of the cutting edges increased, and the scratching force began to increase again. Except for shape C, the normal forces corresponding to the diamond grit of other four damaged shapes reach the maximum at the same time, when the scratch depth reaches the largest value (t = 0.06 ms).
Figure 11(a) shows the changing trend of the amplitudes of Fn and Ft, and Figure 11(b) shows the trend of the ratio of the amplitudes of Fn and Ft. The simulation results are basically consistent with the results of the experiments (see Figure 5). It can be seen from Figure 11(b) that the ratio of scratching force decreases first and then increases, and the trend is exactly opposite to that of the increment of the distance of the cutting edge which is denoted by Δd. The force ratio corresponding to shape C is the least, whereas the force ratios corresponding to shapes B and C are relatively close.
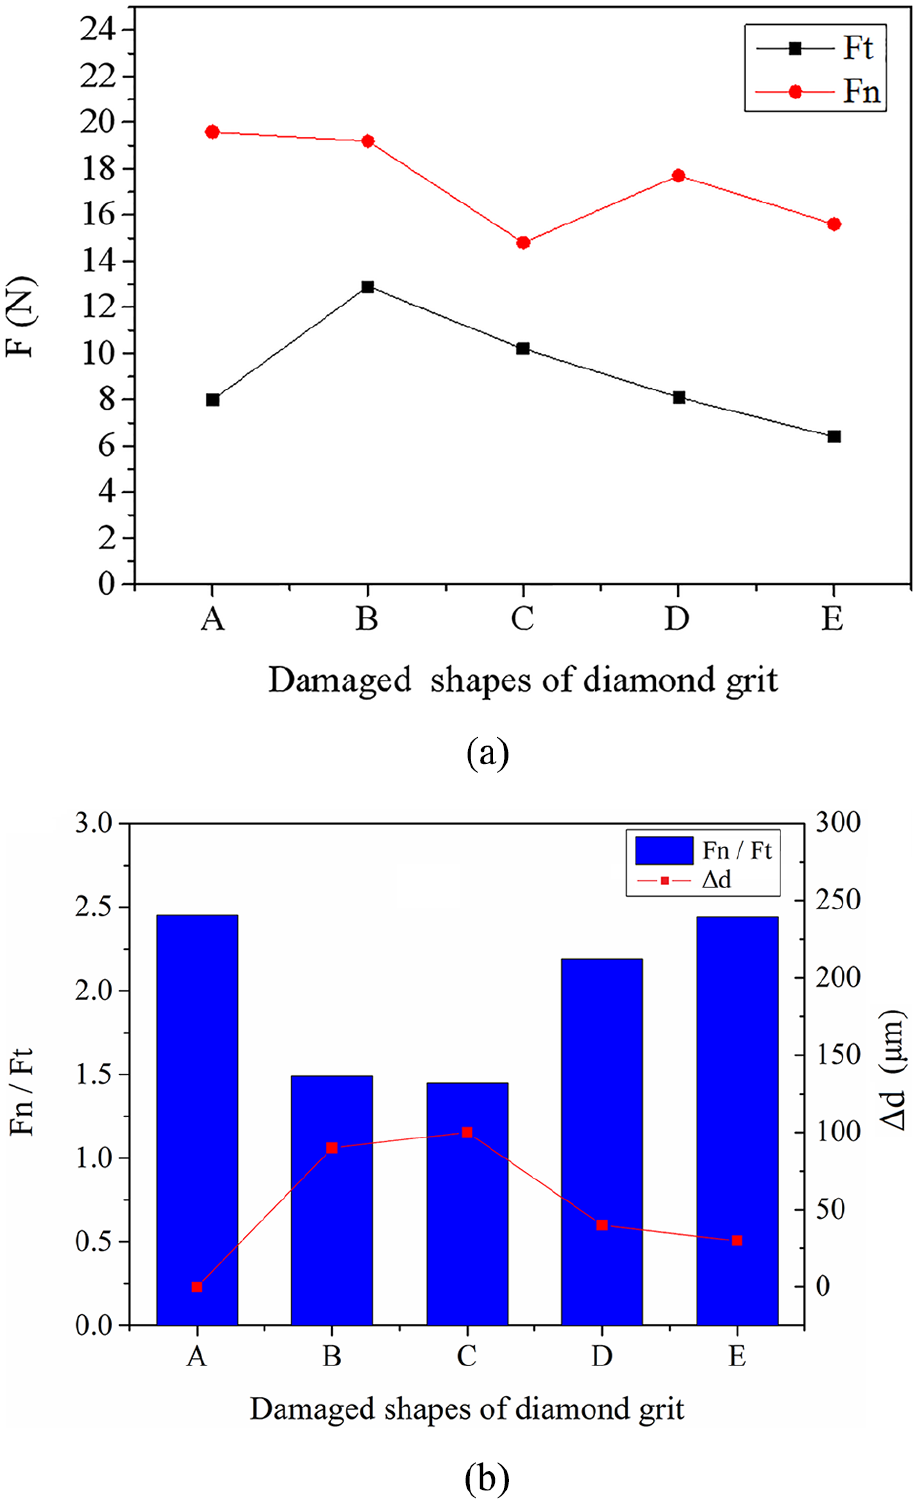
Scratching force ratio of diamond grit scratching with different damaged shapes on monocrystalline SiC: (a) Fn and Ft and (b) Fn/Ft.
Prediction of the damage of diamond grits
Figure 12 shows the relation between the damaged shapes of the diamond grits collected in the experiment and the material equivalent stress distribution of the diamond grits with the damaged shapes in the simulation.
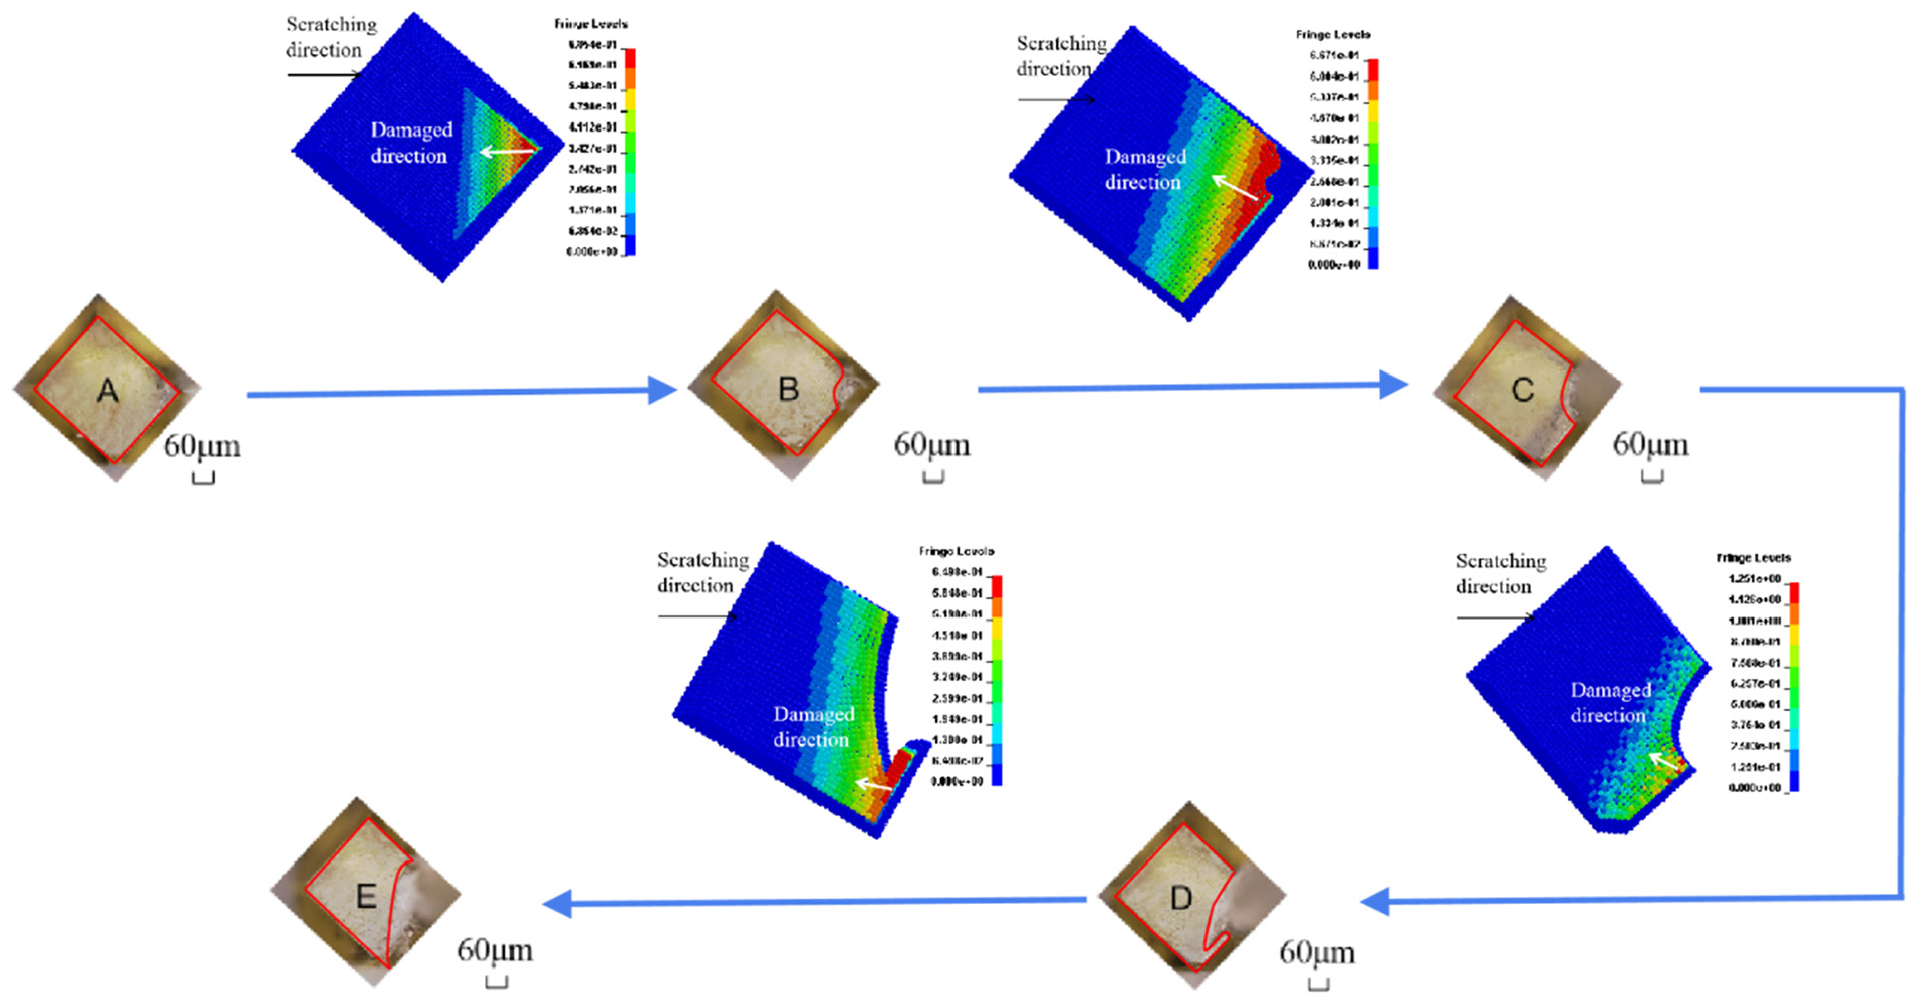
The prediction of the damage direction of diamond grits.
In Figure 12, the material equivalent stress distributions obtained by the simulation are taken as the quantity of the process, and the damaged shapes of the diamond grit collected in the experiment are taken as the result at different damaged stages. The region with the highest equivalent stress represents the region where the damage is most likely to occur. Comparing the equivalent stress of the all damaged shapes, the value for shape C is the largest among all the damaged shapes, which is about twice higher compared to the other shapes. The value of equivalent stress in the green area of shape C has reached the maximum. In addition, the maximum equivalent stress mainly concentrates on the tip or the individual edge of the diamond grit.
Compared with the experimental results, it is found that the damage of diamond grits mainly occurs in the area where the value of equivalent stress is greater than 0.65 MPa. The direction in which the stress gradually decays is the direction along which the diamond grit will be destructed during the following scratching. By comparison, the region that has the maximum equivalent stress obtained by simulation is basically the same as the damaged region of the diamond grits collected in the experiment.
Discussion
From the above analysis, the main reason why the diamond grit damaged in a short time and continued to damage is the accumulation of impact. The impact has a great influence on the wear of diamond grits in the scratch process. The number of cutting edges increases due to the damage of the diamond grit. Simultaneously, the surface topography of the workpiece changes greatly. The number of cracks decreases, and the size of the pits on both sides of the groove decreases significantly. These indicate that the grooves scratched by the two cutting edges are in different material removal modes, and the interference weakens the material removal. However, as the distance of the cutting edges increases, the interference mode changes. The material damage becomes severe, with more cracks and larger crack sizes, indicating that the grooves scratched by the two cutting edges are in the same brittle removal mode, and the interference enhances the brittle removal. The damage in the depth direction has the same trend with the corresponding normal force, and the size of the pits on both sides and scratching force ratios show the same trend.
Thus, in terms of the damaged shape of the diamond grit, the distance of the cutting edge is the key factor governing the SiC scratched surface topographies. When the diamond grit is at the third damaged stage (shape C), where the distance of cutting edges is 190 μm, better quality can be obtained for the SiC surface. In future studies, special attention should be focused on the influence of the distance of the cutting edges.
Conclusion
In this work, a series of experiments were carried out to study the scratching of monocrystalline SiC with brazed diamond grits. Five different damaged shapes of the diamond grit were collected, while the surface topography of the workpiece and the scratching force were analyzed through experiments. Based on the SPH method, the three-dimensional models for diamond grits of five different damaged shapes are established to simulate the scratching process. The mechanisms of diamond grit damage and the influence of different damaged grit shapes on the removal mechanism of monocrystalline SiC during the scratching process are analyzed. The following conclusions can be drawn:
The impact action is the main reason for the wear of the brazed diamond grit. With the increase of the scratch length, the damage of the diamond grit intensifies, and the number of cutting edges on the diamond grit increases.
Scratching with the damaged diamond grits might produce less surface damage on monocrystalline SiC than the scratching with the complete diamond grit.
The distance of the cutting edges is the main factor governing the material removal mechanism of the scratching with damaged diamond grits. The interference of double edges is the main reason for the great difference in the material surface topography, the subsurface damage of the workpiece, and the scratching force.
Simulation results show that the stress at the cutting edge of diamond grits is the largest, and the equivalent stress distribution on diamond grits might be used to predict the damage of the diamond grits during scratching.
Footnotes
Declaration of conflicting interests
The author(s) declared no potential conflicts of interest with respect to the research, authorship, and/or publication of this article.
Funding
The author(s) disclosed receipt of the following financial support for the research, authorship, and/or publication of this article: This study was financially supported by the National Natural Science Foundation of China (Grant Nos 51575197 and 51805175) and the Graduates Cultivation Project of Huaqiao University for Research and Innovation Ability (Grant No. 17013080021).