
Abstract
The use of synthetic turf has been increasing in professional sports, where evaluation of novel turf designs for mechanical response, consistency, and athlete playability currently requires time-consuming and complex physical testing on physical turf, and more efficient drop-weight impact testing. A variety of drop tests are used to measure the impact response and surface stiffness of synthetic turf, including the Clegg Impact Soil Tester (CIST). Finite element computational models offer an opportunity to assess new turf designs prior to the construction of physical turfs but require validation for a range of turf constructions. In the present study, 14 different synthetic turf designs with varying infill and fibers were constructed and experimentally evaluated using the CIST device. Peak accelerations and acceleration-versus-time responses were measured. The turf constituent materials were mechanically characterized, FE models of all the turfs were created, and the CIST tests were simulated. The peak acceleration from the simulation followed the experimental trend for the wide range of turf designs, with an average difference of 9.7%. When considering conventional turf constructions, the average difference in peak acceleration was 8.8%, indicating the models provided a good prediction of turf impact response and can be used to assess new turf designs virtually, potentially reducing design times and physical test requirements.
Keywords
Introduction
The intent of turf in sports fields is to meet playability requirements, performance requirements, and related standards. 1 Synthetic turf demand in professional sports has increased in the past two decades. 2 Novel designs of synthetic turfs can potentially improve safety and performance in contact sports 3 ; however, testing different turf designs is empirical at present, requiring a large quantity of materials and the construction of physical test samples, which is time-consuming and costly. Using a finite element (FE) computational model to simulate turf and impact testing is a novel tool that can provide important knowledge on turf performance and lead to efficient design improvements for new turfs. 4 However, FE models require validation over a representative range of conditions to be used as a design tool.
Synthetic and natural turfs are often evaluated using drop-weight impact instruments including: the Clegg Impact Soil Tester (CIST), Advanced Artificial Athlete (AAA), FieldTester, the ASTM F355-A missile, and ASTM F355-E missile with a focus on mimicking the loading generated by athletes.5,6 However, despite this wide variety of test methods used to assess turf, the CIST is still a widely adopted tool for characterizing playing surfaces due to the minimal training required, fast and simple testing process, relatively low purchase cost, and inexpensive maintenance. 7
The CIST (Figure 1) is a mechanical impact testing device, 7 which can be used to measure the stiffness and impact response of various material surfaces such as natural and synthetic playing surfaces.5,8 For athletic playing surfaces, the device consists of a 2.25 kg cylindrical missile (also called a hammer) that is dropped through a guide tube from a height of 0.457 m to achieve a 2.85 m/s impact velocity onto a playing surface. 9 The CIST measures the acceleration of the hammer in response to the turf stiffness, while recent improvements in the device have measured the hammer acceleration-time history. Importantly, the CIST test has been shown to detect differences in heavily used areas of sports fields 10 and was used to define recommended limits of ground stiffness through correlation to athlete perceptions of the tested playing fields. 11
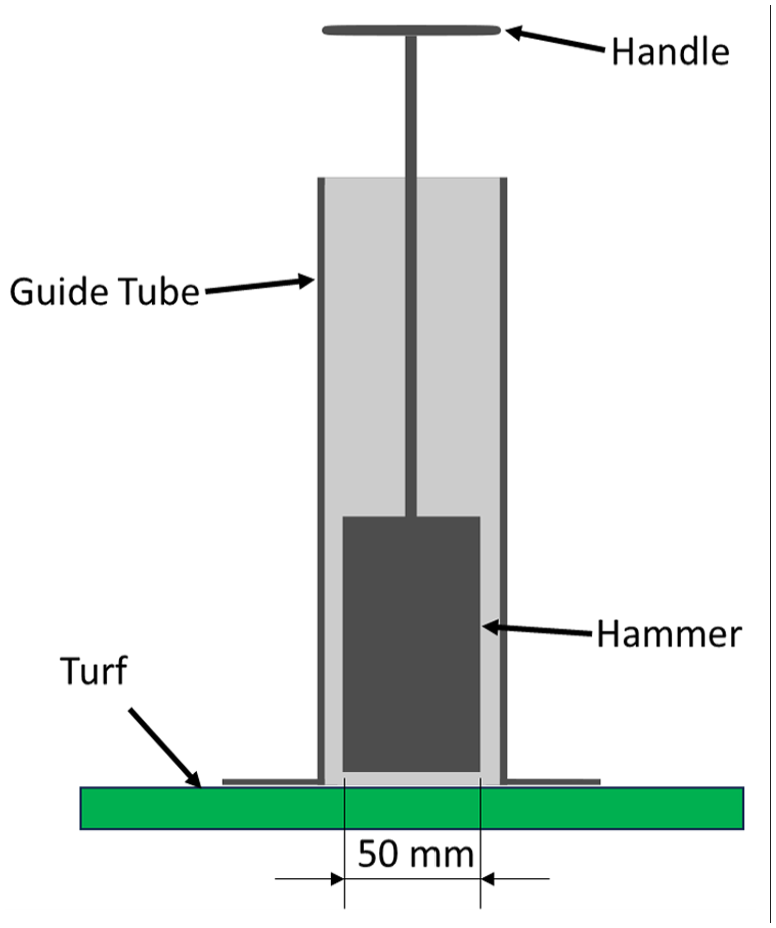
Schematic drawing of the CIST comprising a hammer with a handle that is inserted in a guide tube with a control unit. The device is placed on the turf and the hammer is raised with the handle.
The loads applied during the impact are representative of walking on turf, and although they are not representative of sports activities like running,12–14 the device provides an estimate of the turf mechanical response to loading. For example, the National Football League (NFL) and NFL Players Association field testing protocol implemented a maximum CIST response of 100g for synthetic playing fields. 15 Furthermore, the resultant peak acceleration of the test presented good correlations with other engineering parameters used in soil testing such as the California bearing ratio and resilient modulus. 7 It is important to note that repeated tests at the same spot alter the measured acceleration, consequently, the turf must be tested in multiple locations for the accurate assessment of the turf response. 16 In addition, the CIST results may not correlate directly with other devices as shown in comparison to the F355-A missile in a diverse set of turf impacts. 17
Recently, an FE model of synthetic turf was developed using experimental characterization of material and friction properties of the fibers, backing layer, and infill. 18 In addition, as the pre-conditioning of the turf using rollers has been shown to affect the surface stiffness, 18 compaction of the physical turf was incorporated into the model by pre-compressing the infill. The fibers, backing layer, and infill of the model were located inside a 23 cm × 23 cm region that were representative of boundary conditions of the experimental testing trays while maintaining computational efficiency. The fibers of the model consisted of shell elements with a three-parameter linear viscoelastic material model and the backing layer was composed of shell elements with an elastic material model. The infill was modeled using Smoothed-Particle Hydrodynamics (SPH) elements with a pressure-dependent soil constitutive model and a Drucker-Prager yield surface. The turf configuration used in the study included three infill layers (styrene butadiene rubber (SBR), SBR and sand mixture, and pure sand) and slit-film fibers, of prepared pristine turf and not on-field turf samples. The model was shown to predict comparable responses for compression and shear loading experiments, using the CIST and the Biocore Elite Athlete Shoe-surface Tester respectively. 19
Third-generation synthetic turfs are often constructed with polymeric fibers tufted or glued to a backing layer with a mixture of crumb rubber and silica sand as infill. 2 The crumb rubber infill is produced mainly from recycled tires made of SBR as it merges the advantages of reducing field stiffness relative to pure sand and of repurposing waste.2,20 Although the majority of synthetic turf fields are constructed with similar constituent materials, the resultant turf properties may vary depending on the construction method, granulometry, age, usage, and maintenance.15,21
In the current study, CIST experiments were conducted in a laboratory on 14 different synthetic turf configurations. The experiments were used to assess the acceleration and velocity responses of FE models of the 14 turfs developed for the present analysis.
Materials and methods
The study comprised construction and CIST impact testing of 14 turf configurations, developing finite element modes of each turf configuration and simulating the impacts for comparison to the experiments. The 14 turf configurations were created to include typical constructions presently used on playing fields, as well as a wide range of variations in fiber geometry, infill depth and material, and stitch rate. The turfs were tested in pristine condition as the effects of aging and usage of turfs in actual sports fields were out of the scope of this analysis.
Experimental tests on 14 turf configurations using the Clegg Impact Soil Tester
The experimental procedure consisted of preparing each of the 14 turf builds (Table 1 and Table A1 in the appendix) in 86 cm × 145 cm aluminum trays, fixing them to a concrete floor following the methodology presented in the literature,3,18,19,22,23 and conducting the CIST impact tests using the recommended procedure. 18 The baseline turf of the current study was constructed following the same process presented by Bustamante et al., 18 and more details on the infill, fiber materials, and construction process were presented there. The other turf builds followed a similar process, only changing the infill material, infill depth, and/or fiber configuration. In addition, all turf builds followed usual third-generation surfaces with carpet backing utilizing polyethylene fibers. For layered turf builds, the infill presented 5 mm of sand, which was covered by 34 mm of SBR-sand mixture, which was covered by 5 mm of SBR. The turf construction process consisted of carefully filling the tray containing the backing layer and fibers with infill, followed by a compacting process with a weighted studded roller, and finished by raking to orient the fibers consistently in the turf. A single tray of each turf build was used during the CIST testing with five repetitions per build. Initially, multiple trays were tested for the baseline turf. The tests determined that one tray with five repetitions was sufficient to capture the CIST response variability.
14 turf configurations used for experimental CIST impact testing.
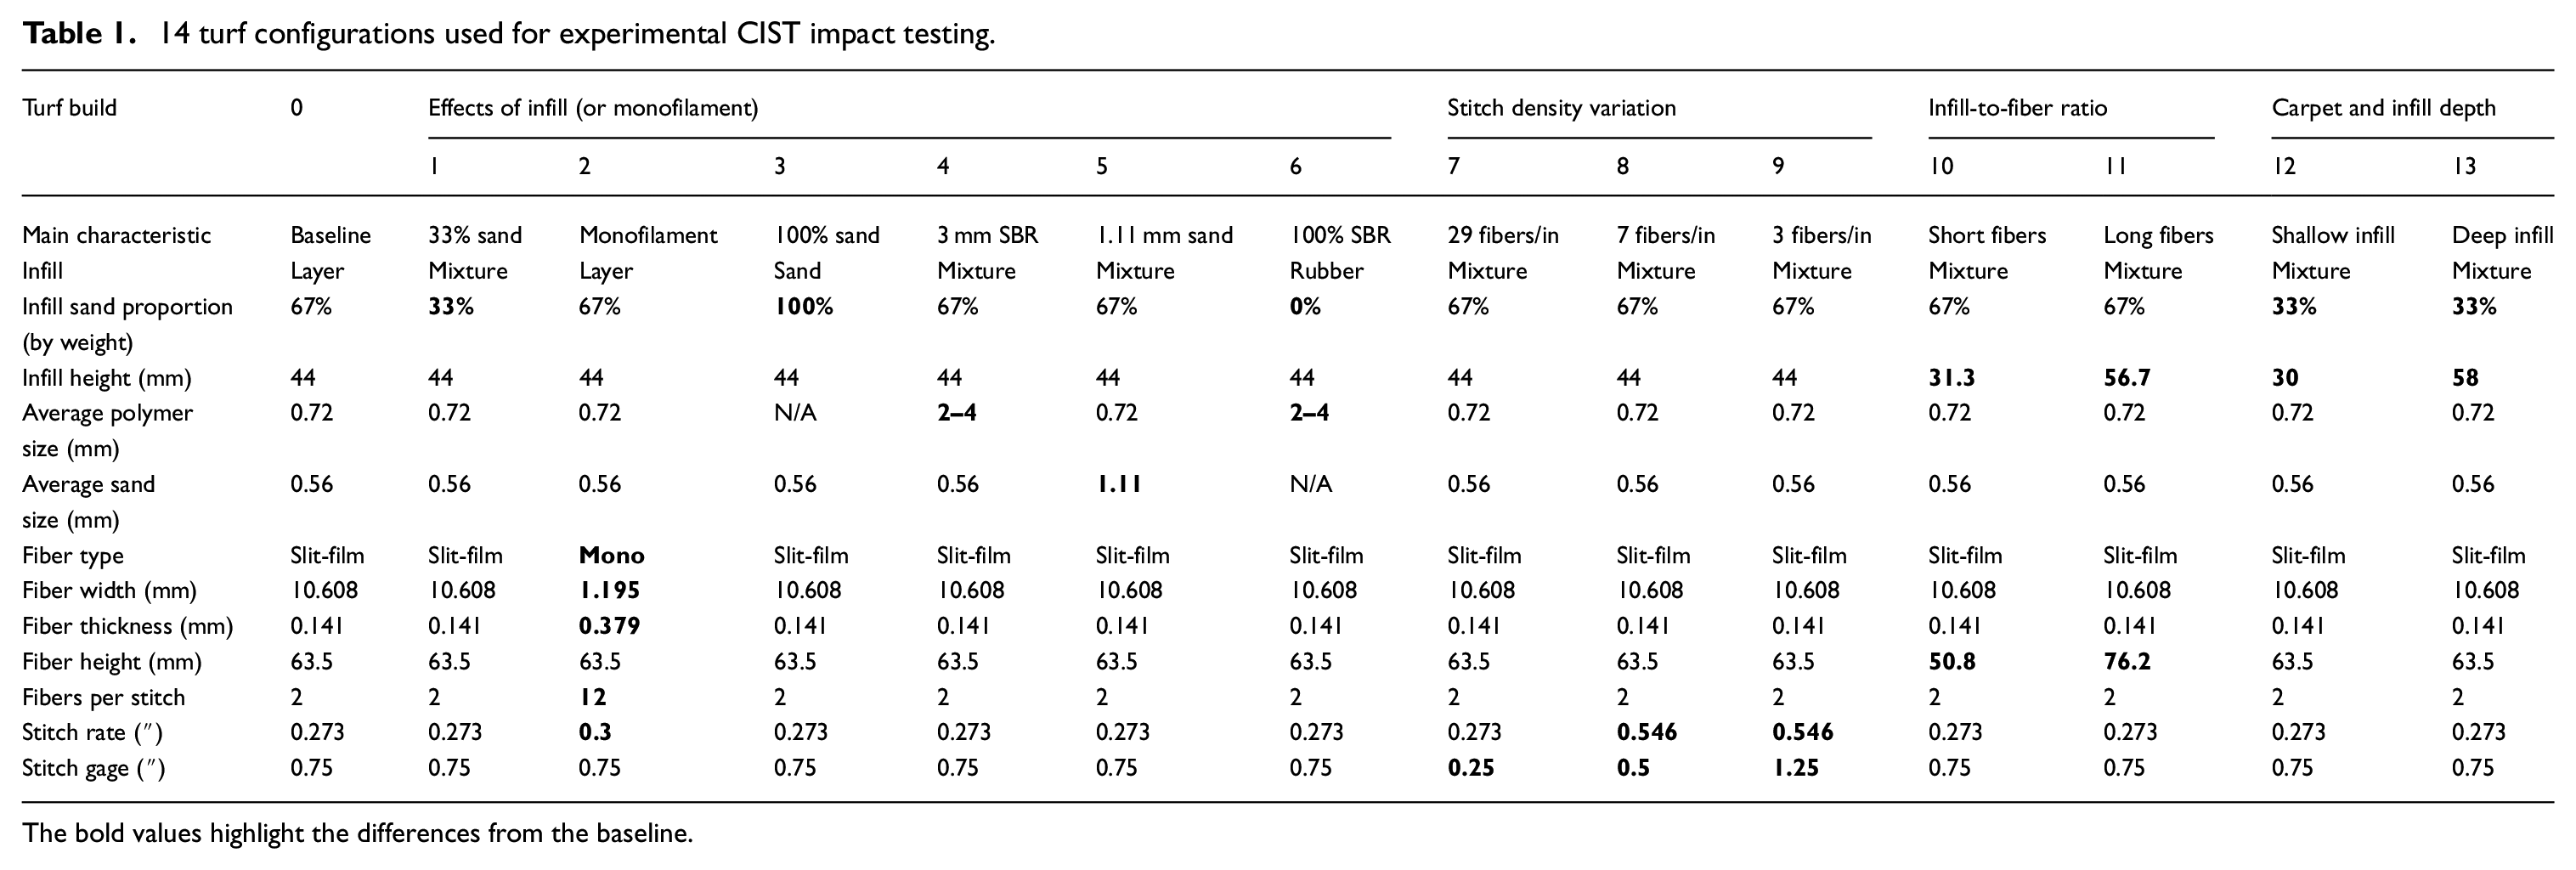
The bold values highlight the differences from the baseline.
The 14 turf configurations included a range of fiber geometries, infill heights, and infill materials available in commercial turfs, with some additional extreme cases, such as a turf with only sand as infill (Build 3 in Table 1). Each turf configuration was constructed to have only a single main characteristic different from the baseline (Build 0) to understand the possible causes of response changes to the turf. The main characteristics that differed from the baseline configuration were: mixture infill being composed of 33% sand for Build 1, fibers consisting of monofilaments for Build 2, infill consisting of 100% sand for Build 3, the SBR in the mixture had an average size of 3 mm for Build 4, the sand in the mixture had an average size of 1.11 mm for Build 5, infill consisting of 100% SBR for Build 6, 29 fibers/in2 (4.5 fibers/cm2) stitch density for Build 7, 7 fibers/in2 (1.1 fibers/cm2) stitch density for Build 8, 3 fibers/in2 (0.5 fibers/cm2) stitch density for Build 9, shorter fibers for Build 10, longer fibers for Build 11, shallow infill for Build 12, deep infill for Build 13 (Table 1).
The procedure described in ASTM F1702-109 was followed for the CIST impact tests. An accelerometer connected to the 2.25 kg hammer was used to measure the entire acceleration pulse for each of the 14 configurations of turfs. The device had an accuracy of ±5%. The velocity was obtained by integrating the acceleration signal. The tests were repeated at least five times, with each test being conducted on an untested, pristine region of the turf. A pointwise average of the tests, and corridors representing one standard deviation were determined from the experimental data.
Synthetic turf FE models and impact simulations
The models of the turfs were created using a previously developed methodology for the infill, 24 the fibers, 18 and the backing layer, 18 consisting of a bottom-up approach. First, the material properties of the individual components of a turf (infill, fibers, and backing layer) as well as their interactions were characterized experimentally. Then, the measured properties were implemented into the turf FE model using an SPH numerical model for the infill, viscoelastic shells for the fibers, and elastic shells for the backing layer. The SPH particles were defined as having a pitch size (distance between particles) of 2 mm. 24 Before the hammer impact, the turf model went through a compaction and a settling phase to represent the construction method (rolling) of the turf as recommended in the literature. 18
The SBR and mixture infill yield surface used to define the material response in this study considered yield shear stresses based on defining an equal area under the shear-stress strain response from the direct shear tests, owing to the high compressibility of the SBR, creating a shear force-displacement response that did not have a well-defined yield. 24 The sand infill yield surface was based on the maximum shear stress, a typical implementation in soil material models because the sand demonstrated low compressibility.
An FE model of the CIST hammer (Figure 2) was developed consisting of a rigid cylindrical body with a 146.7 mm length, 50 mm diameter, and 2.25 kg of mass. The hammer was placed immediately above the fibers and was prescribed an initial vertical velocity of V i = 2.85 m/s, corresponding to a drop height of 0.457 m. Gravity loading was applied to the hammer and turf throughout the simulation. All the models were solved using a commercial explicit FE solver (LSDYNA SMP single precision R13.0.0, Ansys, Canonsburg, PA, USA).
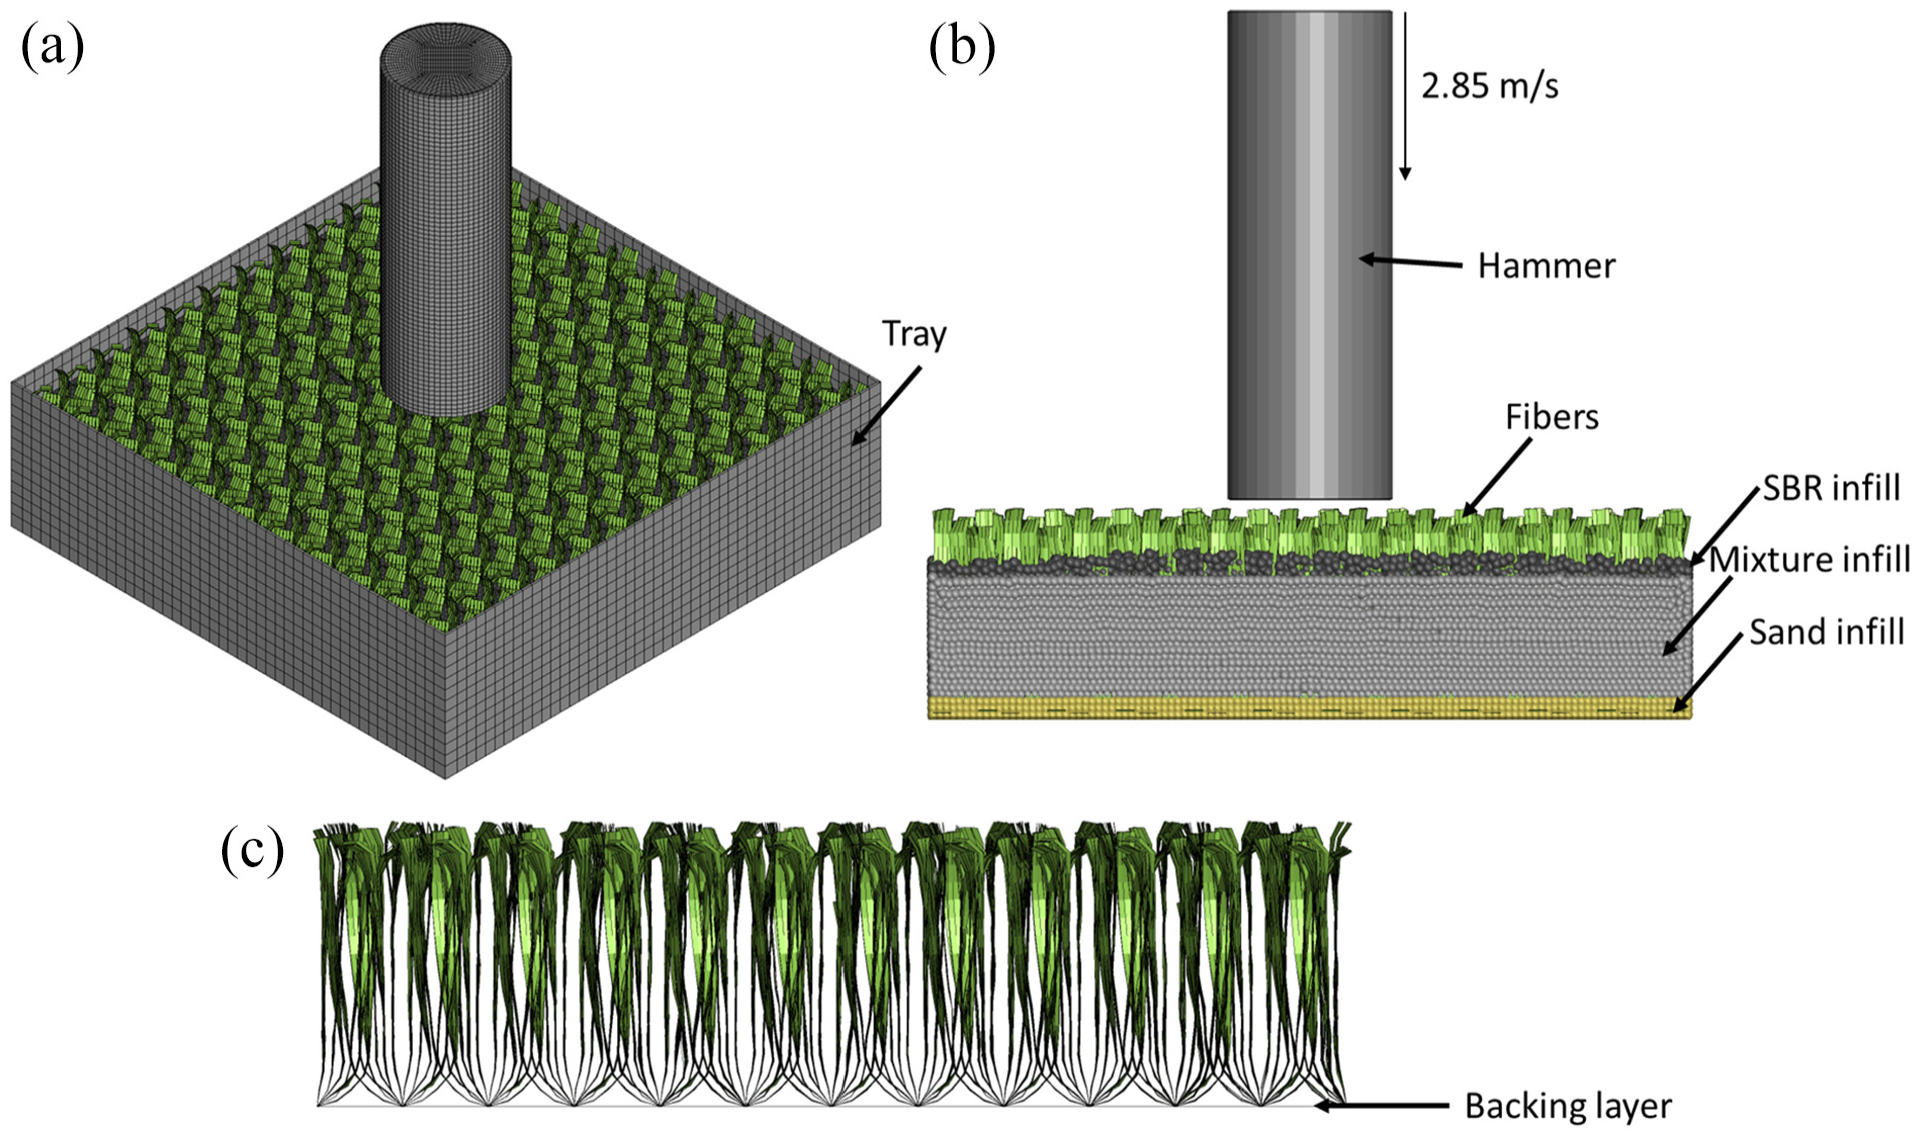
The turf model (a) comprising the fibers and infill layers inside a rigid tray (b). For the baseline configuration (Table 1), the SBR infill layer is shown in black, the SBR and sand mixture in gray, and the sand in yellow. The CIST was implemented as a cylindrical hammer with a prescribed initial velocity. The fibers were fixed to the backing layer at the bottom of the turf (c).
The hammer acceleration and velocity were extracted from the simulation. The acceleration versus time curves of the simulations were compared to the CIST experiments as well as the acceleration peak magnitudes. In addition, the velocity variation (ΔV) between the impact (V i ) and rebound velocities (V f ), and the hammer impulse were also analyzed.
Results
Experimental tests on 14 turf configurations using the Clegg Impact Soil Tester
The experimentally measured impact accelerations of the CIST on the turfs (Figure 3) displayed a maximum value of 159g for Build 3 (100% sand), and a minimum of 51g for Build 13 (deep infill). The acceleration results showed only a small variance when testing the same turf configuration at pristine locations. The range peak acceleration values measured in the experiments for individual turf configurations was lowest for Build 13 (deep infill, range of 2g or 4.0%) and highest for Build 3 (100% sand, range of 20g or 12.5%). The ΔV and impulse presented small variations among turf configurations, from 4.22 m/s (Build 7, 29 fibers/in2) to 4.62 m/s (Build 6, 100% SBR) and from 9.50 N s (Build 7, 29 fibers/in2) to 10.40 N s (Build 6, 100% SBR), respectively. The maximum range between minimum and maximum peak ΔV and impulse were 0.33 m/s and 0.74 N s for Build 0 (Baseline turf). The minimum range of the ΔV and impulse were 0.05 m/s and 0.12 N s for Build 5 (1.11 mm sand).
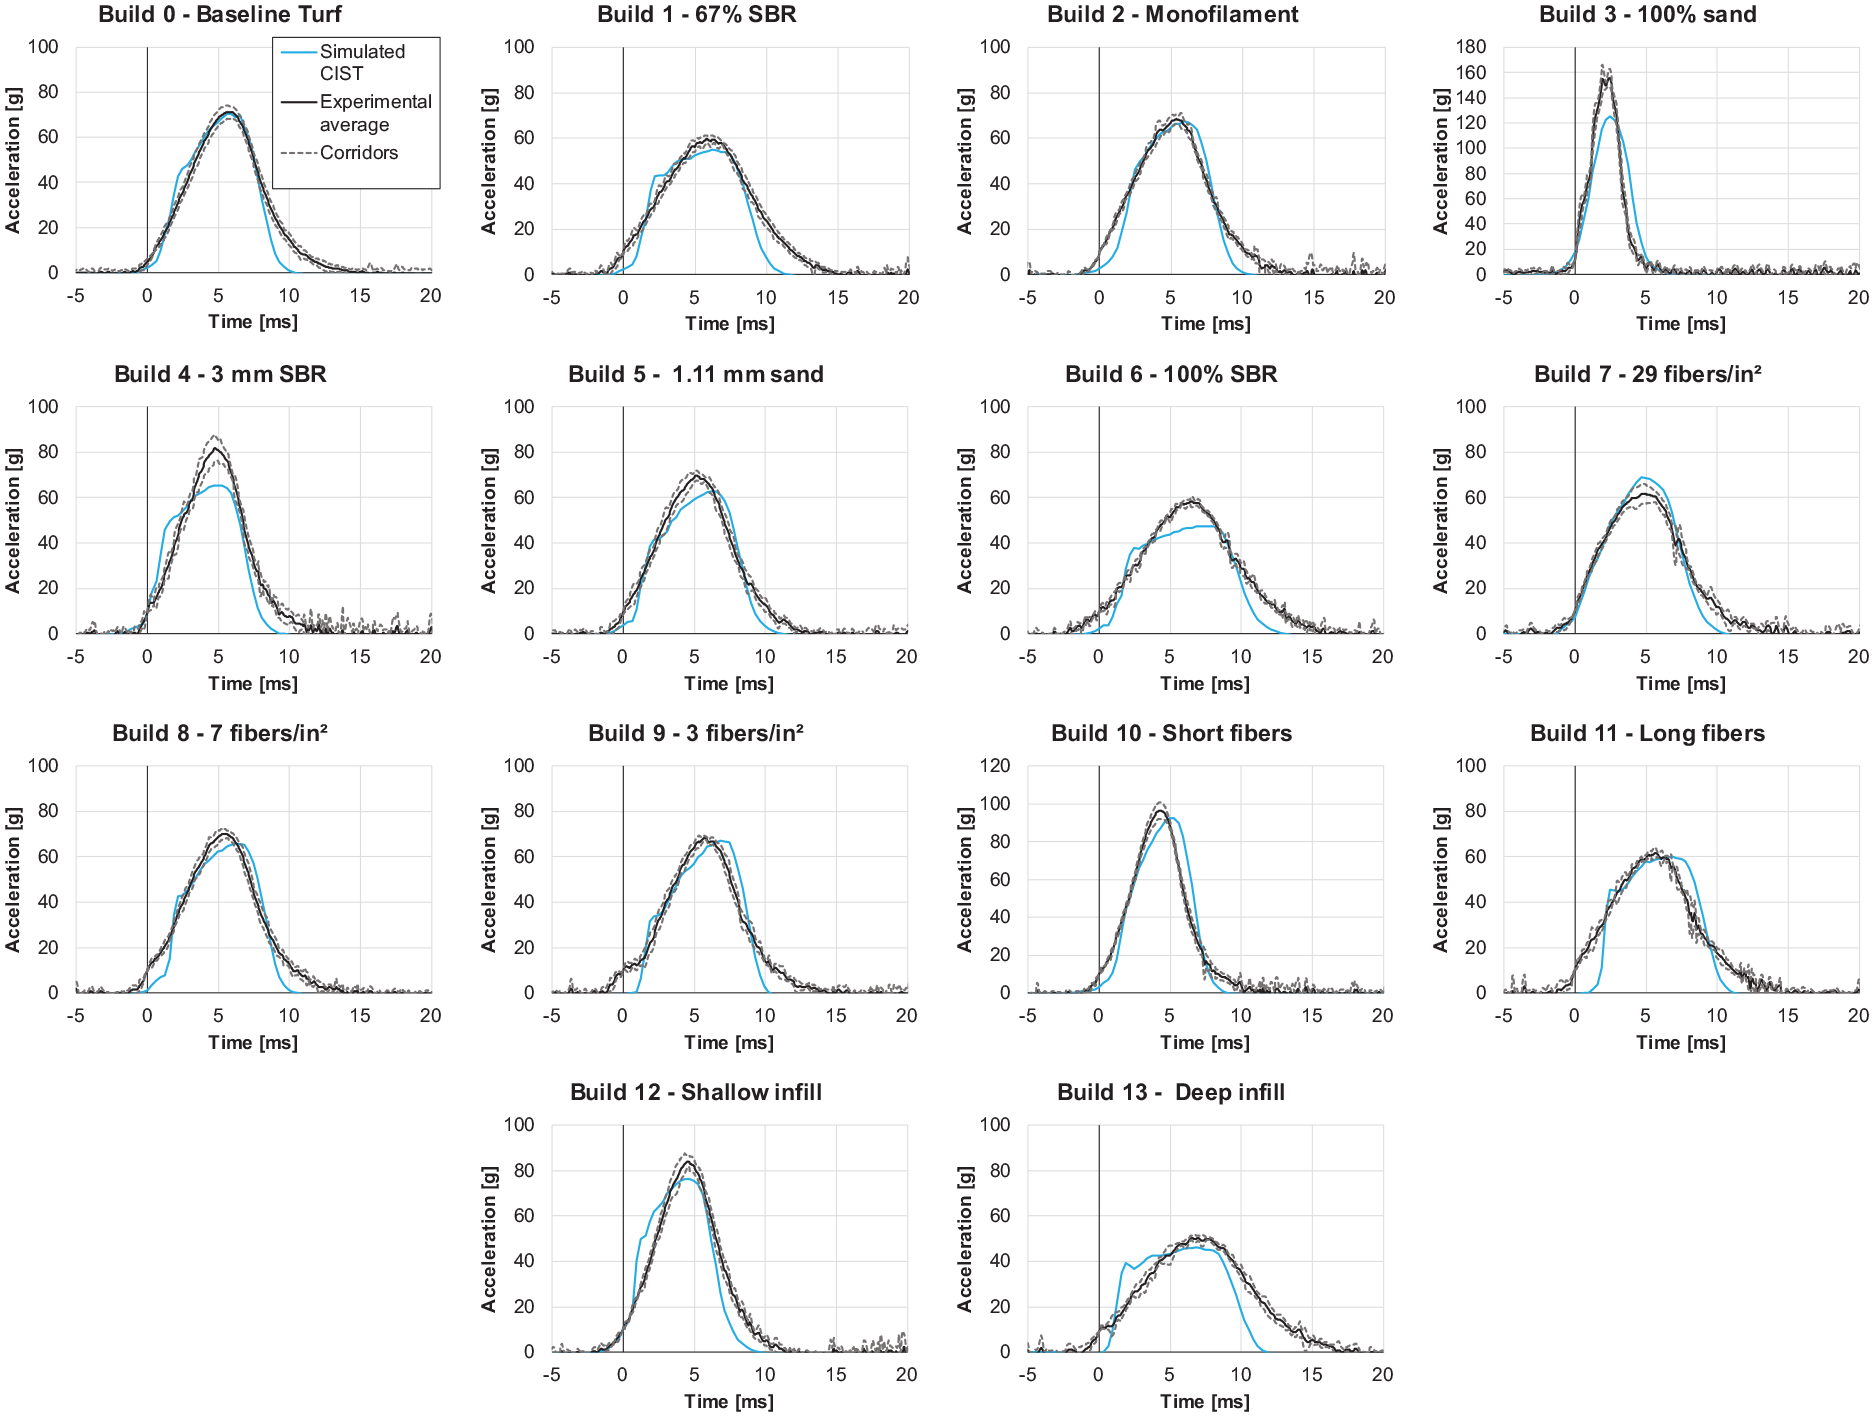
Hammer average acceleration for repeated CIST experimental tests (solid black lines) and standard deviation (dashed lines) for 14 turf configurations, and CIST FE model results (blue lines).
Synthetic turf FE models and impact simulations
The finite element impact simulation (Figure 4) was initiated by applying an initial velocity (V i ) to the hammer. First contact occurred between the hammer and the free length of the fibers above the infill, which deformed without any significant changes in the acceleration of the hammer. Upon contact with the turf infill, through-thickness compression of the turf was initiated with deformations localized in the region under the hammer. During the impact, sub-surface fibers buckled under the impacted region, while fibers outside of the direct impact region were not affected. In addition, some expulsion of the SPH elements, representing the infill, occurred on the surface at the impacted region. A very limited horizontal displacement of the infill was observed and much of the turf deformation occurred beneath the hammer at the top of the turf. The maximum acceleration corresponded to the maximum penetration of the hammer into the turf. Following maximum acceleration, the hammer rebounded vertically, corresponding to the unloading phase. For all the experiments, the increase (loading phase) and decrease (unloading phase) of the acceleration curve over time were nearly symmetric, with the decrease taking a slightly longer time (roughly 1 ms).
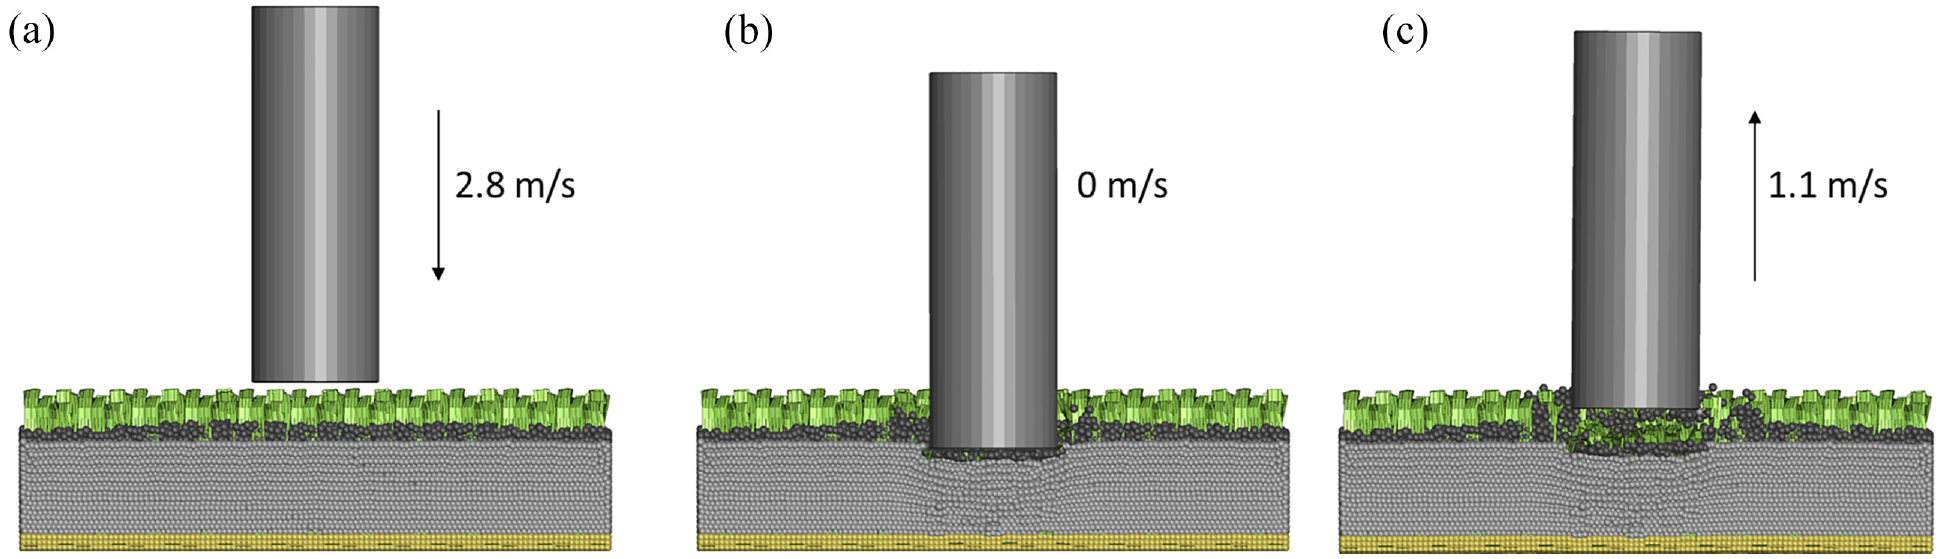
The simulated CIST model: (a) before the impact, (b) during the impact at maximum infill compression and maximum acceleration, and (c) on rebound, for the baseline model.
The hammer acceleration versus time predicted by the model demonstrated similar trends to the experimental data (Figure 5) with an average absolute difference of 9.7%. If the results from Build 3 were excluded from this calculation due to the substantial difference in material implementation the average absolute difference would be 8,8%. The maximum acceleration of the model was 125g for Build 3 (100% sand), and the minimum acceleration was 46g for Build 13 (deep infill; Figure 5(a)).
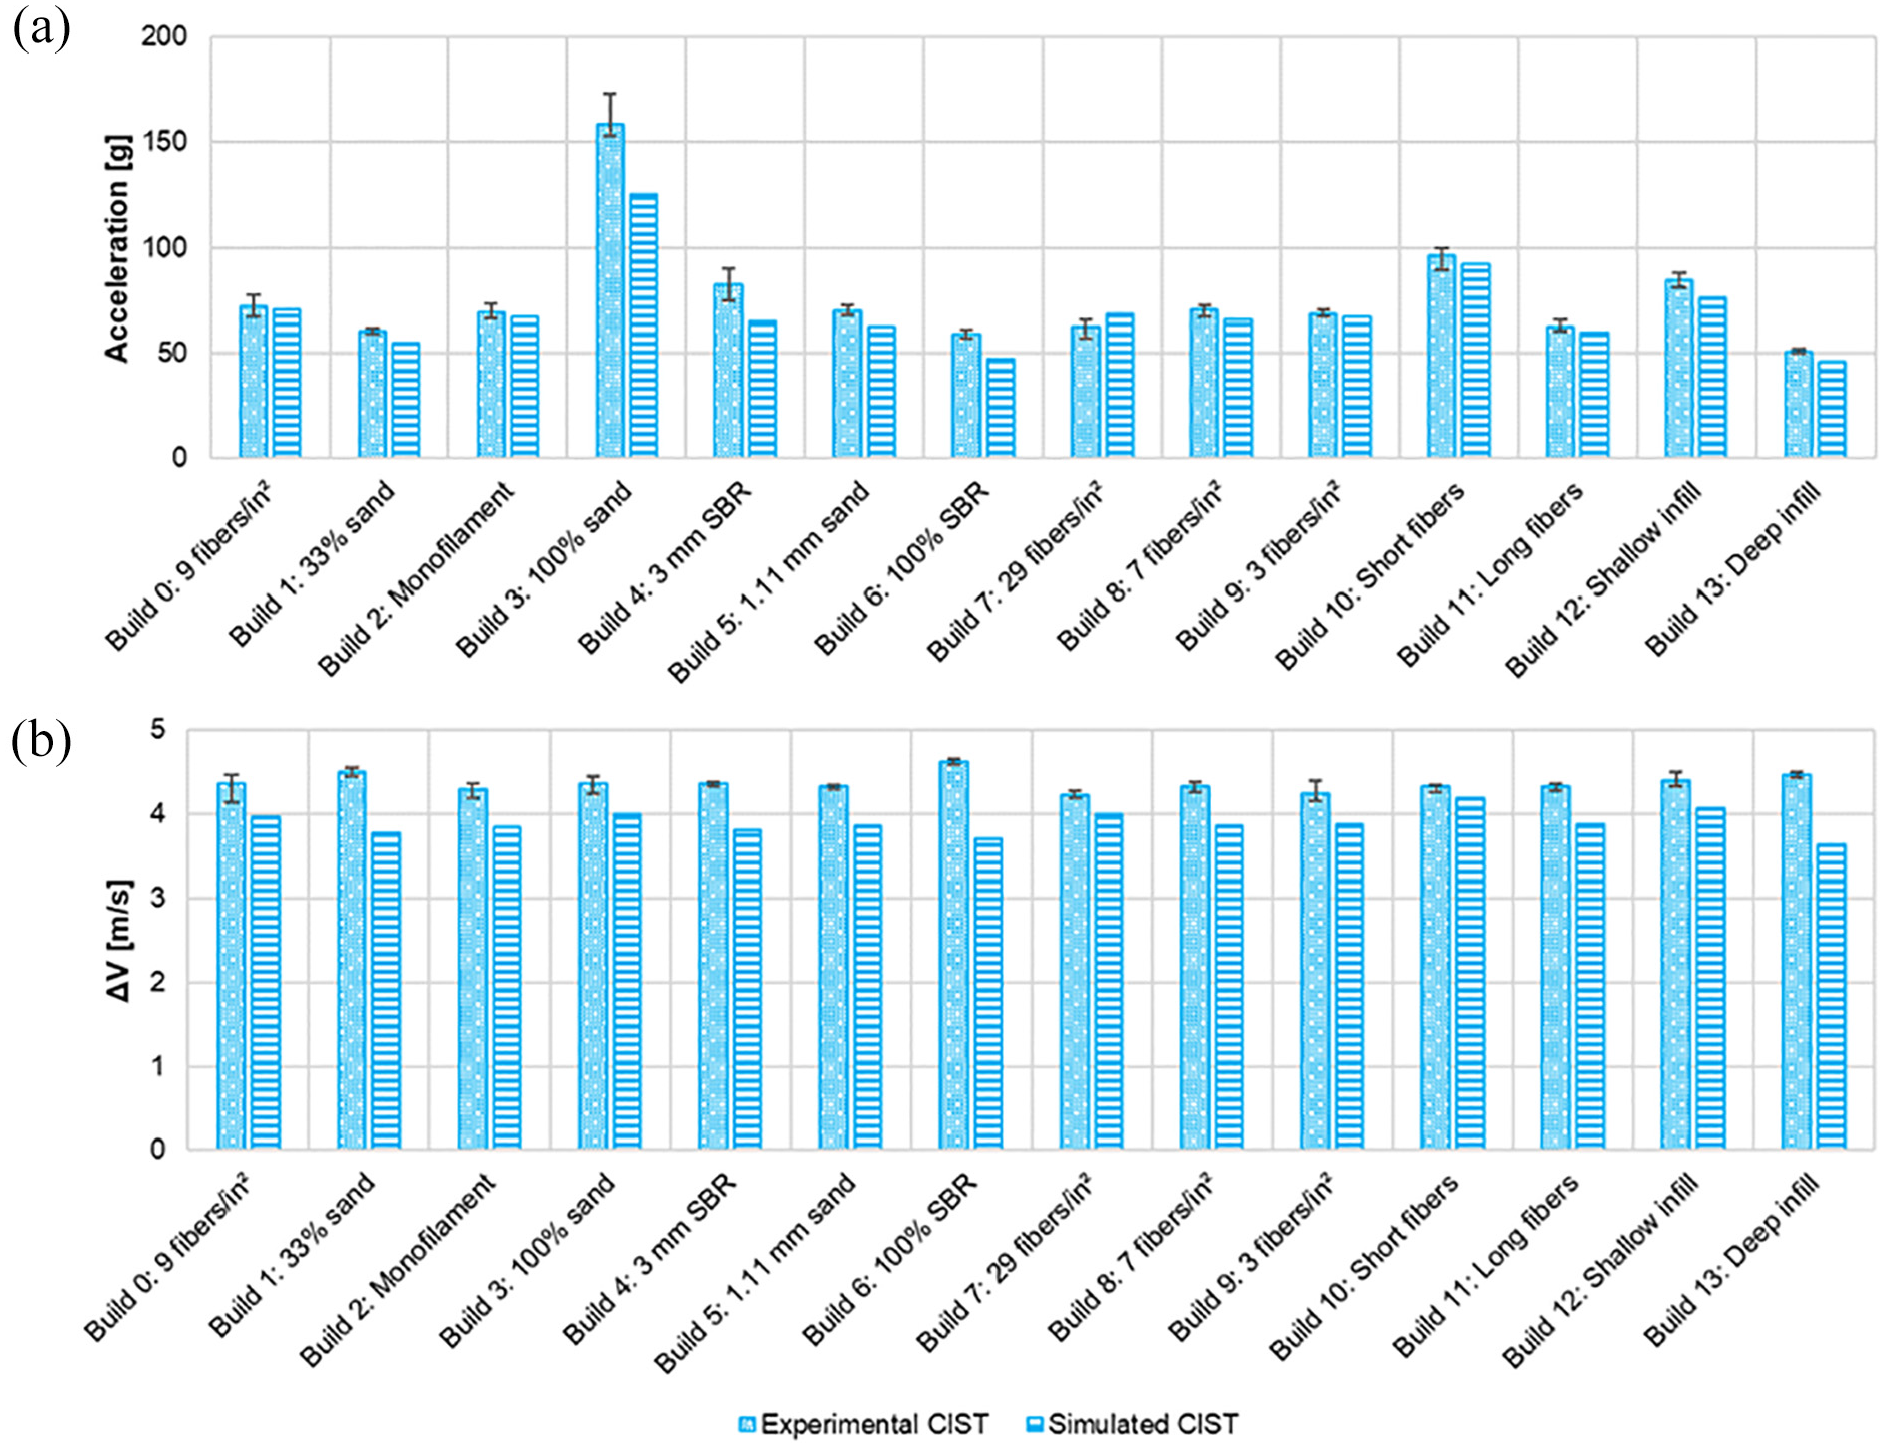
Comparison of the CIST average experimental results and model predictions for: (a) peak acceleration and (b) change in velocity (ΔV). The error bars represent the maximum and minimum values obtained from the experiments for each turf configuration.
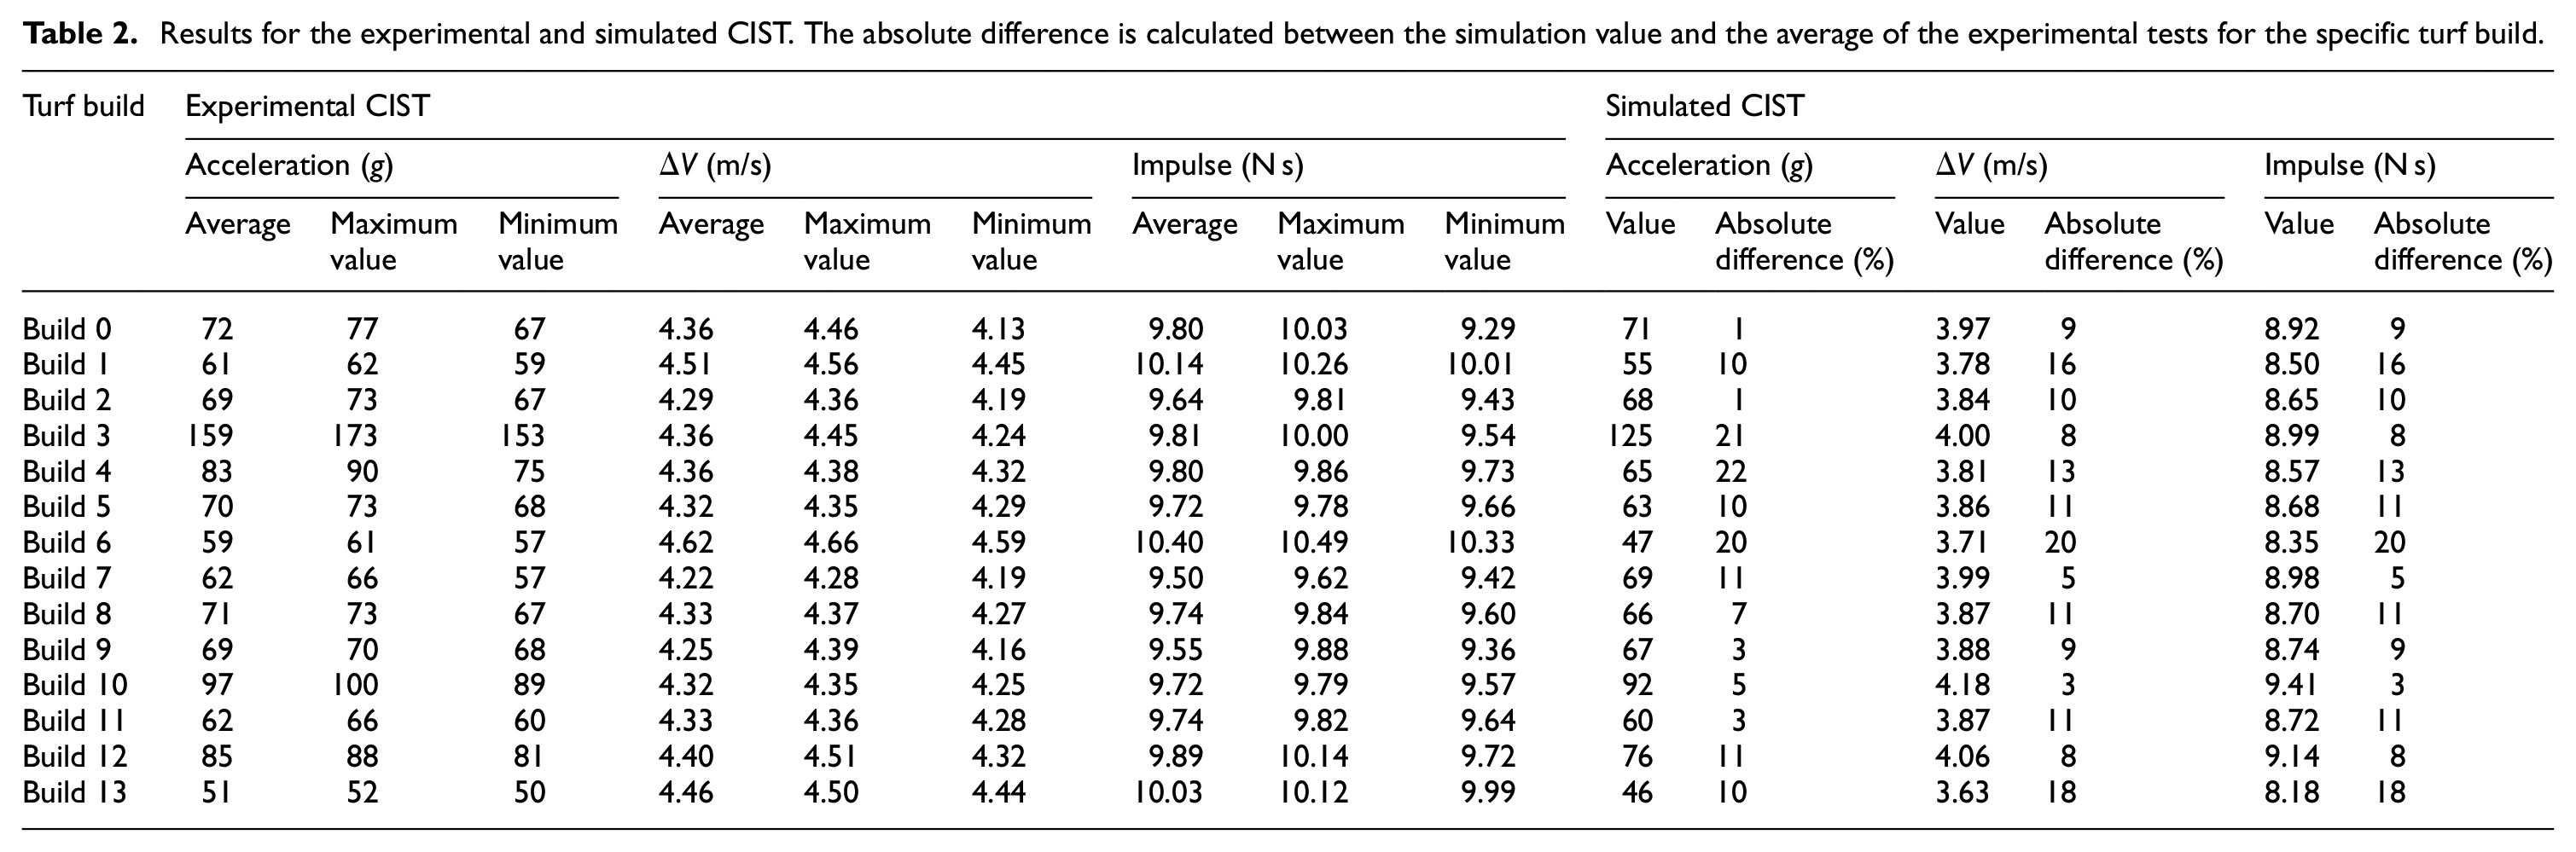
The predicted change in velocity (ΔV; Figure 5(b)), and the impulse from the models were in the same range as the experimental test results, with an average absolute difference of 10.8% (Table 2).
Results for the experimental and simulated CIST. The absolute difference is calculated between the simulation value and the average of the experimental tests for the specific turf build.
Discussion
The experimental CIST response presented low variability (small standard deviations) because the turf builds were constructed in a laboratory under very repeatable conditions. In general, the model was able to capture the acceleration curve shape, and the localized deformations under the hammer observed in the experiments. The peak accelerations of the experiments were more sensitive to the changes in the synthetic turf constructions as expected but the ΔV and impulse were not as sensitive. The model could clearly differentiate the turfs based on infill material, number of fibers, infill depth, and infill-to-fiber ratio. Overall, the experiments confirm that the CIST can be used to differentiate turf designs. In addition, the FE model runtime was small, taking a maximum of 31 h using 16 central processing units (CPUs).
As the peak accelerations of the experiments were reasonably captured by the simulation, the model could be used, for example, as an initial assessment if the peak CIST acceleration of a turf construction would be below the 100g criterion for synthetic sports playing fields. 15
Traditional soil material model approaches provided a good representation of the yield surface for the sand-only infill (Build 3). However, owing to the compressibility of the infills containing SBR, an alternative definition of the shear yield was required, as recommended in the literature. 24 The equal area under the shear-stress strain response from the direct shear tests provided a good representation of typical SBR-based infills that may include considerable volumetric compression under loading, as evidenced by the good correspondence between the model and experiments.
It is important to note that V i is a constant negative value and V f is always a positive value. Therefore, a reduction in ΔV (= V f − V i = V f + 2.85 m/s) represents a lower V f due to more energy being dissipated by the system. The ΔV and the impulse of the simulations were consistently lower than the experiments suggesting the simulated turf dissipated more energy, particularly in the unloading phase, compared to the experimental tests. The higher energy dissipation may be associated with the elastic-perfectly plastic soil material model for the infill not fully replicating the behavior of the real turf after yielding and further investigation is required. This finding follows a previous study, which identified that the unloading response of the model may be improved by the implementation of a hyperplastic material model with user-defined pressure-volume and pressure-dependent yielding responses. 24
In this study, both the model and experiments showed an increase in peak acceleration with the increase in infill sand proportion, the reduction of fiber length, and the reduction of infill depth, as expected. However, the stitch density showed a non-linear relation to the peak acceleration. The peak acceleration increased with the stitch density for Builds 0, 8, and 9. The exception to this trend was Build 7, the turf with the highest stitch density (Figure 6). The change in the pattern observed for Build 7 was attributed to the considerable increase in friction caused by the change in the dominant friction mode from infill-infill and infill-fiber interaction to fiber-fiber interaction. In addition, the differences in ΔV and impulse among the turf models were small, as reported in the experiments.
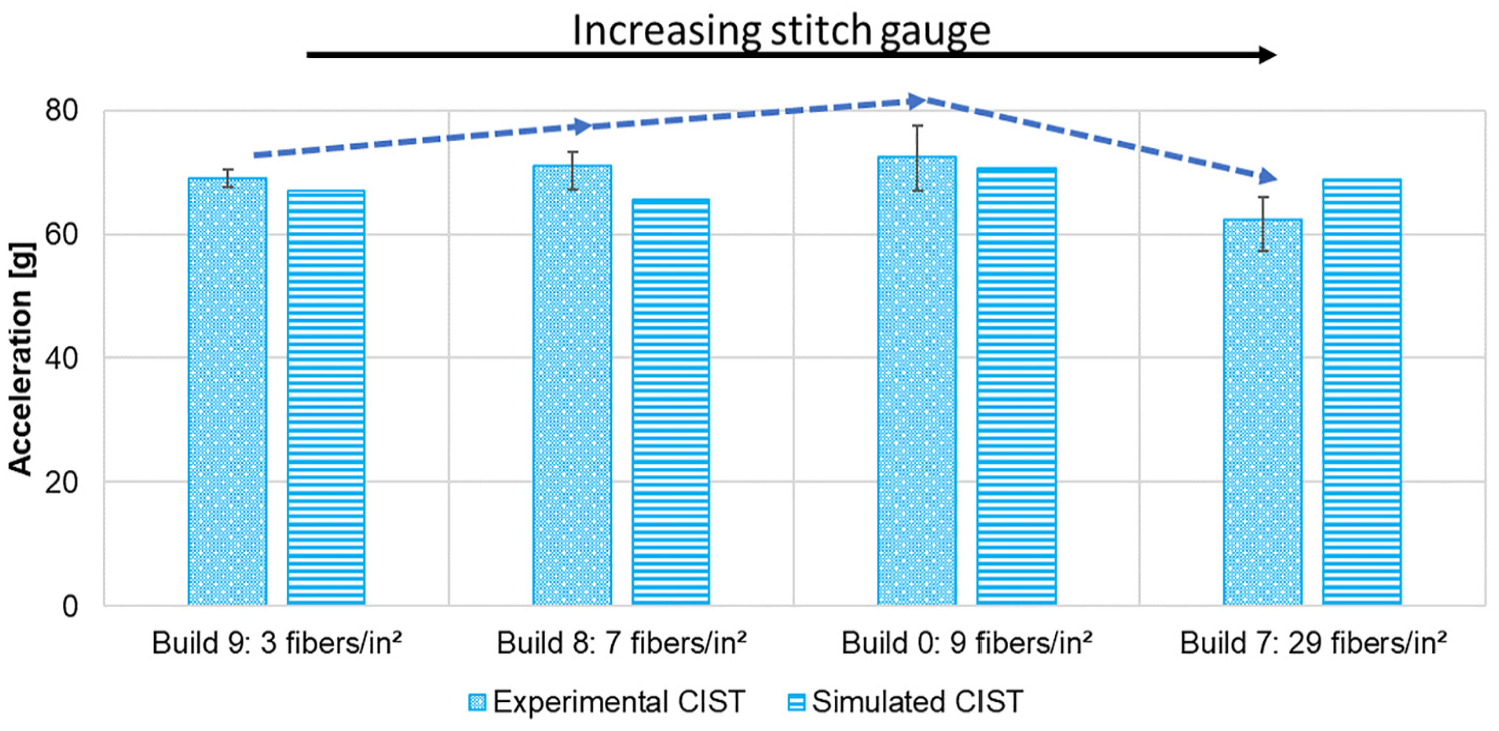
The effect of the number of fibers on maximum acceleration with the dashed lines representing the change in the acceleration trend.
Some limitations were identified in the current study. The 14 turf builds were tested in pristine condition in lab-scale trays and did not consider wear or variability of in-service sports fields.
The models were only assessed for the builds considered in this study, which represented a wide range of third-generation turf constructions. Designs outside of this range may require additional assessment. Future research should consider tests on in-service fields and the effects of service life and maintenance on playing surfaces.
Conclusions
The current study developed and assessed a CIST-turf FE model using novel experimental data for 14 different synthetic turf constructions. The experiments demonstrated a range of peak accelerations from 51 to 159g, with low variability for repeat tests on individual turfs. The FE models were able to predict the peak acceleration of the turfs and followed trends resulting from varying infill material, infill depth, and fiber geometry. The model predicted the turf deformation to be localized in the region under the hammer, as was observed in the experiments. Going forward, the proposed methodology could be used to assess new turf designs, reducing the need to expend resources on large amounts of materials or testing.
Footnotes
Appendix
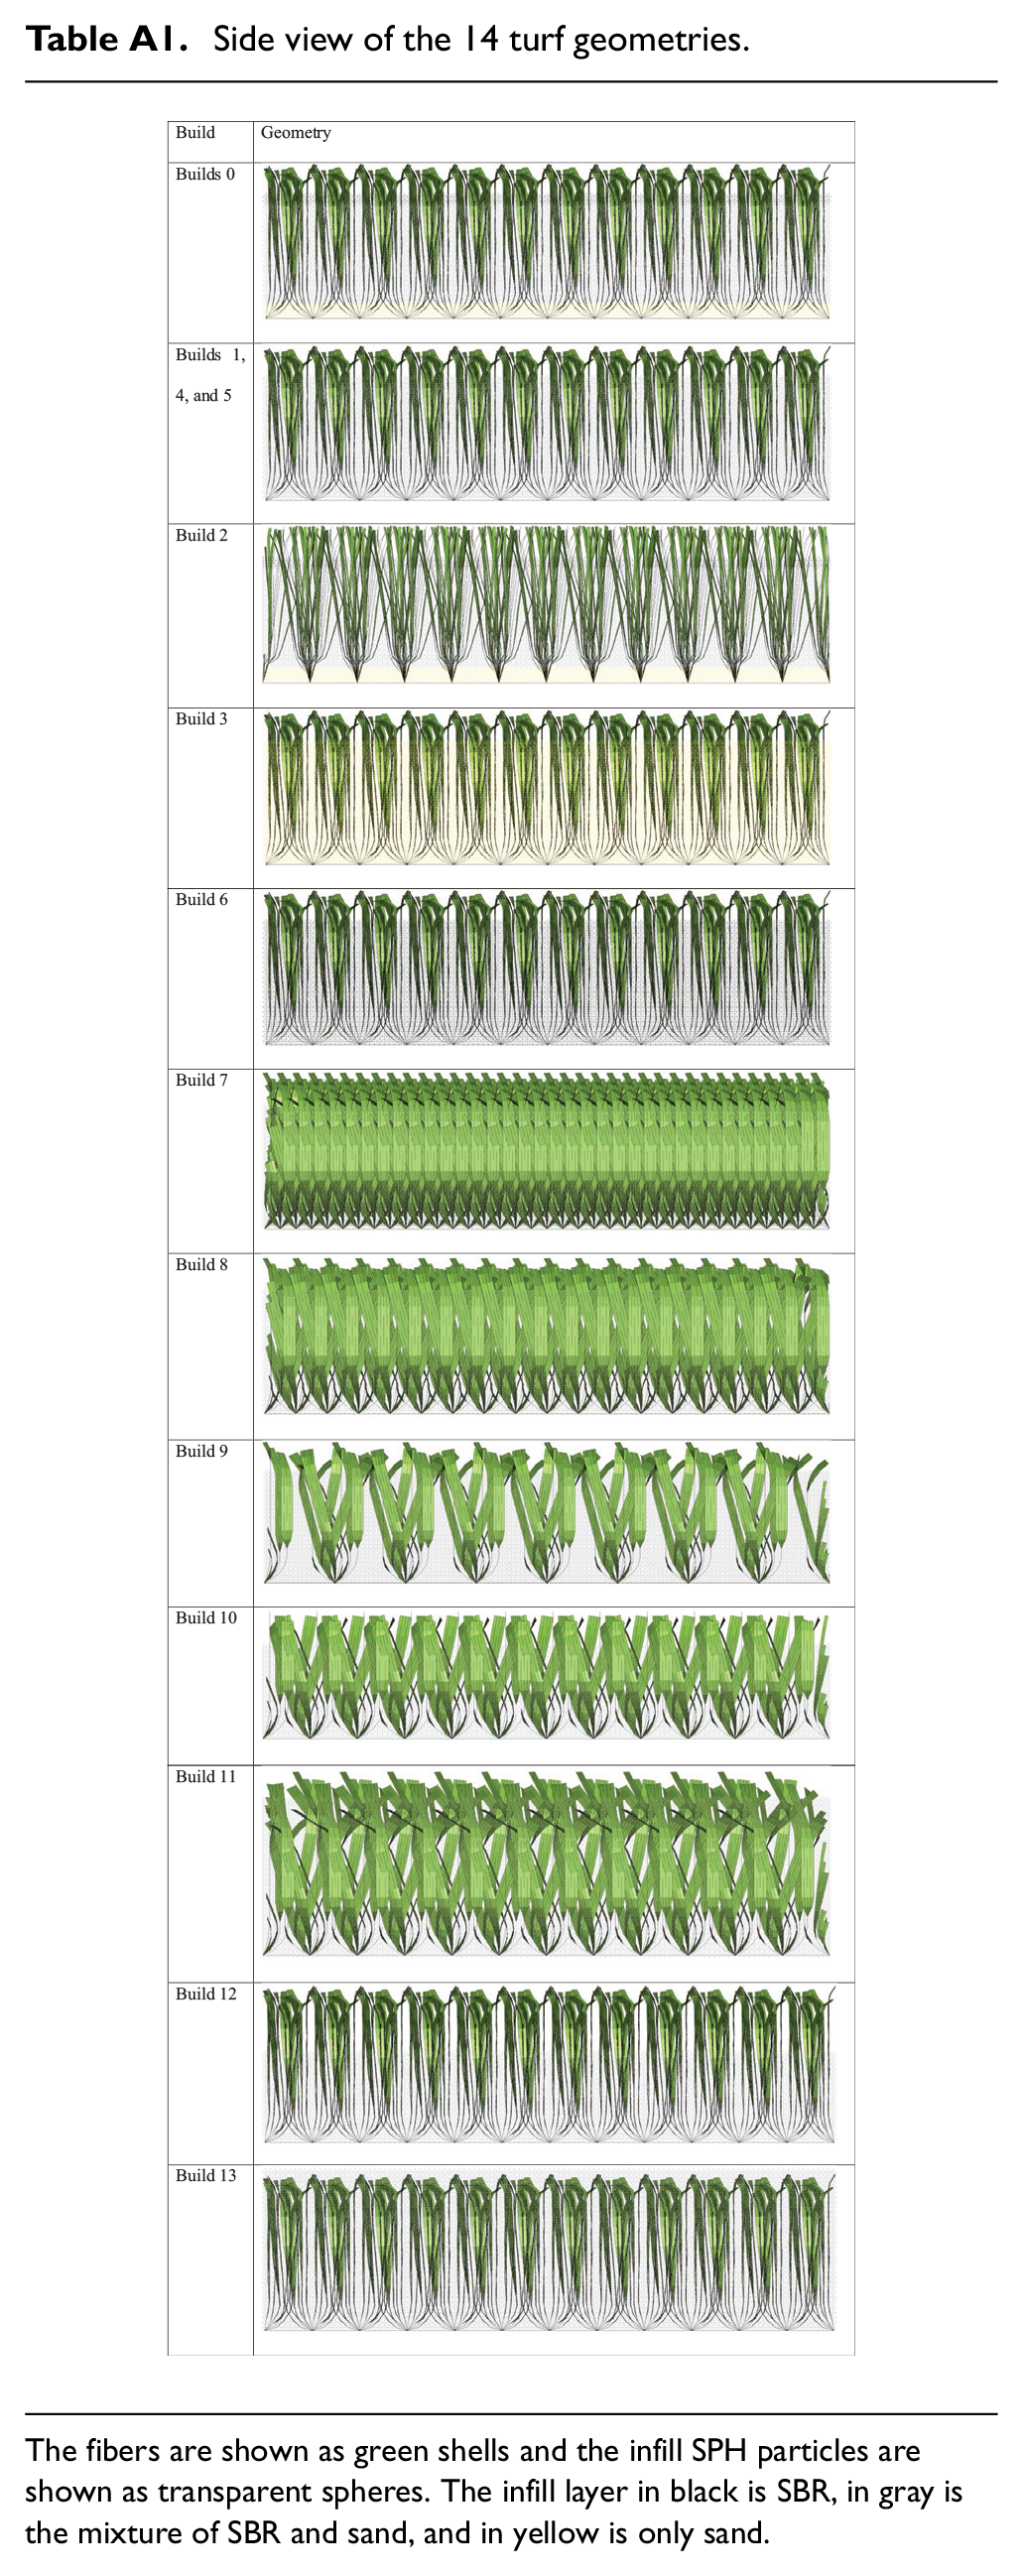
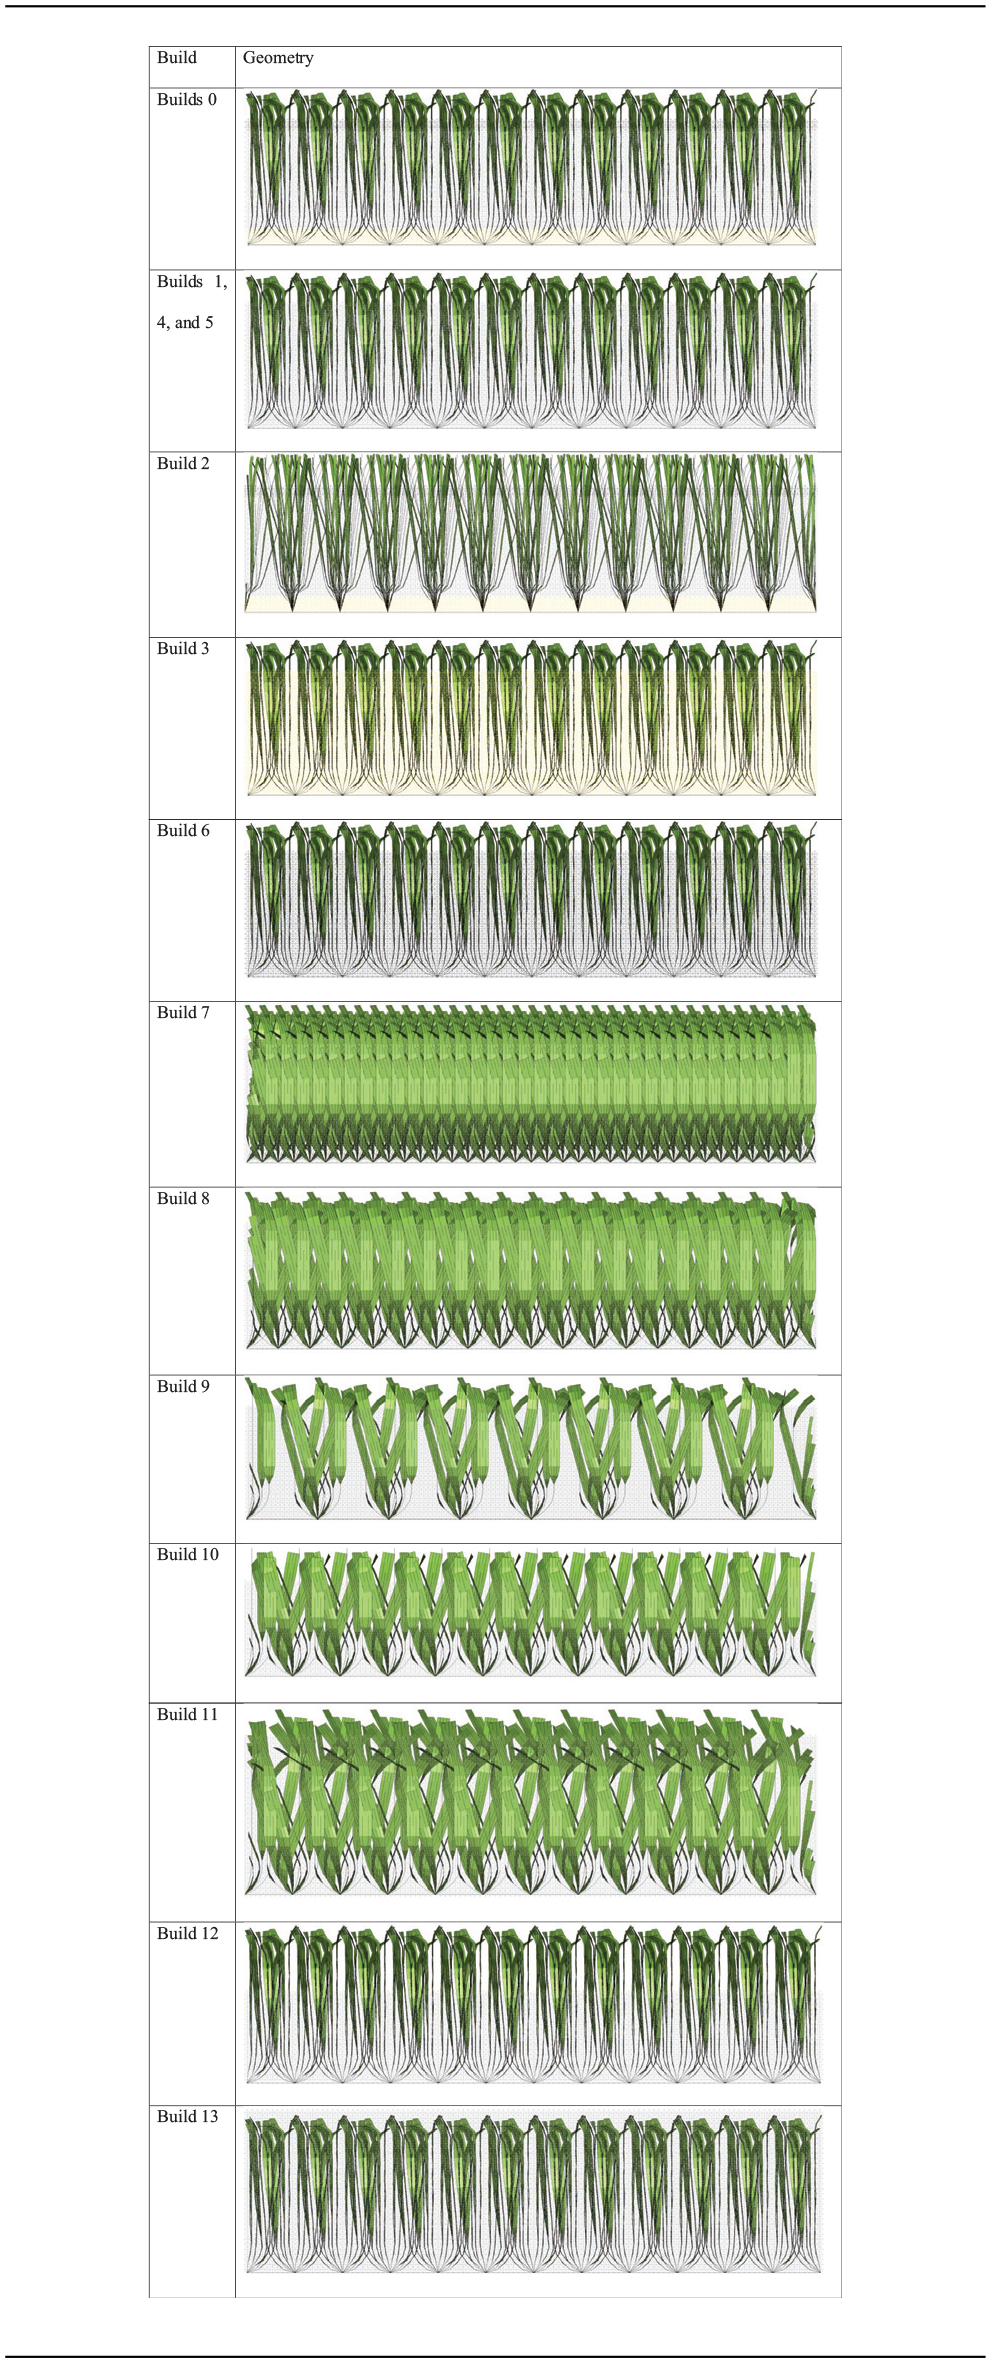
Side view of the 14 turf geometries.
|
The fibers are shown as green shells and the infill SPH particles are shown as transparent spheres. The infill layer in black is SBR, in gray is the mixture of SBR and sand, and in yellow is only sand.
Declaration of conflicting interests
The author(s) declared no potential conflicts of interest with respect to the research, authorship, and/or publication of this article.
Funding
The author(s) disclosed receipt of the following financial support for the research, authorship, and/or publication of this article: The authors would like to express thanks to Biocore, LLC and Compute Canada for their support of this research. Additionally, the research presented in this paper was supported in part by the National Football League and the National Football League Players Association. The views expressed are solely those of the authors and do not represent those of the NFLPA, the NFL, or any of their affiliates.