
Abstract
This article presents a constant force–controlled cutting approach with two different geometries of cutting tools. The methodologies for establishing two theoretical models were proposed to quantitatively predict the required applied normal forces at the expected machined depths, which were obtained with a solution to the horizontal projection of the sample–tip contact area and the multi-edge form tip based on a generalized cutting approach, respectively. The selection of the proposed theoretical models is dependent on the two material removal states, respectively, in which one is plowing for a regular triangular pyramid and the other one is cutting chips for a single-point diamond tip. To verify the feasibility and effectiveness of the proposed theoretical models and cutting strategy, a constant normal force cutting of microgrooves was implemented on a single-crystal copper substrate, while realizing constant cutting depths. The difference between the setting normal forces and the theoretical normal forces was analyzed by comparing the experimental results and the model prediction results. The aim of the present study was to investigate the effect of the geometry of the cutting tools on the material removal state and on the selection of the theoretical models.
Introduction
Nowadays, structures with submicrometer or nanometer feature have been widely used in various fields, such as optics functional sensors, 1 structural coloration of metallic surfaces 2 and micro/nanofluidic sensors. 3 However, the fabrication of these structures with the desired scale still faces great challenge. Research studies have used several approaches, including optical lithography, 4 charged beams lithography, 5 laser-based processing 6 and replication imprint lithography, to achieve these structures. 7 However, the disadvantages, such as complicated operations, high cost, low throughput and/or strict environmental requirement, greatly impede the application of these methods. Recently, some scholars utilized ultra-precision machining approaches, such as ultra-precision turning and milling to conduct the machining process of structures with submicrometer or nanometer scale.8–11 These mechanical machining methods have been proved to be easy operation, low environmental requirement and powerful techniques to obtain micro/submicron structures, whereas, the problem of cutting tool adjusting, especially for machining structures on the curved surface, is an important factor for the machining accuracy and efficiency.
The atomic force microscopy (AFM) tip–based nanomechanical machining technique has been more and more widely used to fabricate micro/nanostructures.12–16 In particular, it has been successfully applied to machine nanostructures on a micro-ball. 17 The characteristic of force modulation is employed to guarantee the contact between the probe and the sample surface during the machining process. However, the low throughput and limitation of the machining scale are the main problems for the AFM-based machining technique. Thus, some scholars referred to the principle of the AFM tip–based nanomechanical machining process to develop force modulation machining systems.18–21 Based on the developed systems, the groove arrays with constant machined depth have been fabricated on inclined and curved surfaces.19,21However, for the force modulation approach, the relationship between the applied normal force and machined depth is the foundation of the machining accuracy of the structures with desired dimensions. Wang et al. 22 employed the macrotribology theory to reveal the theoretical relationship between the applied force and machined depth for the multi-pass AFM tip–based machining process. Lin and Hsu 23 used the concept of specific down force energy to determine the minimum number of the scratching pass required to obtain an expected cutting depth. In their models, the geometry of the probe is only considered as sphere or cone. However, when conducting scratching process with different directions, the machined depth shows different values, and the material removal state is also related to the combination of the geometry and the machining direction.24–27 Thus, in our previous study, 28 the theoretical model is established by considering the tip geometry as a three-sided pyramidal with a spherical apex. Different material removal states have a large influence on the probe–sample contact area, which is the critical value in the theoretical model. Moreover, as to scratching in the face-forward direction mentioned in Geng et al., 28 the materials were dislodged with the formation of chips during machining process, whose presence enlarge the probe–sample contact area, while the enlarged value could not be evaluated, and it was not taken into consideration in our pervious theoretical model, which leads to a large difference between the calculated and experimental values of the machined depths with a given normal load. In addition, when scratching on the surface of some metals by the appearance of material pile-ups accumulated on the sides of the groove,25,29 the probe–sample contact area can be enlarged compared with the situation described in Geng et al. 28 Thus, this may result in low prediction accuracy of the theoretical model.
Therefore, in this study, to solve these two issues mentioned above, two theoretical models are developed. One model employed the macrotribology theory considering the probe geometry and the effect of the material pile-up. The other one is the multi-edge cutting model, which is suitable for the case of the formed chips not discharged effectively from the groove and enlarging the contact length between the chips and the main cutting edge. For these two conditions, two typical probes are selected, which are a regular triangular pyramid probe and a single diamond tool. Furthermore, experimental tests are conducted to demonstrate the feasibility of the proposed methodologies of the theoretical models.
Experimental setup and details
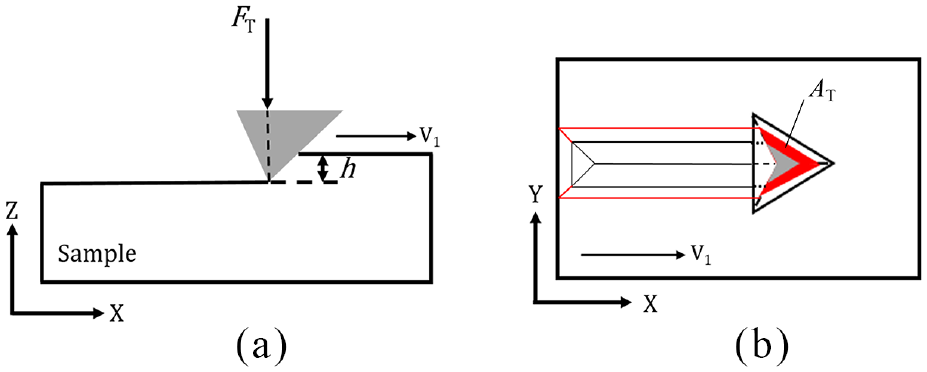
Figure 1(a) shows a photograph of the experimental setup with a modified micromachining system based on the normal force control. The system consists of two high-precision stages (X, Y) driven by air floatation and a coarse stage (Z) driven by a motor. PZT ceramics (PSt150/7/60VS12; COREMORROW, Harbin, China), a strain force sensor of 10-g capacity (LSB-200; FUTEK, Irvine, CA, USA), and a controller (UMAC; Delta Tau Data Systems, Los Angeles, CA, USA) were essential parts of the force-feedback control system and maintained the constant normal forces applied by the tool on the sample surface. Table 1 presents the specifications of the experimental apparatus.
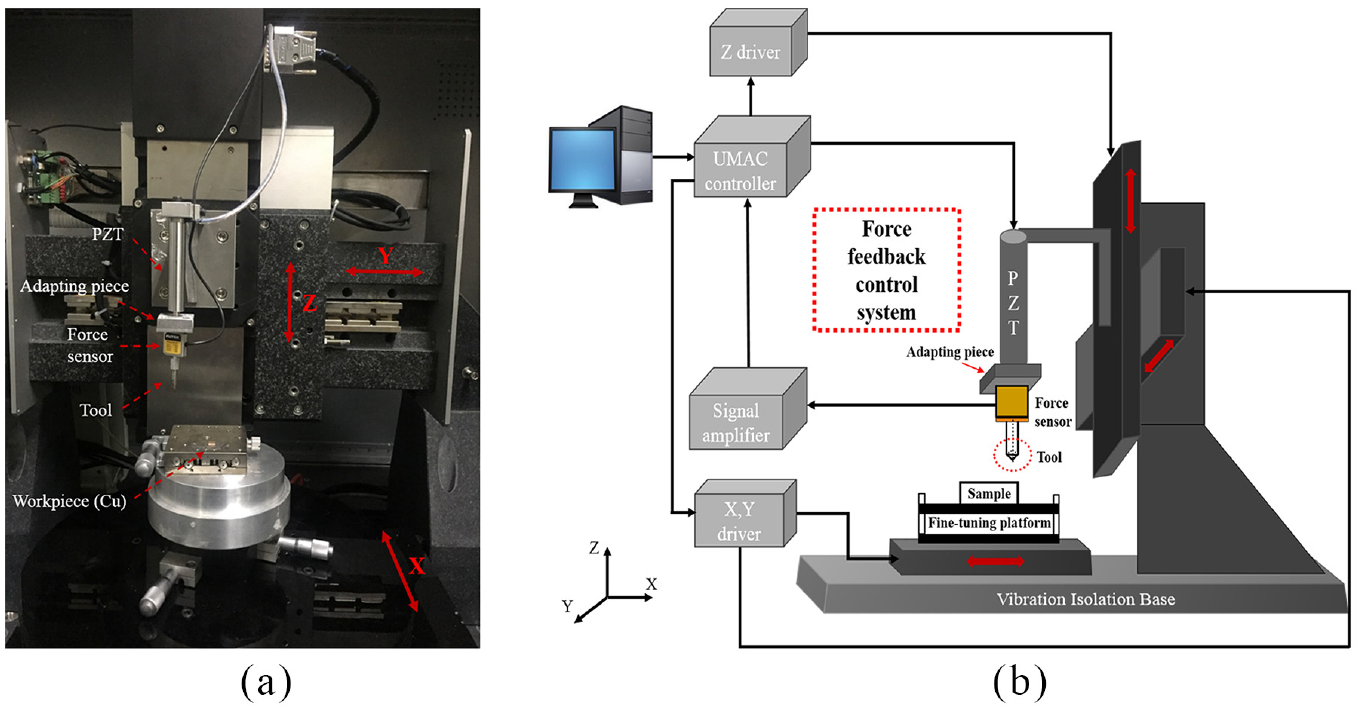
(a) Photograph of the experimental setup and (b) schematic representation of the proposed system.
Specifications of the experimental apparatus.
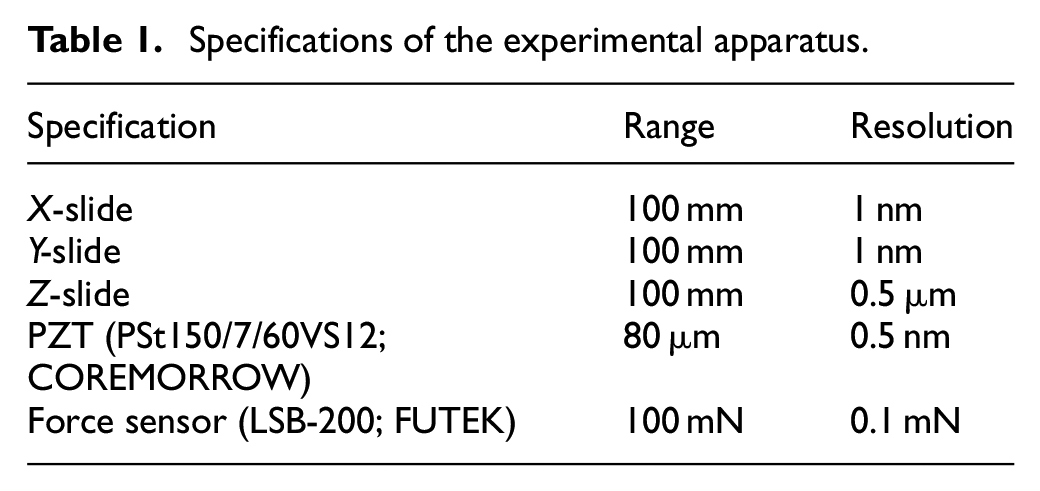
Figure 1(b) shows a schematic representation of the proposed system. During the cutting process, a high-sensitivity force sensor integrated with the tool holder measured the normal force between the tool and the sample. A displacement sensor for the tool position measurement was embedded in the PZT. When the force sensor detected the difference from the normal force applied, the output was sent to the PZT that implemented extension or retraction through the UMAC controller, depending on the case, to maintain the normal cutting force constant. This control principle is known as a force-feedback control system. The schematic diagram of the control system and the properties and parameters of the controller are presented in the previous study. 30
Figure 2 shows the scanning electron microscopy (SEM) images of a regular triangular pyramid (CUBECORNER/020; Synton-MDP, Nidau, Switzerland) and a single-point diamond tip. The regular triangular pyramid with a face angle of 35.26° and an apex angle of 90° and the single-point diamond tip with a rake angle γo of 0°, a clearance angle αo of 6° and a tool included angle εr of 60° were used in the cutting process. By AFM scanning of the three edges of the regular triangular pyramid and the single-point diamond tool, the arc radii of the tip (R) was estimated to be 260 and 463 nm, respectively. A single-crystal copper piece measuring 5 mm × 5 mm with the surface orientation of [110] (Hefei Kejing Materials Technology Co., Ltd., Anhui, China) is selected as the sample in this work. The surface roughness (Ra) measured by AFM in the range of 50 μm × 50 μm was less than 5 nm. The cutting tools conducted nanoscratching on Cu (110) along the [110] direction so that the crystallographic orientation has not much influence on the machined depths when scratching in the same direction. The mechanical properties of Cu (110) specimen were derived from the crystal plasticity finite element simulations and experiments of nanoindentation tests. The hardness and Young’s modulus are 1.46 and 138.6 GPa, respectively. 31 The feed speed and machined length are 0.5 mm/s and 1 mm, respectively. A commercial AFM (Dimension Icon; Bruker Corporation, USA) was used to obtain the surface topography information of the machined microstructures with the scan size of 50 μm × 50 μm by tapping mode. A silicon tip (TESPA; Bruker Company) was selected with a normal spring constant of 40 N/m and resonance frequency of 320 Hz.
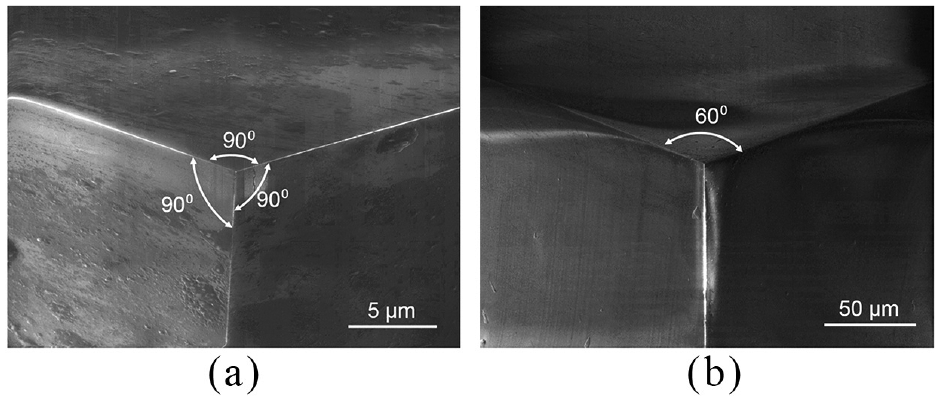
SEM images of (a) the regular triangular pyramid and (b) the single-point diamond tip.
Construction of theoretical models for nanoscratching
Model for a regular triangular pyramid
In the typical micro/nanoscratching process, the triangular pyramid tip is usually selected as the cutting tool,32,33 and the traditional tribology theory is always used to describe the scratching process.22,34 However, in the previous works,28,35 the influence of material pile-ups accumulated on the sides of the groove was not considered in the developed models, which may introduce a prediction error, especially for the materials that are easy to accumulate. In this study, the following equation formulated by Bowden and Tabor 36 was introduced to calculate the theoretical normal forces

where σP is the yield pressure of the substrate material and AT is the horizontal projection plane of the tip–sample contact area.
As shown in Figure 3(a), the triangular BCD was the interface of the spherical crown and the surface of the triangular pyramid, denoted by I-surface. Thus, the three edges of the triangular pyramid were considered to be tangential to the spherical crown. Furthermore, O′ represents the center of the spherical crown with radius R. The projection of the triangular pyramid apex A in I-surface is denoted as O. Moreover, θ is the half of the apex angle, which means 45° as shown in triangular ACD; ψ is the included angle between the edge and the axis of triangular pyramid; and Δ′ represents the height of the spherical crown along the axis, as shown in Figure 3(b). Most importantly, the depth of the machined grooves was considerably larger than the radius of the spherical crown in the case of the regular triangular pyramid.
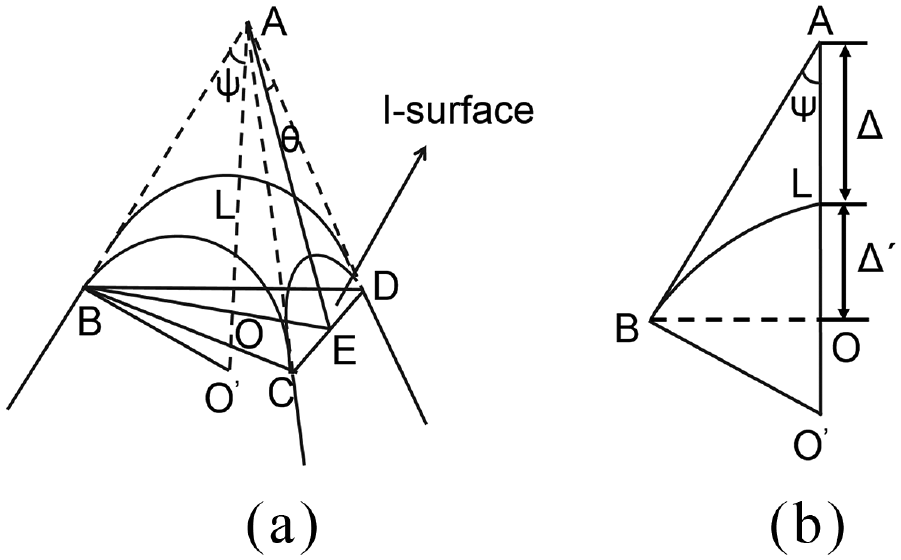
(a) Geometry of the regular triangular pyramid and (b) a section of the triangular ABO′.
Under these conditions, the following expression was obtained
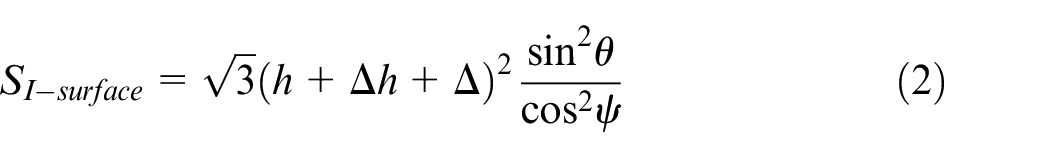
where h is the depth of the machined microgrooves and Δh is the height of the pile-up. The Δh was considered here because it contributed to enlarging the tip–sample contact area, as shown in the red area of Figure 4(b). As shown in Figure 4(a), the tip is oriented edge-forward relative to the scratching direction V1, which was defined as the three edges and two surfaces of the cutting tool involved in the machining process. A pile-up always existed in the case of scratching along V1. Figure 4(b) shows the horizontal projection plane AT corresponding to the edge-forward scratching direction V1.
Schematic representation of the edge-forward scratching direction V1: (a) Side view of the scratching process and (b) front view of the scratching process.
Given the distance from the apex A to the spherical cap L, as shown in Figure 3(b), Δ was defined as follows
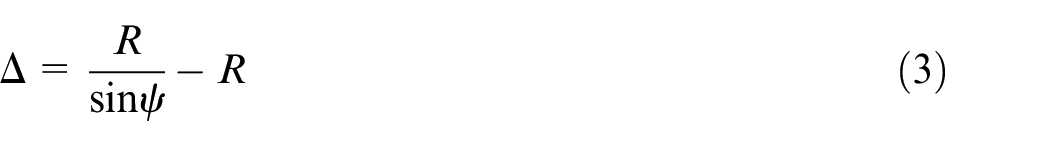
Because equations (2) and (3) were defined in terms of sinψ and cosψ, their values had to be calculated first. Therefore, on the basis of the triangular AOB, ψ was equal to 55°. Furthermore, in the calculation of AT, the scratching direction had a significant effect. Taking the edge-forward direction into account, the two surfaces of the tip were involved in the machining process. Thus, the following equation was obtained
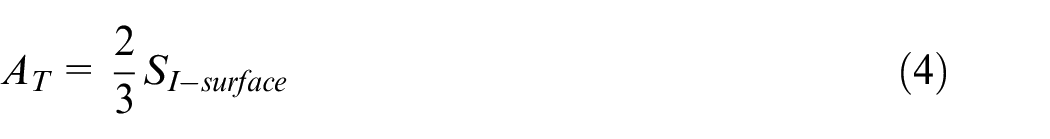
Next, on the basis of the previous results, FT was calculated by substituting equations (2) and (4) into equation (1), as follows
Model for a single-point diamond tip
In some practical applications, the single-point diamond tool is chosen instead of the triangular pyramid tip to improve the machining accuracy and guarantee the formation of chips. However, during the cutting process, chips can be usually generated, and the contact area between the chips and the cutting tool can enlarge AT expressed in equation (1), which cannot be determined by the model developed in section “Model for a regular triangular pyramid.” This case is similar to the face-forward scratching condition for the triangular pyramid tip, which showed a large difference between the experimental results and the predicted values. In this section, the prediction model for a single-point diamond tool in the face-forward scratching direction was discussed, as shown in Figure 6(a), which was defined as two edges and one surface of the cutting tool involved in the machining process. This cutting form was similar to that in the case of multi-edge tool machining. Unlike the previous model of the regular triangular pyramid, when conducting face-forward scratching, almost no horizontal projection of the tip–sample contact area was observed due to the 0° rake angle of the tip. This implied that the tip–sample contact area did not contribute to AT in the face-forward scratching direction, which led to the calculated machined depth of infinity. Thus, the model for a regular triangular pyramid was not suitable for a single-point diamond tip. Then, a prediction model of the normal forces at an expected cutting depth was developed for machining with the multiple edges of a single-point diamond tip along the face-forward scratching direction.
Figure 5 depicts the geometric model of the single-point diamond tip and a section of the triangular ABO′. Figure 6 shows the schematic representation of the face-forward scratching direction V2 and a section of the triangular ACD.
(a) Geometry of the single-point diamond tip and (b) a section of the triangular ABO′.
(a) Schematic representation of the face-forward scratching direction V2 and (b) a section of the triangular ACD.
Figure 6(a) shows that the resultant cutting velocity was perpendicular to the vector CD, which joined the extreme points of the active cutting edges in the rake face plane of the tool, and was parallel to the normal plane Pn, which made it possible to determine the two-dimensional orthogonal cutting of the chip formation process in this study. In such cases, the chip velocity Vch was normal to the vector CD (i.e. the chip flow angle ηc = 0°). Note that when the cutting process is considered to be orthogonal cutting, the inclination angle λs = 0° because the feed force FR is equal to zero.
The practical components of the theoretical normal force, FQ, in orthogonal cutting were the corresponding area of cut force, FaQ, generated by the shearing and friction during chip formation, together with the edge force, FeQ, generated by the rubbing and plowing processes between the active cutting edges and the machined surfaces. Thus, the following expression 37 was obtained

The area of cut force was given by
where φn, βn and τ are the normal shear angle, normal friction angle and the shear flow stress in the thin shear zone with respect to the cutting edges and the normal plane Pn, respectively. The calculation details can be found in the Supplemental material.
Next, the edge force was calculated as follows
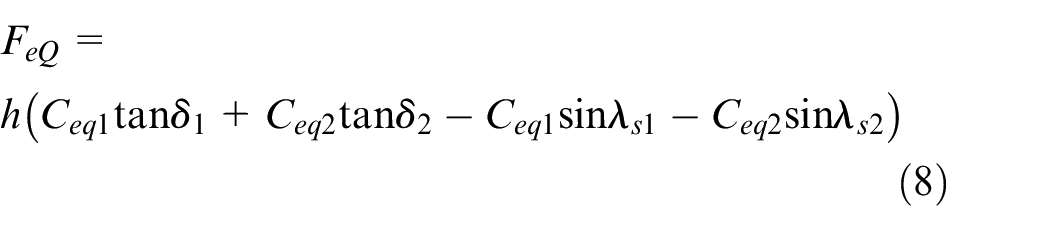
where Ceq1, Cep1, Ceq2 and Cep2 are the edge force coefficients for each edge, which were estimated in the Supplemental material.
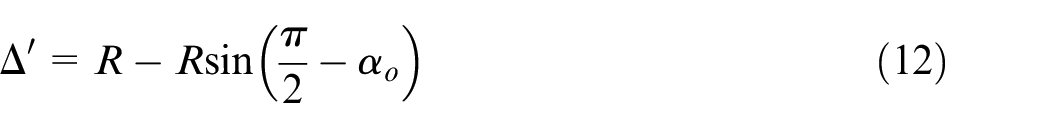
In particular, the influence of the spherical crown on the value of the edge force (FeQ) was considered. When the machined depth was smaller than the height of the spherical crown Δ′, the spherical crown contributed most to the edge force
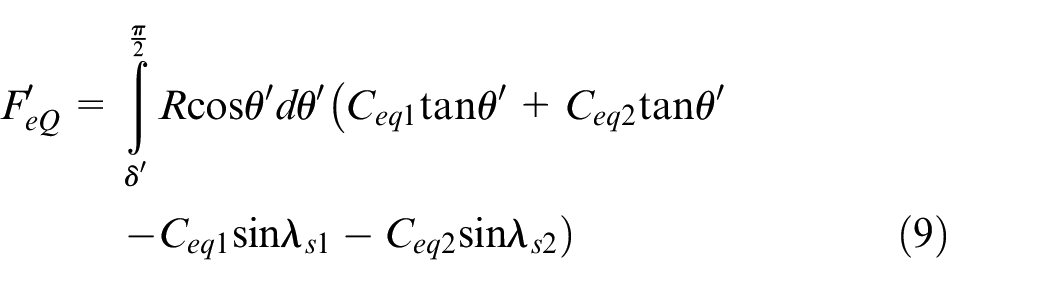
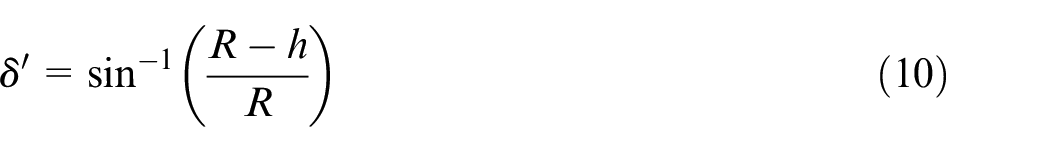
where θ′ is the angle between the tangent of the point on the spherical crown below the machined depth and the axis. δ′ is the angle between the tangent of the machined depth corresponding to the point on the spherical crown and the axis, which can be estimated from the following relations
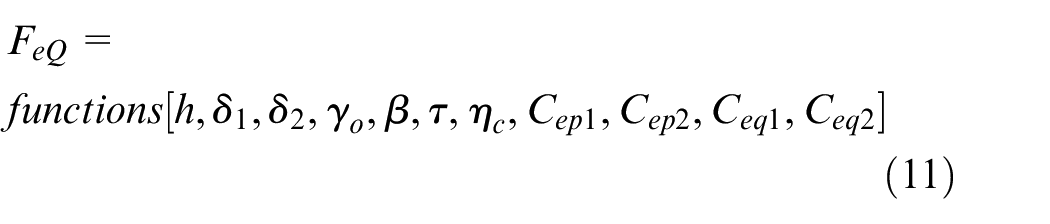
Given the previous results, combining the relevant parameters of specified angles, the theoretical normal force was determined as follows
Results and discussion
Scratching with a regular triangular pyramid
On the basis of the proposed strategy and the developed force-feedback control system, the experiments of microgroove cutting with a regular triangular pyramid were first conducted. In the present study, the reference forces were set as 0.6, 0.7, 2, 4, 8, 10, 14, 18, 20 and 30 mN. Depending on the force-feedback control system, the normal forces had to be kept constant to the setting reference forces for the entire cutting process. In addition, the feed rate and the scratching length were set as 500 μm/s and 1 mm, respectively.
Figure 7 shows the SEM and AFM images of machined microgrooves with respect to the setting normal forces of 0.6, 2 and 14 mN. The constant depths evaluated to be 0.38, 0.54 and 2 μm were achieved, as shown in the section profiles of the AFM images. This implied that the applied normal forces were successfully kept constant. Furthermore, during the scratching process, the negative rake angle between the two surfaces of the tool used in the cutting and the sample surface was very large; therefore, the material extruded to both sides of the machined microgrooves. Thus, the material removal state by plowing was achieved rather than generating cutting chips, which is illustrated in the SEM images. The height of the pile-up was slightly lower than the depth of the machined grooves caused by the dislocation deformation and the compression effect of the material, which were evaluated to be 0.33, 0.47 and 1.89 μm, respectively.
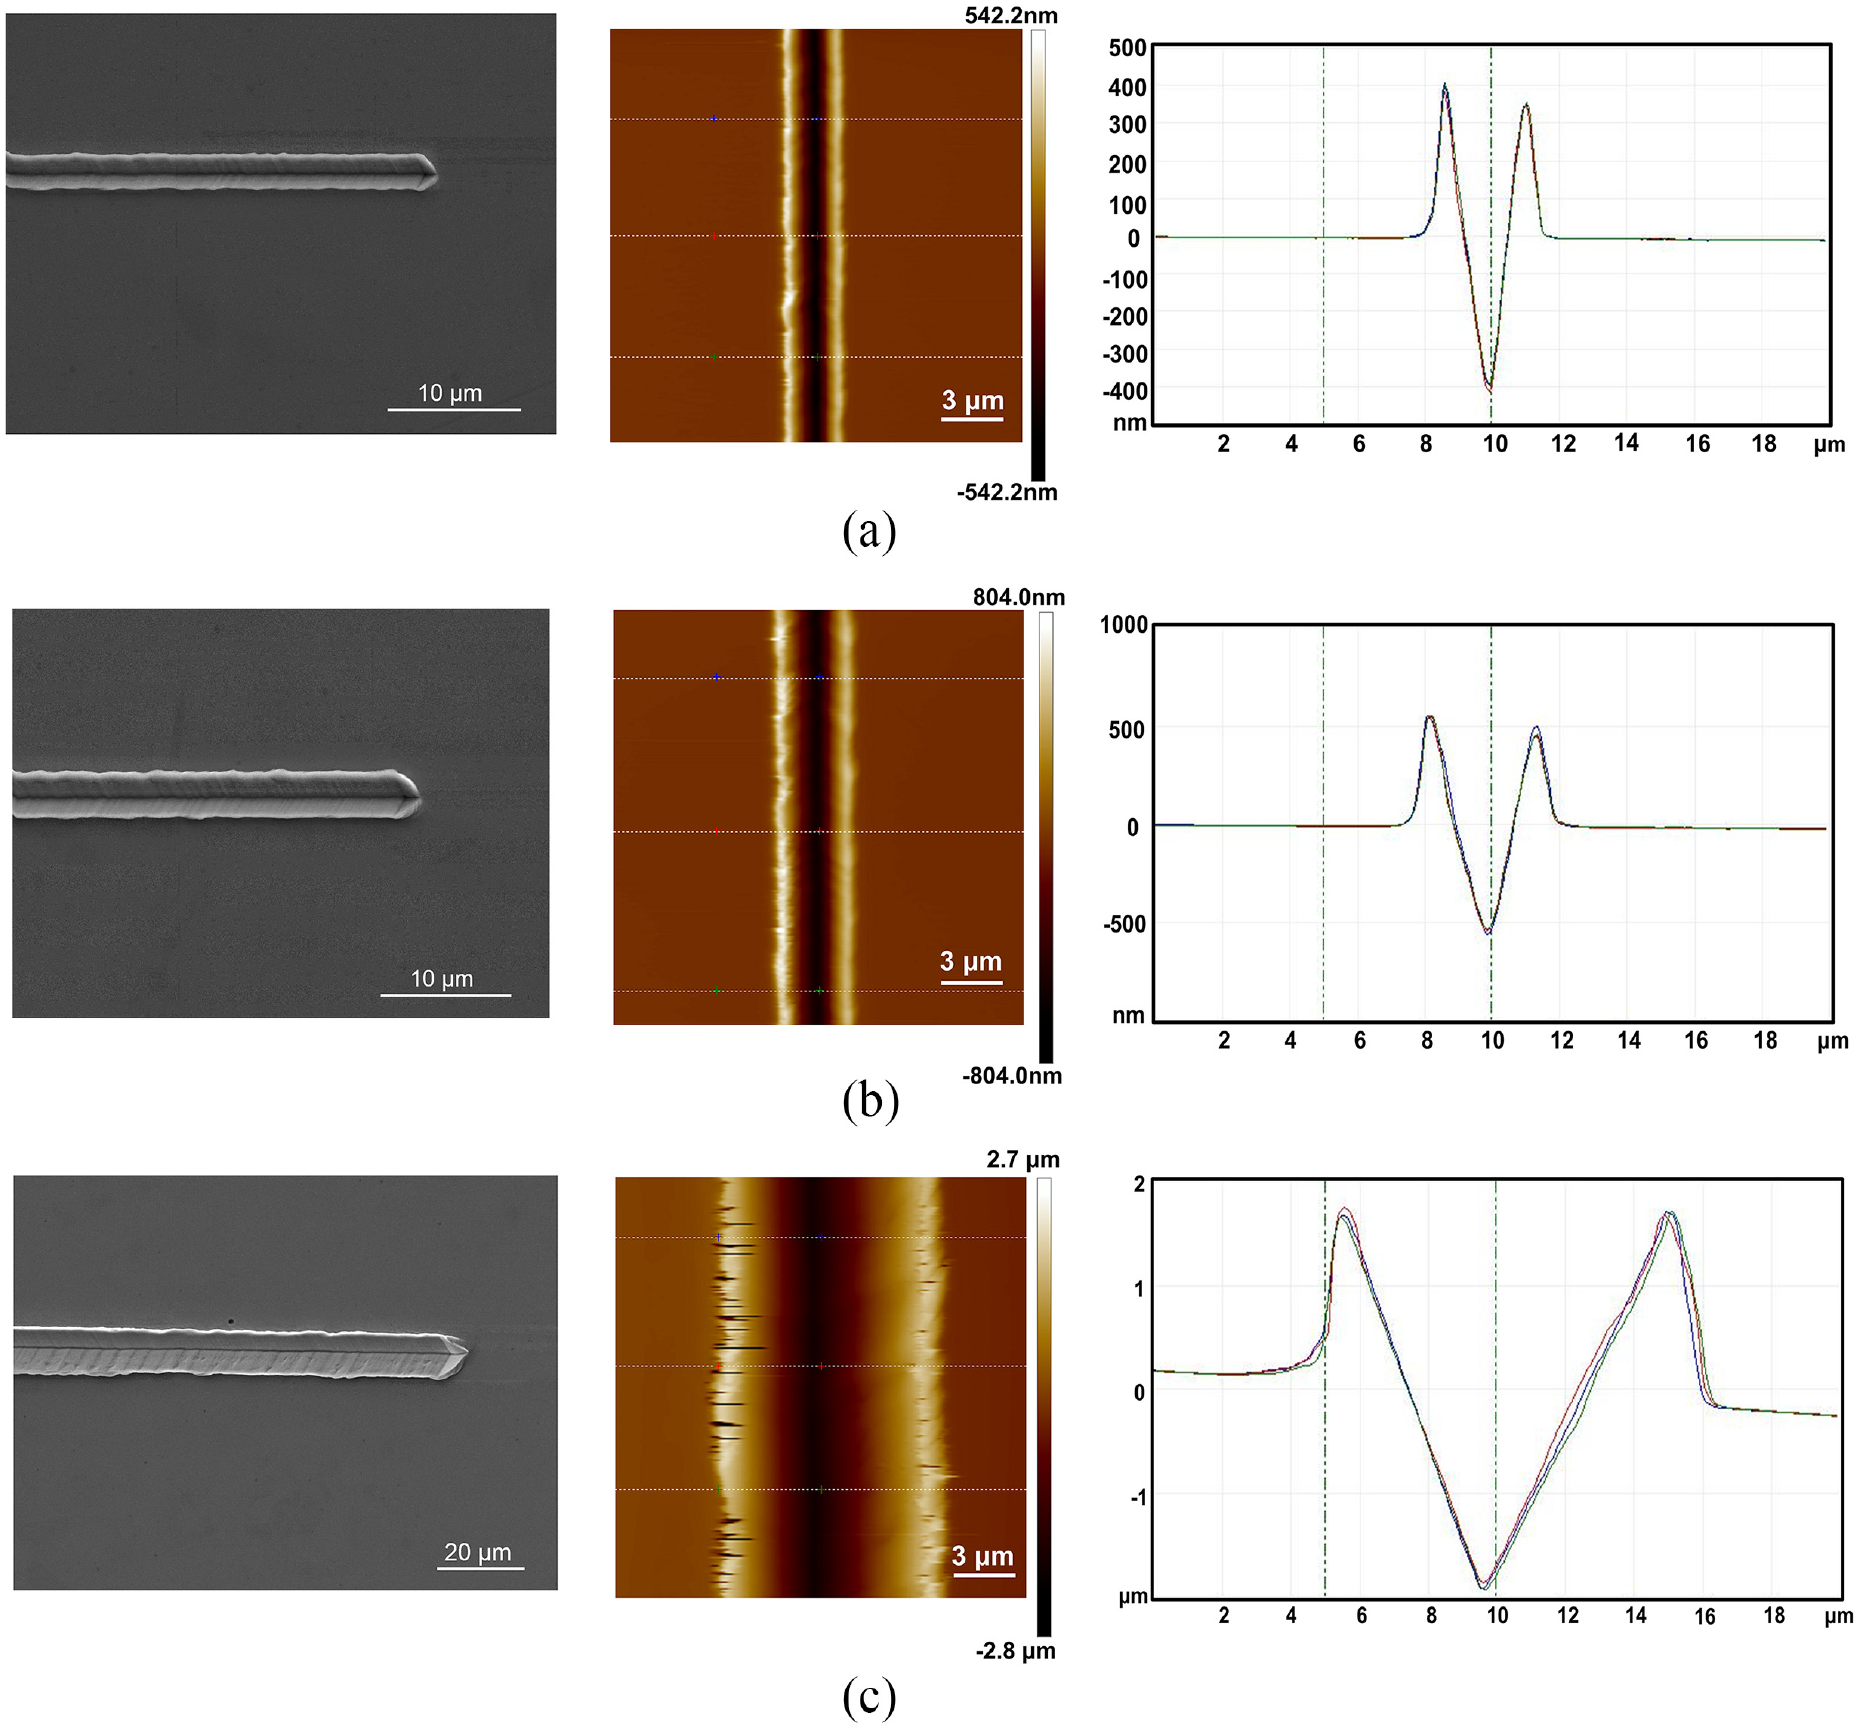
SEM and AFM images of machined microgrooves: (a) 0.6 mN, (b) 2 mN and (c) 14 mN.
To quantitatively verify the proposed theoretical model for a regular triangular pyramid, equation (5) was adopted to calculate the theoretical normal forces by using a known machined depth and the height of the pile-up. Figure 7 illustrates the relationship between the machined depths and the theoretical normal forces. For the sake of comparison, the setting normal forces (FN) are also plotted in Figure 8.
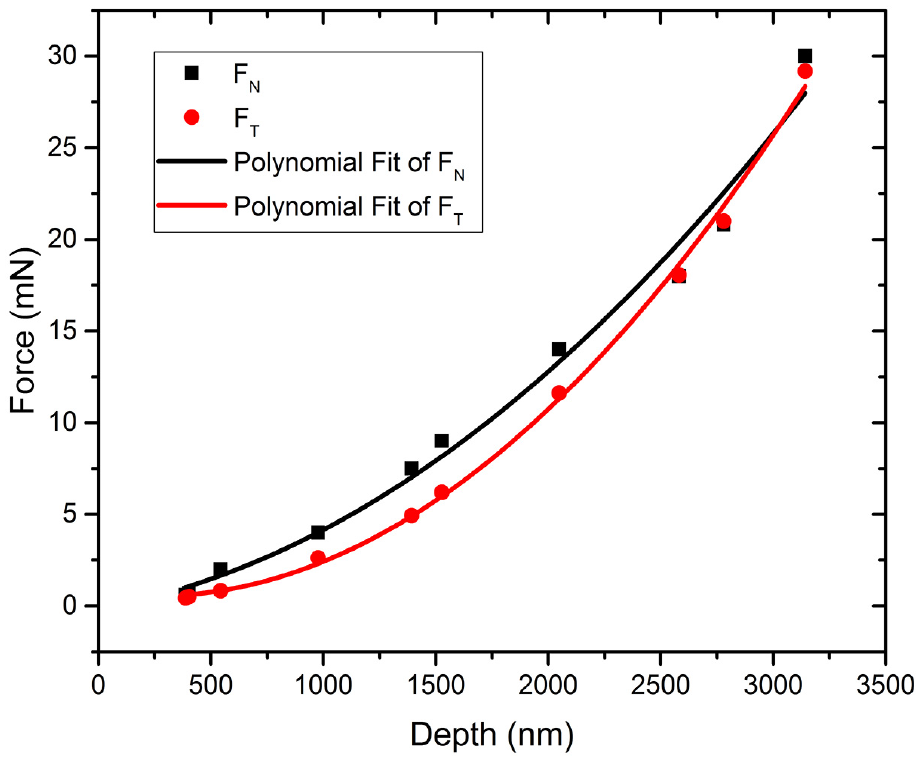
Relationship between the machined depths and the normal forces determined using the regular triangular pyramid.
A comparison of FN and FT revealed that, at the same machining depth, the setting force was always larger than the theoretical force when a relatively small normal force was applied. As the applied force increased, however, the theoretical force became extraordinarily close to the setting force. A possible reason for this was that σp had a considerable effect on the calculation results. Moreover, σp was not a constant, which meant that the value of σp varied with the load per cross-section.38,39 Thus, the larger the machined depth and the pile-up, the smaller the σp. It implied that it decreased with an increase in the tip–sample contact area. Consequently, the σp value used to calculate the small theoretical force, corresponding to the small machined depth and pile-up, was smaller than the actual value and directly resulted in a calculated theoretical force smaller than the setting force. From Figure 8, it can be obtained that the largest percentage difference between theoretical and experimental machined depths can be calculated as 21.9%, which occurs with the theoretical normal load of 2.62 mN. When the normal load increases to 11.62 mN, the percentage difference between theoretical and experimental machined depths decreases as 7.3%. In reference to the previous analysis, despite the fact that a gap existed between the setting forces and the theoretical forces (particularly when the small normal forces were applied), the present study demonstrated the feasibility of the proposed theoretical model by considering the pile-up to estimate the required applied normal forces in the edge-forward scratching direction. In other words, when the pile-up was large, its contribution to the cutting forces could not be neglected in the prediction of the theoretical normal forces.
Scratching with a single-point diamond tip
These experiments were extended to fabricate microgrooves by using a single-point diamond tip. The specifications of the used diamond tip were provided in the previous section. The cutting parameters were set to be the same as the parameters for the scratching with a regular triangular pyramid. However, the face-forward scratching direction was usually used when machining with a single-point diamond tip. The reference normal forces were set to increase from 0.1 to 1 mN in steps of 0.1 mN.
Figure 9 shows the SEM and AFM images of the machined microgrooves with respect to the setting normal forces of 0.3, 0.4, 0.5 and 0.7 mN. The section profiles of the AFM images showed that the constant depths were guaranteed as well. Asymmetry of the pile-up appeared due to the imperfectly symmetric of the cutting edges of the tip with respect to the scratching direction. However, the accumulation of material pile-up on one side of the machined grooves can be used to generate the periodic nanostructures by combining the topography of the fabricated grooves. The SEM images revealed that no cutting chips appeared when the setting normal force was smaller than 0.3 mN. This phenomenon was attributed to the fact that when the cutting depth, approximately 60 nm, was smaller than Δ′ as shown in Figure 5(b), only the spherical cap was involved in the cutting. Let us first calculate Δ′ using equation (21), which was approximately 123.5 nm, as follows
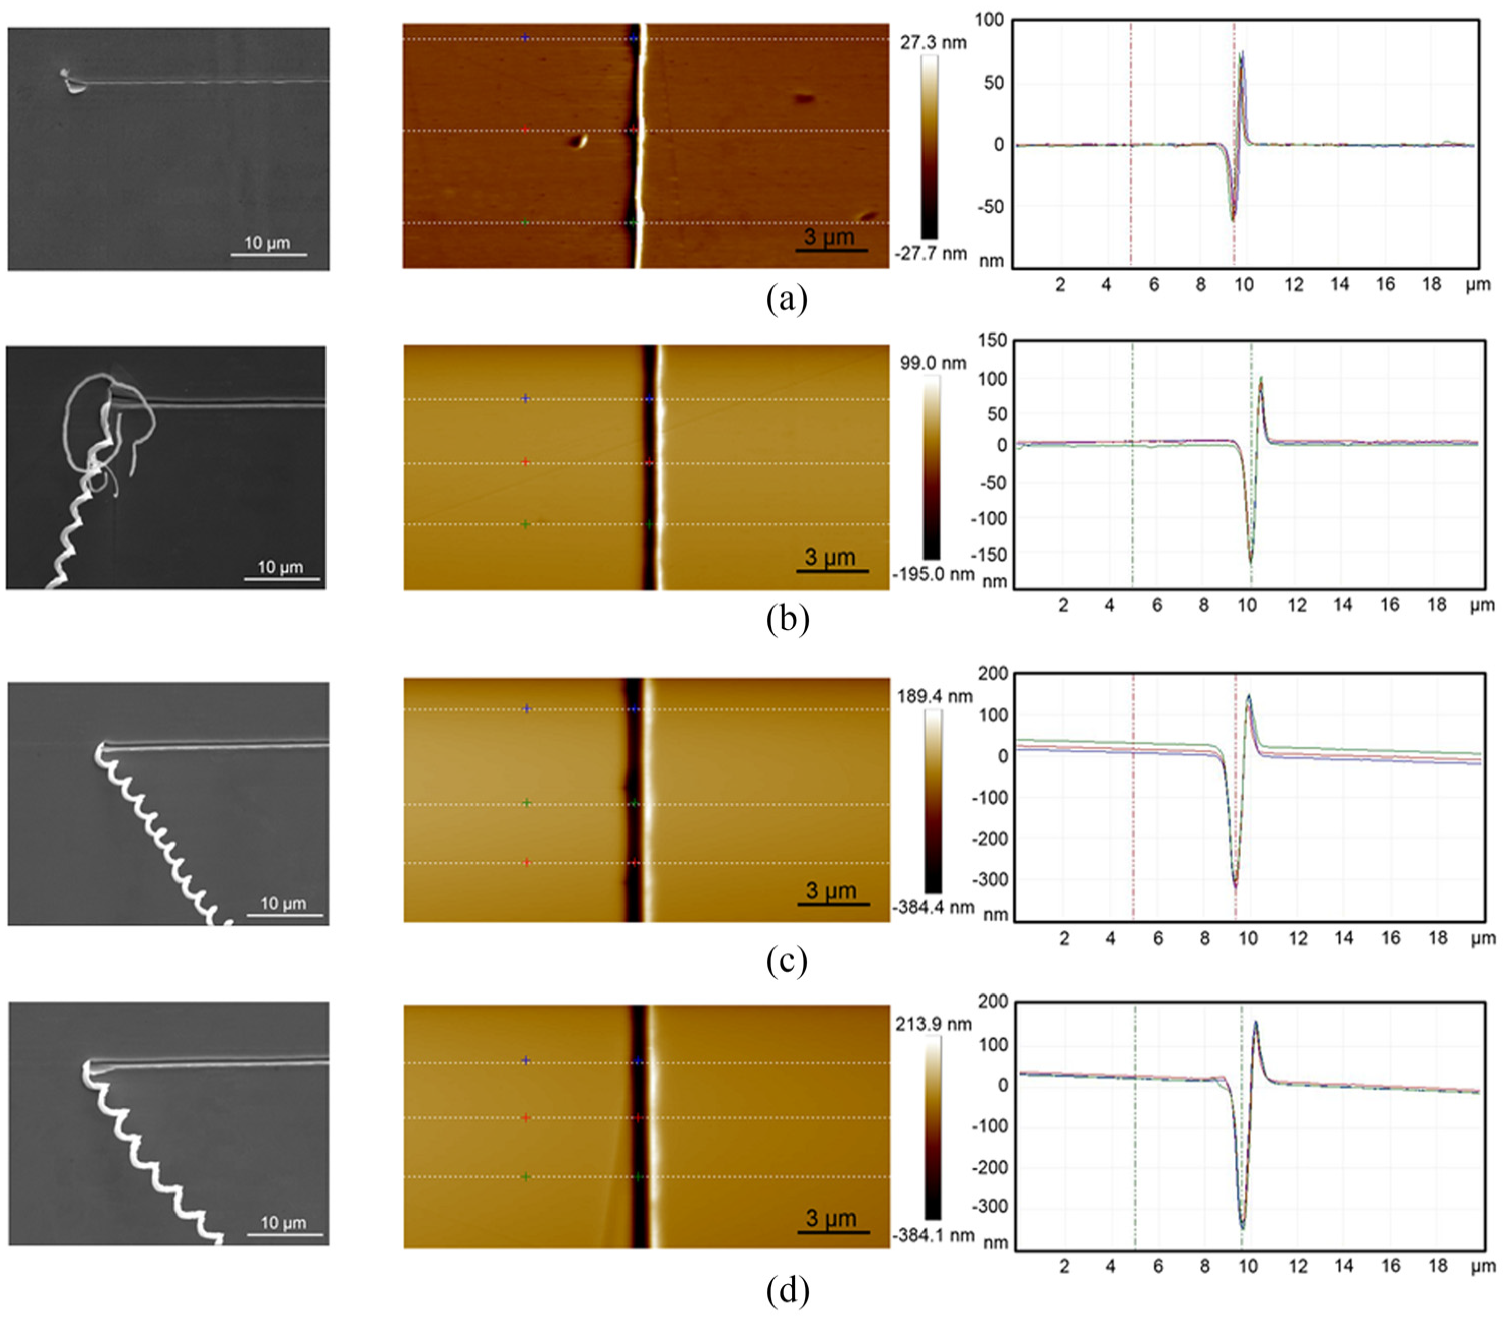
SEM and AFM images of machined microgrooves: (a) 0.3 mN, (b) 0.4 mN, (c) 0.5 mN and (d) 0.7 mN.
As the normal force increased to 0.4 mN, the continuous spiral crumbs were clearly observed along with some discontinuous ribbon chips. This was attributed to the fact that when the cutting depth was slightly larger than Δ′, both the spherical cap and the cutting edges of the diamond tip participated in the cutting process. Furthermore, as shown in the AFM images of Figure 9(a) and (b), when the normal forces increased from 0.3 to 0.4 mN, the depth of the machined microgrooves dramatically increased from 60 to 190 nm. The height of the pile-up decreased significantly due to the chip formation. 13 When the normal force continued to increase to more than 0.5 mN, the discontinuous ribbon chips disappeared and only the spiral crumbs were left, as shown in Figure 9(c) and (d). Therefore, provided the cutting depth was considerably larger than Δ′, the active cutting edges of the diamond tip played a major role in the entire cutting process.
In the same manner, to quantitatively evaluate the feasibility of the proposed theoretical model for the single-point diamond tip, the theoretical normal forces were predicted at the expected depths. Figure 10 shows the results and includes drawings of the setting normal forces for comparison.
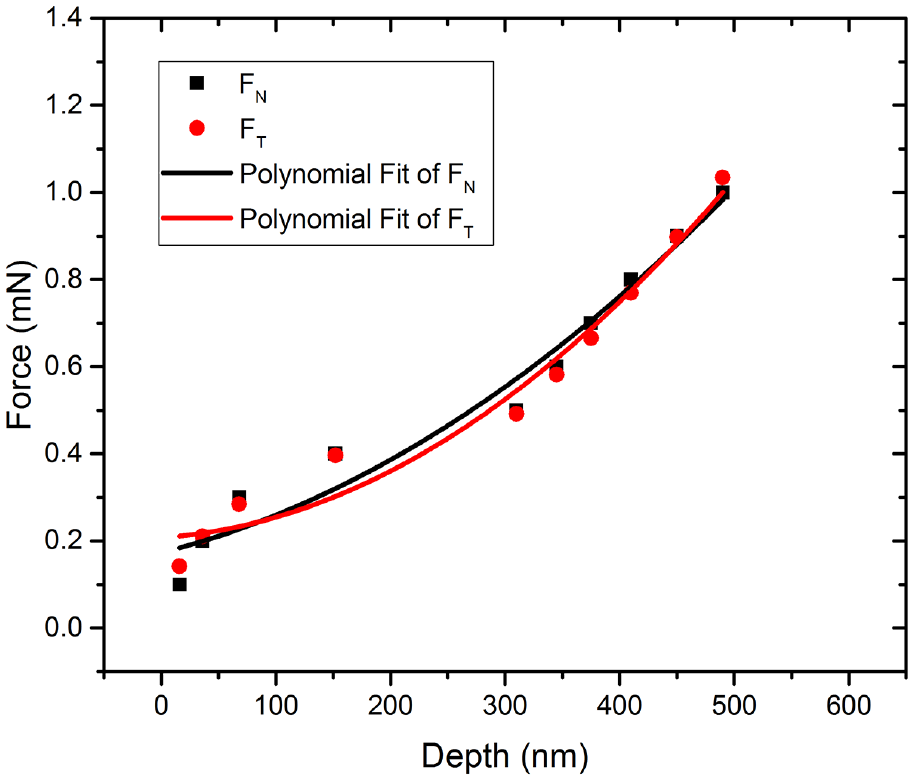
Relationship between the machined depths and the normal forces determined using the single-point diamond tip.
Comparing the first three sets of data, which represented the setting normal forces of 0.1, 0.2 and 0.3 mN, respectively, the setting normal forces were considerably similar with the theoretical normal forces. In such cases, the depths of the machined microgrooves were smaller than the height of the spherical cap of the tip, as mentioned 123.5 nm earlier. The active cutting edges had not been used yet during the scratching process. Thus, the prediction of normal forces depended on equation (9) for the spherical crown cutting. In other words, when the cutting depth is smaller than the height of spherical crown, this model for predicting the normal forces also worked efficiently. In a further investigation of the prediction model, by comparing the setting normal forces larger than 0.4 mN, the normal forces predicted by the model were still almost consistent with the setting normal forces. This is because the active cutting edges contributed the most to the chip formation process. Moreover, note that when the setting normal force was 0.1 mN, there existed the difference between the predicted normal forces and the setting normal forces. This might be attributed to the absence of the cutting edges of spherical crown when the machining depth was too small. In addition, the theoretical forces were calculated by the mathematic model, which only took the geometry of tool and machined depth into consideration. However, the effect of the cutting chips produced in the machining process on the normal forces was not considered. When the generated cutting chips were not easily expelled from the machined grooves, it was necessary to exert a little larger force for machining grooves of the same depth. This would result in the setting forces slightly larger than the predictive ones. In addition, the change of σp with different machined depths was also a possible reason. While the normal loads selected for single-point diamond probe were relatively small, the influence of the change of σp was less than that for the case of regular triangular pyramid probe. From Figure 10, it can be obtained that the largest percentage difference between theoretical and experimental machined depths can be calculated as 4.8% with the theoretical normal load of 0.665 mN, which is much less than that obtained with the regular triangular pyramid probe. It indicates that the proposed theoretical model can be used to predict the relationship between the normal load and the machined depth feasibly.
Conclusion
In this study, two types of cutting tools were used to scratch on single-crystal copper employing constant force cutting approach, namely, a regular triangular pyramid and a single-point diamond tip, respectively. Furthermore, two theoretical models for predicting the required applied normal forces were proposed corresponding to different material removal states produced by different cutting tools. For the model of the regular triangular pyramid, the height of pile-up was almost the same as the machined depth or more. When relatively large normal forces were applied, the predictive theoretical forces were close to the setting normal forces. When the relatively small normal forces were applied, however, a gap was observed between the theoretical normal forces and the setting normal forces caused by the inaccurately chosen σp. For the model of the single-point diamond tip, the multi-edge orthogonal cutting was investigated in the chip formation process. The proposed theoretical models estimated the required normal forces very well, with only an average absolute deviation of 5%.
Supplemental Material
Supplementary_material_4 – Supplemental material for Effect of material removal state on the selection of theoretical models when scratching single-crystal copper using the load modulation approach
Supplemental material, Supplementary_material_4 for Effect of material removal state on the selection of theoretical models when scratching single-crystal copper using the load modulation approach by Yongda Yan, Yuzhang Wang, Jiqiang Wang and Yanquan Geng in Proceedings of the Institution of Mechanical Engineers, Part B: Journal of Engineering Manufacture
Footnotes
Appendix 1
Declaration of conflicting interests
The author(s) declared no potential conflicts of interest with respect to the research, authorship and/or publication of this article.
Funding
The author(s) disclosed receipt of the following financial support for the research, authorship and/or publication of this article: This work was supported by the Foundation for the National Natural Science Foundation of China (51675134, 51705104) and the China Postdoctoral Science Foundation (No. 2017M610206 and 2018T110289).
Supplemental material
Supplemental material for this article is available online.
References
Supplementary Material
Please find the following supplemental material available below.
For Open Access articles published under a Creative Commons License, all supplemental material carries the same license as the article it is associated with.
For non-Open Access articles published, all supplemental material carries a non-exclusive license, and permission requests for re-use of supplemental material or any part of supplemental material shall be sent directly to the copyright owner as specified in the copyright notice associated with the article.