
Abstract
Chatter is prone to occur in thin-wall part milling process due to the low stiffness and damping of the workpiece. It roughens the machining surface, shortens the tool life, and thus should be detected and prevented. However, the multimode and time-varying dynamics of thin-wall parts produces nonstationary and multicomponent cutting signals, which makes it challenging to accurately identify the chatter occurrence. In this article, an effective chatter identification method based on adaptive variational mode decomposition and decision tree is presented to tackle this problem. The adaptive variational mode decomposition is used to adaptively decompose the raw acoustic signal into several subsignals, and the decision tree is used to automatically determine the chatter threshold. First, the convergence of multicenter-frequency signal processing is analyzed and is proved to be closely related to the accuracy of variational mode decomposition. Afterward, a criterion is set up to initialize the center frequencies of variational mode decomposition, on the basis of which an adaptive energy ratio-based method with good computational efficiency is presented to extract the frequencies of the main components from the raw signal. The initial center frequencies and the number of modes of variational mode decomposition are simultaneously obtained. As a result, the raw signal is adaptively decomposed into several subsignals, which contain its principal components. Then, the normalized energy and sample entropy of the subsignals are selected to establish the decision tree model for automatic chatter identification. Several milling tests on a thin-wall plate are carried out to verify the proposed method. The results show that chatter can be identified accurately and efficiently using the proposed method.
Keywords
Introduction
Milling chatter is an ever-existing problem accompanying the machining of thin-wall parts, which dramatically reduces the machining accuracy and productivity.1,2 In thin-wall milling process, the time-varying dynamics of the workpiece makes it difficult to build the cutting system model accurately, such that the cutting parameters may be unsuitable by using the analytic methods.3–7 Paralleled by the development of sensor technology, the signal produced in the milling process is widely used to identify chatter. Hence, a sensor-based method is essential to identify and suppress chatter, which can enhance the surface finish and guarantee the stable cutting process.
The sensor-based chatter identification method involves signal collecting and processing, feature extraction, and states recognition. For signal collecting and processing, the acoustic signal with large bandwidth and low delay is widely adopted compared to other signals. 8 However, the noise may be unavoidably collected into the signal by a microphone. Therefore, it is necessary to develop an effective signal processing method for denoising and enhancing the robustness of the identification system. To date, extensive efforts have been made to improve the accuracy and efficiency of signal processing, and the corresponding methods include time domain,9,10 frequency domain,11–14 and time-frequency domain analyses.15–19 In time domain analysis, Lamraoui et al. 9 applied the neural network and the entropy-based feature extraction method to detect chatter, but cannot easily extract the useful features from the real noisy signal. By the Fast Fourier Transform (FFT), the signal can be transformed into the frequency domain so that the features unidentified in time domain may appear clearly. And the noise also can be removed from the signal by denoising methods. Li et al. 11 investigated the properties of the chatter occurrence in the micromilling process, and reported that the amplitudes and the dominant frequencies of the signal shift when chatter occurs. Polli et al. 12 utilized different sensors simultaneously to analyze the chatter property and found that the chatter frequency dominates the distribution of the signal spectrum. Nevertheless, the results in the frequency domain by FFT may be incorrect due to the signal properties of nonlinearity and nonstationarity. To overcome this deficiency, several advanced signal processing methods in the time-frequency domain are proposed. Wavelet transform with the characteristic of adaptive time-frequency resolution shows good performance in revealing the local states in the cutting process. Cao et al. 15 applied wavelet packets and Hilbert–Huang transform to process the acceleration signal for chatter identification. Based on wavelet transform, Yoon and Chin 16 proposed a general chatter detection method, which can be used in other cutting processes. Moreover, chaotic theory can probably be used in predicting chatter. Koohestani et al. 20 presented an effective chatter detection method by using the linear regression model and adopted it for monitoring the cutting states and detecting chatter occurrence online.
As an adaptive time-frequency domain method, empirical mode decomposition (EMD) is proposed to decompose the signal into intrinsic mode functions (IMFs). 21 Using EMD and Hilbert-Huang transform (HHT), Fu et al. 19 proposed an online chatter detection method to distinguish the energy aggregation. In the study of Cao et al., 22 EEMD was used in the milling process and nonlinear dimensionless indicators were adopted to identify the onset of chatter vibration. However, the application of the EMD method is restricted by the shortage of mathematical theory and mode mixing. To enhance the robustness to sampling and noise, variational mode decomposition (VMD) is therefore developed 23 and outperforms EMD in terms of band-limit and mode mixing. Wang et al. 24 investigated the equivalent filter bank properties of VMD and reported its effectiveness in signal decomposition. The initial conditions were also found to significantly influence the accuracy of VMD. However, the majority of existing research studies25,26 focus on optimizing the penalty parameter and the mode number without fully considering the role of the initial center frequencies (ICFs). Jiang et al. 27 analyzed the ICFs using simulated signals and found a U-shaped convergent phenomenon of center frequencies and reported that the convergent speed of VMD depends on the distribution of ICFs. Apart from the convergence speed, the range of center frequencies that limits the convergence is also important and discussed first in this article. A limiting bandwidth of the convergence is presented to optimize the ICFs, which improves the accuracy and efficiency of VMD significantly.
In this article, an effective chatter identification method is proposed in the milling of thin-walled parts. The acoustic signal is decomposed into submodes by the adaptive VMD (AVMD) method. Then, the normalized energy and the sample entropy, as sensitive indicators, are calculated and input to the model of chatter identification. In the conventional threshold-based chatter identification method, the value of the threshold is set by empirical judgment rather than the specific algorithm. Here, decision tree is utilized to compute the value of the threshold by using the CART algorithm. 28 The threshold is objective without personal judgment. Henceforth, this article is organized as follows: in section “Methodology of chatter identification for thin-wall part,” an AVMD method to preprocess a raw signal is described in detail. The normalized energy and sample entropy are then computed to build the decision tree. In section “Experimental setup,” the experiment setup is introduced. In section “Results and discussion,” the results and discussion are shown to verify the proposed method. The conclusion is drawn in section “Conclusion.”
Methodology of chatter identification for thin-wall part
Adaptive variational mode decomposition method
To enhance rapidity and accuracy in chatter identification, an AVMD method is proposed to preprocess the acoustic signal. It contains two aspects. First, the convergence of VMD is analyzed and a certain convergent scope of the mode bandwidth is revealed for multicenter frequency signal processing. Second, an adaptive energy ratio-based method for acquiring the frequencies of principle modes is developed to optimize the ICFs.
Brief introduction of VMD
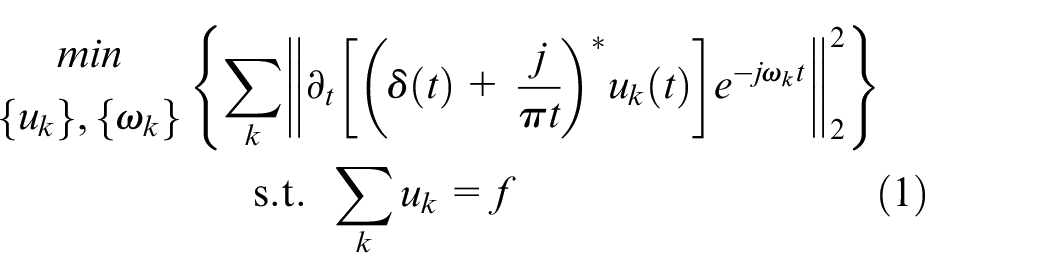
As an adaptive and effective method for nonlinear and nonstationary signal processing, VMD aims to decompose a signal into narrowband modes. The bandwidth of each mode is estimated by the constrained variational problem as follows 23
where
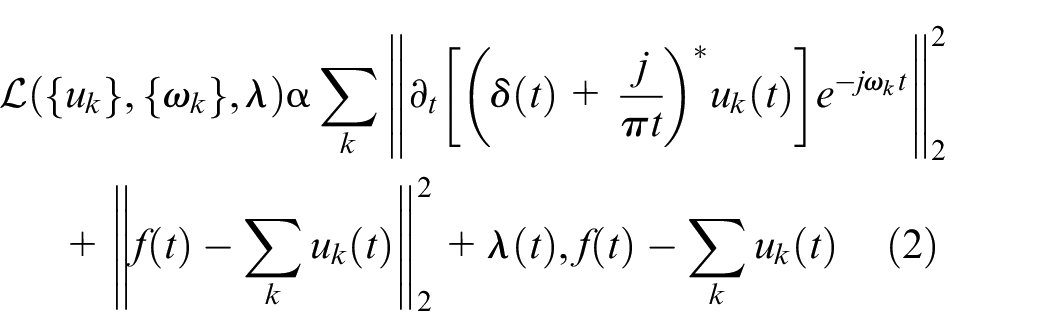
The expanded Lagrangian
By means of an alternate direction method of multipliers, the above quadratic optimization problem is solved
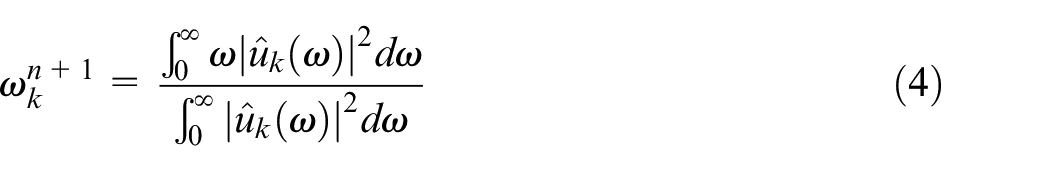
Then, the center frequency
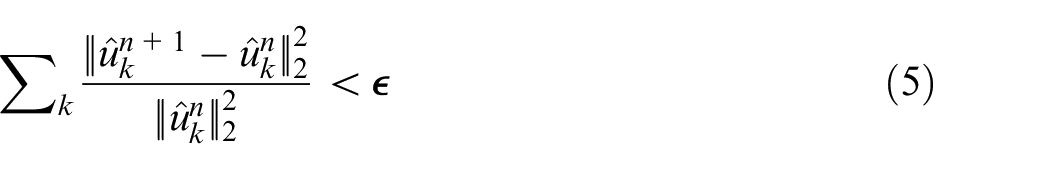
And the terminal condition of the iterative algorithm is shown as
Center frequency convergence of VMD
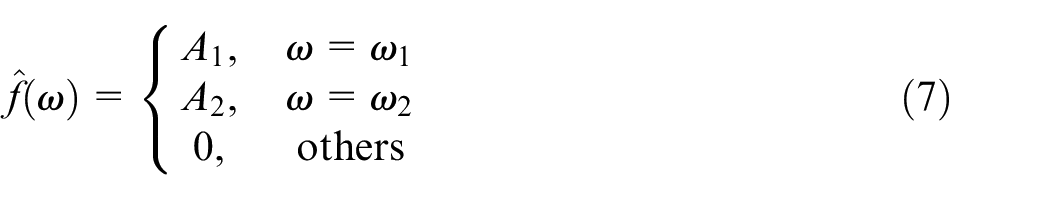
For multiband signals, the convergence of VMD is analyzed first and then a certain convergent scope of the mode bandwidth is found. As a result, a criterion is introduced to set up the ICFs. A raw signal with two modes is given to analyze the center frequency convergence of VMD

where
Initial conditions of VMD.
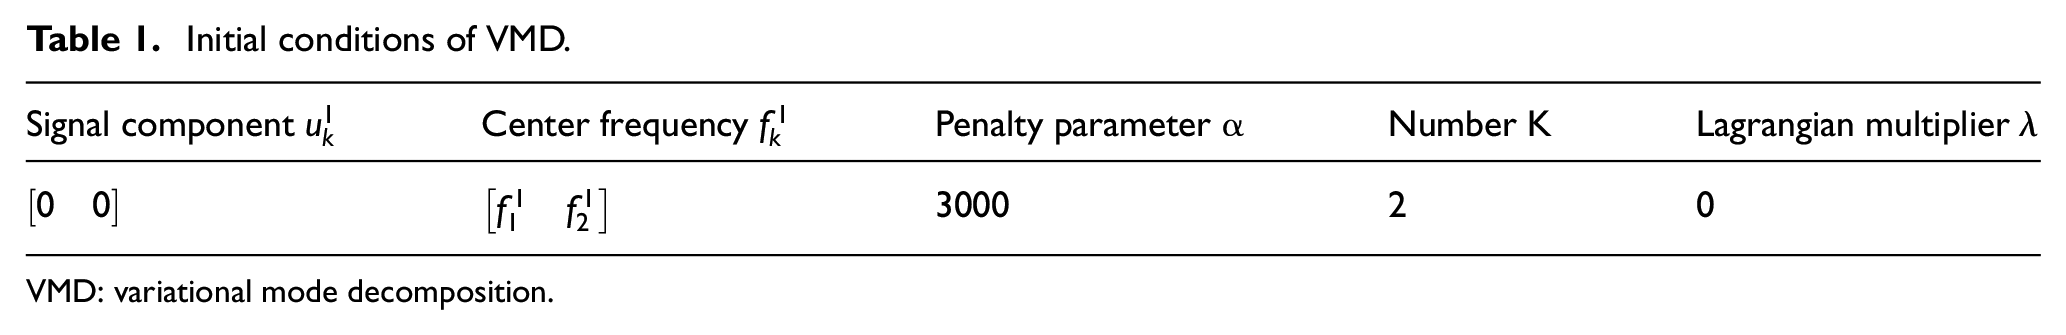
VMD: variational mode decomposition.
In the following parts, the derivation process of the convergent range is expressed in detail. In order to match the domain of center frequency estimation in VMD, the time series
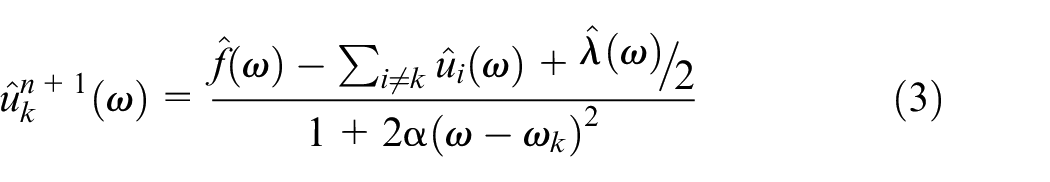
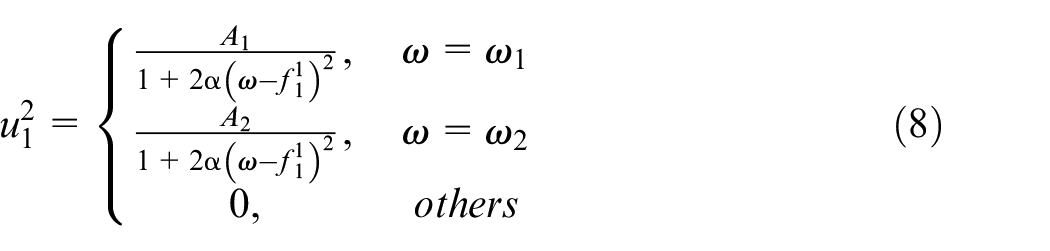
According to equations (3) and (4), the mode
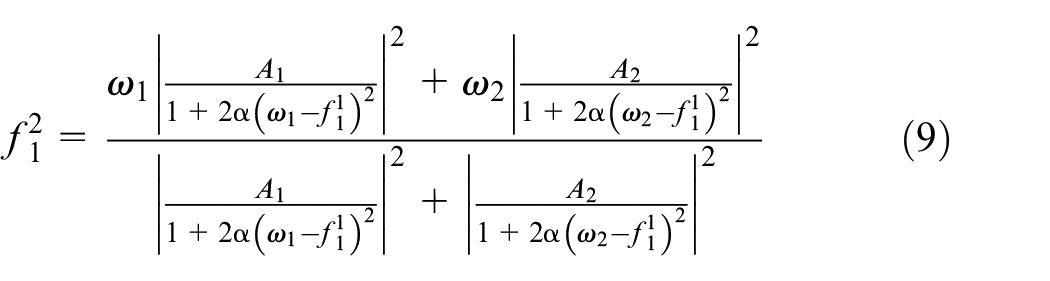
According to equation (3), the new mode
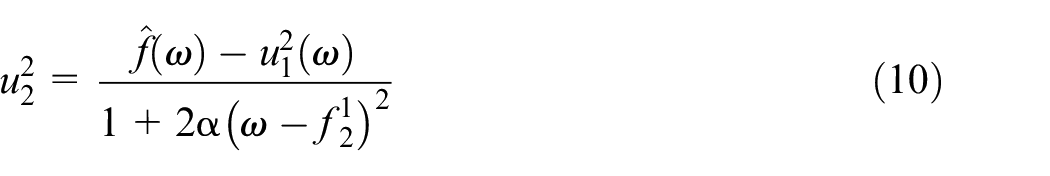
And the numerator of equation (10) is shown as
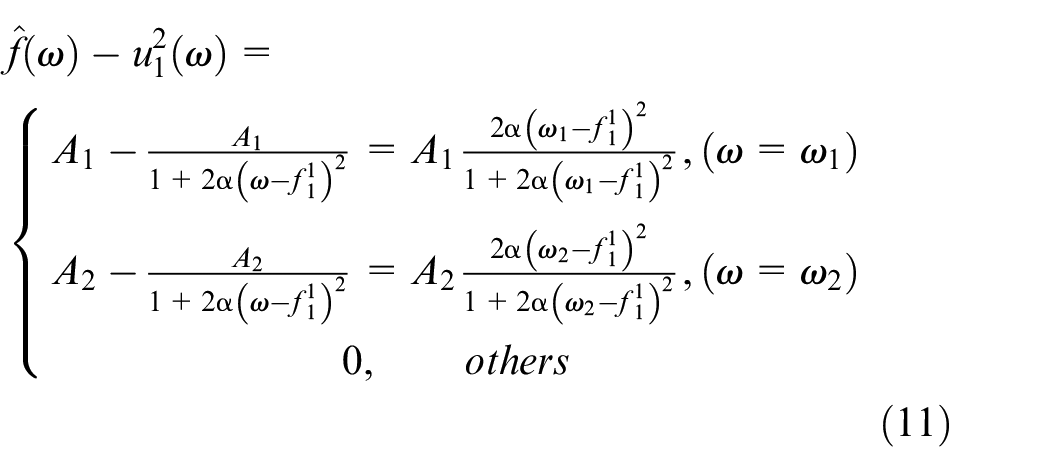
Under the premise of the proper penalty parameter
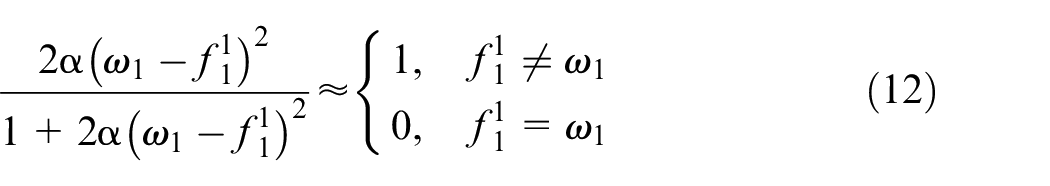
With this approximation, the mode
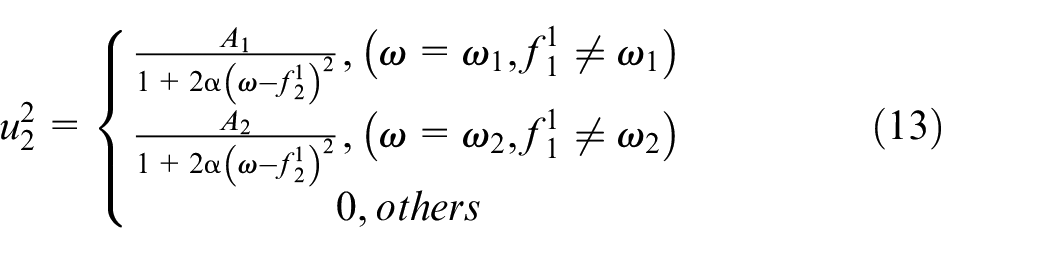
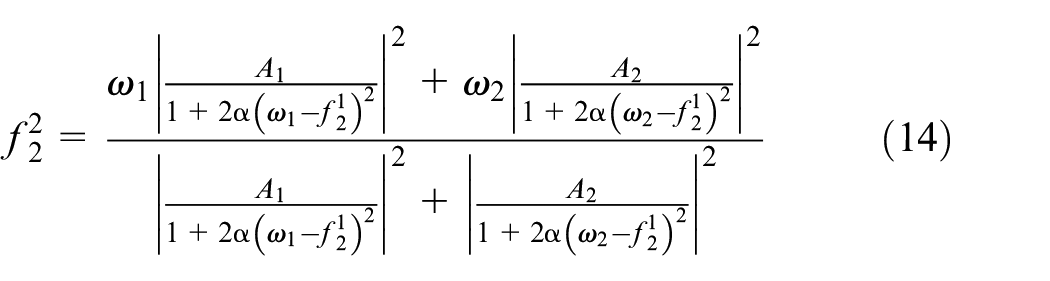
In accordance with the above formulas, the latest mode
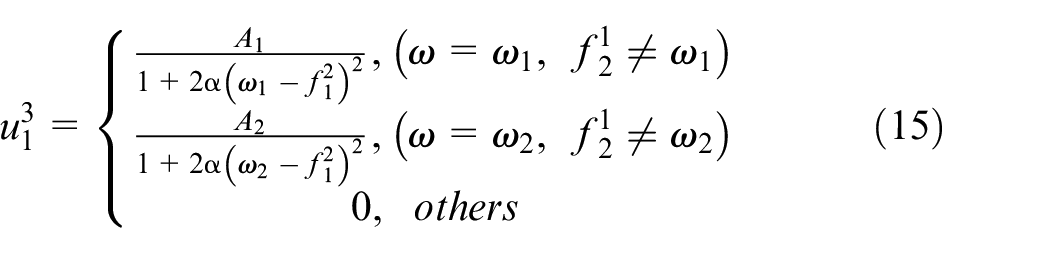
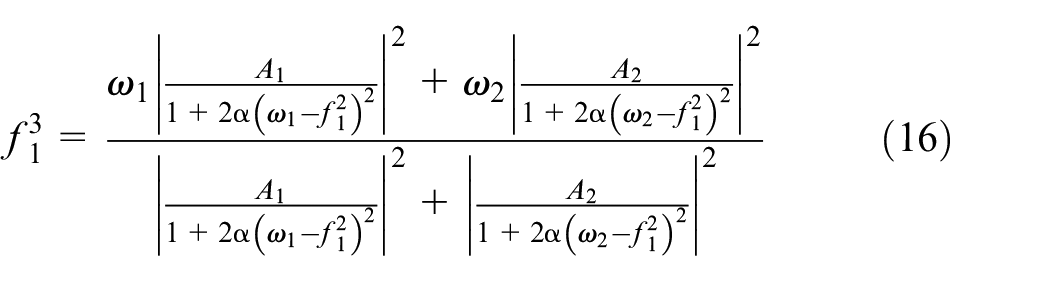
The center frequency is gradually close to the first intrinsic frequency of the initial signal under the reasonable approximation in equation (12), and thus the mode
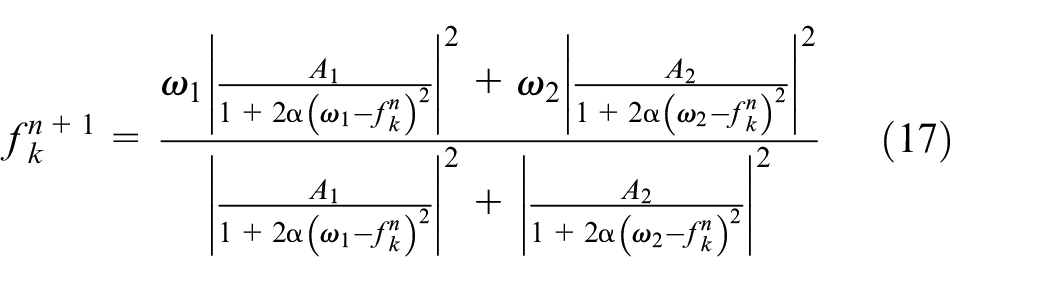
Based on the above analysis of a signal with two modes, it is easy to expand the above derivation to the multicomponent signal. Thus, the general formula of m components is shown as follows
where
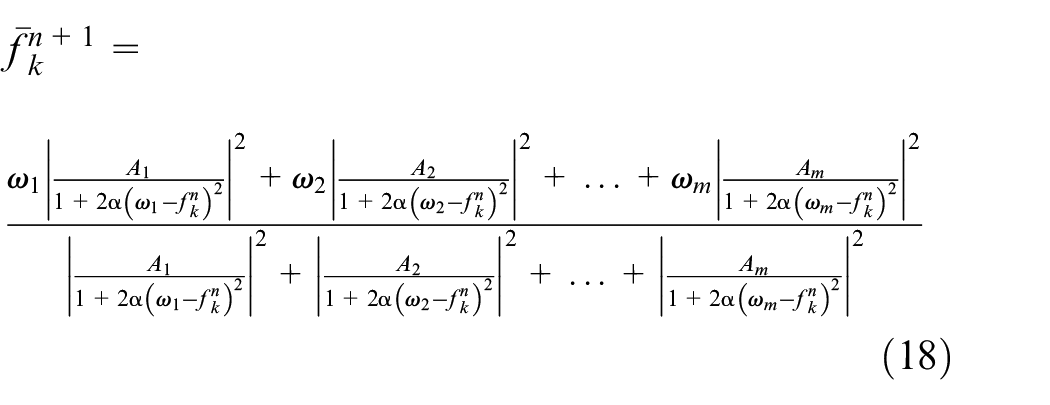
According to equations (17) and (18), the convergent center frequencies are related to the amplitude of each intrinsic mode and ICFs obviously. To verify this result, we give the initial center frequencies in the range of 0–128 Hz, and then calculate the center frequencies according to equation (17). At the end of iteration, the center frequency may converge to the natural frequency of each mode. Figure 1 shows that the center frequency is gradually approximating to the natural frequency of the mode in a limiting bandwidth. And the amplitude of each mode influences the final center frequency, which corresponds to the gravity of power spectral density. The influence makes the curves in Figure 1(a) and (b) appear slightly different.
The limit band of center frequency convergence of two-mode signal: (a) f = 64 Hz, A = 2, and f = 128 Hz, A = 4. (b) f = 64 Hz, A = 4, and f = 128 Hz, A = 2.
It is observed that the critical frequency
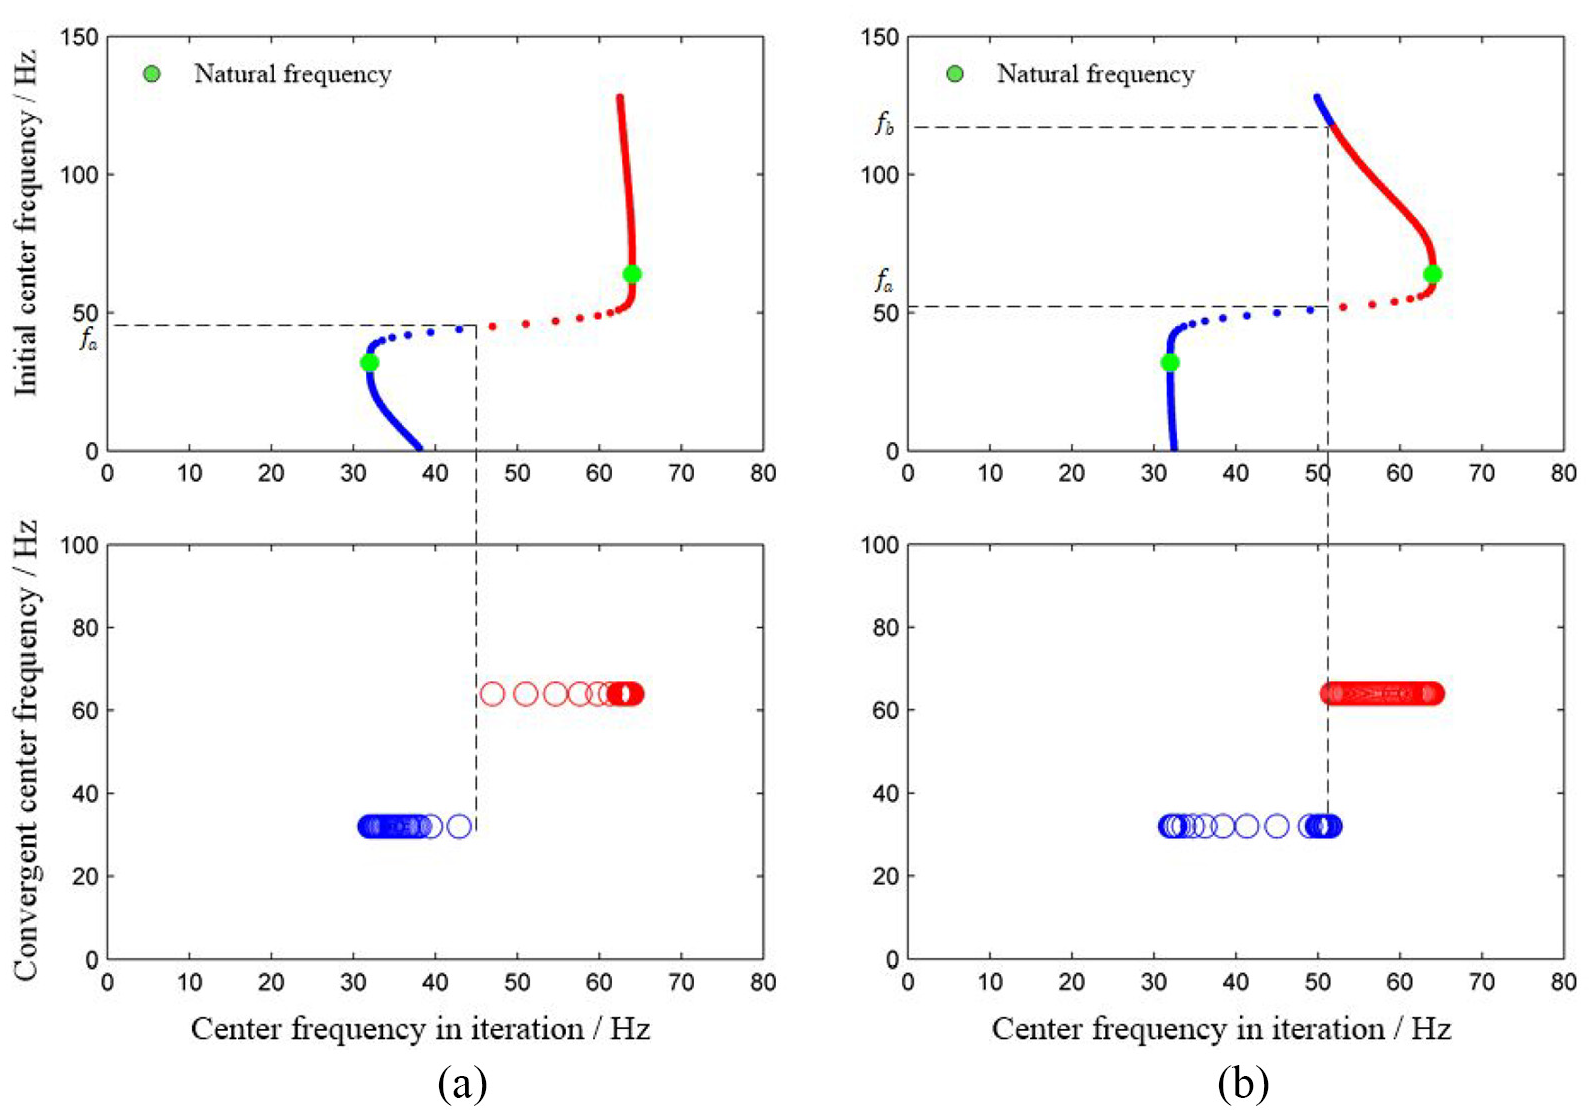
The limit band of center frequency convergence of a three-mode signal: (a) f = 16 Hz, A = 1, f = 32 Hz, A = 2, and f = 64 Hz, A = 4 and (b) f = 16 Hz, A = 1, f = 32 Hz, A = 4, and f = 64 Hz, A = 2.
Nevertheless, considering the spectral leakage of FFT, the gravity of the power density spectrum will shift a little. It causes a little error in the range of setting ICFs. In order to ensure the convergence, the limit band of ICFs is constrained within a little wide range properly

where
Frequency acquisition of signal main components
As for the VMD method, ICFs influence the result seriously although the other parameters are fine-tuning. In this section, an adaptive energy ratio-based sifting method is presented to find out the frequencies of the signal main components. As a consequence, the ICFs and the number of modes are simultaneously obtained.
First, an acoustic signal
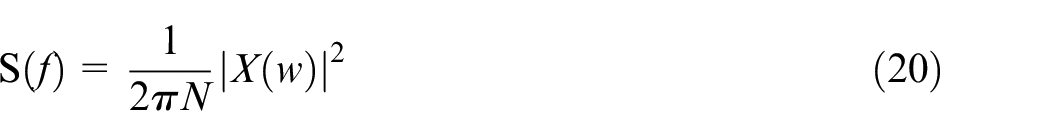
where N represents the length of signal and
In order to obtain the frequencies of the main components, two sifting procedures are applied. According to the curve of PSD in spectral domain, a series of local maximum is computed with the interval
The series of PSD is divided into frames as


Toward the curve of local maximum series, the values beyond the average are sifted out and its corresponding series are defined as


Due to the reduction of data points, the curve appears as several straight parts that become obstacles to search for peak values. To overcome this case, a cubic spline is used to fit the obtained series
In the second sifting procedure, the frequencies of the main components are obtained by using the energy ratio-based iterative sifting algorithm. The energy ratio (i.e. as the threshold) is set as 0.8, and the initial sifting value is set as the midvalue
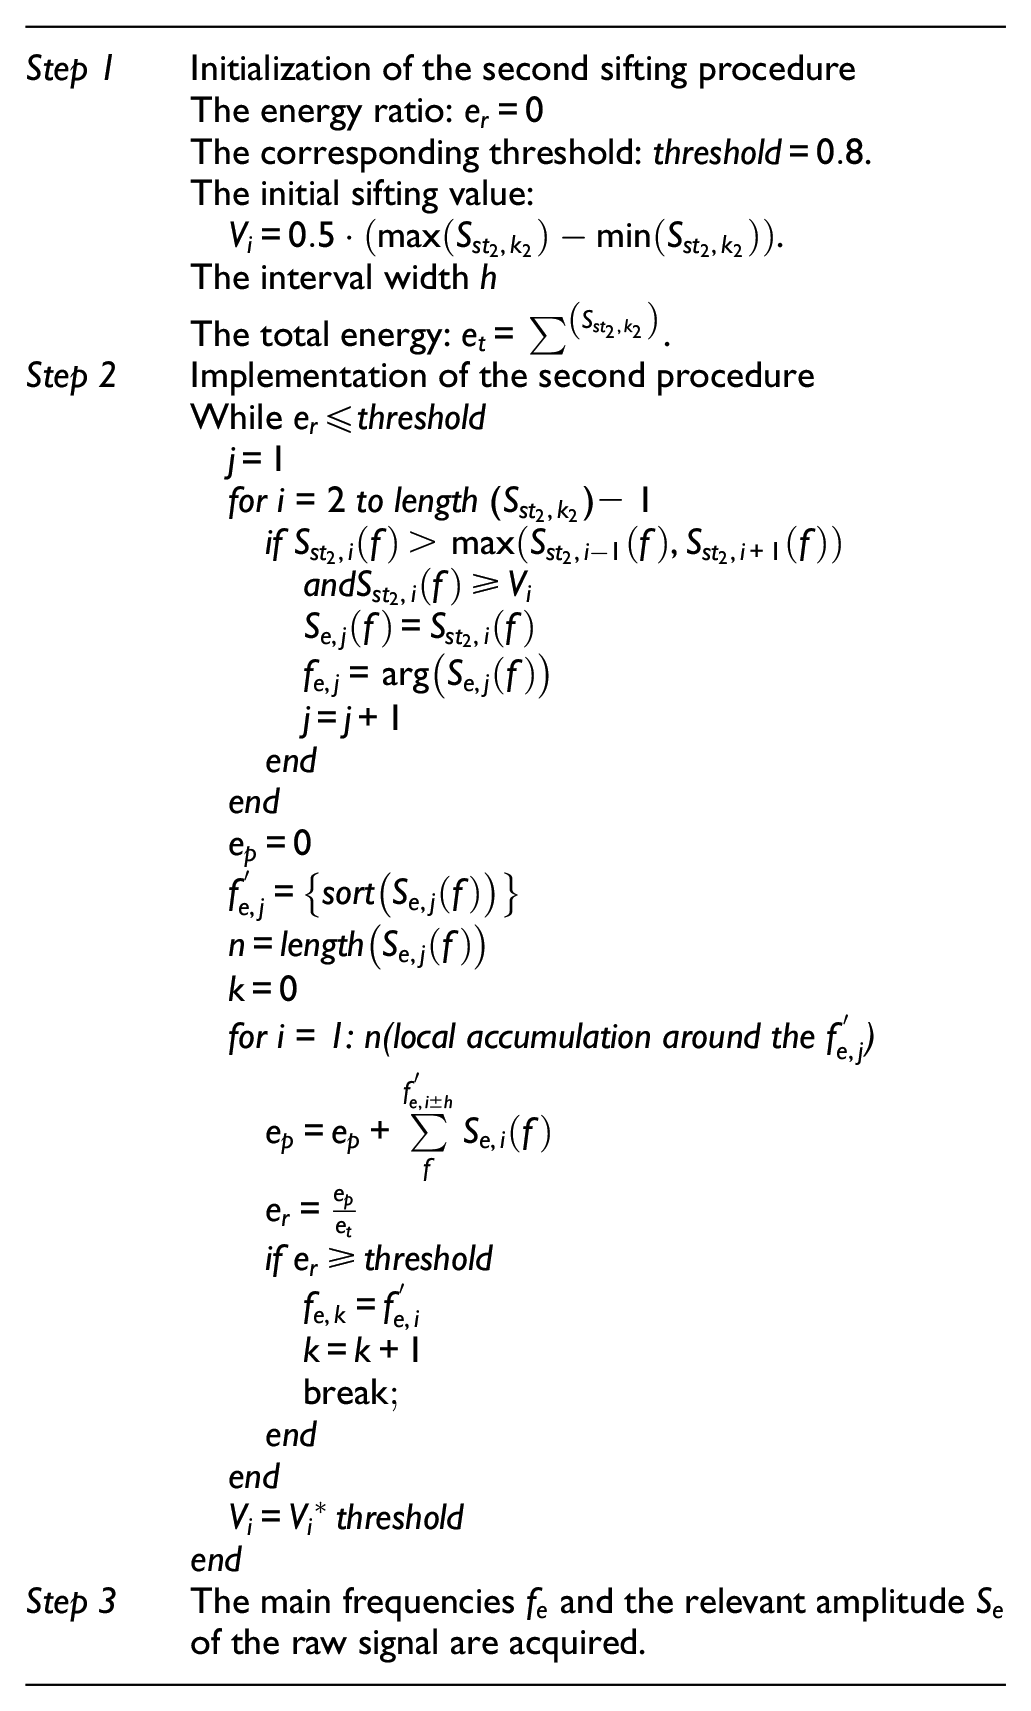
The frequencies of the signal main components can be obtained after the above sifting procedures with the appropriate threshold and interval width. It is automatic and time-saving that has great potential for online chatter detection. Through the preprocessor for VMD, the initial conditions that consist of ICFs and the number of modes are calculated. Hence, an adaptive center frequencies initialization-based VMD (AVMD) method is conducted. The subsignals with intrinsic narrowband and maximal energy are obtained through the AVMD method.
Decision tree construction with sensitive indicators
The energy is widely used in chatter identification, because it has an apparent change when chatter occurs. As a nondimensional value, the sample entropy is sensitive to signal complexity in time series and is widely adopted in the fault diagnosis of rotating machine recently. 25 Based on the two indicators, the overall trend and local complexity are revealed concurrently.
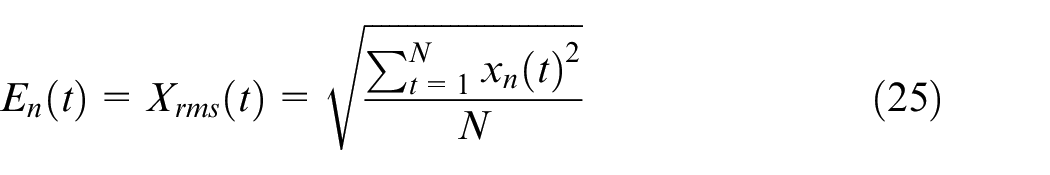
Through the AVMD method, several subsignals are successfully limited into narrowbands. The energy of the nth subsignal
While the energy signal contains much noise, an exponentially weighted moving average method is adopted to filter out the noise and enhance the changing tendency. This kind of filter is sensitive to the latest input data that can guarantee the real-time property. The filtered energy signal is expressed as
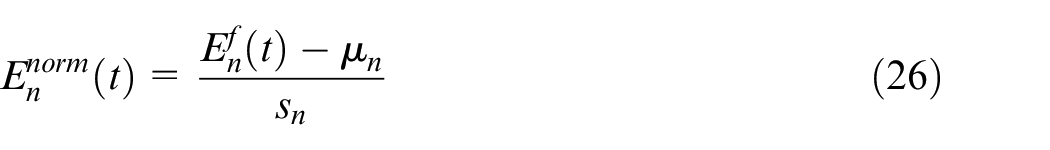
where
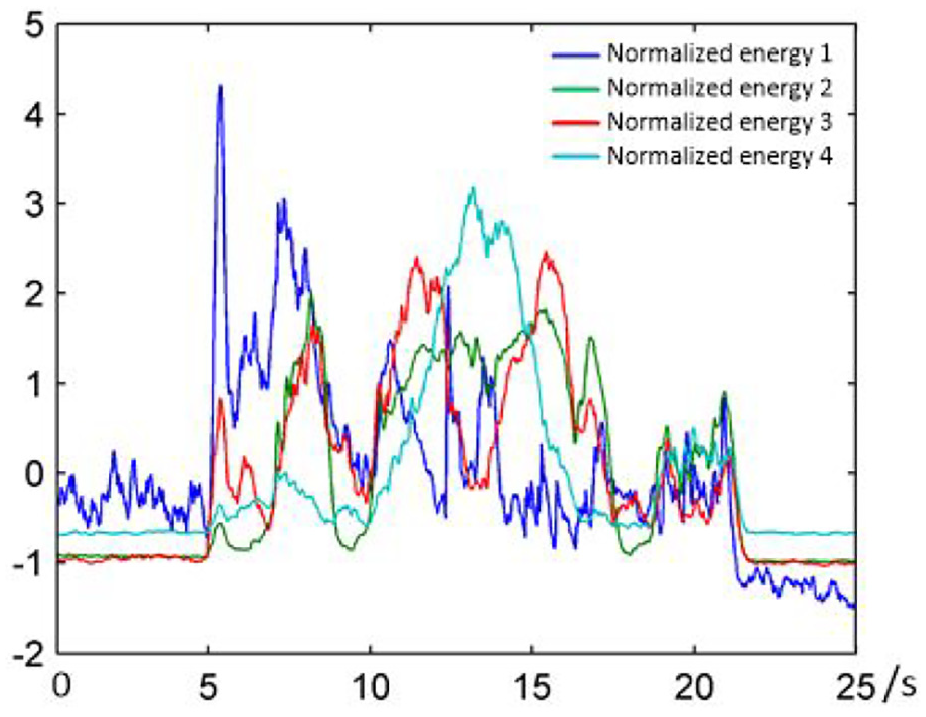
Normalized energy of subsignals.
The sample entropy is regarded as an assessment of the complexity of a time series by measuring the probability of generating new patterns.
29
It is independent of the length of data. Aiming at the subsignal series
(1) Construct a series of vectors T with

where
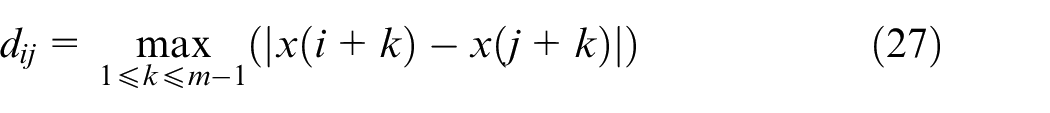
(2) Define the distance between
(3) Aiming at
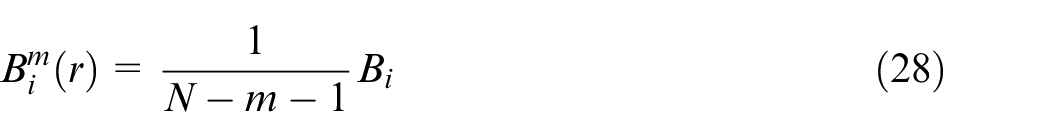
(4) Define
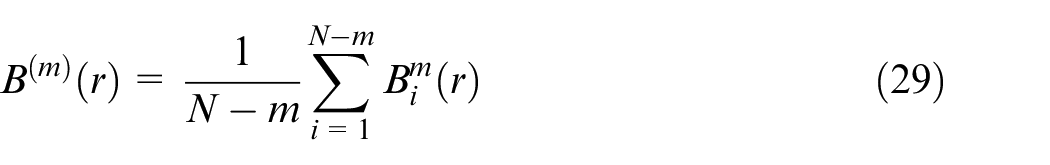
(5) Add the dimension to m+ 1 and repeat the above steps to calculate
(6) The sample entropy of a subsignal

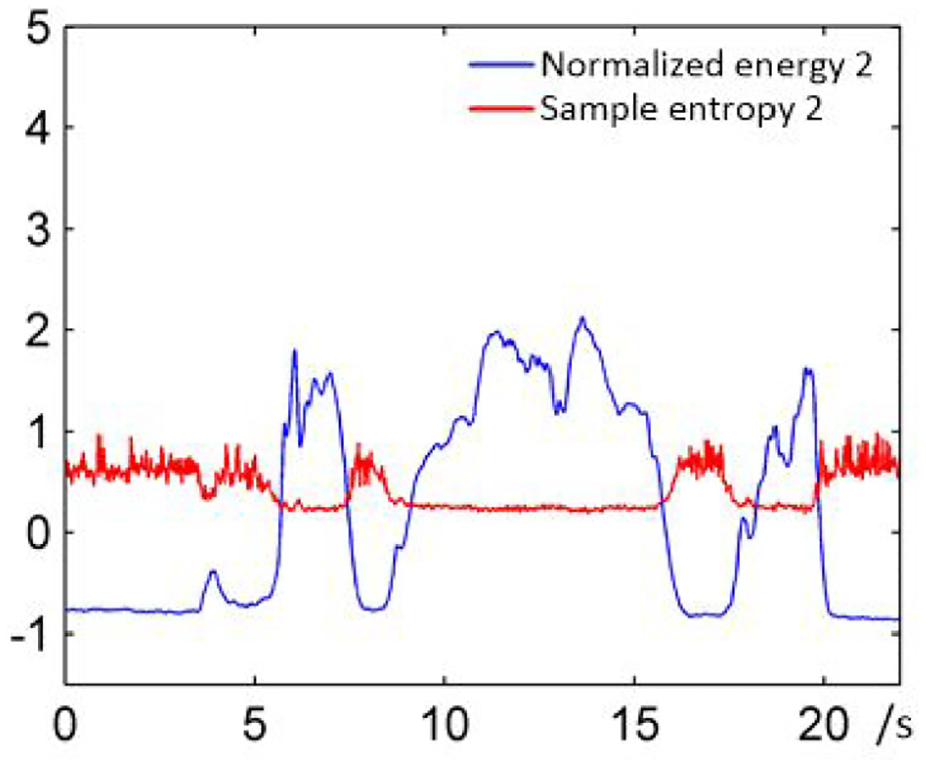
For each subsignal, the energy and sample entropy of each frame are computed. The global trend of the signal is shown by energy, while the local complexity is expressed by the sample entropy. Nevertheless, it is necessary to filter out the chatter-independent components. According to the trend of energy and sample entropy, the most relevant component to cutting state is retained to identify the location of chatter occurrence and shown in Figure 4.
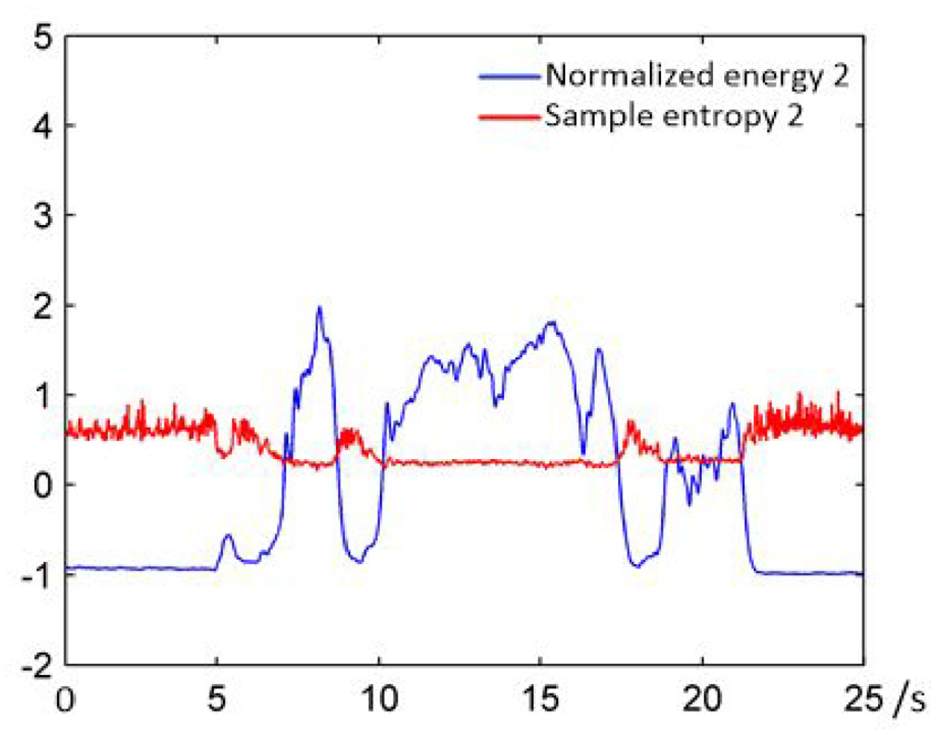
Energy and sample entropy of subsignal 2.
For chatter identification, the decision tree model is built by the CART algorithm, 28 rather than the empirical model constructed from the extensive experiments. To enhance accuracy of the CART model, the cutting states are divided into two categories: chatter and nonchatter. The training dataset is constructed by double sensitive indicators, and the corresponding feature set is labeled through supervising learning. Then, the CART algorithm is applied to build the decision tree for cutting states recognition in the milling process, and the details are shown in Figure 6.
Experimental setup
To demonstrate the proposed method, milling tests at multipaths with different axial cutting depths are carried out on a five-axis CNC machine shown in Figure 5. The axial depth of cut is set as 0.2, 0.5, 0.8, and 1 mm, while the radial cutting depth is 0.8 mm. A solid carbide end mill cutting tool with 16 mm diameter and 45° helix angle is used. In addition, the thin-walled work piece is made of Al 6061 with the dimension: 80 × 40 × 3 mm3. A microphone GRAS 46AE is applied to collect the acoustic signal. The sample frequency is set as 25,600 Hz. The spindle speed of the milling experiments is 5000 r/min.
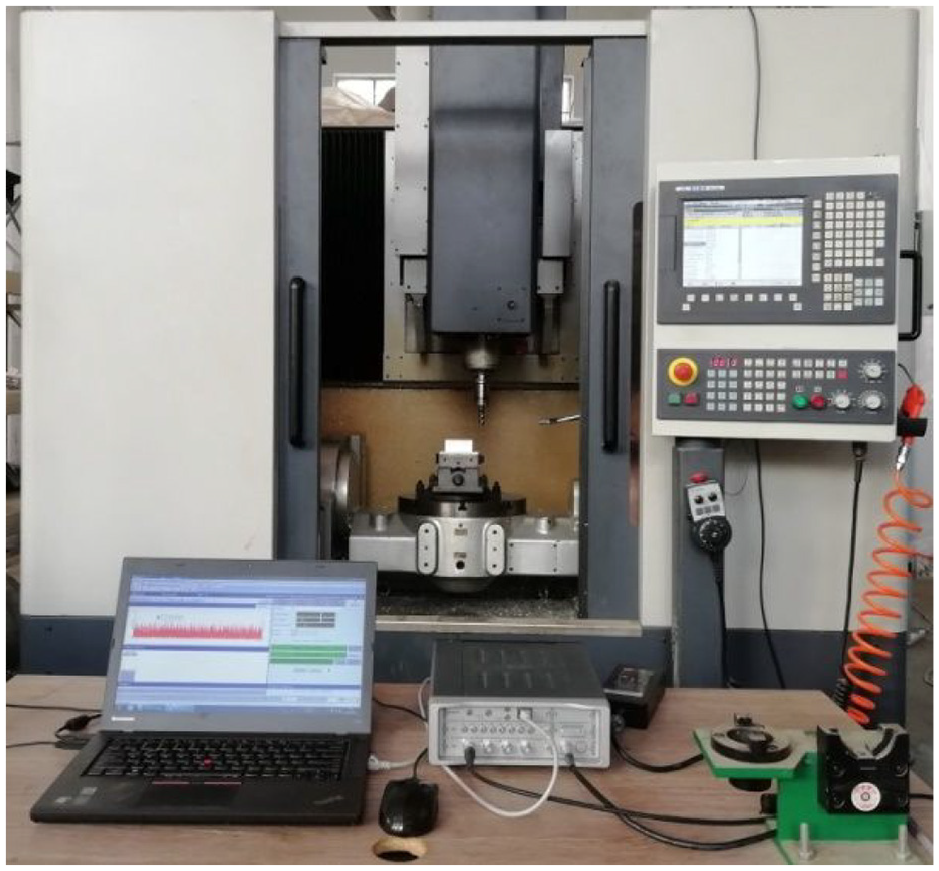
Experimental setup.
Results and discussion
To verify the proposed method, the cutting states in thin-wall milling were identified by following the procedure shown in Figure 6. The acoustic signal with axial depth of cut 0.8 mm is shown in Figure 7, which contains three categories of cutting states (i.e. air cut, stable, and chatter states). To demonstrate the property of time-varying and multimode in thin-wall milling process, the frequency spectrums at the regions (a), (b), and (c) are calculated as shown in Figure 8, which represents the different cutting states distributed in the corresponding location. Note that the spectral distribution and its amplitude change significantly when chatter happens. The frequencies of the signal main components are expressed as
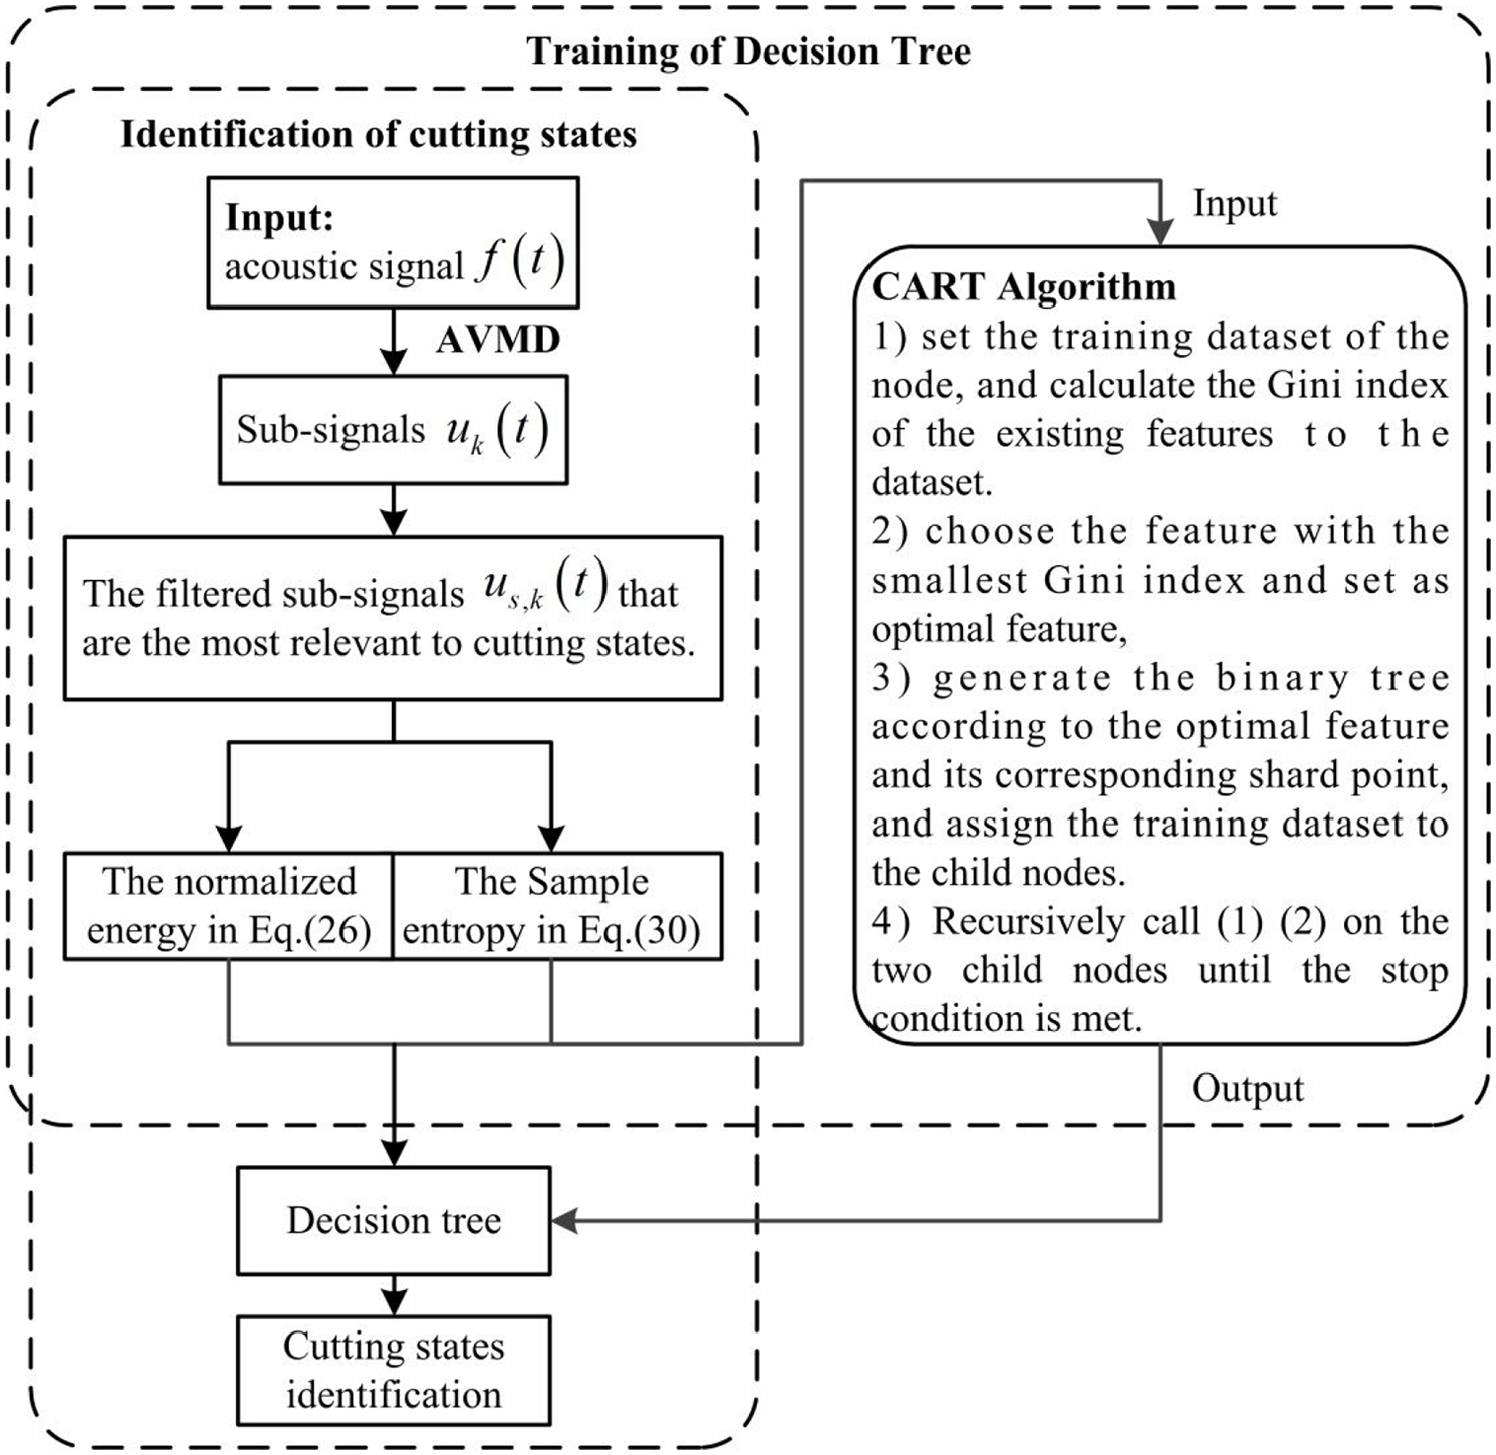
Flowchart of the proposed chatter identification method.
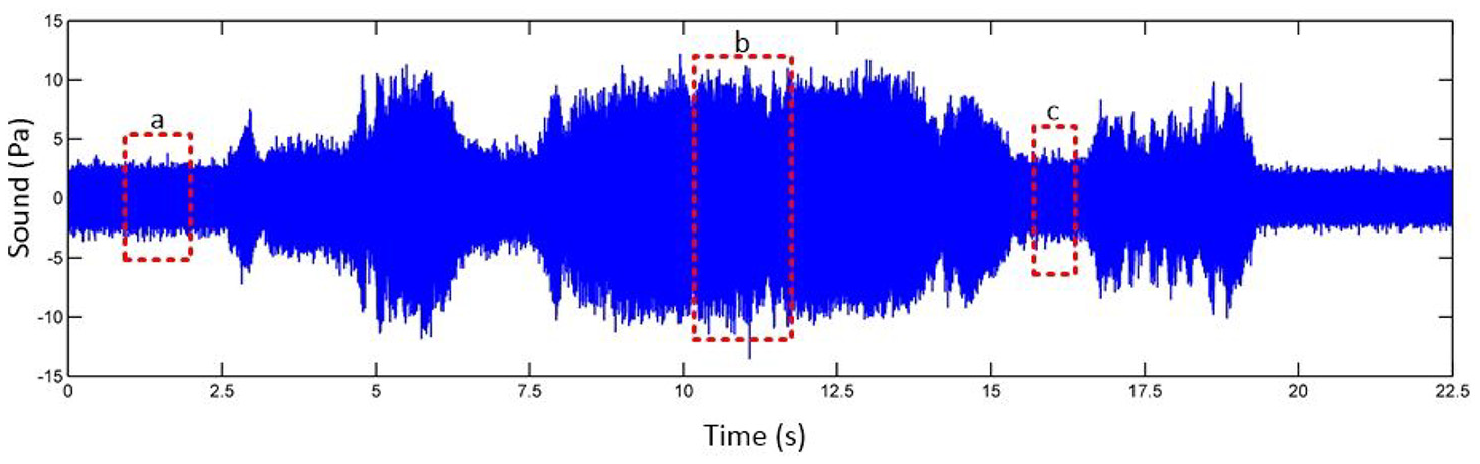
The acoustic signal collected from thin-wall milling.
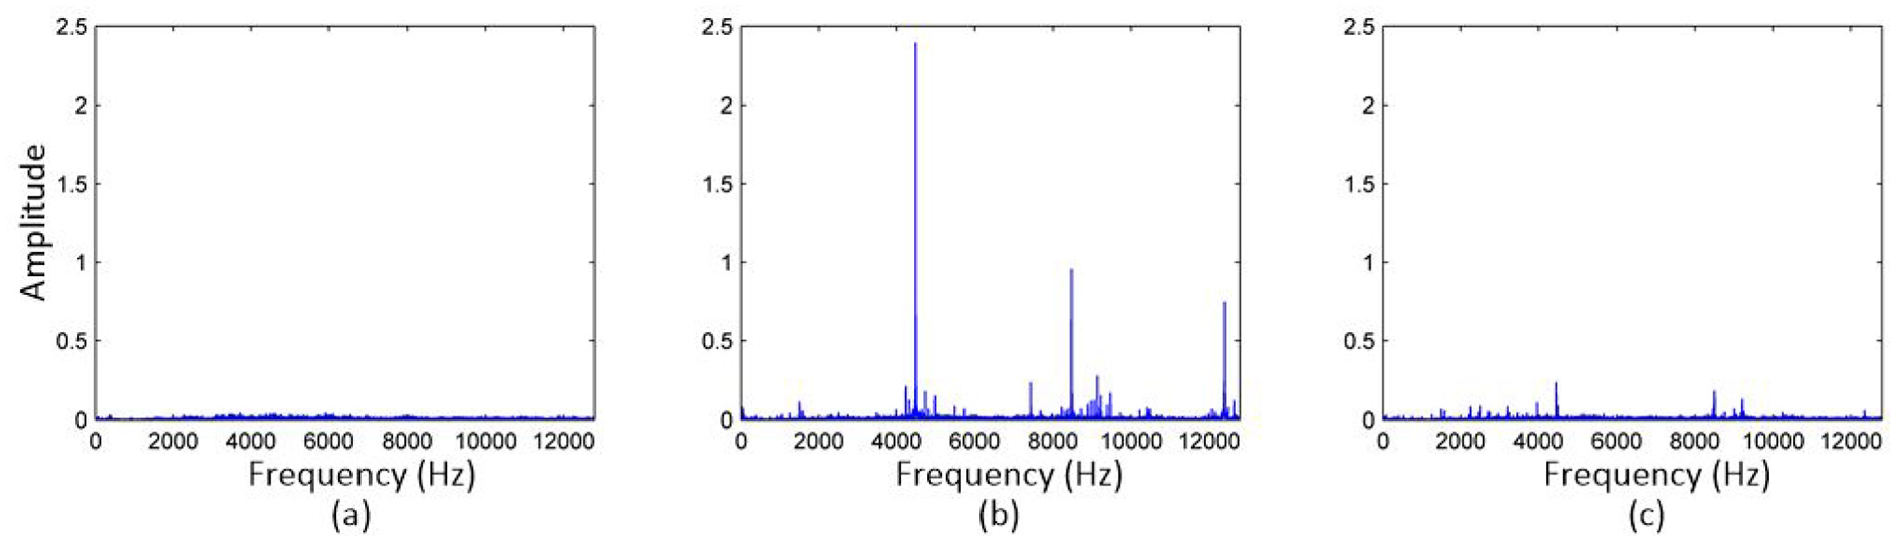
The results of FFT at the corresponding regions (a), (b), and (c) in Figure 7.
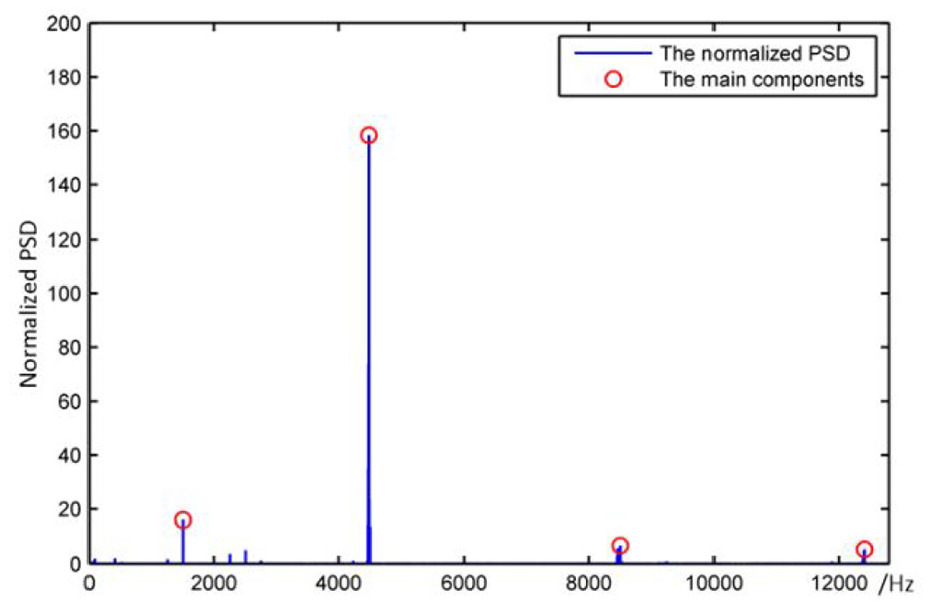
The results of the adaptive energy ratio-based sifting method.
Next, the VMD method with the optimal initial conditions is used to process the vibration signal. The number of mode (
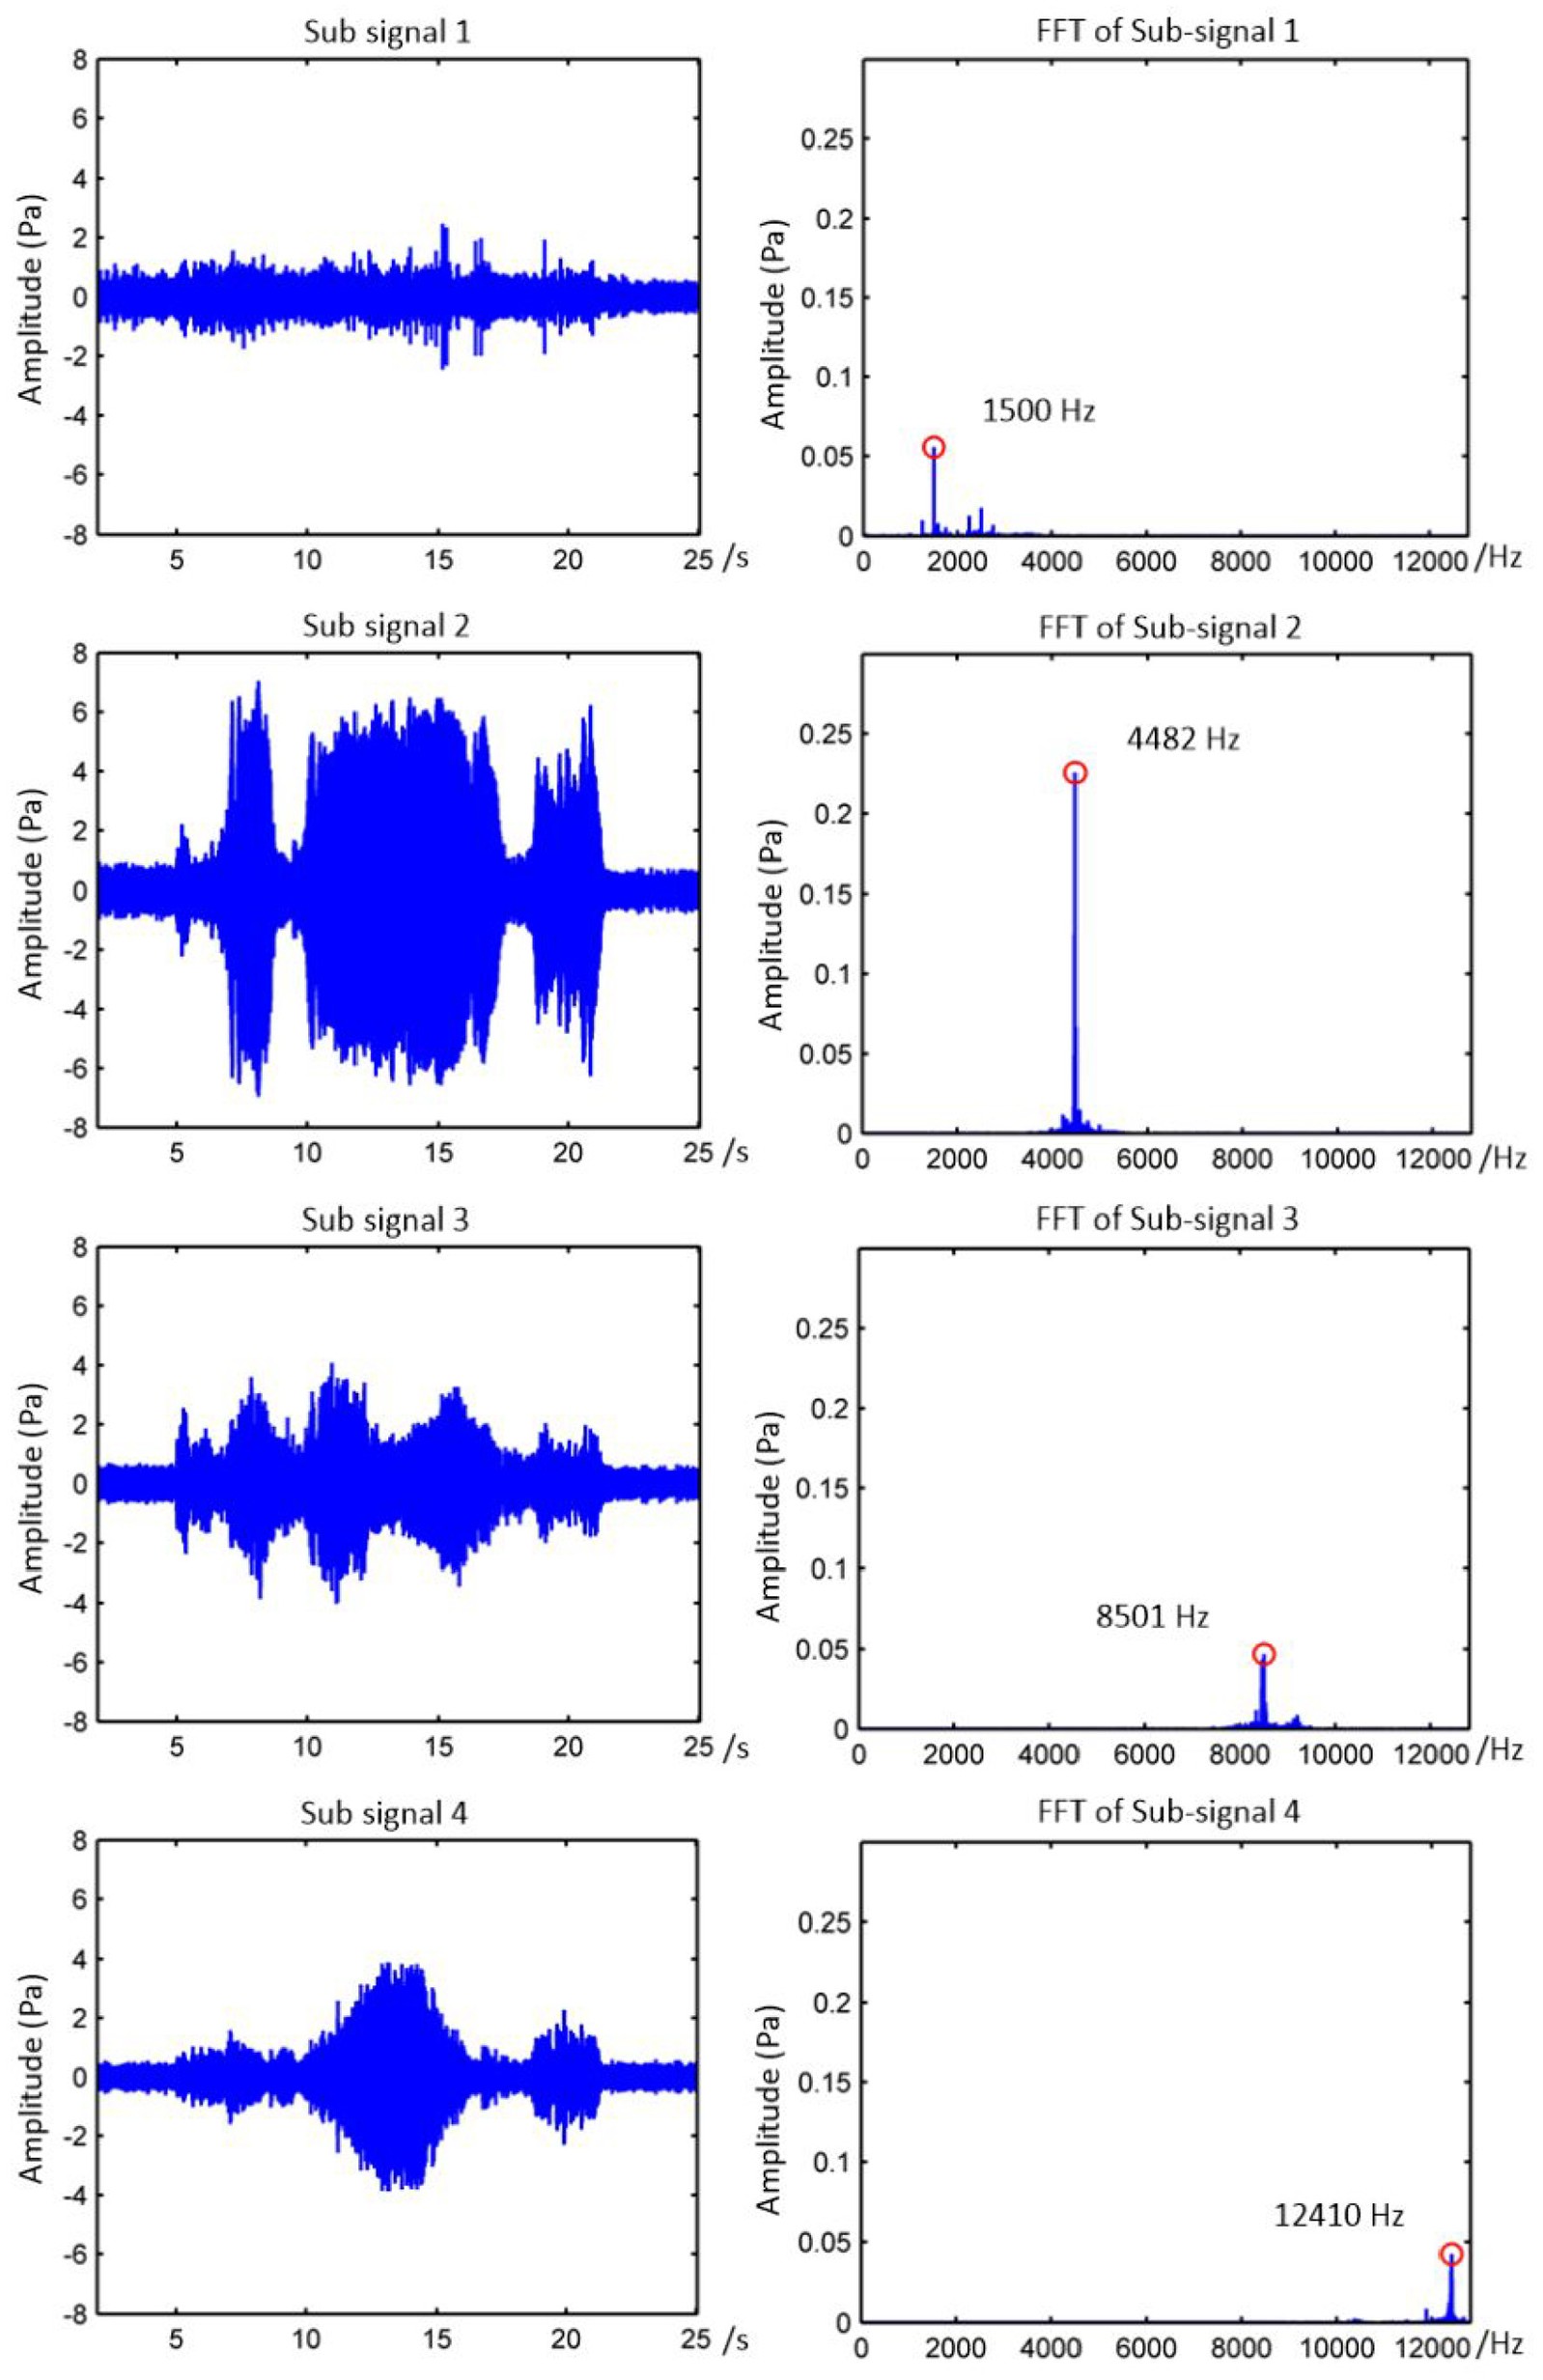
Subsignals obtained from the AVMD method and FFT.
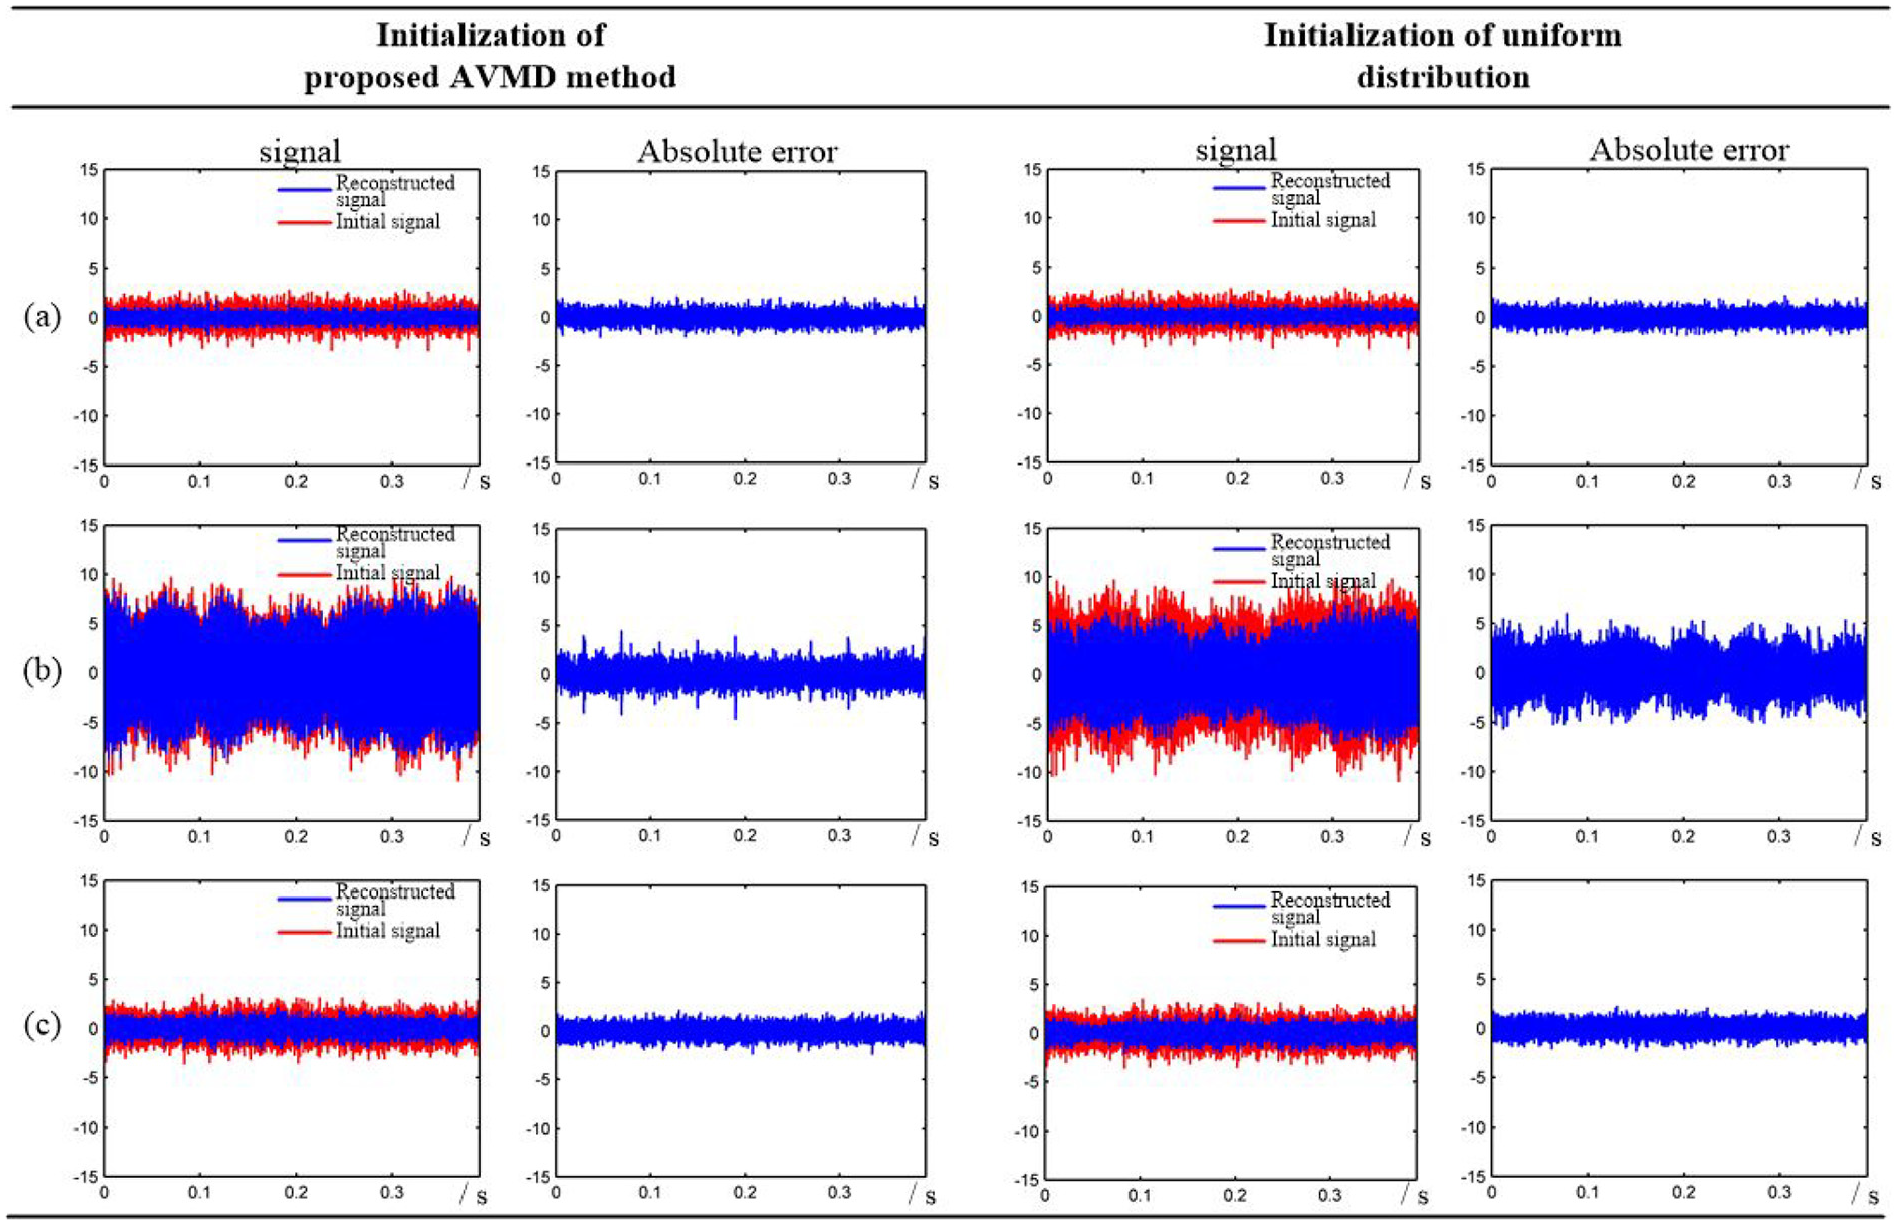
Results of the VMD method with different initial center frequencies.
To generate the decision tree, the normalized energy and the sample entropy of the subsignals are calculated. However, useless information are found along with the energy curves, which need to be eliminated. Figure 4 shows the selected curves of the energy and the sample entropy. It is obvious that the cutting states can be classified into chatter and nonchatter. In consideration of surface finish, the feature set is labeled under the supervised learning. The training dataset of the decision tree is set by the energy curve and sample entropy. Tree pruning, as a vital step, can enhance the generalization of decision tree to fit other conditions in a small scope.
After tree pruning, the decision tree is obtained to identify the cutting states into two aspects: chatter and nonchatter. At the root of tree model, the sample entropy is selected as classification criteria by the CART algorithm. Meanwhile, the normalized energy is calculated to classify the states at other nodes of the branches. The value of each threshold is computed and shown in Figure 12. Compared with the methods that determine threshold empirically, the thresholds obtained by the decision tree model are more reasonable, although it is suboptimal. To verify the accuracy of the decision tree model, another cutting test with a depth of cut of 0.8 mm is carried out that also contains the above states (i.e. chatter and nonchatter). With the proposed AVMD method, the new signal is decomposed into several modes. Then, the energy and its corresponding sample entropy after selecting are shown in Figure 13. Although there is a little difference between the two signals of two tests, the result of chatter identification is acceptable with a high percentage of accuracy. The rate of accuracy is 92.42% according to the statistics of cutting states. For the approaches of identifying chatter by threshold, the value of threshold is usually based on personal experience. Due to the subjective factors, it will not be optimal. Conversely, the threshold in the decision tree model is calculated by the CART algorithm objectively, where the cutting states along with tool path is fully taken into account. And the decision tree, as a suboptimal model, can make good prediction about unknown data.
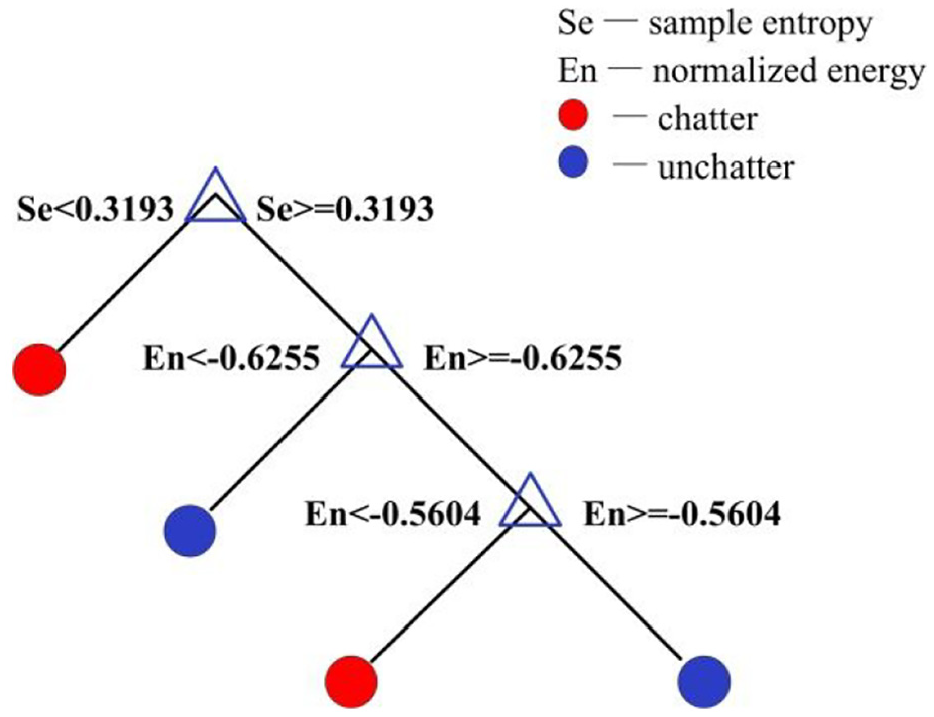
The decision tree model.
The energy and sample entropy of the subsignal in another test.
Conclusion
An effective method by means of AVMD and decision tree is proposed to identify chatter in thin-wall milling. The measured acoustic signal that contains multiple components is difficult to handle for VMD. Therefore, an adaptive energy ratio-based sifting method is presented to improve initialization conditions of VMD. As a result, the above signal can be self-adaptively decomposed into submodes with the expected narrowband. Unlike the chatter identification method with an empirical threshold, decision tree is established to calculate the chatter threshold by the CART algorithm objectively. The results of milling tests validate that chatter can be identified at the allowable scale with the proposed model. In addition, the proposed method has great potential for application in online chatter detection. Furthermore, the identification of chatter should be directly mapped to the quality of the machined surface, rather than the derived threshold.
Footnotes
Appendix 1
Declaration of conflicting interests
The author(s) declared no potential conflicts of interest with respect to the research, authorship, and/or publication of this article.
Funding
The author(s) disclosed receipt of the following financial support for the research, authorship, and/or publication of this article: This research is supported by the National Key Research and Development Program of China (2018YFA0704603), the National Natural Science Foundation of China (91948203), the China Postdoctoral Science Foundation (BX20190054), and the Natural Science Foundation of Liaoning Province (2019-BS-045).