
Abstract
This article analyzes the phenomenon of “arc shape” in surface characteristics caused by dynamic vibration in ultra-precision machining. First, a surface simulation model is proposed based on the effect of the tool shape on the cutting profile. The accurate mapping relationship between spindle speed, feed speed, relative vibration, and the motion track of the tool tip to the workpiece profile is also established. Thereafter, the input frequency spectrum signature of an intermittent cutting force is found to be determined by the spindle speed and workpiece characteristics, and this is verified by experimental results. A phased, self-regulated mode of forced vibration caused by intermittent cutting force is then proposed, and the forming of the arc shape feature is explained. In addition, it is revealed that output vibration can be kept at a low level by adjusting the spectrum curve of the input signal.
Keywords
Introduction
Ultra-precision machining has the advantages of high precision and ease of control in the machining process and is widely used in various settings. Ultra-precision fly cutting is mainly used to process potassium dihydrogen phosphate (KDP) crystals, which are the most important nonlinear optical crystal materials for laser frequency doubling and electro-optical switching devices in inertial confinement fusion due to their excellent nonlinear optical properties. Surface quality and shape precision can be achieved by removing the thin layer of material on the workpiece surface by ultra-precision fly cutting. The intermediate frequency microwave ripple errors on the processed surface of KDP crystal will directly affect its optical performance and focused spot quality. It will also cause laser scattering or diffraction, or even damage the optical element due to abnormal laser focus, which will greatly reduce the laser damage threshold.
The arc shape is one of the intermediate frequency microwave ripple errors. In recent years, excellent progress has been made to reduce the medium-frequency wave error. Zhang and To 1 treated the aerostatic spindle of the ultra-precision machine tool as afive-degree-of-freedom (5-DOF) system and studied the influence of the dynamic characteristics of the spindle on the surface topography of parts. Chen et al. 2 theoretically and experimentally carried out an effect analysis of the spindle error according to the feeding and cutting directions of a fly-cutting machined surface. Zhang and To 3 investigated the dynamic responses of aerostatic bearing spindles, considering stiffness and damping as constants, through building up a 5-DOF dynamic model. They also investigated the influences on the machined surface profile of the spindle vibration. Cheng and colleagues4,5 proposed an innovative dynamic cutting force model that considered instantaneous chip thickness and revealed the relationship between process dynamics and micro-cutting mechanics. Lu et al. 6 adopted a transfer matrix method to establish a multi-rigid-flexible-body dynamics model of an ultra-precision fly-cutting machine tool, and he concluded that the stiffness of the aerostatic bearing spindle has a significant influence on the surface. Wang et al. 7 successfully reduced the micro ripples on the machined surface by adopting a combination of a computer-controlled optical surfacing technique and the principles of micro-dissolution water polishing. Chen et al. 8 established an evaluation that revealed that the power spectrum density of actual surface ripples and the rotation frequency of the spindle were highly correlated. Liang et al. 9 devised an effective control method to reduce micro ripples and designed a relationship between the surface ripples and the dynamic characteristics of the fly-cutting machine. Li and Liu 10 established a 5-DOF model to study the dynamics of the aerostatic bearing spindle considering the translation and tilting motions of the fly-cutting machine tool. Liu et al. 11 analyzed spatial frequency domain errors of ultra-precision machines and revealed the effect of each error on the machined surface. He found that fluctuations in oil pressure had great influence on spatial frequency-based specifications. Liu et al. 12 investigated external aerodynamic forces on ultra-precision fly-cutting machines caused by intermittent and periodic sweeps between the workpiece and the tool holder. Chen et al. 13 introduced a dynamic accuracy design for the fly-cutting machine tool based on the error allocation of the frequency domain. Yang et al. 14 established a prediction model of machining surface topography, and concluded that the dynamic characteristics of the air spindle were the main cause of surface strips. Zhao and Cheung 15 presented a dynamic process chain model that comprised vibration and geometric models of ultra-precision fly cutting. He and Zong 16 described the mechanism of multi-frequency vibration on the optical performance of diamond-turned workpieces, and he used well-established two-step process technology to reduce the effect of vibration, which was experimentally proved to be highly effective.17,18 Gao et al. 19 investigated the relationship between the ripple errors of machined surfaces and oil source pressure fluctuations and demonstrated that an unsteady oil source pressure had a remarkable effect on the topography of a workpiece. Wei et al. 20 theoretically and experimentally investigated the dynamic characteristics of air spindles and their effect on medium-frequency ripples in machined surface shapes.
However, under the action of an intermittent cutting force, the arc shape characteristics of square and circular workpieces were found to be different. The existing research had not explained the mechanism of arc shape on machining surfaces or the cause of the different arc characteristics.
In this article, a surface shape simulation model based on workpiece–tool relative vibration is proposed. A frequency domain model of intermittent cutting force is also established, and the input frequency spectrum characteristic of the intermittent cutting force is found to be determined by spindle speed and workpiece characteristics. In addition, the distribution characteristics of acceleration vibration signals on the working table when cutting square and round parts are analyzed. Furthermore, the characteristics of the vibration response under intermittent cutting force and the vibration optimization control based on amplitude–frequency control of intermittent cutting forces are studied. And the characteristics of arc shape are also analyzed.
Simulation model of surface shape mapping based on relative vibration of workpiece and tool
The surface mapping model was based on the interference effect of the tool shape on the cutting profile, and an accurate mapping relationship between spindle speed, feed speed, relative vibration, and the motion track of the tool tip on the workpiece profile was established. Thereafter, the relationship between the surface and cutting parameters, tool geometry, and relative vibration characteristics could be analyzed.
The calculation steps of the mapping algorithm were as follows:
The workpiece surface was meshed to determine the node coordinates K(xk, yk), as shown in Figure 1.
The trajectory number [i – c, i + c] of the tool tip within the radius was calculated before and after the node (selecting the interference path).
The main spindle angle Θ was calculated for the ith track cutting to the location node K(xk, yk).
The distance d from node K to the center of the tool tip was calculated.
The cutting depth vector of node K under the 2cth tool tips was obtained, and the maximum value selected as the cutting depth of the point.
A three-dimensional shape map of the workpiece was generated, and the surface accuracy was calculated.
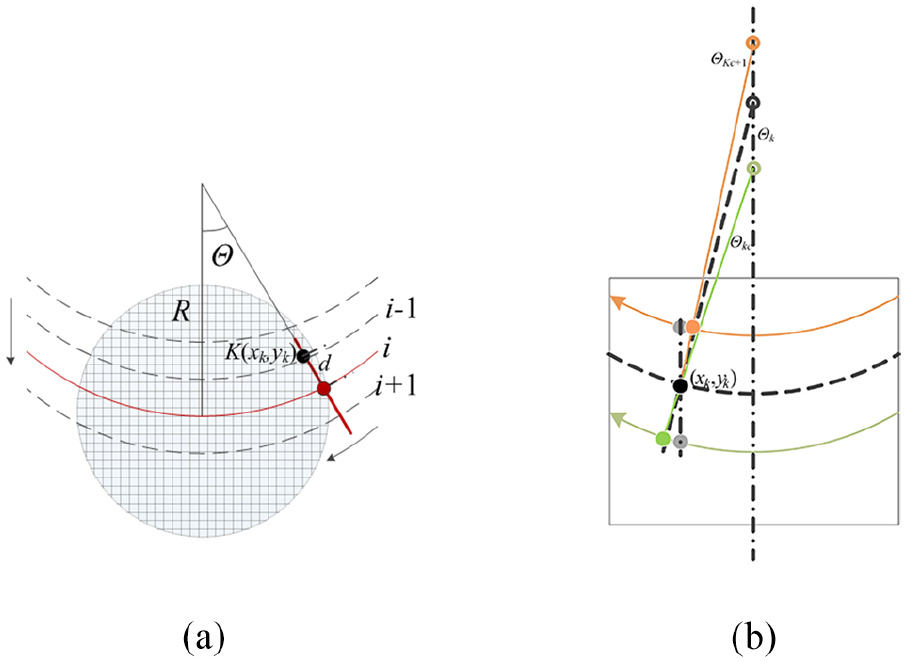
Schematic diagram of simulation surface cutting path calculation: (a) the division of surface mesh of a circular workpiece and (b) the cutting time of the trajectory before and after point K.
In the third step, the first part was to calculate the main spindle angle Θ for the ith track cutting to the location node K(xk, yk), that is, the exact moment of cutting to K. The following transcendental equation needed to be solved to calculate tki at this moment

where R is the radius of the cutter head, v denotes feed rate,
To solve equation (1), the intersection characteristic moment of the ith locus was determined first, then the time constraints [tki−, tki +] before and after the trajectory were calculated. Also, a nonderivative optimal algorithm was used to calculate the special solution of transcendental equation at this point, and then the accurate time of cutting the track to the corresponding grid point was obtained.
The software algorithm flowchart is shown in Figure 2.
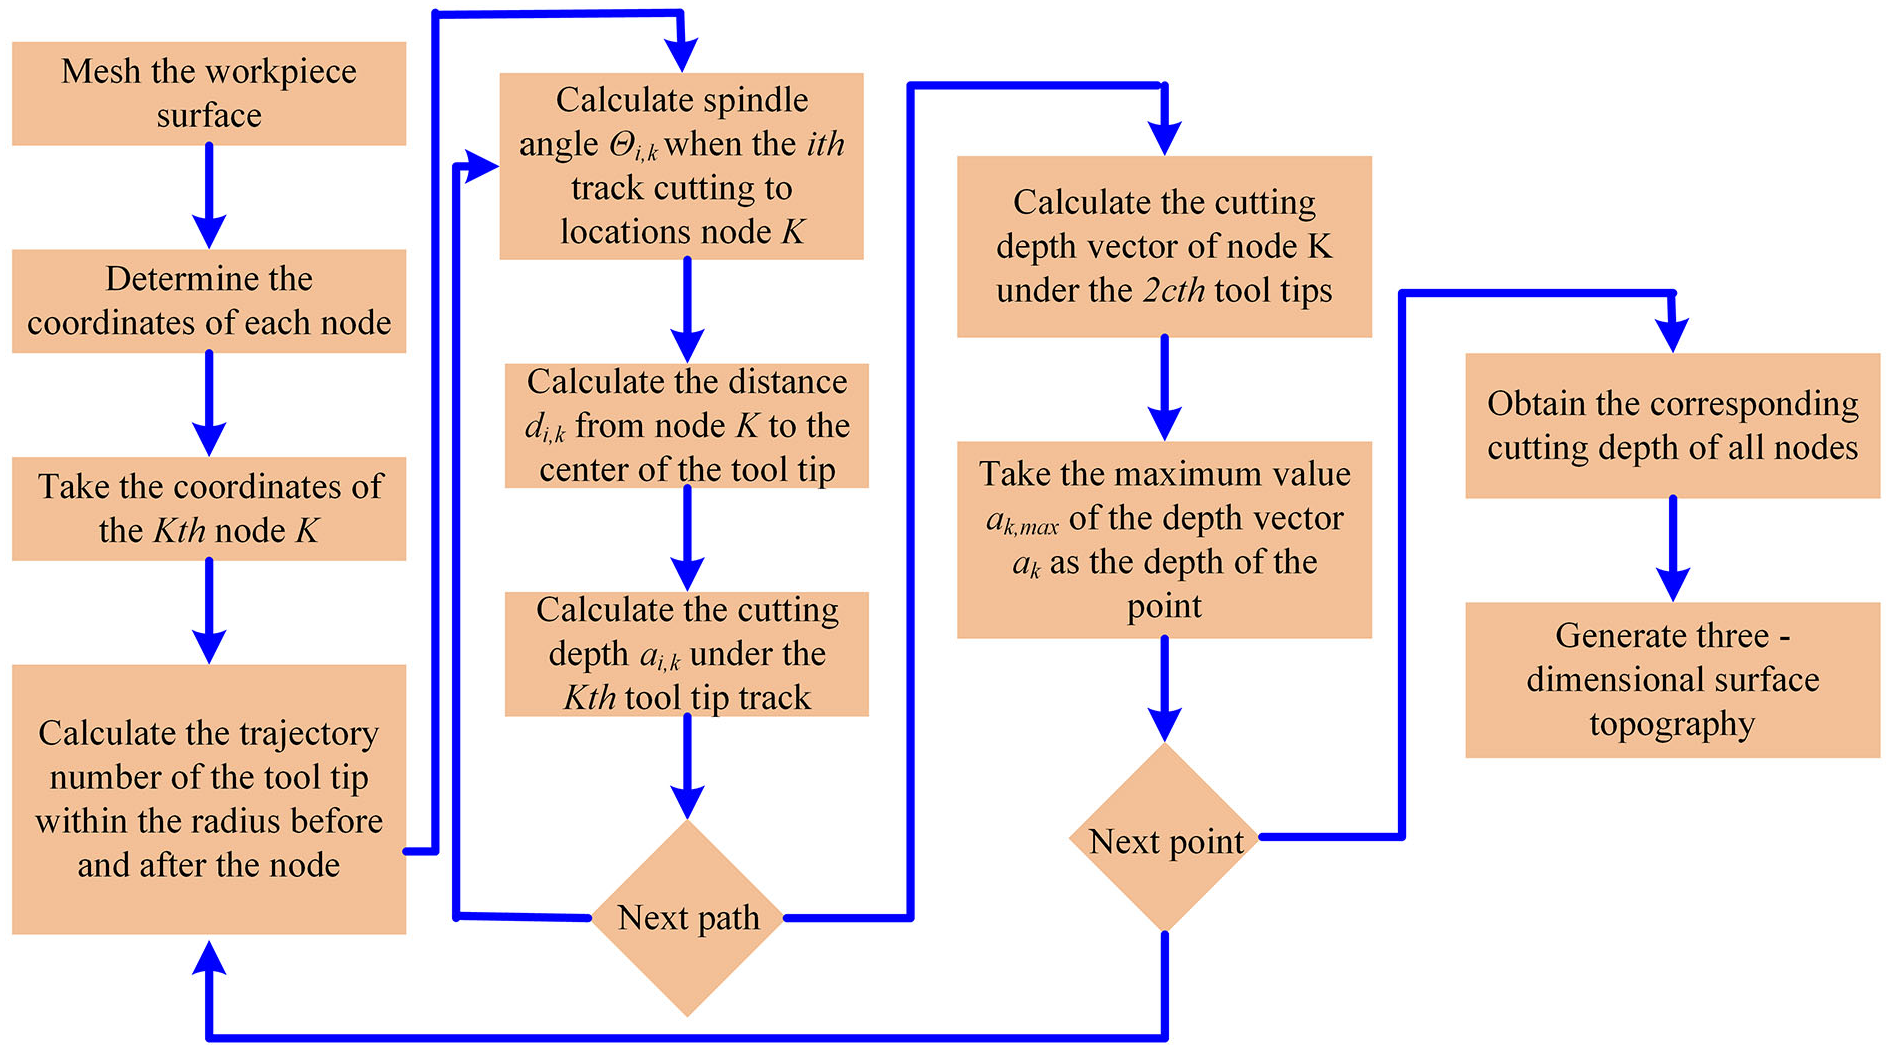
Flowchart of the surface mapping algorithm.
According to the flowchart, a corresponding surface mapping algorithm was developed based on MATLAB software, and the related surface simulation analysis was carried out. The model errors of the simulation model 21 and the proposed simulation method were compared under different simulation conditions. Figure 3(a) illustrates the results of the accurate simulation model proposed in this article, and Figure 3(b) describes the model error values of accurate simulation modeling and the method in Liang et al. 21 when the vibration amplitude was 0 µm. In addition, Figure 4 shows the model error comparison between the simulation method 21 and the method proposed in this article when the vibration amplitude was 10 µm, and the frequency was 585 Hz. The previous modal test results of the machine tool showed that the system had a resonance frequency of 585 Hz, so a vibration signal of 585 Hz was used for the simulation analysis.
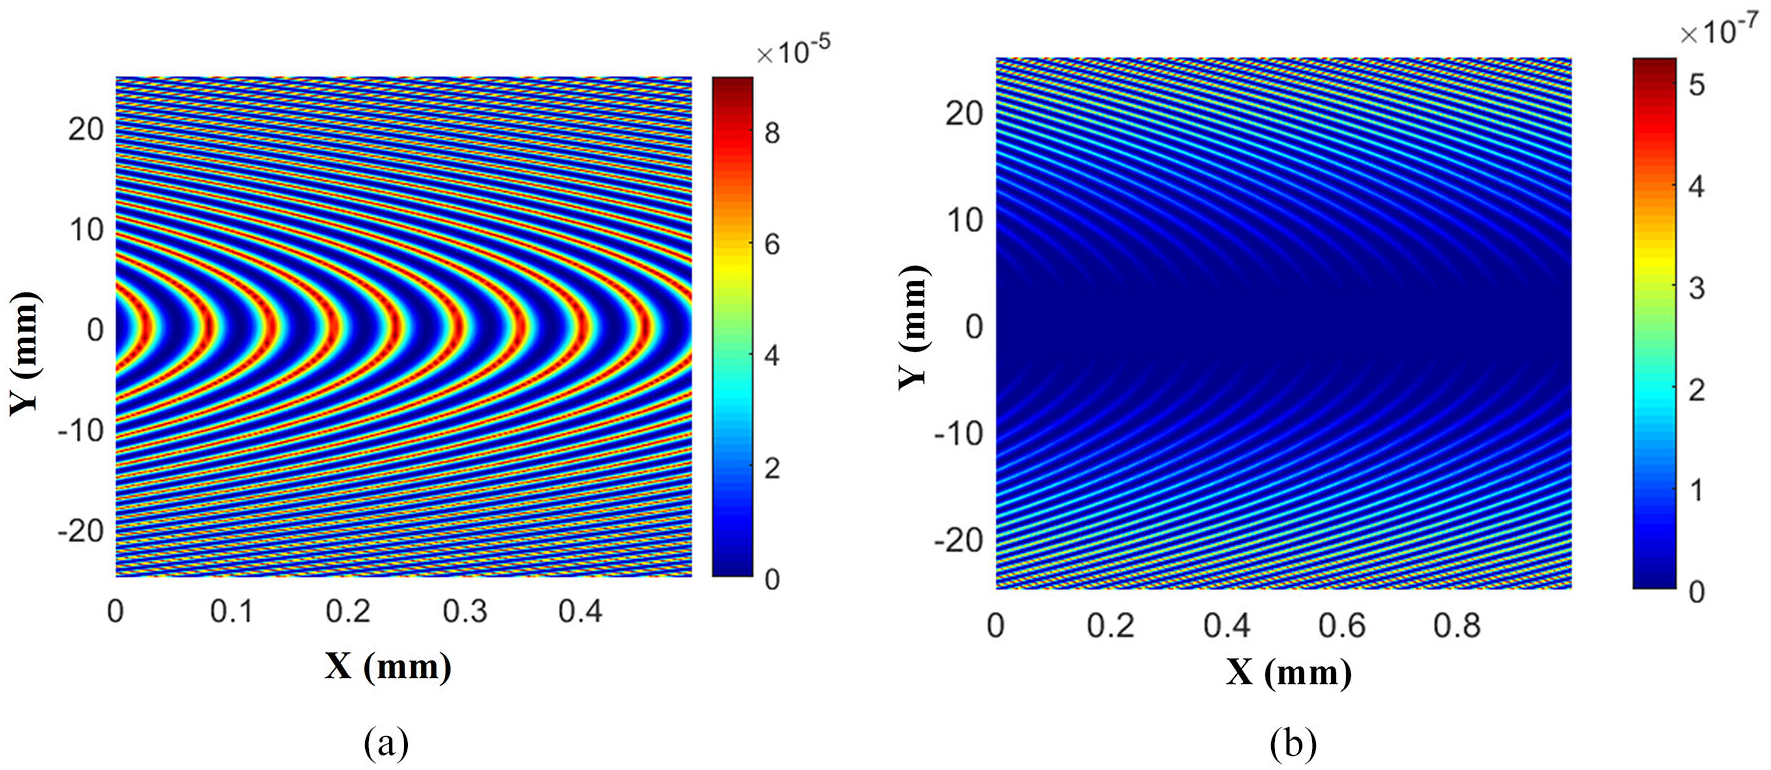
Simulation results of surface shape (the vibration amplitude is 0 µm and the frequency is 585 Hz): (a) Simulation model proposed in this article. (b) Model error.
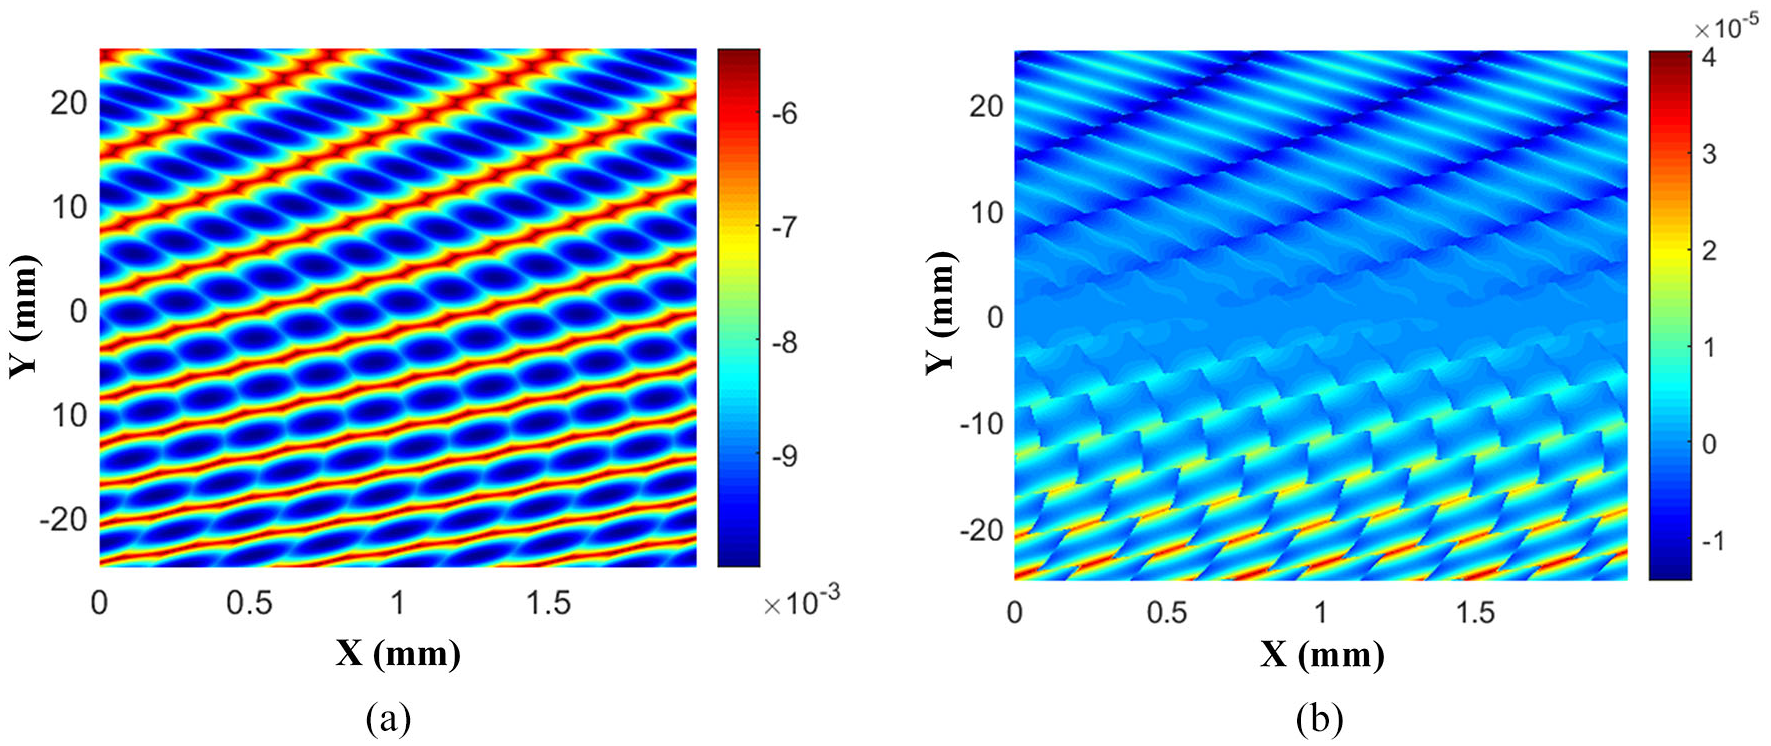
Simulation results of surface shape (the vibration amplitude is 10 µm and the frequency is 585 Hz): (a) Simulation model proposed in this article. (b) Model error.
Analysis of the surface profile errors caused by relative vibration
Intermittent cutting force model
Acceleration was achieved by using acceleration sensors (333B50, PCB Piezotronics). The cutting force was measured using a force sensor, and the z-direction amplitudes of the spindle were measured using a micro recorder (DH5916). In addition, the machining surface topography was obtained by a 4D dynamic laser interferometer. The field experiment diagram is shown in Figure 5.
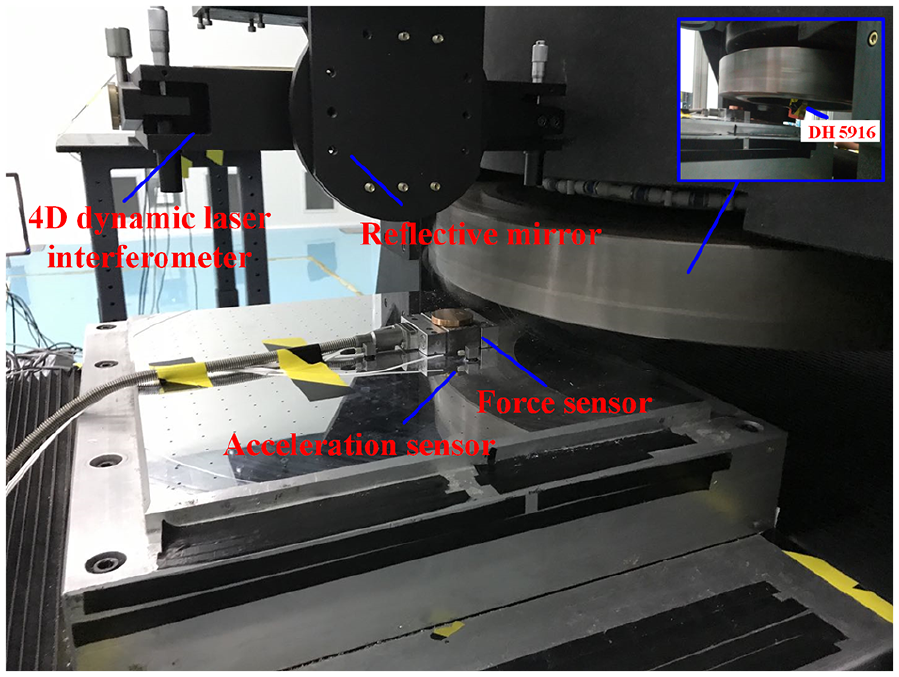
Field experiment map.
Figure 6 shows the intermittent cutting force waveform corresponding to a measured track. It can be seen that the measured waveform is the result of a superimposition of a square wave on the attenuation of the response curve. This is mainly because the force sensor was installed between the workpiece and the tool. The force measured was not a pure cutting force but the joint action of the cutting and the inertia forces of the workpiece. The attenuation curve of the force waveform was the inertia force of the workpiece, so the time domain waveform of the intermittent cutting force could be simplified as a square wave with amplitude A and action time

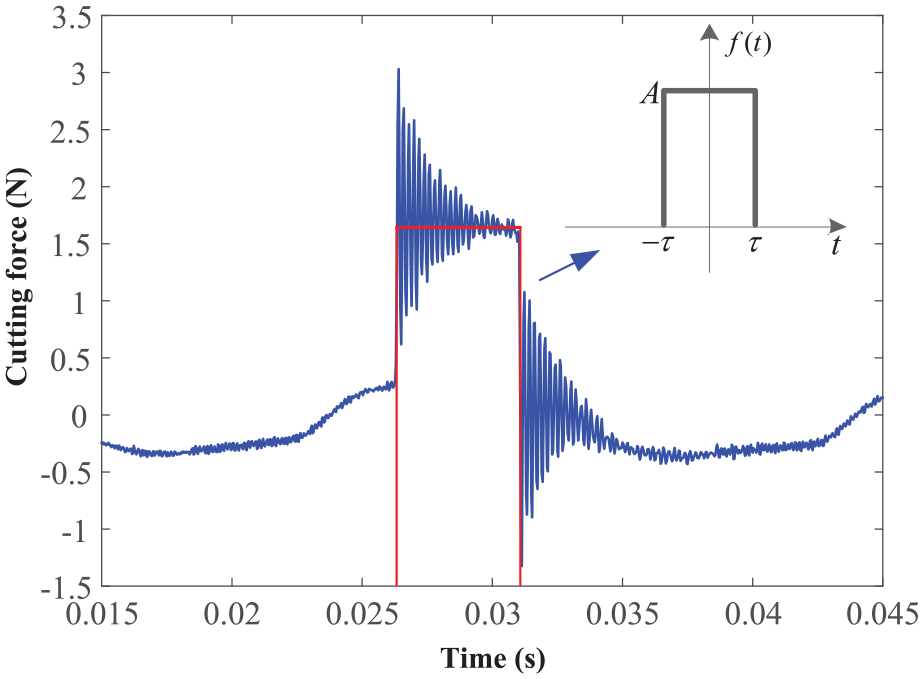
Time domain model of intermittent cutting force.
The spectral function of the square wave can be calculated as
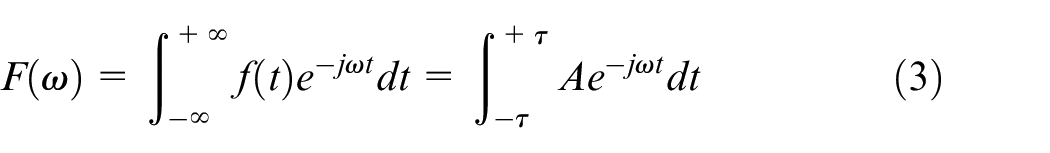
The amplitude–frequency function of the intermittent cutting force was

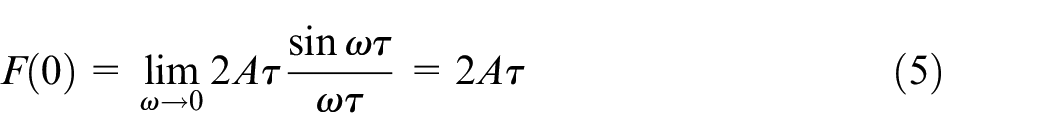
Figure 7 is the simulation diagram of the amplitude–frequency characteristic corresponding to certain intermittent cutting forces. It can be seen that the amplitude–frequency characteristic had a wave fluctuation distribution with attenuation, and the amplitude at a specific frequency point was 0. From the foregoing analysis, it can be seen that the shape of the amplitude–frequency characteristic was mainly determined by the square wave action time, as follows
where d is the workpiece diameter, d = 50 mm; R represents the radius of the cutter head, R = 325 mm; and n denotes spindle speed, n = 260 r/min.
Simulation diagram of the amplitude–frequency characteristics of a cutting force.
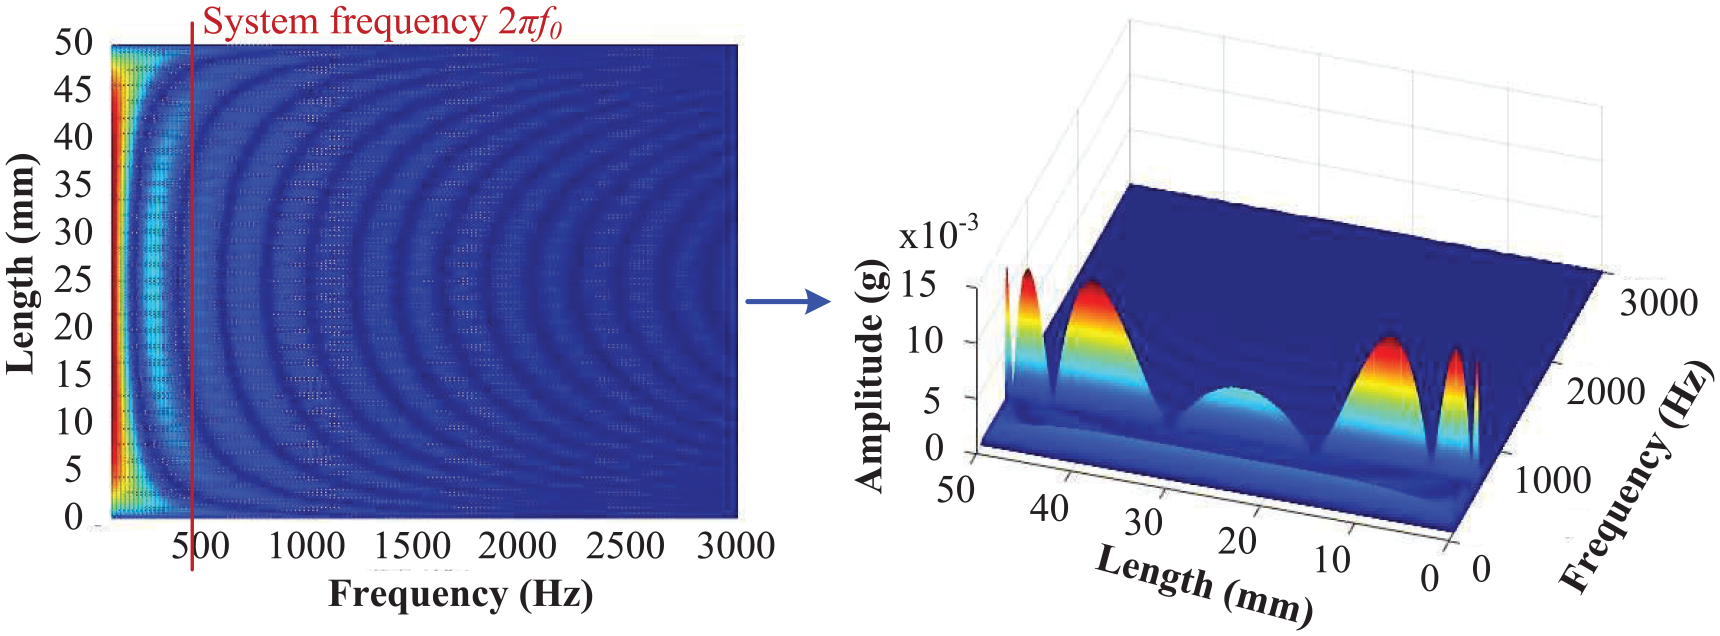
The action time of the square wave was determined by the spindle speed and workpiece size, that is, for the dynamic system of the fly-cutting process, the input frequency spectrum characteristic of intermittent cutting force was determined by spindle speed and workpiece characteristics. Through simulation analysis, a waterfall diagram of intermittent cutting force spectrum for cutting square and circular parts at the same spindle speed was obtained, as shown in Figure 8. In the whole cutting process, each track of square workpiece had the same cutting distance on the workpiece. With the increase of feed speed, its spectral characteristics were all the same. Therefore, the spectrum waterfall is shown in Figure 8 as a vertical linear strip with equal spacing. In the process of cutting a round workpiece, the distance of each cutting was not the same. With the change of feed speed, the length of single cutting gradually increased, and reached the maximum value in the middle position, and then decreased again. The spectral characteristics were changing constantly, and the waterfall diagram is distributed in a rippled arc shape.
Amplitude–frequency waterfall diagram of intermittent cutting force.
The difference between the preceding spectral characteristics is reflected in the vibration response of the process system. The waterfall diagrams in Figure 9 show acceleration vibration signals on the working table when cutting square and round workpieces. Their distribution characteristics are consistent with the foregoing analysis.
Amplitude–frequency waterfall diagram of vibration response signal: (a) waterfall diagram of vibration response signal when machining square workpiece and (b) waterfall diagram of vibration response signal when machining round workpiece.
The vibration output response caused by an intermittent cutting force is a result of the interaction between the input spectrum of the intermittent force and the dynamic characteristics of the process system. According to the characteristics of the intermittent force spectrum, when the circular workpiece was cut, the waterfall diagram of its vibration response was simulated and analyzed, as shown in Figure 10. It can be seen that, due to the rippled distribution of the intermittent force spectrum of the circular workpiece, the amplitude of its input signal was not constant on the corresponding natural frequency of a certain system, resulting in the amplitude of the vibration response signal not being constant in the whole cutting process, but having fluctuated distribution. This was because during the feeding process, the cutting distance of a single trajectory increases, the cutting time extends, and then the discontinuous force input spectrum curve appears offset.
Waterfall simulation of spindle vibration response signal.
Figure 11 is the waterfall diagram of the measured vibration response signal of the spindle, and its change in the whole cutting process was consistent with the aforementioned simulation analysis results.
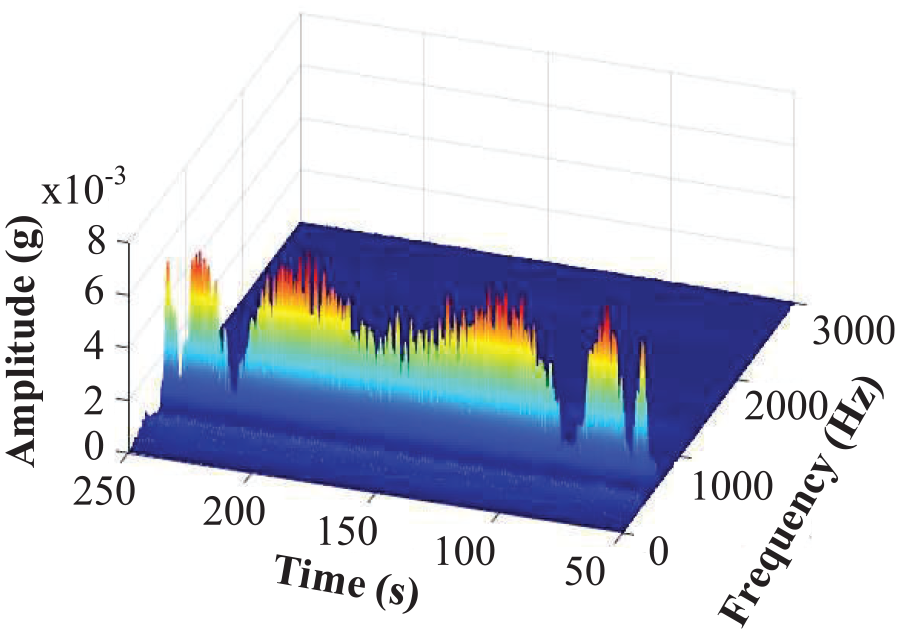
Measured waterfall of spindle vibration response signal.
Vibration response of the tool tip
To ensure the accurate orientation of the KDP crystal machining plane and crystal axis, the cutter disc diameter should be significantly larger than the workpiece being processed so that the cutting direction will not change significantly, leading to the inevitable intermittent cutting mode, as shown in Figure 12(a). In the process of the preliminary test, the vibration acceleration signal of the tool-tip position was monitored, and it was found that the amplitude of the tool-tip acceleration was much higher after entering the cutting area than before. The intermittent cutting process had significantly increased the vibration of the tool tip, which indicated that although the ultra-precision cutting force was very small, the dynamic vibration effect of the machine tool caused by it could not be ignored, as shown in Figure 12(b).
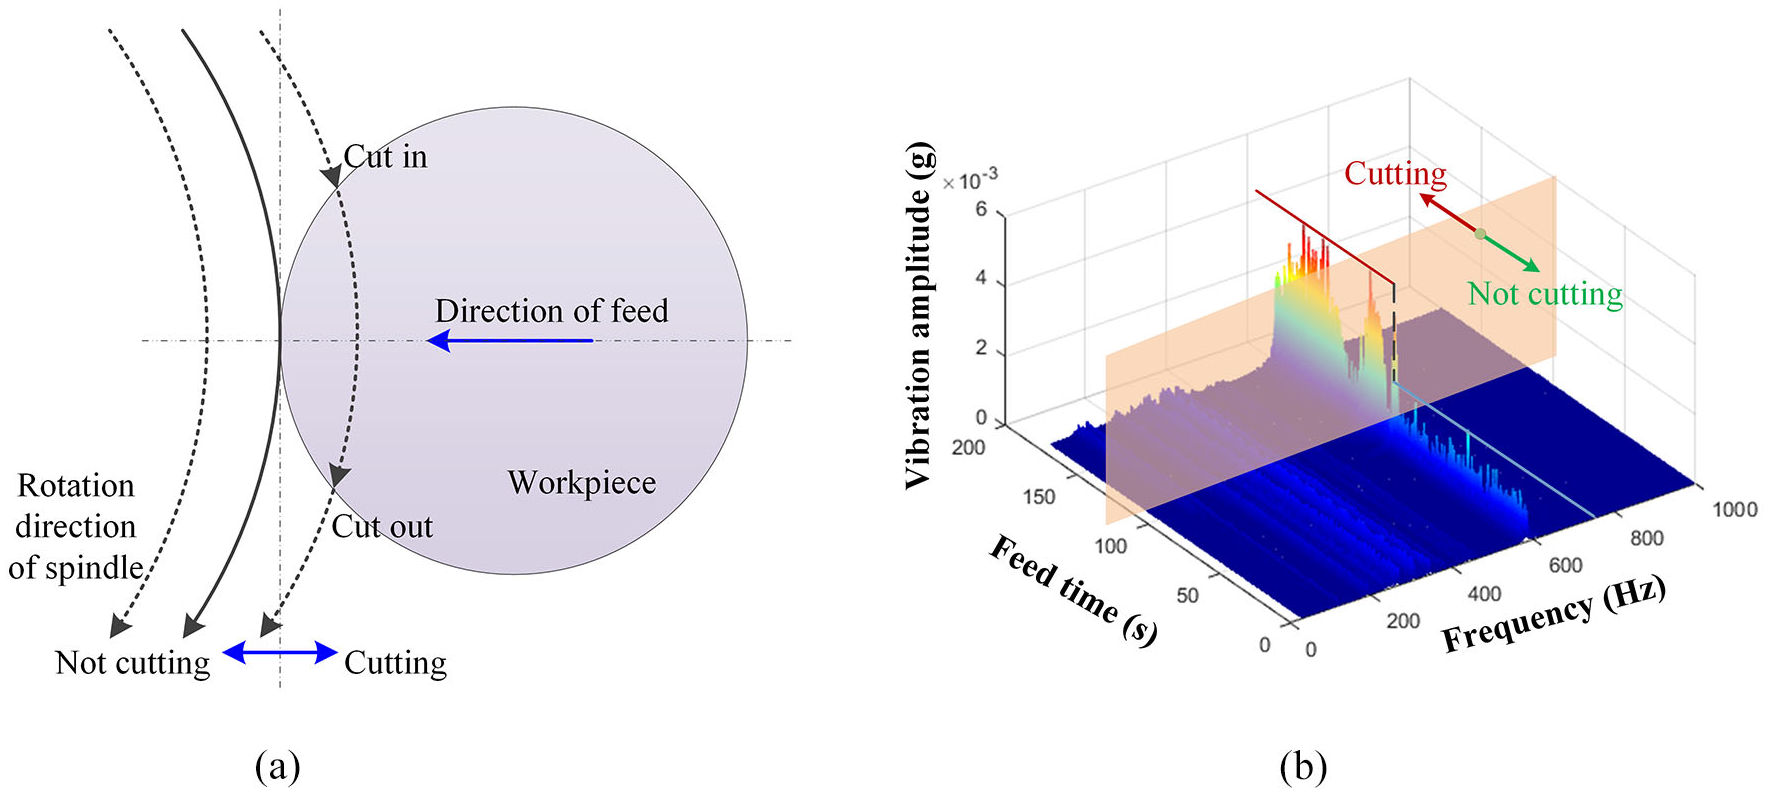
Effect of intermittent cutting on vibration amplitude of tool tip: (a) Schematic diagram of intermittent fly cutting. (b) Vibration change.
The relative displacement between the tool tip, the workpiece, and the cutting force can be regarded as a second-order mass-spring-damping system, with the equation for the complex frequency response function of the system as
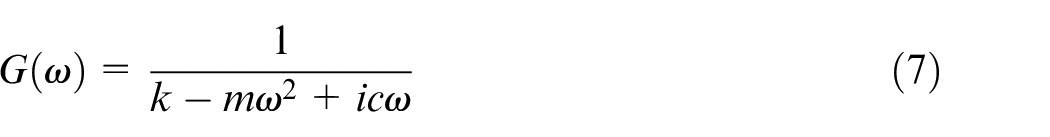
where k is the connection stiffness,
Combining equations (2) and (7), under the action of intermittent cutting force, the relative displacement Z(s) can be approximately expressed as
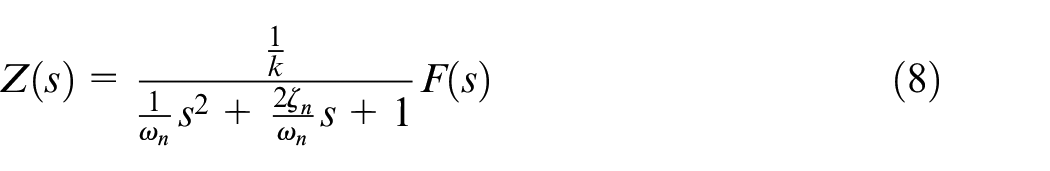
where
Figure 13, which shows the response when the intermittent cutting force A is 1.5 N, illustrates the corresponding simulation curve of relative displacement. It can be seen that during the process of the cutting force, the displacement of the system had a vibration attenuation, and the vibration frequency was the natural frequency of the system. The initial vibration time of each cutting track corresponds to the cutting time, that is, under the action of an intermittent cutting force, the vibration response presented a mode of “forced vibration.”
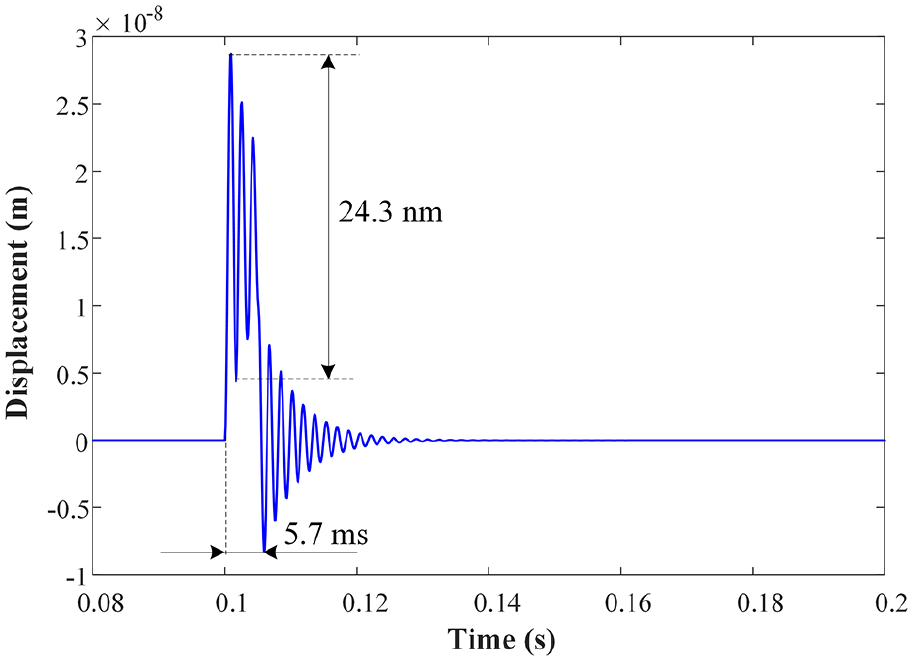
Simulation analysis of relative vibration track of tool tip and workpiece.
Vibration optimization control based on amplitude–frequency control of intermittent cutting force
It can be seen from the vibration response analysis of the spindle that for a fixed dynamic system, the output vibration can be kept at a low level by adjusting the spectrum curve of the input signal. Its basic principle is shown in Figure 14. By changing the action time of the single track cutting force, the frequency spectrum waveform of the intermittent force was adjusted so that the lowest point frequency of the amplitude–frequency diagram was equal to the natural frequency of the system dynamics, thus minimizing the output response.
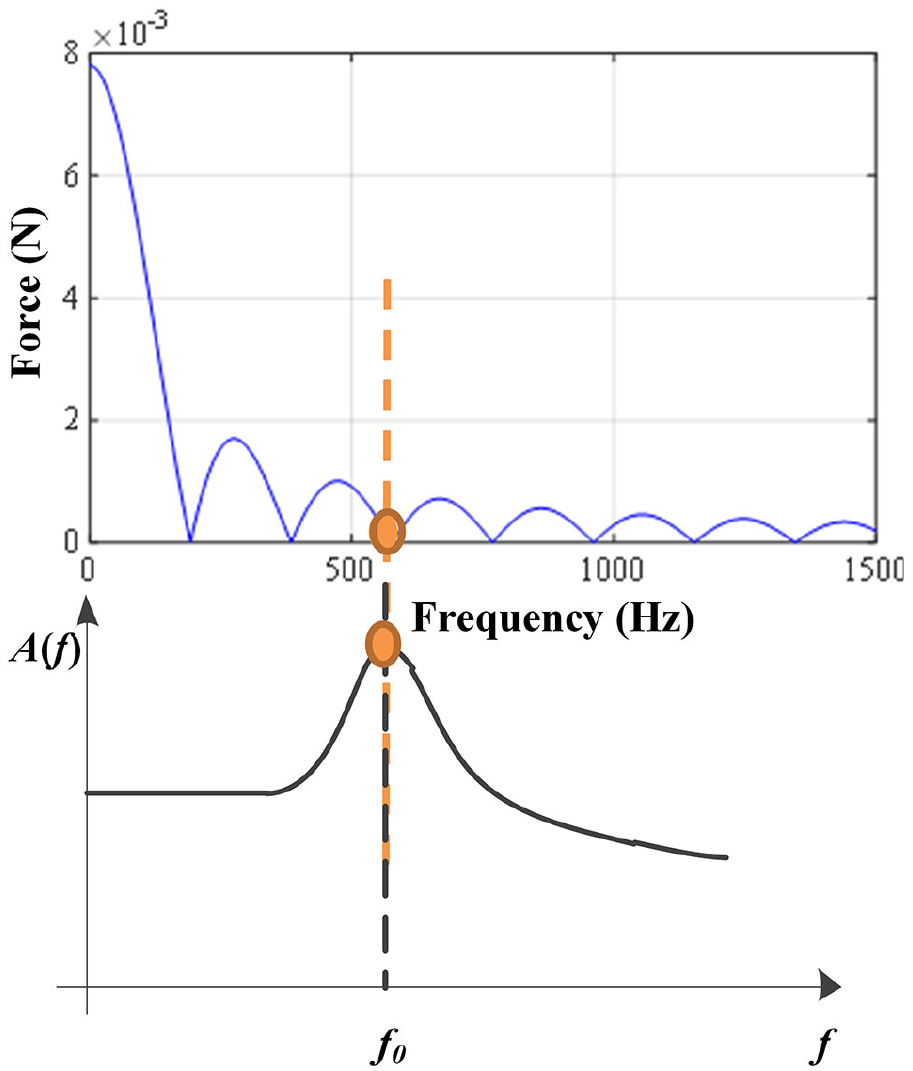
Schematic diagram of vibration minimization.
According to the foregoing analysis, when the amplitude of intermittent cutting force is 0 (minimum), the corresponding frequency point is
where
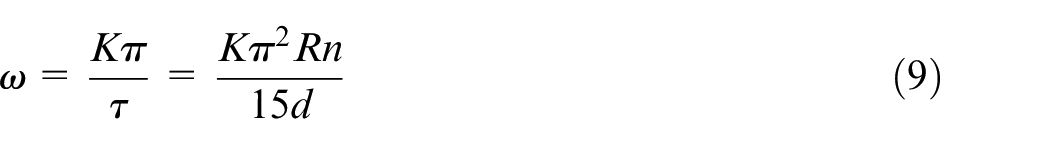
Assuming that the maximum resonance frequency of the system response is f0 and
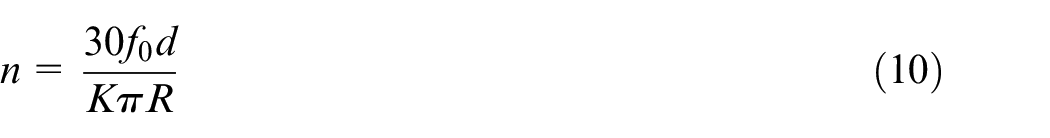
It can be seen from the preceding equation that the optimal spindle speed is not only dependent on the natural frequency of the process dynamics system but also closely related to the size characteristics of the workpiece.
Analysis of the characteristics of arc shape
Based on the foregoing analysis, without considering the damping effect, the mode of “forced vibration” can be analyzed by surface simulation software. The shape characteristics of the round copper pieces are shown in Figures 15(a) and (b). When the vibration frequency was 585 Hz, the corresponding spindle speeds were 260 and 280 r/min, respectively. It can be seen that for the circular parts, the surface shape characteristics caused by the vibration of the intermittent cutting force showed multiple arc-like bending. The bending direction was the cutting direction of the cutter disc, and the surface shape was less affected by the spindle speed. The higher the spindle speed, the thinner the corresponding arc-shaped stripes.
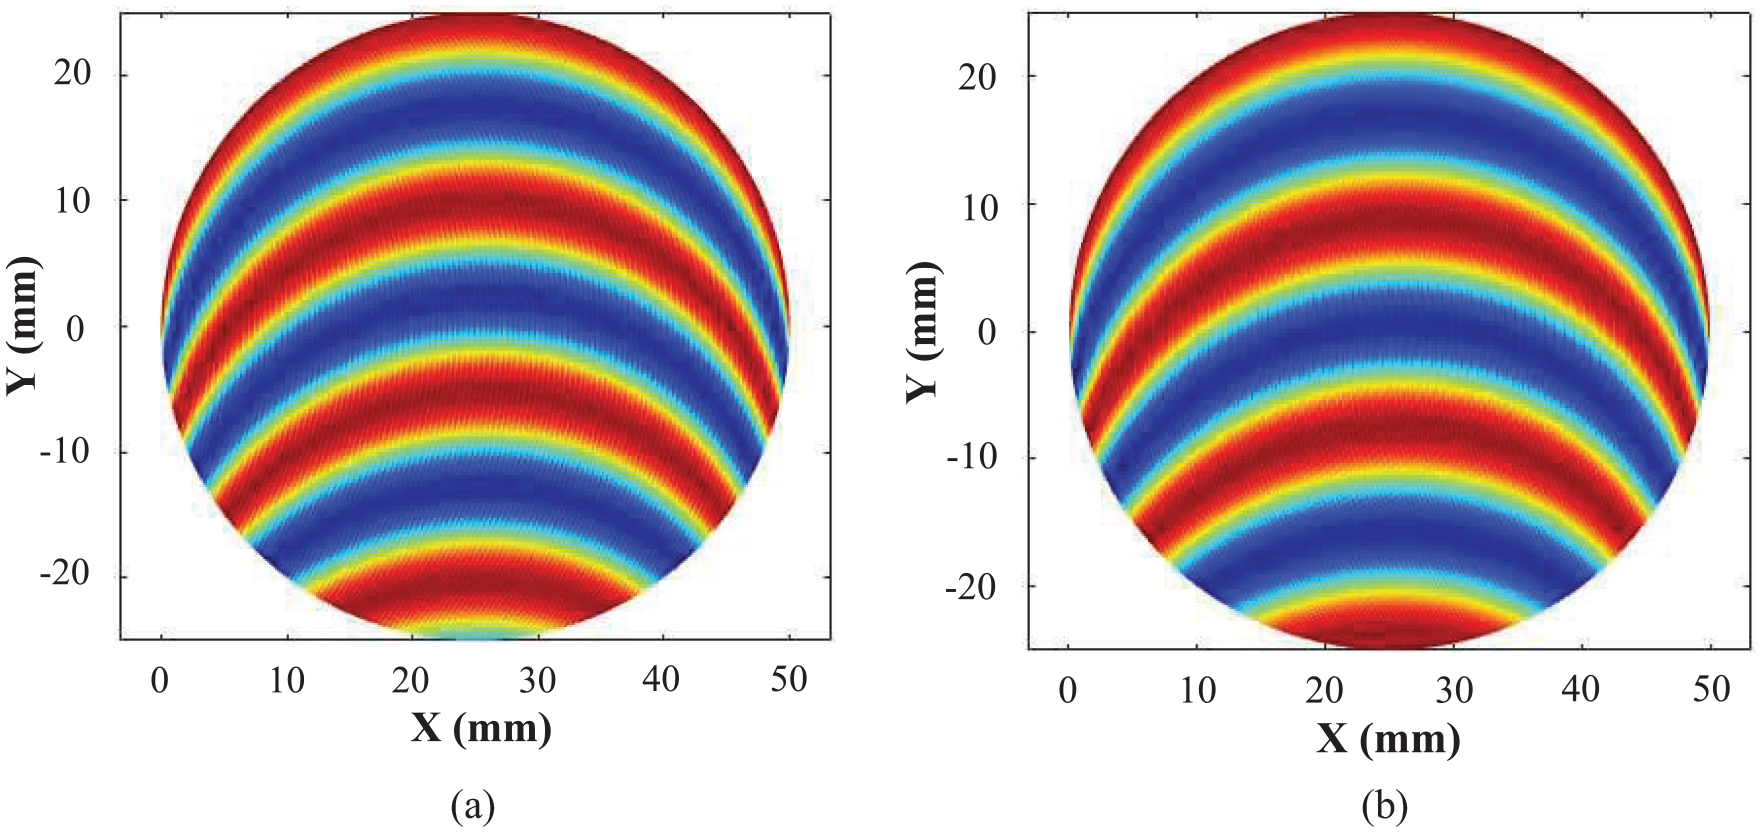
Simulation results of surface shape: (a) 260 r/min, 585 Hz; (b) 280 r/min, 585 Hz.
Three sets of cutting tests with different process parameters were carried out on the ultra-precision diamond fly-cutting machine. The test parameters are shown in Table 1.
Experimental cutting parameters.

The machining surface of the workpiece in three groups of cutting parameters was measured by interferometer. Figure 16 shows the surface shape of the plain copper parts after ultra-precision fly cutting under different cutting parameters. The peak and valley (PV) values of the surface shape were 129.8, 124.3, and 141.3 nm, respectively. On the whole, the surface shape appeared to be random and without fixed pattern characteristics. However, when this group of surface shapes was filtered at low frequency, the middle-frequency surface shape (see Figure 17) was observed to have many curved arc-lines along the cutting direction of the tool tip under different cutting parameters, which was consistent with the simulation results of the surface shape. As shown in Figure 17, the PV values of the errors of medium-frequency ripples corresponding to the three working conditions of A, B, and C were 24.8, 23.9, and 23.4 nm, respectively, which was consistent with the PV values of the tool tip vibration response curve in Figure 13 under the action of intermittent cutting force at 24.3 nm.
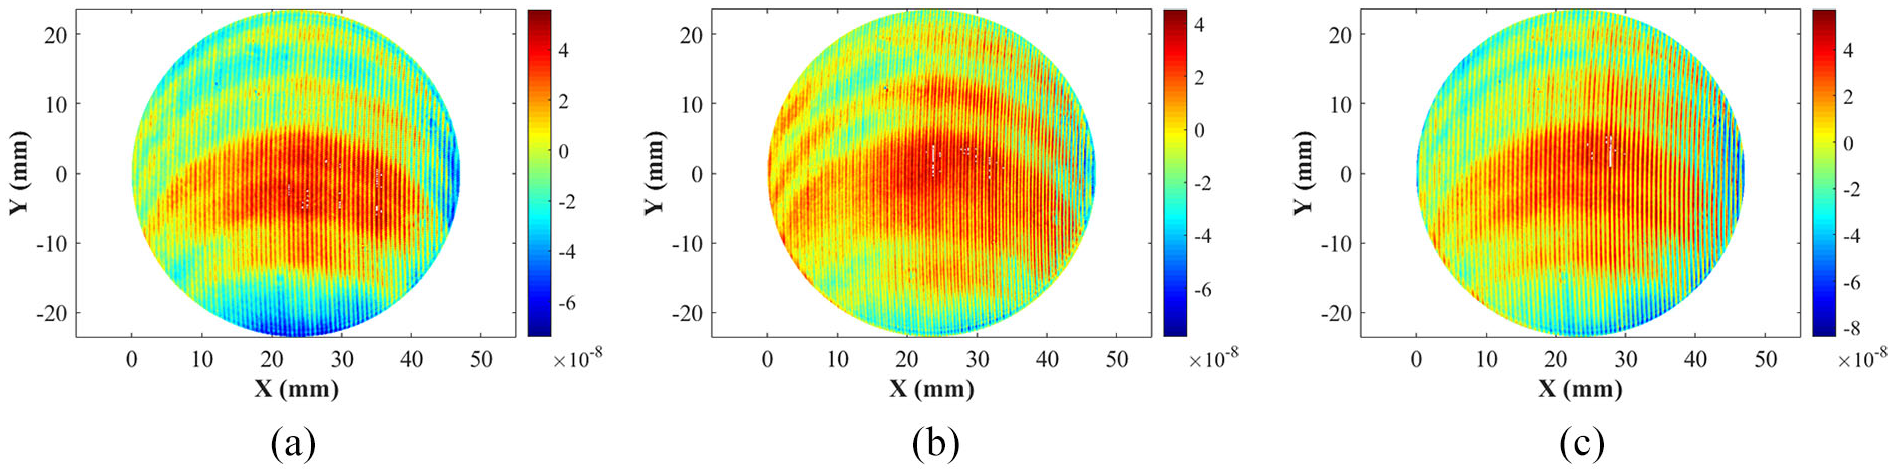
Measured surface shapes under different process parameters: (a) the cutting parameter is number A, (b) the cutting parameter is number B, and (c) the cutting parameter is number C.
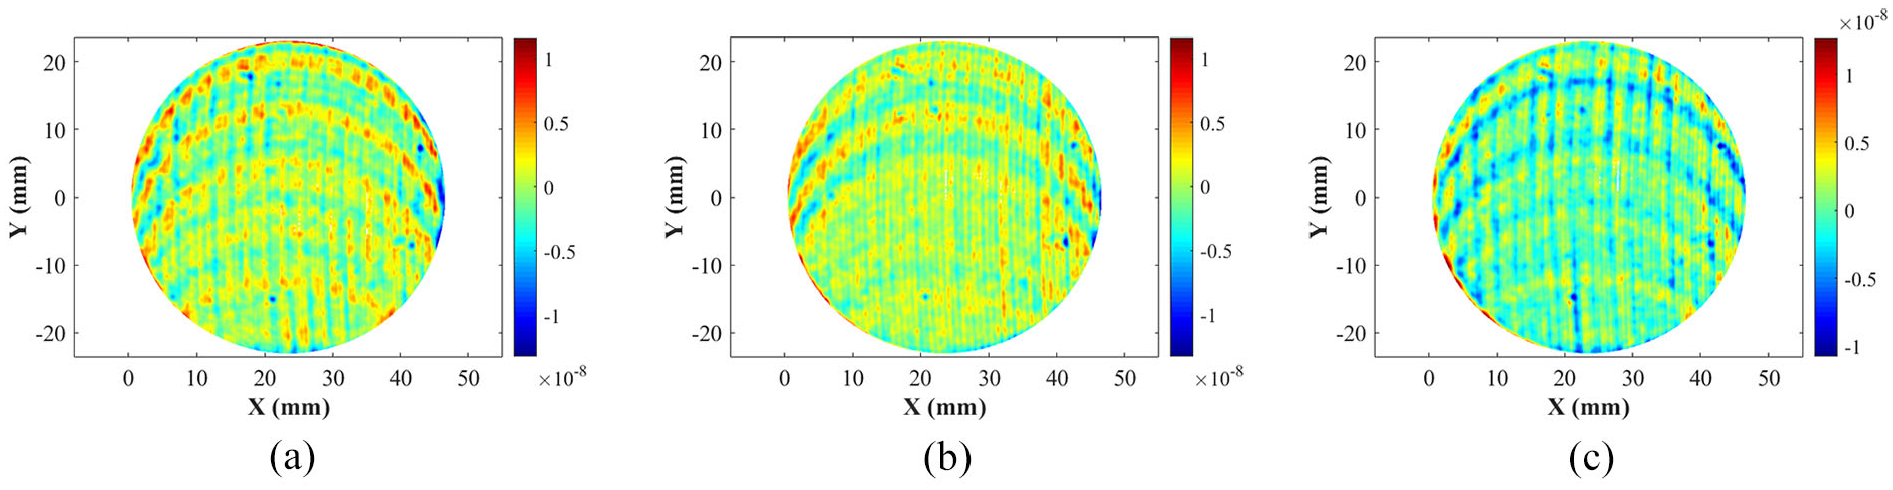
Surface shape after low-frequency filtering: (a) the cutting parameter is number A, (b) the cutting parameter is number B, and (c) the cutting parameter is number C.
Conclusion
In this article, a surface simulation model based on the interference effect of tool shapes on cutting profiles was proposed, and an accurate mapping relationship was established. Under the action of an intermittent cutting force, the arc shape characteristics of square and circular workpieces were found to be different, and the causes of arc characteristics were explained in detail. The main conclusions are drawn as follows:
Through simulation and experimental analysis, the spectrum waterfall diagram of a square workpiece showed as a vertical linear strip with equal spacing, but for a round workpiece, it was distributed in a rippled arc.
The essential reason for the phenomenon is that during the feeding process, the cutting distance of a single trajectory increases, the cutting time becomes longer, and then the discontinuous force input spectrum curve appears offset.
By changing the action time of the single track cutting force, the frequency spectrum waveform of the intermittent force can be adjusted so that the lowest point frequency of the amplitude–frequency diagram is equal to the natural frequency of the system dynamics, thus minimizing the output response.
Footnotes
Declaration of conflicting interests
The author(s) declared no potential conflicts of interest with respect to the research, authorship, and/or publication of this article.
Funding
The author(s) disclosed receipt of the following financial support for the research, authorship, and/or publication of this article: This work is supported by the Science Challenge Project (Grant No. JCKY2016212 A506-0107, JCKY2016212A506-0105).