
Abstract
Fast and accurate cutting force prediction is still one of the most complex problems and challenges in the machining research community. In this study, a modified finite element model is presented to predict cutting force and cutting length in turning operations of AISI 1018. Unlike the existing research, in which the mean friction coefficient μ was taken, a variable friction coefficient μ involving the sliding velocity between chip and tool is presented in this article. The sticking–sliding friction model is adopted, and the maximum limiting stress in sticking region is calculated by considering the thermal softening and normal stress distribution. Experiments have been performed for machining AISI 1018 using tungsten carbide tool, and simulation results have been compared to experiments. The simulation results of the modified finite element model have shown better outputs in predicting cutting force, tangential force, and tool–chip contact length on the rake face. The results of this article not only are meaningful to optimize tool design and cutting parameters but also can provide a clear understanding of contact behavior between tool rake face and chip.
Introduction
Mechanical loads, stress distribution, and stress gradients are some of the most important issues in machining. The cutting force and stress distribution can significantly affect the cutting tool life and surface integrity. Hence, the study of cutting force and cutting length on the rake face is of great significance for optimizing process parameters, reducing tool wear, and improving tool life. However, fast and accurate cutting force prediction is still one of the most complex problems and challenges in the machining research community.
During the prediction process of cutting force and contact length between the rake face and chip, the stress distribution is an important parameter that should be determined by analytic models, experiments, or numerical methods. In order to improve the accuracy of the prediction model, the stress distribution and contact length should be determined precisely.
The well-known model to solve problems of stress distributed and contact length was created by Lee and Shaffer 1 in 1951. The model was based on a slip-line cutting model, and the distributed stress on the tool rake face was assumed. According to the model, the contact length was treated as a function of the uncut chip thickness, the shear angle, and tool rake angle. Tay et al. 2 predicted the contact length for AISI 1061 with the model including the inclination between cutting force and shear plane, shear angle, and uncut thickness. Similarly, Oxley 3 modified Tay’s model by involving several material constants to predict contact length in machining low carbon steel. However, the constant parameters could only be known by experiments. Toropov and Ko 4 considered the influence of the stress distribution on the rake face of the tool–chip contact length. The shear stress near tool tip was treated to be 0, and the shear stress showed the parabolic-type distribution. 5 Good predicted results were obtained in machining A6061, copper, steel SM45C, and stainless steels. Unfortunately, in analytical models, the stress distribution should be assumed in advance and some prediction models still need the experimental data as input.6,7
In recent years, the finite element method (FEM) has become the main tool for simulating metal cutting process. First, FE modeling appeared in the early 1980s. During that time, more concentrations were focused on chip formation and its morphology. The models had been relied on Lagrangian formulation for non-steady and steady cutting process by Shirakashi and Usui, 8 Strenkowski and Carroll, 9 and later followed by Komvopoulos and Erpenbeck. 10 Then, the stress and strain in the chip formation process were investigated. Updated Lagrangian method had been offered to simulate the plastic strain and stress around the tool–chip contact zone in both continuous and segmented chip formation by Sekhon and Chenot, 11 Klocke et al., 12 and Baeker et al. 13 The constitutive model and friction model, which could capture the flow stress of the material under the different strains, strain rates, and temperatures, made it possible to evaluate cut temperature and tool wear in machining.14–16
Good assessments in predicting cutting force and chip morphology were obtained when the modified stress distribution and contact length of the tool–chip interface were input in the finite element model (FEM) directly.
17
However, it was time costly and complex to measure the pressure and tangential stress in the contact zone by existing experimental measures. While, the stress distribution and tool–chip contact length could be observed easily in the FEM. It turned to be that the selection of friction model affected the simulation results markedly. Özel
18
investigated the effects of friction conditions on tool–chip contact length by DEFORM-2D. In Özel’s work, the predicted contact length of FEM was less than the experimental results in conventional cutting speeds, but the predicted cutting force and thrust force were higher than the experimental results. One of the possible reasons that caused the error was the simplified friction model was taken in the simulation. In Özel’s assumptions, the normal stress and frictional stress were calculated as
In this article, contact length and stress distribution during turning operations of AISI 1018 are studied using analytic and numerical methods. First, the model of analytic cutting force is treated as a function of the stress distribution and contact length between tool and chip. To determine the parameters of contact area surface during machining, an initial FEM of orthogonal cutting is developed. In order to get more accurate results, the modified FEM is provided considering the variable friction coefficient and thermal softening effect on the rake face. The local friction coefficient changes according to the sliding velocity at the tool–chip interface, and the limiting maximum shear stress is calculated by involving thermal softening effect on the rake face. The results of normal stress and frictional stress distribution are obtained and used to calculate the cutting force and contact length using the analytic methods proposed in section “Analytic model of cutting force and contact length.” Experiments have been performed for machining AISI 1018 using tungsten carbide tool, and simulation results have been compared to experiments.
Analytic model of cutting force and contact length
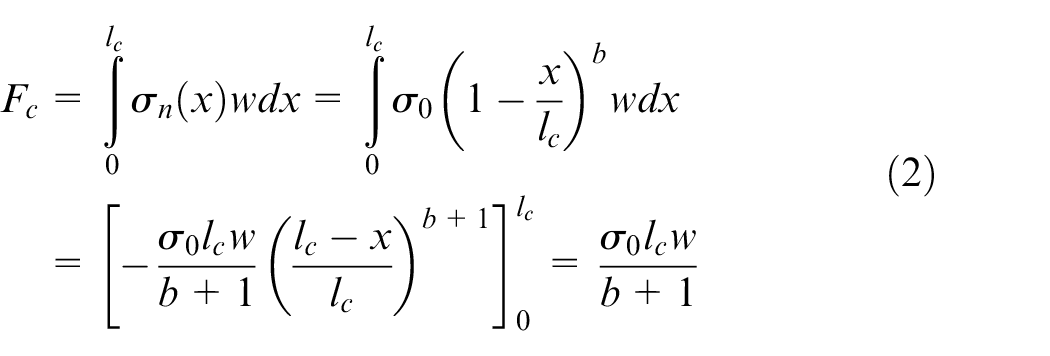
The normal stress distribution equation (1) was originally proposed by Zorev. 22 Experimental data showed that the normal stress distribution was not uniform, but a decreasing function of X on the tool–chip interface. It obeyed a power law relationship with distance from the cutting edge 23 as in shown Figure 1.
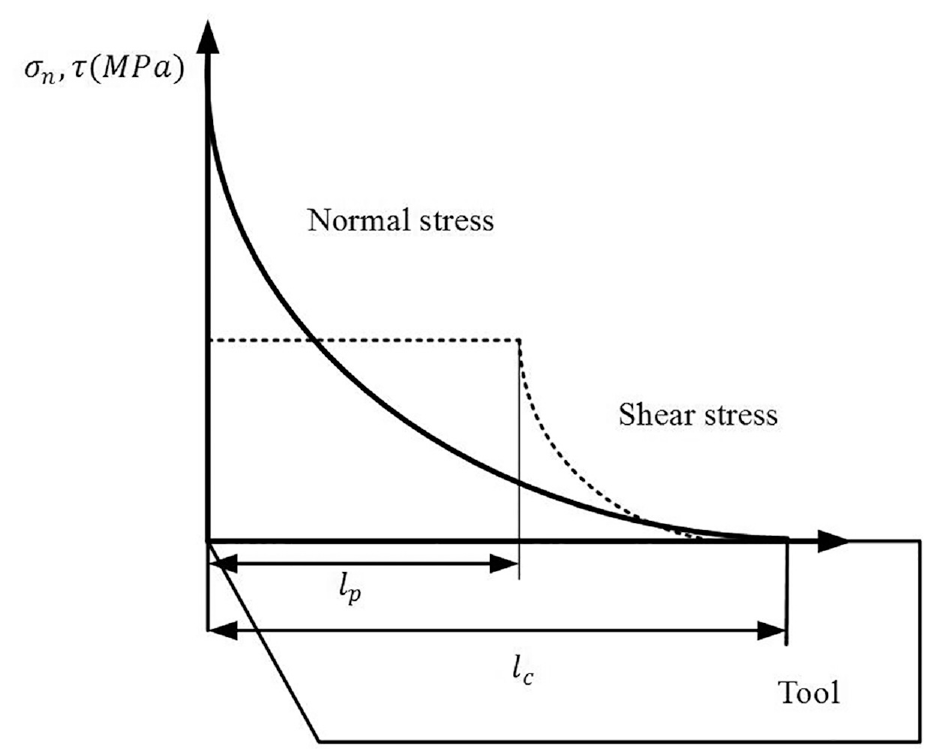
Normal and frictional stress distribution on the tool rake face.
The assumptions of Zorev’s model were shown as following: (1) the contact pressure between the chip and the tool on the rake face was represented by a dual-zone approach; and (2) the contact was divided into the sticking and the sliding friction region. In the first region, the contact condition was plastic due to the high normal pressure exerted on the tool, whereas in the second region, the contact was elastic, which can be represented by the sliding friction.
24
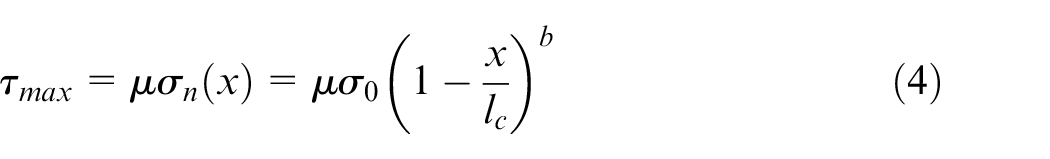
As shown in Figure 1, the normal stress
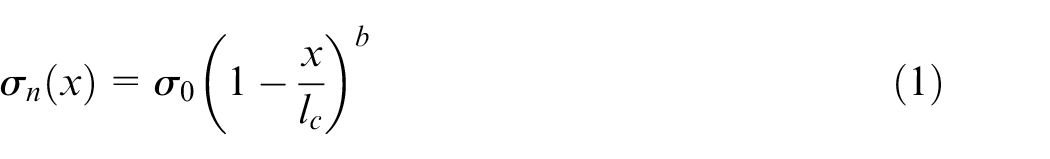
where x is the distance from tool tip, b is the power determining the parabolic variation along the interface,
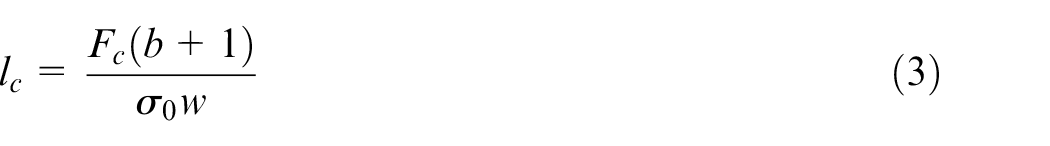
For a given uncut chip thickness, the cutting force is calculated as shown in equation (2)
So, lc can be expressed as shown in equation (3)
where
In Arrazola and Özel,
16
frictional stress was fully defined by normal stress and the coefficient of friction. In the sliding region along the tool–chip interface, stress followed Coulomb law
So, the sticking contact length
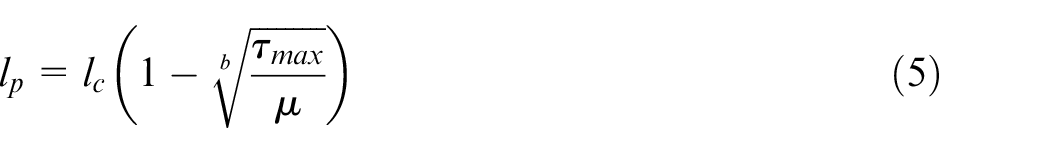
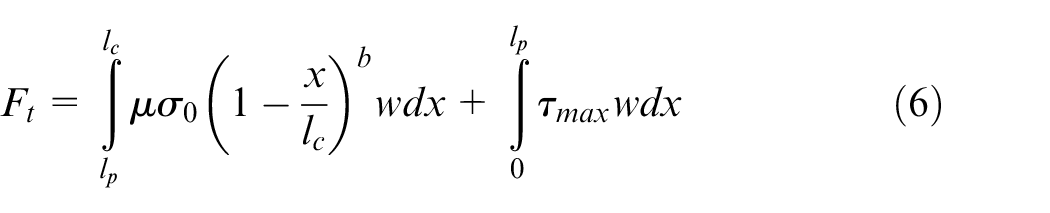
The total tangential force in both sticking and sliding regions could be calculated as
FEM and friction evolution
FEM and simulation process
The orthogonal cutting simulations used in this article are performed using ABAQUS software. ABAQUS is an explicit, nonlinear, FE code that could use the Lagrangian formulation to model complex material behavior in machining process. The clear advantage of the Lagrangian formulation is based on its excellent ability to simulate the formation of the chip from the incipient stages to steady-state cutting.24,25
Figure 2 illustrates the steps of simulation process. First, the initial finite model with friction coefficient 0.3 is used to generate the input parameters including normal stress, frictional stress, temperature, and sliding velocity on the rake face. Then, the input parameters combined with the modified friction model are used to modify the initial FEM. The modified friction model is consisted of the variable friction coefficient model and the thermal softening effect on the rake face. The variable friction coefficient model is generated as a function of sliding velocity measured by Philippon et al. 26 The shear stress follows the stick–slip friction model and the maximum limiting shear stress is calculated by involving the effect of thermal softening. Finally, the results of normal stress and frictional stress distribution are obtained and used to calculate the cutting force and contact length using equations (5) and (6).
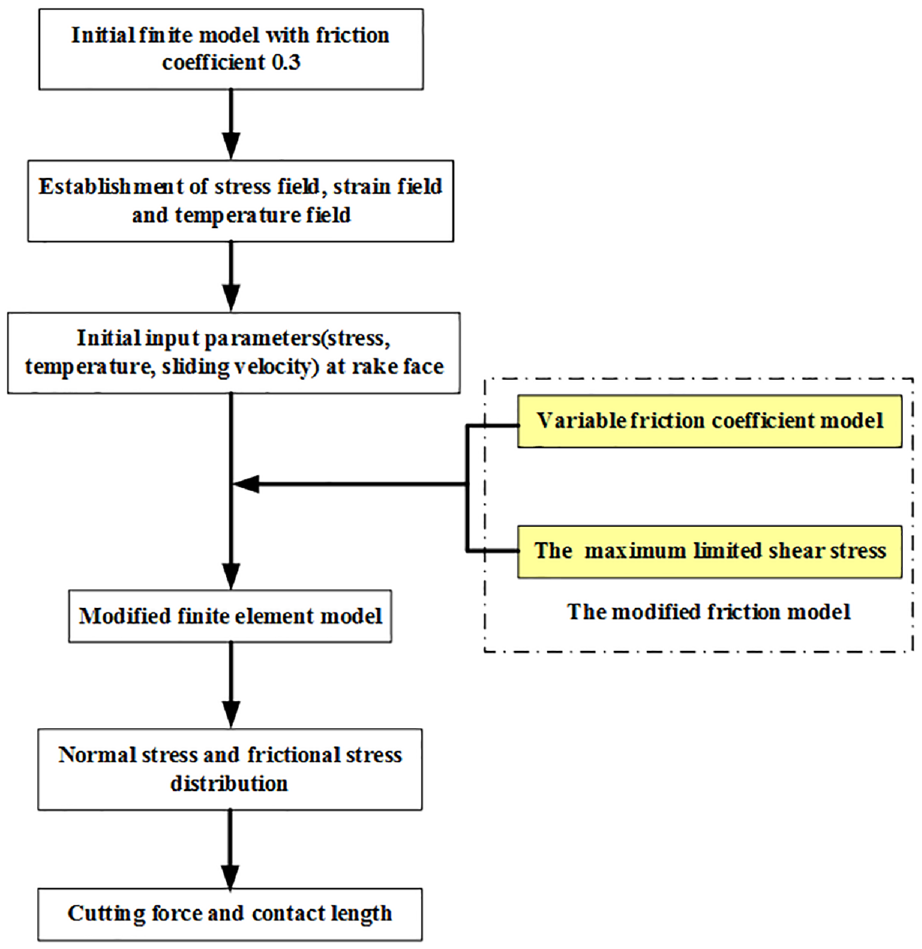
The steps of simulation process.
The tool and workpiece are both modeled with eight-node hexahedron element. The eight-node hexahedron element is a common option in cutting precious simulations.20,21 In comparison with the other element types such as tetrahedron or prism, the eight-node hexahedron element simulation could reach a satisfied result easily with less element numbers and consumption time. In this article, the element number of all model is 31234 and the number of nodes is 63081.
The present analysis is carried out in three-dimensional model. The width of cut is 2 mm and stays the same with the experimental parameters (explained in section “Experiment validation and analysis”). In comparison with the two-dimensional model, the three-dimensional model makes it possible to understand the process more in detail and to make more accurate predictions even for processes that are well represented by a plane model (such as orthogonal cutting). 20 Moreover, it allows to simulate more complex operations that need to be studied by a three-dimensional model (such as oblique cutting).23,24
The bottom of the workpiece is fixed in the x and y directions. To simulate cutting process, the tool is defined to have a constant velocity in the positive x direction. In order to measure the stress distribution on the rake face, the tool model is set with elastic-plasticity model. A representative FEM illustrating the undeformed mesh is shown in Figure 3.
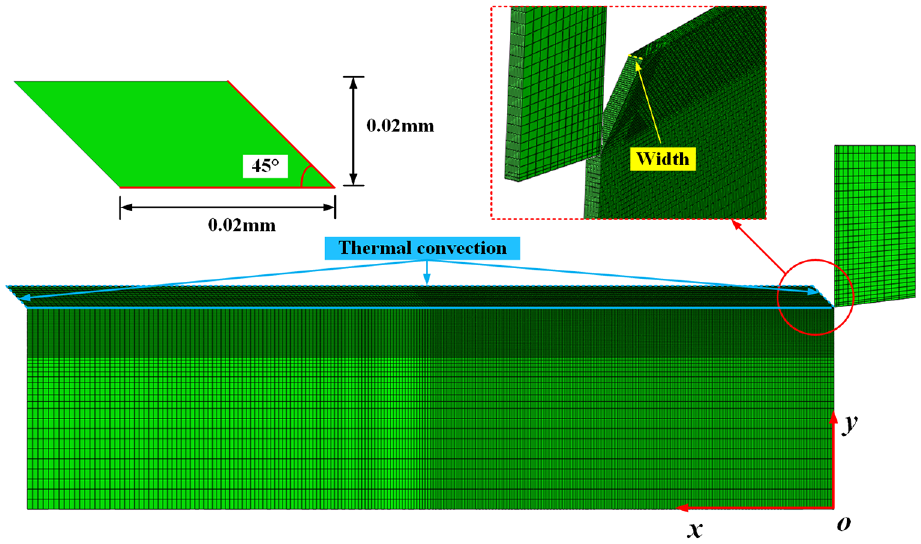
Undeformed mesh for FEA model.
Since the temperature would affect the chip thickness, the simulations considering thermal convection are modeled. The convection locations in FEM are illustrated in Figure 3. In the case of machining of AISI 1018 with a carbide tool, List
25
has shown that a value of 103 kW/m2°C for
Material constitutive model
In FEM analysis, it is necessary to select appropriate constitutive model and friction model, which affect the accuracy of predicted result. The constitutive model represents work material constitutive behavior under different strains, strain rates and temperatures. Johnson–Cook (J-C) model16,18,23,26 is the most common model in cutting simulation. The model could represent elastic, plastic, and thermo-mechanical behaviors of material deformation under different cutting processes
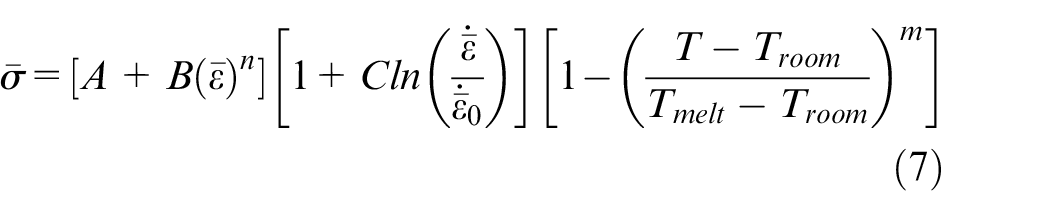
where A is the initial yield strength and
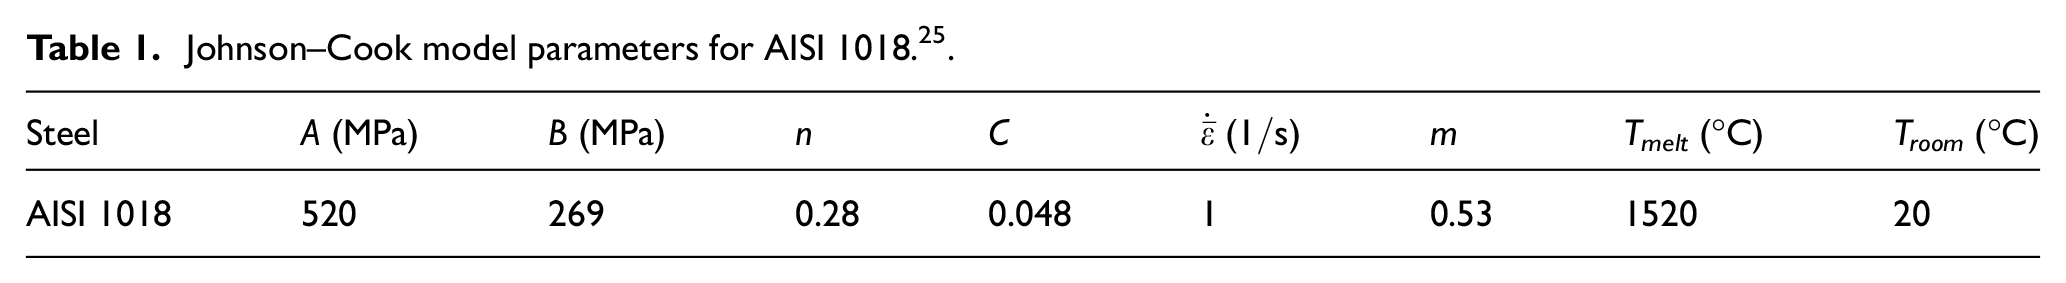
In this study, the simulations of machining AISI 1018 with several cutting conditions are investigated, and the model parameters are adapted from the literature 25 as given in Table 1. Unlike previous FEM works, the tool is treated with elastic-plasticity model. The damage of tool is ignored in this simulation. The material properties of AISI 1018 and uncoated cutting tool (K313) are summarized in Table 2.
Johnson–Cook model parameters for AISI 1018. 25
Material properties of AISI 1018 and cutting tool (K313) are input for FE model. 23
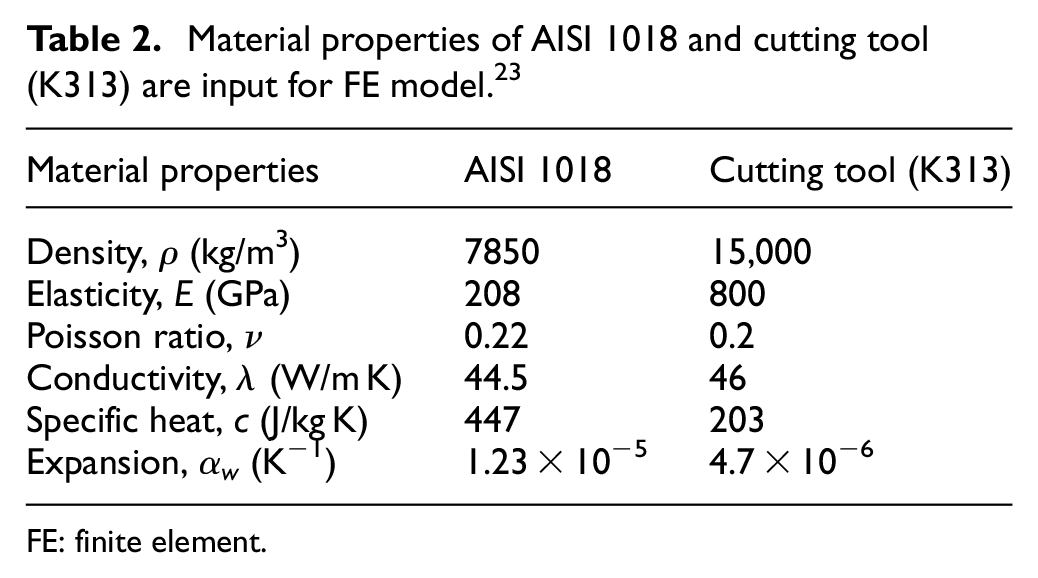
FE: finite element.
The friction evolution
The friction model definition
The stick–slip friction model was widely adopted by many researchers22,25,26 to define the friction properties at the tool–chip interface. The shear stress is fully defined by normal stress
In the plastic region characterized by a sticking friction with a plastic localization in the secondary shear zone (SSZ) near the tool tip, shear stress reached a maximum level

In the elastic region characterized by a sliding friction and a linear proportionality between normal and shear stress
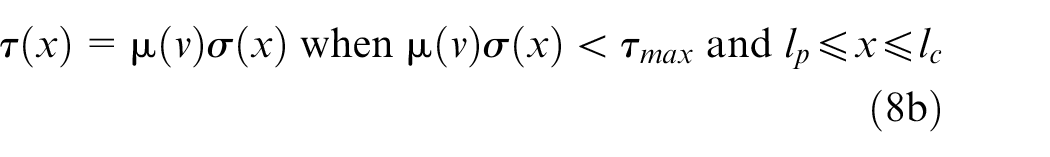
In this study, the friction coefficient
The variable friction model
The friction model had an important influence on the accuracy of simulation results. In early years, the mean coefficient was determined from normal force and tangential force measured in experiments
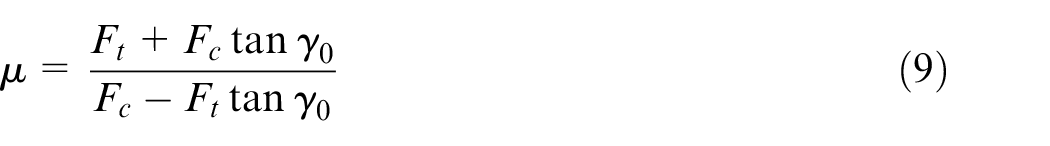
where
In recent years, the friction coefficient is considered as a function of contact pressure, sliding velocity at tool–chip interface, or shear angle.18,27,28 It is often difficult to obtain these frictional conditions, which depends on tool and work material pairs in metal cutting.29–31
In this study, friction coefficient

The maximum and minimum limiting for cutting parameters are chosen in such a way that the range of cutting data given in Figure 4 is fully covered. The regression diagnostics function in MATLAB is later used for identification of the coefficients in equation (10). According to the MATLAB results,
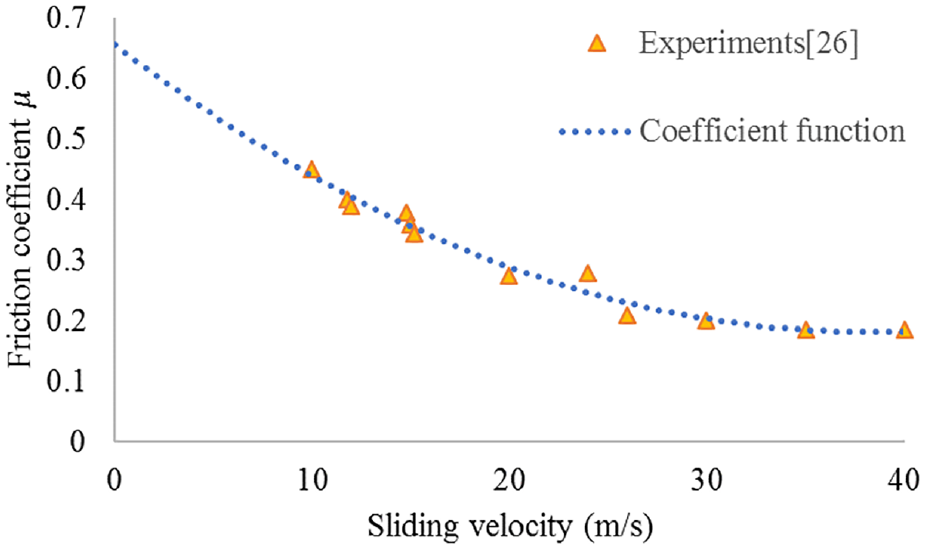
Dry friction coefficient μ for AISI 1018 sliding against uncoated carbide.
The limiting shear stress
As discussed above in equation (5), the maximum shear stress
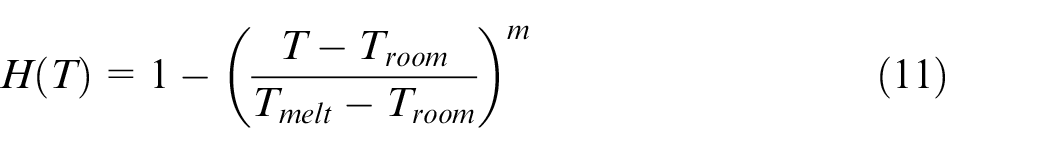
So, the maximum shear stress
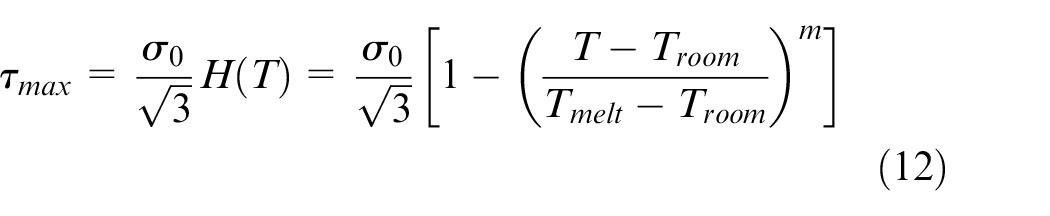
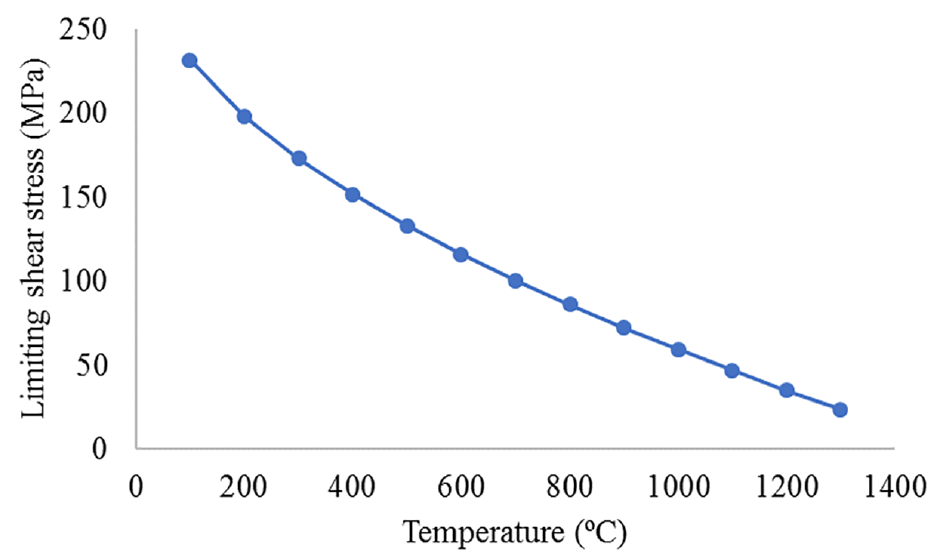
Evolution of limiting shear stress according to the temperature.
Experiment validation and analysis
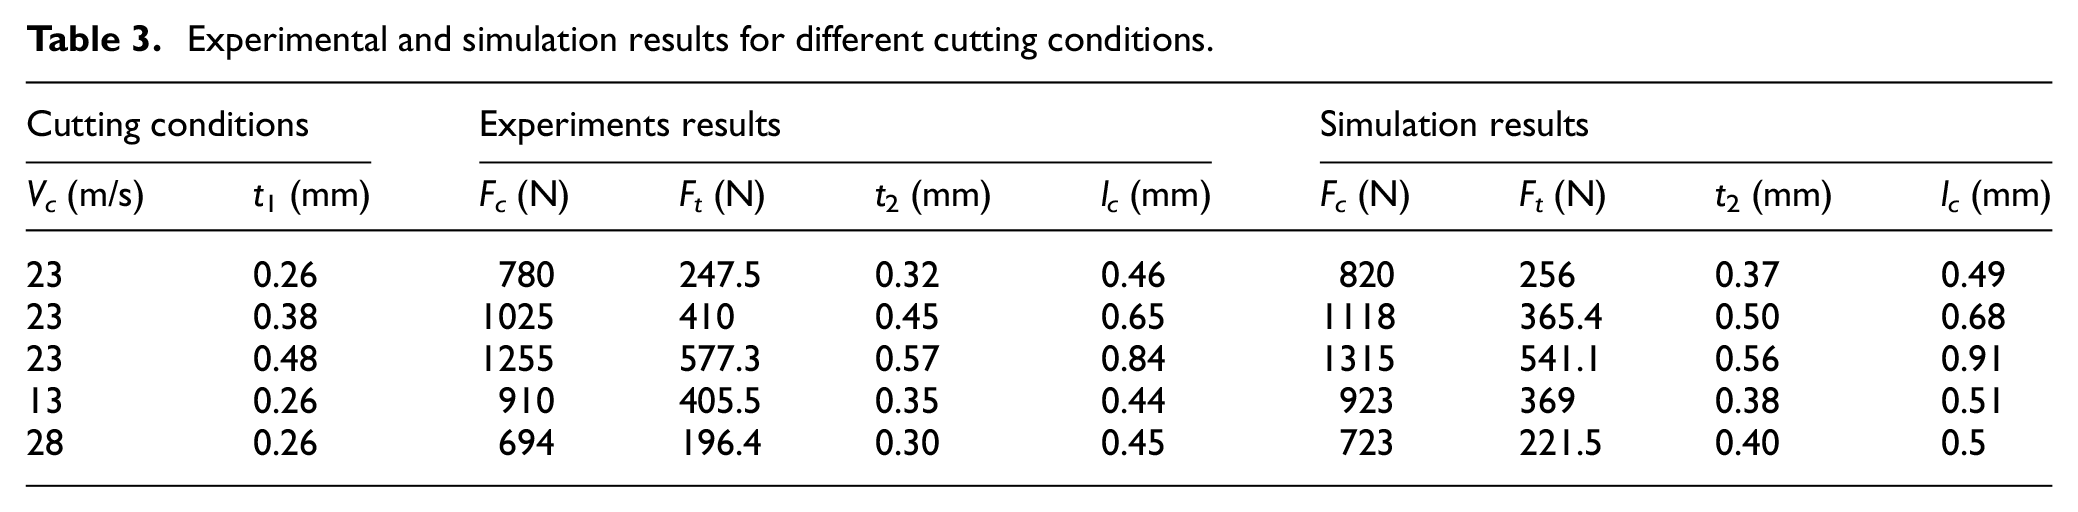
To validate the result of FEM, several cutting experiments are carried out, and the cutting conditions are show in Table 3. The machined material is AISI 1018 steel with different uncut chip thicknesses
Experimental and simulation results for different cutting conditions.
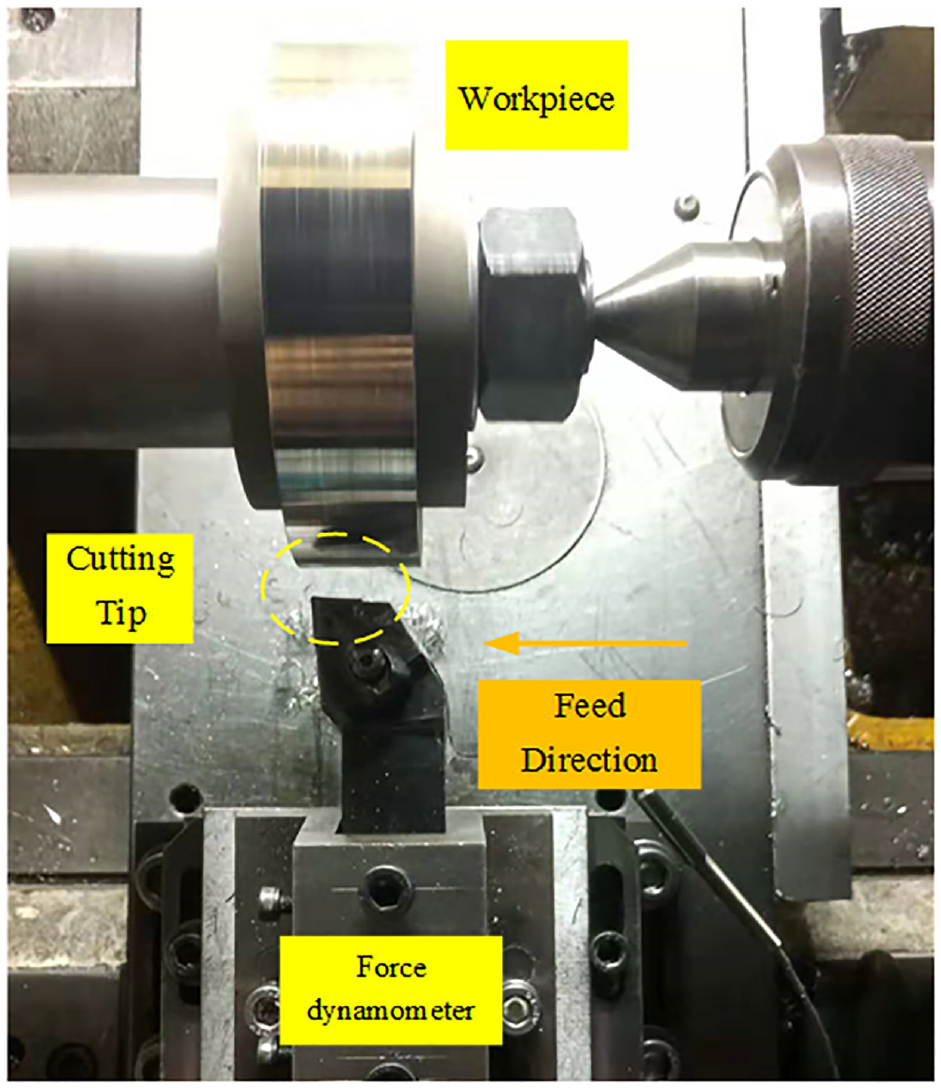
Experimental setup for orthogonal turning.
The FE simulation results are considered acceptable, since the maximum simulation error of cutting force is 4.1%, tangential force is 12.7%, and contact length is 11.1%. However, in this simulation, the chip thickness is still larger than the measured value. Similar results were observed by Laakso et al., 34 List, 25 Yang and Zhu, 35 and Choi et al. 30 The main reasons of error are the following: (1) the tool in FE simulation is modeled as an absolutely sharp rigid body, but in actual cutting process, as the cutting motion goes on, the tool is inevitably subjected to wear, so as to cause the less chip thickness;34,25 (2) the tool and machine tool produce vibrations, which can lead to some error, while FE simulation is carried out with ideal case;30,35 and (3) there is always an inherent error in testing system.
Simulation results and discussion
The stress distribution
The normal stress distribution obtained from simulation results is as shown in Figure 7. The maximum stress exists near the tool tip and that is where the tool damage happens. One reason why the maximum stress exists near the tool tip is partly related to workpiece plastic strain and the existing width of real shear plane which is usually considered to be a narrow one.16,18 High temperature and pressure lead to serious material deformation and distortion and that is where built-up-edge happens. In this zone, the contact is complicated and multiple physical contacts and chemical reactions can exist at the same time.
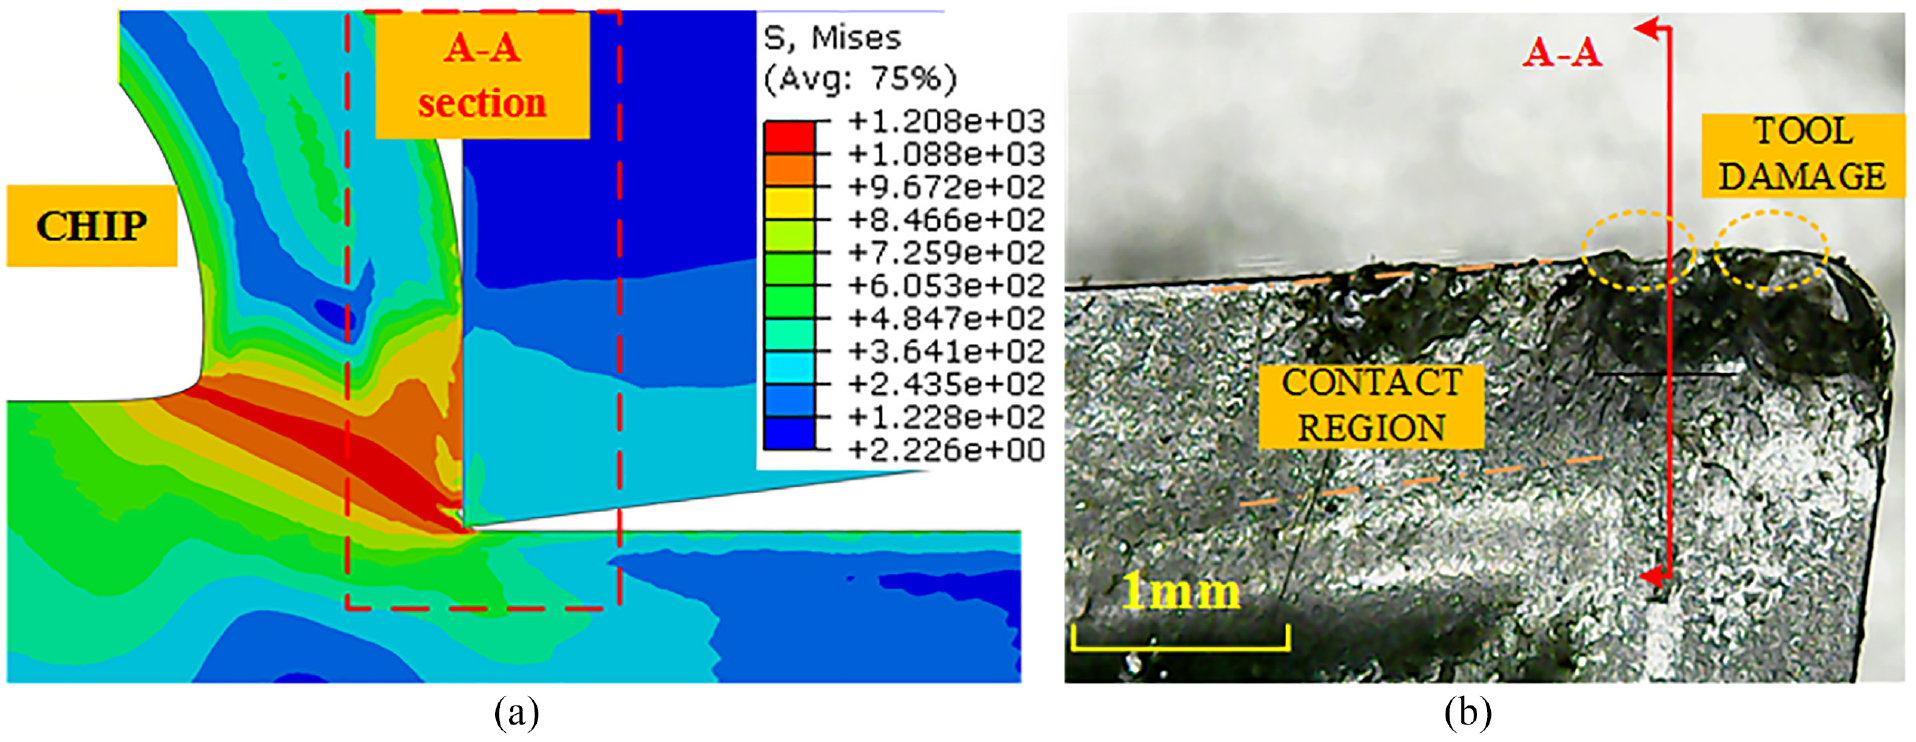
(a) The stress distribution for
The stress distribution is shown in Figure 8. Unlike Zorve’s model, the normal stress distribution is concave-down near cutting tip and tool–chip separated point. The curve displays elevated stresses near the tool tip and drops sharply within a feed distance. Then, a plateaued region appears and the stress declines to zero at tool–chip separated point. In Figure 8, Zorve’s stress curve is fitted by nodes stress data provided by FEM results (
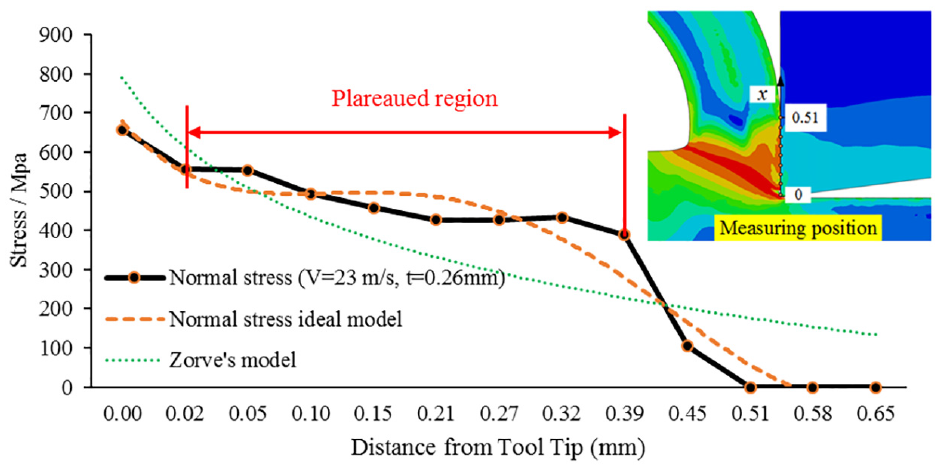
The stress distribution (
The stress distributions produced by the FEM in this article have similar shape with experimental measurements obtained by Buryta et al., 36 Childs, 37 and McClain et al. 38 Both McClain’s FEM results and Childs’ experimental measurements showed the maximum stresses near the tool tip, the plateaued region, and the sharp decline within a feed distance.
As shown in Figure 9, the uncut chip thickness has significant impact on the stress distribution. All stress curves have similar shapes, but the larger maximum stress is observed when the larger uncut chip thickness is selected. The length from the maximum stress to plateaued region is less than 0.02 mm when uncut chip thickness increases from 0.26 and 0.39 to 0.46 mm. The maximum stress declines from tool tip within a feed distance. It must be noted that the length of plateaued region increases when uncut chip thickness increases. When the value of uncut chip is 0.13 mm, the plateaued region vanishes.
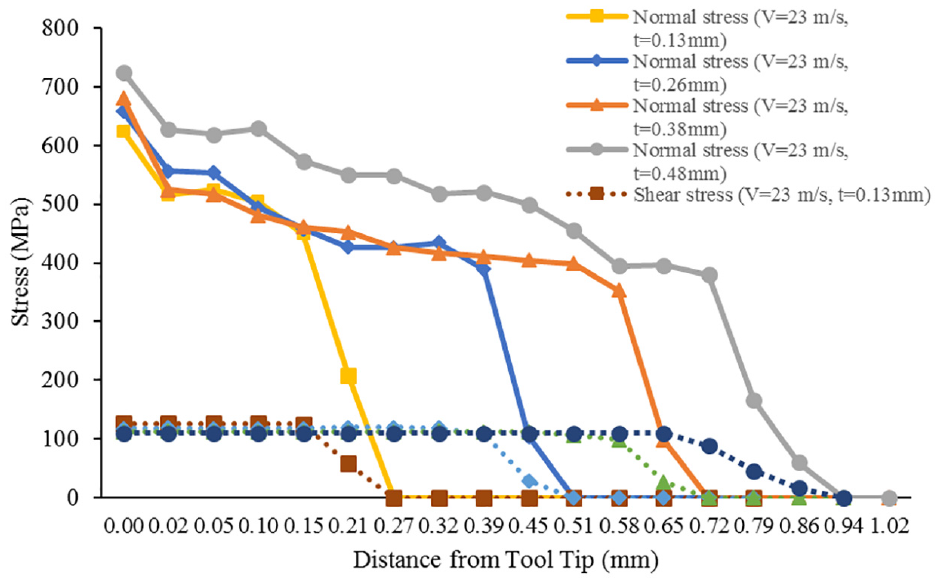
Normal and shear stress distribution with different uncut thicknesses.
The normal stress could be larger when larger uncut chip thickness was selected in many simulation and experiment results.21,39,40 Agmell et al. 39 investigated the influence of tool micro-geometry on stress distribution in turning operations of AISI 4140 and found that the maximum stress on tool increased from 290 to 530 MPa as the uncut chip thickness changed from 0.1 to 0.6 mm. Harzallah et al.’s 21 simulation results showed that the stress reached maximum as the chip thickness was the maximum. Lee et al. 40 showed the maximum stress of different materials during cutting, and the results supported the conclusion that the normal stress could be larger when larger uncut chip thickness was selected.
The cutting speed has no obvious difference on stress distribution as same as cutting force, chip thickness, and contact length for the velocity range of 13–28 m/s in Figure 10. That could be explained with constant model parameters. In J-C constitutive model,
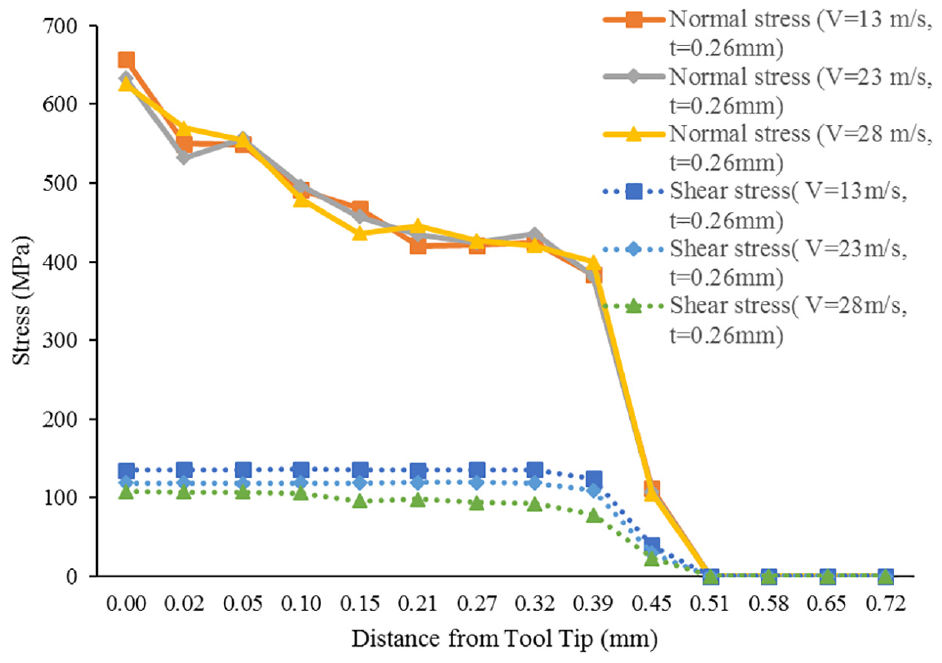
Normal and shear stress distribution with different cutting speeds.
Contact length
The contact length results are shown in Figure 11. The contact length prediction at different uncut chip thicknesses matched well with the experimental measurements. The contact area on rake face would have high cutting temperature and obviously tool wear. The increase in uncut chip thickness results in longer contact length.
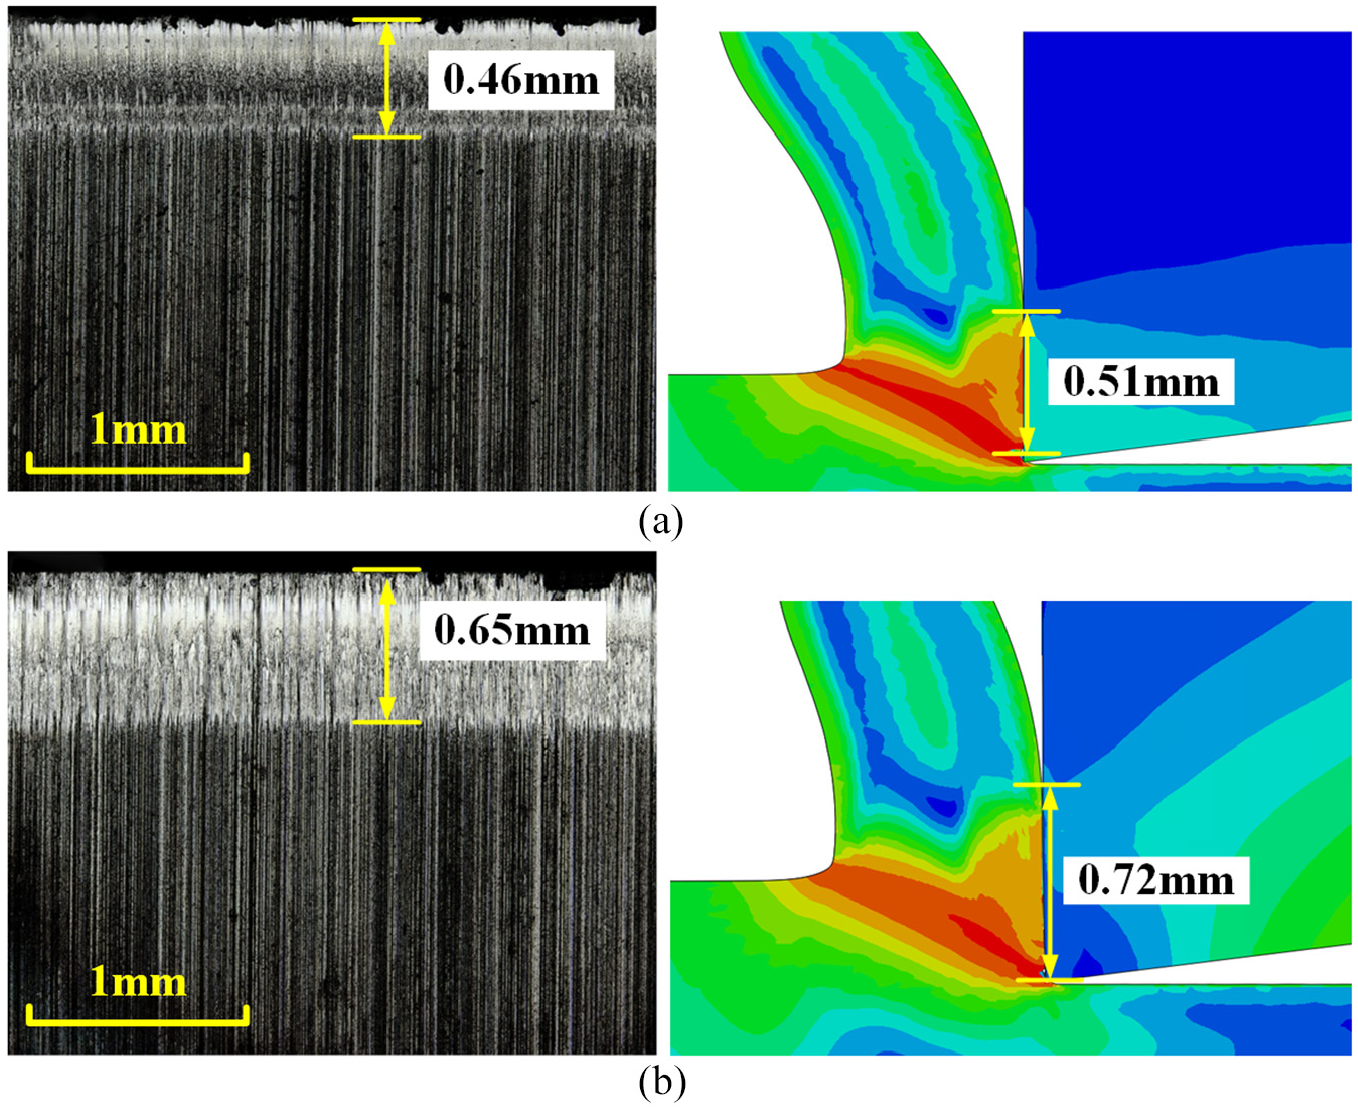
The contact length results with different uncut chip thicknesses: (a)
The contact length increases directly with increase in the uncut chip thickness. It is obvious to see that thicken chip is more difficult to curl than thinner one. The curling of chip and temperature influence the contact length explicitly. In Figure 12, the relation between contact length and uncut chip thickness is nearly linear. Since the chip thickness increases, total contact length increases, as well as the plateaued region length and sticking length. However, the percent of sticking to total contact length is lower as uncut chip thickness increases. The tangential force would increase less than twice as the uncut chip thickness is doubled, and high cutting speed would improve finished surface quality as obtained in experimental results.27,31
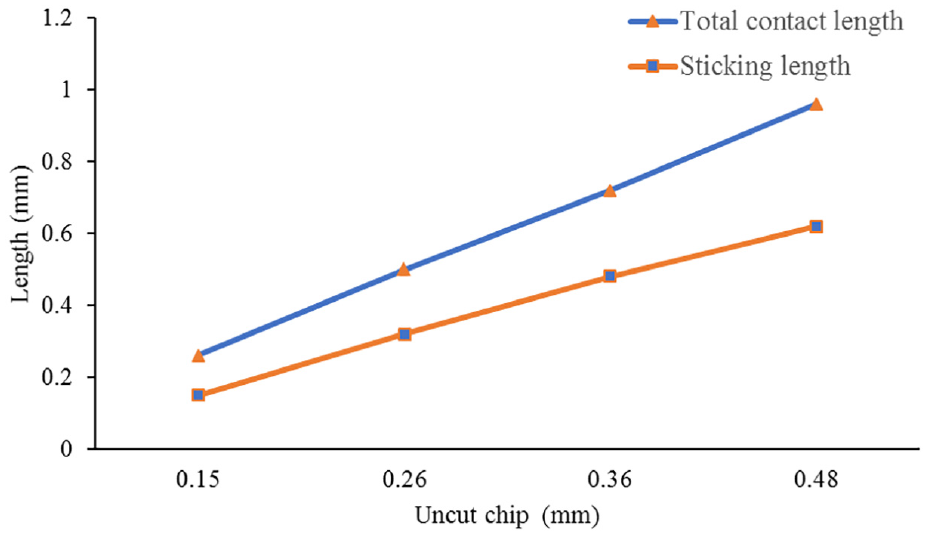
The influence of uncut chip thickness on contact length.
Cutting force
The FEM results with a mean friction coefficient
The cutting force
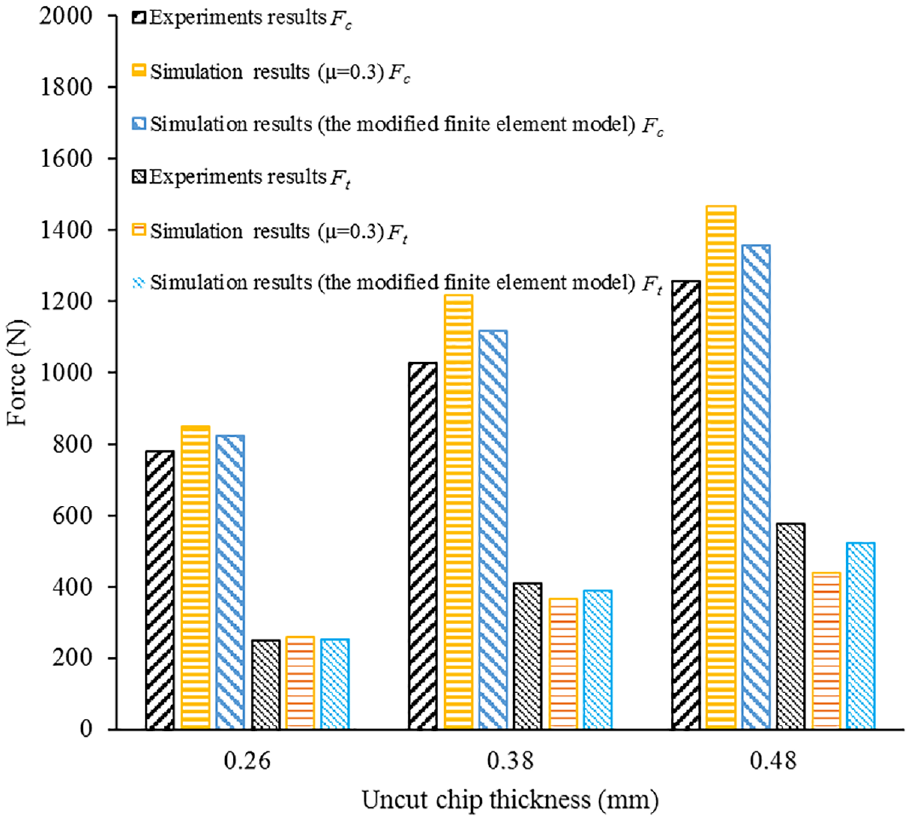
Cutting force and tangential force with different uncut chip thicknesses.
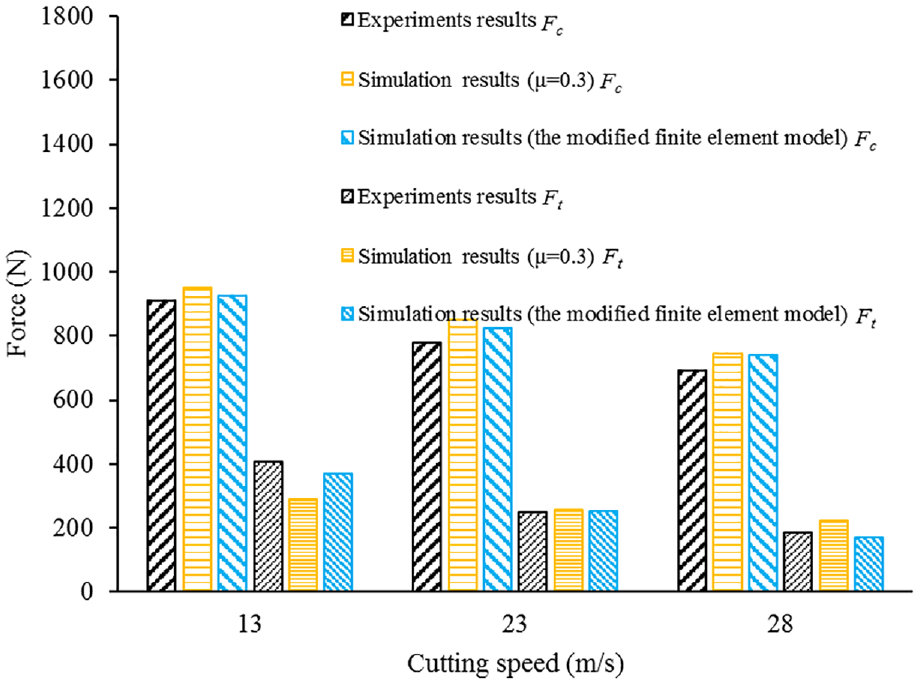
Cutting force and tangential force with different cutting speeds.
The change of friction coefficient would have a major impact on the tangential force
When cutting velocity of V = 13 m/s, the tangential force
Conclusion
In this article, a novel approach for predicting cutting force and contact length has been presented. Unlike the existing researches, a modified FEM is presented involving the variable friction coefficient model and the effect of thermal softening. To validate this numerical approach, the experimental results have also been presented. The main conclusions can be drawn as follows:
Unlike Zorve’s model, the normal stress distribution shows the maximum stresses near the tool tip, the plateaued region, and the sharp decline within a feed distance. The maximum stress exists near the tool tip where the tool damage happens.
The contact length prediction under different uncut chip thicknesses matched well with the experimental measurements. The increase in uncut chip thickness would lead to longer contact lengths.
In comparison with the experimental results, all the values of cutting force
The local friction coefficient decreases obviously when the sliding velocity changes from 0 to 28 m/s and the modified FEM could be a better choice in predicting cutting force and tangential force particularly when the cutting speed is changing in cutting process.
The research and application of the proposed methodology for stress distribution and cutting force will promote the development of tool design and be useful in understanding contact behavior between tool rake face and chip. Further application will include representing cutting process of different materials, predicting cutting temperature and tool wear, and developing processing technology in industry.
Further research will focus on improvements for getting better simulation results. For the variable friction model proposed in this article, the friction coefficient is only considered as a function of sliding velocity. In further research, the friction coefficient as a function of contact pressure, temperature, sliding velocity, and shear angle should be created. Moreover, the sticking zone may have different friction models to the sliding zone. Different friction models should be set into different contact regions for further simulation.
Footnotes
Declaration of conflicting interests
The author(s) declared no potential conflicts of interest with respect to the research, authorship, and/or publication of this article.
Funding
The author(s) disclosed receipt of the following financial support for the research, authorship, and/or publication of this article: This research was supported by the National Natural Science Foundation of China (51975334), Key R&D Project of Shandong Province (2018GGX103005 and 2019JMRH0407), and the Fundamental Research Funds of Shandong University.