
Abstract
In this article, a data-driven approach is applied to develop a health monitoring and diagnosis framework for a fused deposition modeling process based on a machine learning algorithm. For the data-driven approach, three accelerometers, an acoustic emission sensor, and three thermocouples are installed, and associated data are collected from those sensors. The collected data are processed to obtain root mean square values, and they are used for constructing health monitoring and diagnosis models for the fused deposition modeling process based on a support vector machine algorithm, which is one of machine learning algorithms. Among various root mean square values, those of acceleration data from the frame were most effective for diagnosing health states of the fused deposition modeling process with the non-linear support vector machine–based model.
Keywords
Introduction
Additive manufacturing (AM) technology, also referred to as three-dimensional (3D) printing technology, has recently regained popularity for an effective production method of personalized parts and components having a complex geometry.1,2 With AM technology, 3D parts can be produced directly from a computer-aided design (CAD) model by a layer-by-layer manner. 3 A variety of AM techniques have been developed based on different operating principles such as photo polymerization, sheet lamination, material jetting, material extrusion, powder bed fusion, binder jetting, and directed energy deposition. 4 Among them, fused deposition modeling (FDM) which is based on a material extrusion principle has been widely used since it can produce complex 3D parts with various materials cheaply. 5 In the FDM process, a thermoplastic filament is continuously provided and heated in an extruder head. Then, molten plastic material is pushed out of a nozzle of the head and deposited on the workpiece that is located on a build plate. In order to manufacture a 3D printed shape by depositing the molten plastic material, the head’s two-dimensional lateral motion is realized by a computer-controlled positioning system.
Concerning the FDM process, there have been a number of researches to improve its part quality and accuracy. Ghorpade et al. 6 presented the swarm intelligence approach to obtain optimal orientation of the FDM 3D printed part to reduce the volumetric errors and to improve the surface quality. A finite element (FE) analysis has also been applied to simulate the mechanical and thermal phenomena in the FDM by Zhang and Chou. 7 Their model could also simulate residual stresses and part distortions during the FDM process. They also conducted the parametric study to evaluate the effects of the deposition parameters on residual stresses and part distortions with their FE model in the FDM process. 8 Sood et al. 9 applied a gray Taguchi method to conduct the parametric study for the effects of the FDM process parameters such as layer thickness, part build orientation, raster angle, air gap, and raster width on dimensional accuracy of the parts. They also obtained the optimal levels of each parameter to maximize the dimensional accuracy and applied artificial neural network (ANN) approach to predict overall dimensional accuracy. More recently, Griffiths et al. 10 used a design-of-experiments approach to optimize the tensile and bending properties of the materials in the FDM process by taking into consideration the production time and material efficiency. Garg et al. 11 studied the effect of raster angle on surface roughness and mechanical properties of FDM parts. In their study, it was found that the 0o raster angle and deposition direction along the specimen length could result in better mechanical strength and surface quality. Lovo et al. 12 proposed a method to determine the optimal deposition orientation to maximize the tensile strength of 3D truss-like structures that were fabricated by the FDM process.
As described above, the parametric analyses and optimization have been attempted to characterize the FDM process and to enhance the 3D printed part quality through a number of experiments. In addition, the FE model and ANN model were also developed for the above-mentioned purpose.
Meanwhile, with advancement of sensor network and data processing techniques, there have been some researches on prognostics and health management (PHM) for the FDM process. Among them, Yoon et al. 13 used signals collected by acoustic emission (AE) and piezoelectric strain sensors for a fault detection and quality control of the FDM 3D printer. Under consideration of the faulty driving belt, they processed the collected signals to obtain the root mean square (RMS) values to determine either healthy or faulty state of the belt. Rao et al. 14 applied a non-parametric Bayesian Dirichlet process (DP) mixture model and an evidence theory with the signals collected from installed thermocouples, accelerometers, and a miniature video borescope to detect the fused filament fabrication (FFF) process drifts. In addition, the online method detecting FDM process failures was proposed by Wu et al. 15 by using an AE sensor. In their research, the collected AE signals were processed to obtain their time and frequency features, and those features were used for classifying health states of the FDM process via a K-means clustering algorithm.
After reviewing several previous researches on PHM for the FDM process, various failure modes of the FDM components, which could have a significant influence on the part quality and accuracy, were considered. In this context, a leveling state of the build plate in the FDM 3D printer is under consideration in this article. The build plate in the FDM 3D printer is continuously lowered to deposit a next layer over previous one. In this case, it is generally known that an uneven leveling of the build plate may result in a significant degradation of 3D printed part quality. Therefore, it is necessary to properly monitor a leveling state of the build plate for quality control.
Therefore, in this article, an online monitoring and diagnosis framework to detect uneven leveling of the bed of the build plate during the FDM process is studied based on a data-driven approach by using data which are collected from accelerometers and an AE sensor. After collecting data from the above-mentioned sensors under healthy and faulty states, they are processed to obtain a critical feature such as the RMS value. Those RMS values are input parameters for the model detecting uneven leveling of the bed during the FDM process. This model is developed based on a support vector machine (SVM) algorithm, which is one of the representative machine learning algorithms. A hold-out cross-validation approach is also applied to enhance fault detection accuracy, and the model is validated by using the experimental data.
Experimental setup
FDM 3D printing process monitoring system
As can be seen in Figure 1, the FDM 3D printer (Ultimaker 2+; Ultimaker) was used for a series of 3D printing experiments using a polylactic acid (PLA) filament. In the 3D printer, various sensors were attached to collect the signals. Among those sensors, three accelerators (353B03; PCB) were installed on the frame, the nozzle head case, and the bed, respectively, and an AE sensor (R45; Physical Acoustics) was installed on the top of the frame and linked to a preamplifier (2/4/6 preamplifier; Physical Acoustics). The signals from the above-mentioned sensors were captured by a dynamic signal acquisition module (9234; NI) having a 24-bit resolution and a maximum sampling rate of 51.2 kS/s.
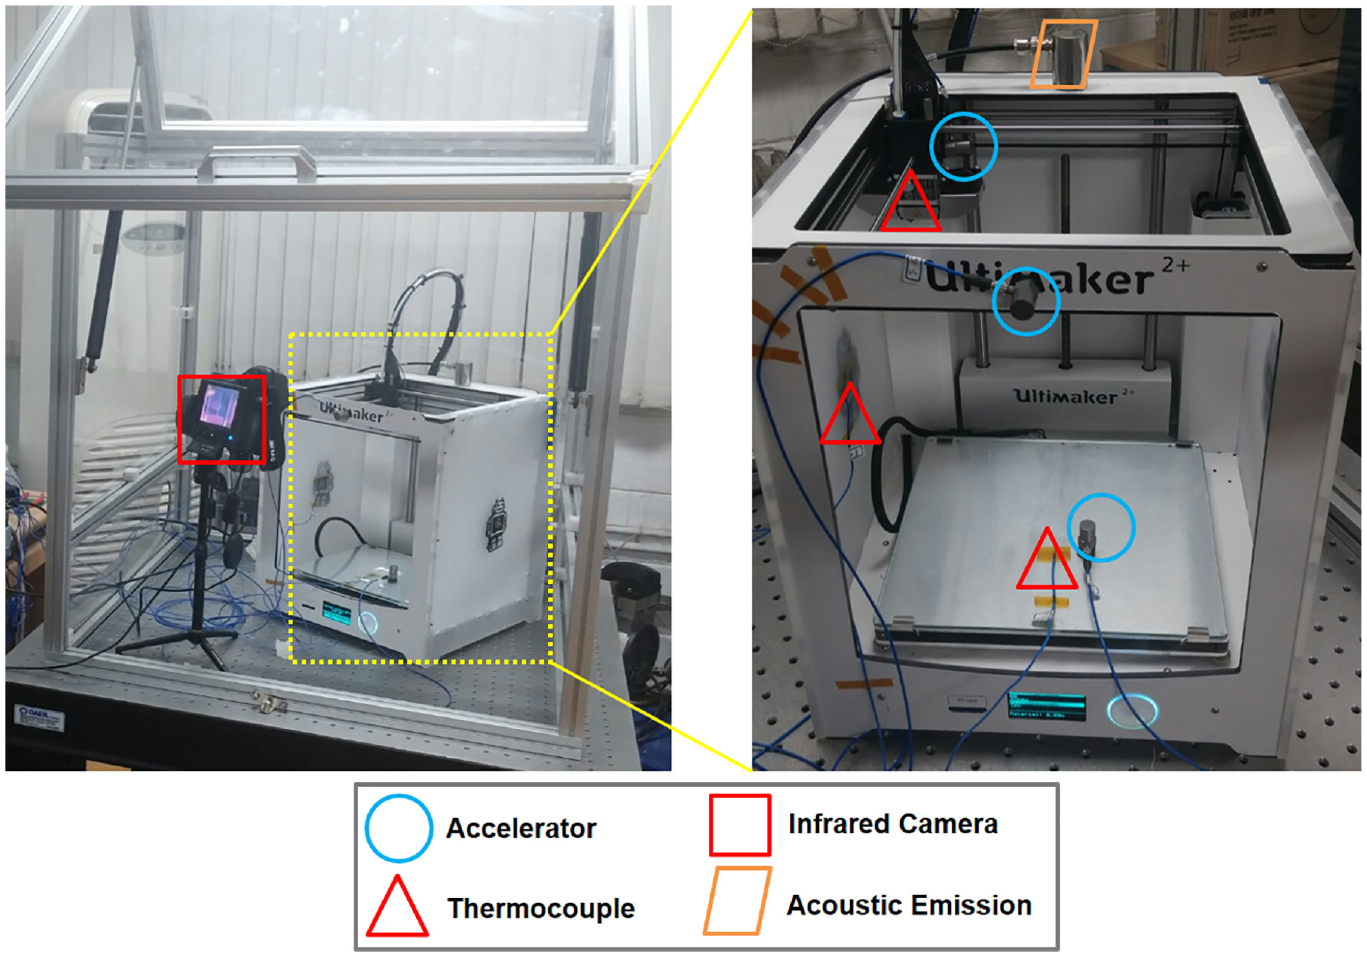
Photographs of the FDM 3D printing process monitoring system.
In addition, three thermocouples (K-type) were installed at the nozzle head case and on the left wall and the bed, respectively. They collected the temperature signals by using a data acquisition module (9213; NI), which had a resolution of 24 bits and a maximum sampling rate of 75 S/s. An infrared camera (T430sc; FLIR) was also set up in front of the 3D printer to monitor temperatures of the nozzle head and the layers of the 3D printed part. For the camera, a noise-equivalent temperature difference (NETD) and a frame rate were up to 0.03 °C and 30 Hz, respectively.
In the experiments, standard micro-specimens by ASTM D1708 were fabricated in the 3D printer, as shown schematically in Figure 2. The detailed experimental conditions are summarized in Table 1.
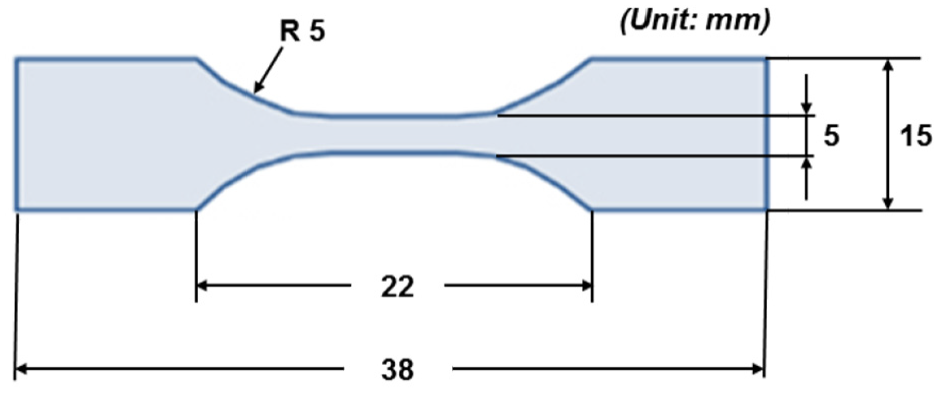
Schematic view of the standard micro-specimen.
Experimental conditions.
FDM: fused deposition modeling; PLA: polylactic acid.
Experimental design for faulty process—bed leveling fault
In FDM 3D printing process, it is important that the first layer should stick well to the bed of the build plate. In general, when a gap between the nozzle and the bed is too large, a printed part would not properly stick to the bed. However, when the nozzle is too close to the bed, it may disturb a smooth provision of a filament. In both cases, the first layer cannot be in a good condition, which leads to a poor adhesion problem. Therefore, a gap between the nozzle and the bed of the build plate should be precisely controlled during the FDM process. In this context, a proper leveling of the bed to which the build plate is assembled is of much importance to maintain a constant gap and, as a result, to produce a 3D printed part of good quality.
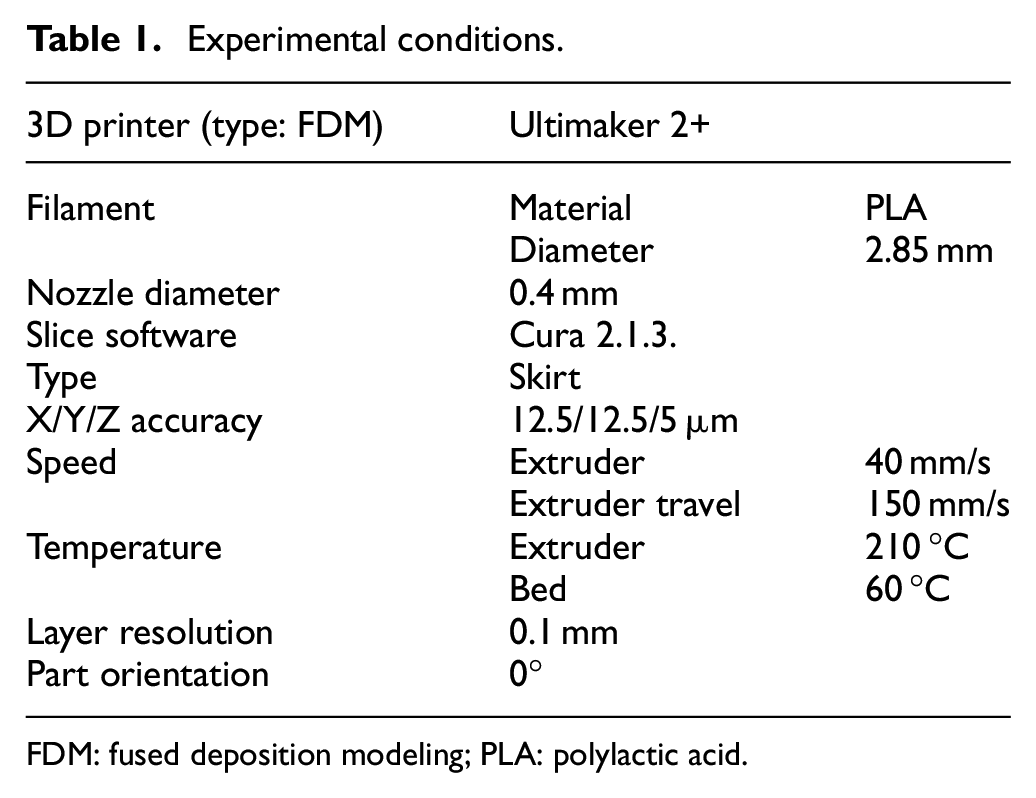
In this research, an uneven bed leveling was realized by using two kinds of clearance gauges which had a thickness of 0.08 and 0.80 mm, respectively. As can be seen in Figure 3(a), the bed was evenly leveled by using the gauge of 0.08 mm, and the uniform gap distance (0.08 mm) for all three locations was obtained. This condition represented a healthy state. Meanwhile, as can be seen in Figure 3(b), the gauge with a thickness of 0.8 mm was used for the location 3, and the gauges with 0.08 mm were used for the locations 1 and 2, respectively. Thus, the gap at location 3 was larger than other two locations, and as a result, an uneven leveling of the bed was realized, which is a faulty state of the bed leveling.
Schematic diagrams for healthy and faulty states by considering even and uneven leveling of the bed: (a) healthy state and (b) faulty state.
Under the healthy and faulty states described in the above paragraph, the FDM 3D printing experiments were carried out. In Figure 4, the photographs of 3D-printed specimens in healthy and faulty states are given. In the healthy state, as can be seen in Figure 4(a), the specimen was produced well with a good dimensional quality. However, as shown in Figure 4(b), the 3D-printed specimen under the faulty state had a severely degraded dimensional quality with significant warpage, twisted shifting layers, and bad adhesion.
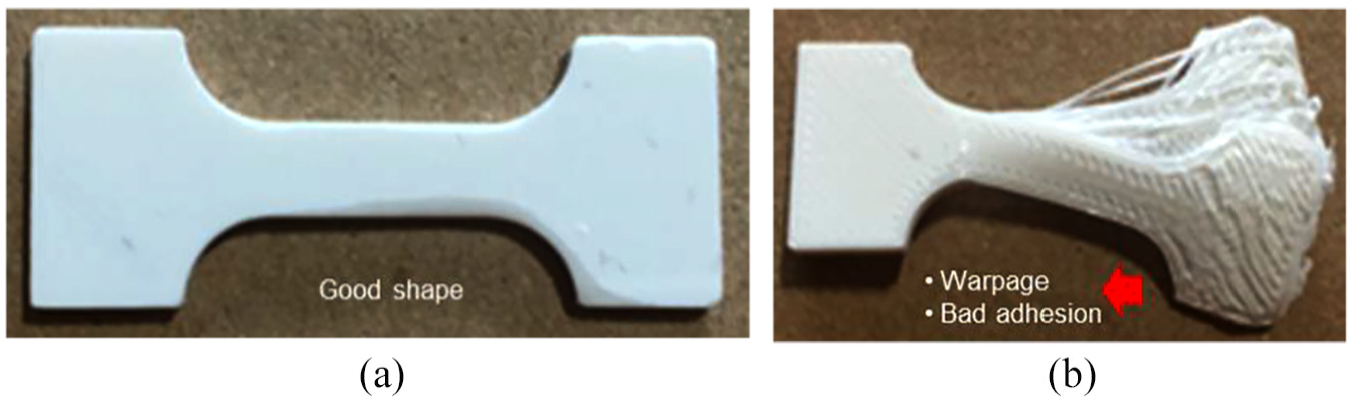
Photographs of the 3D printed specimens: (a) healthy state and (b) faulty state.
Data collection and signal processing
Acceleration signal processing
The acceleration signals were collected from three accelerometers which were installed on the extruder head, build plate, and upper frame in the FDM 3D printer, which are shown in Figure 1. A sensitivity and a frequency range of the accelerometer were 10 mV/g and 1–7 kHz, respectively. Figure 5 shows the time-domain raw data collected from three accelerometers in the healthy state. Meanwhile, the acceleration data collected in the faulty state are given in Figure 6. The total cycle time to finish a single 3D-printed specimen was 480 s, and the cycle time to finish one layer was different by each layer. For instance, it took 56 s to finish the first layer and 40 s for finishing the second one. From the 3rd to the 15th layer, the time duration to finish each layer was 30 s.
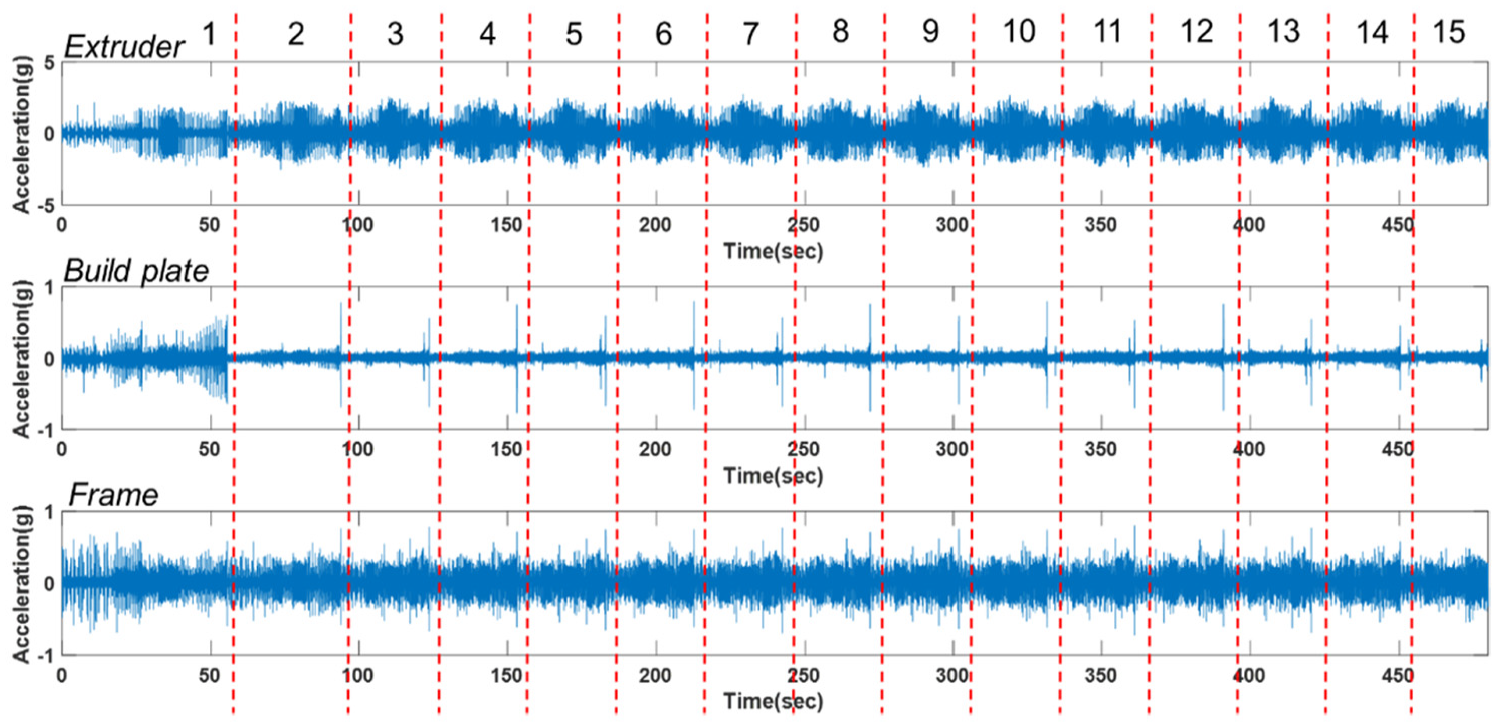
Time series acceleration data collected from three locations in the healthy state.
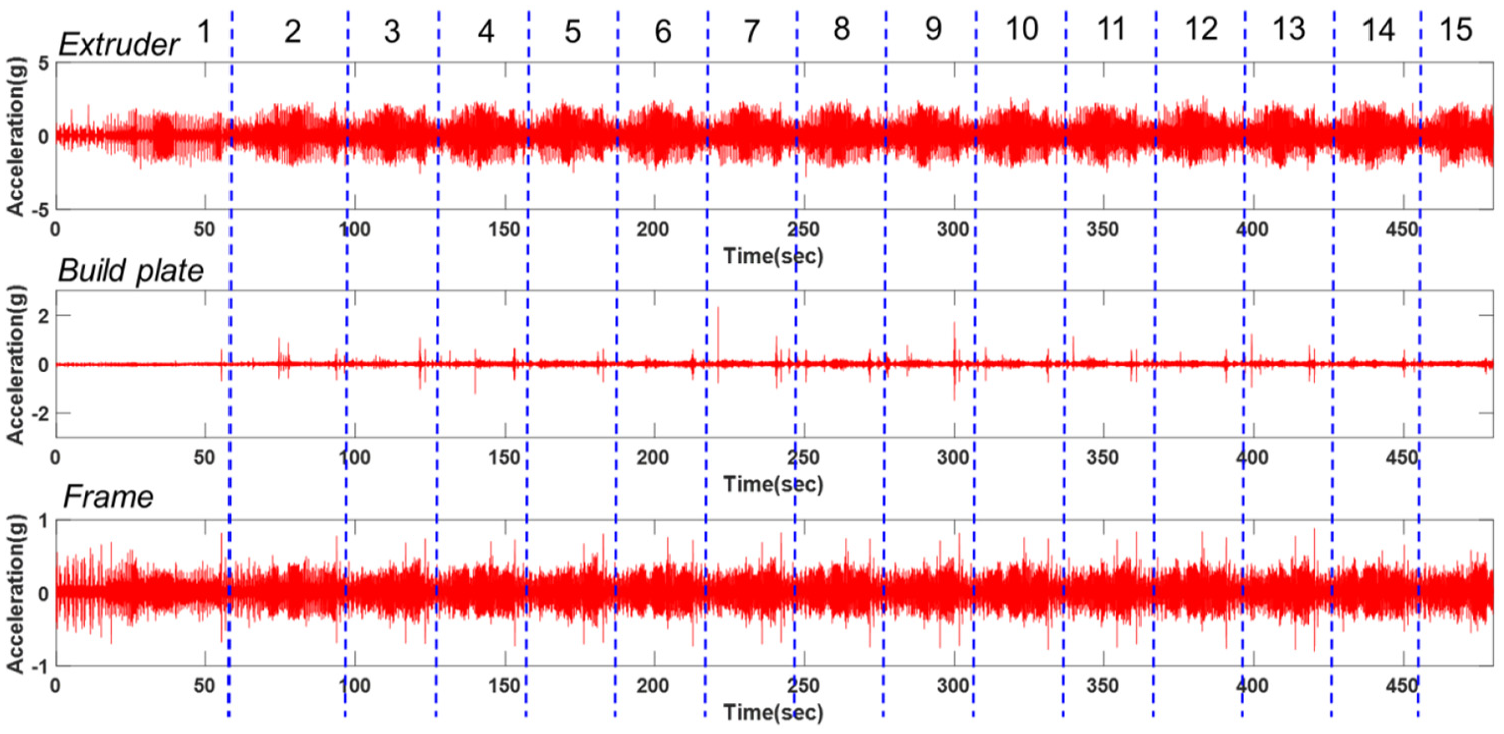
Time series acceleration data collected from three locations in the faulty state.
The collected acceleration data in a time domain should be further processed to capture their distinctive characteristics to be used for classifying either the healthy or the faulty state, since it is not easy to intuitively differentiate those time series data which are given in Figures 5 and 6. Thus, an additional signal processing has been conducted to extract appropriate features.
By processing the time series acceleration data given in Figures 5 and 6, diverse features including an RMS value, a peak-to-peak value, and a crest factor were obtained. Among those features, the RMS values were most effective to distinguish the differences between healthy and faulty states. In Figure 7, the extracted RMS values are graphically shown in the cases of healthy and faulty states. The points in the graphs denote the RMS values that were extracted by processing the entire time series acceleration data for each layer. After observing the RMS values given in Figure 7, those obtained at the frame can be used for an effective classification of the healthy and faulty states, since they are apparently different for the cases of healthy and faulty states. In addition, those obtained from the build plate might be used despite their small differences between the healthy and faulty states. However, those obtained at the extruder head were too similar to be used for classifying them, as can be seen in Figure 7.
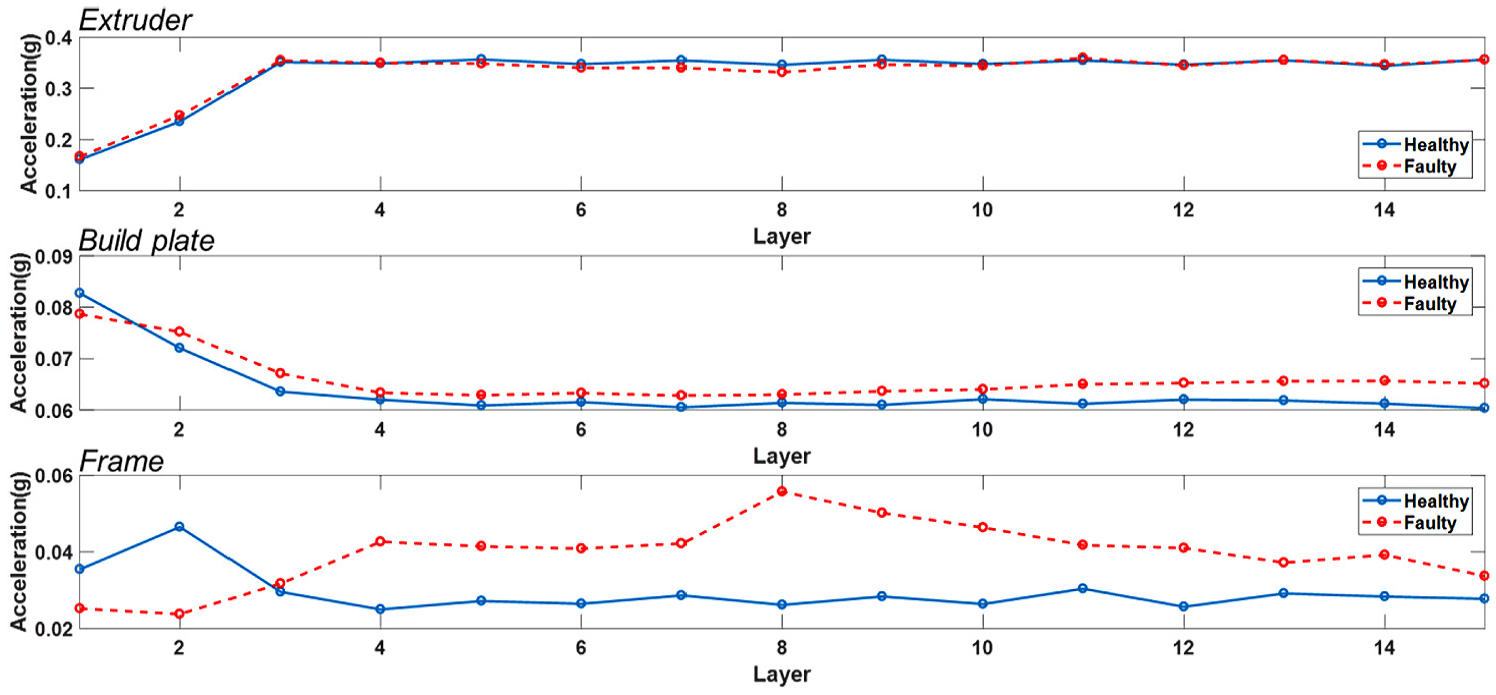
The RMS values extracted from the acceleration signals at three locations in healthy and faulty states.
AE signal processing
The AE sensor was attached to the top frame to collect AE signals during the FDM 3D printing process under the healthy and faulty states. A peak sensitivity and an operating frequency range of the AE sensor are 85 dB and 5–30 kHz, respectively. Figure 8 shows the collected time series AE data for the healthy and faulty states. The AE data given in Figure 8 were processed, and the RMS values were obtained and given in Figure 9. As can be seen in Figure 9, the AE RMS values in case of the faulty state are larger than those in case of the healthy state for each layer.
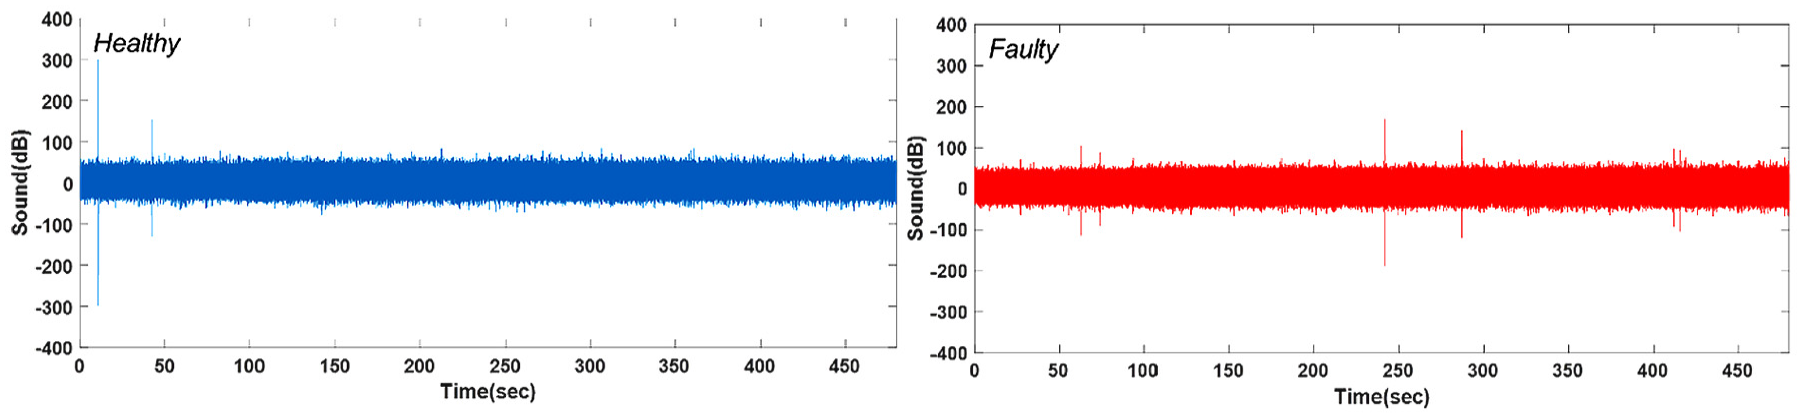
The collected time series AE data in the healthy and faulty states.
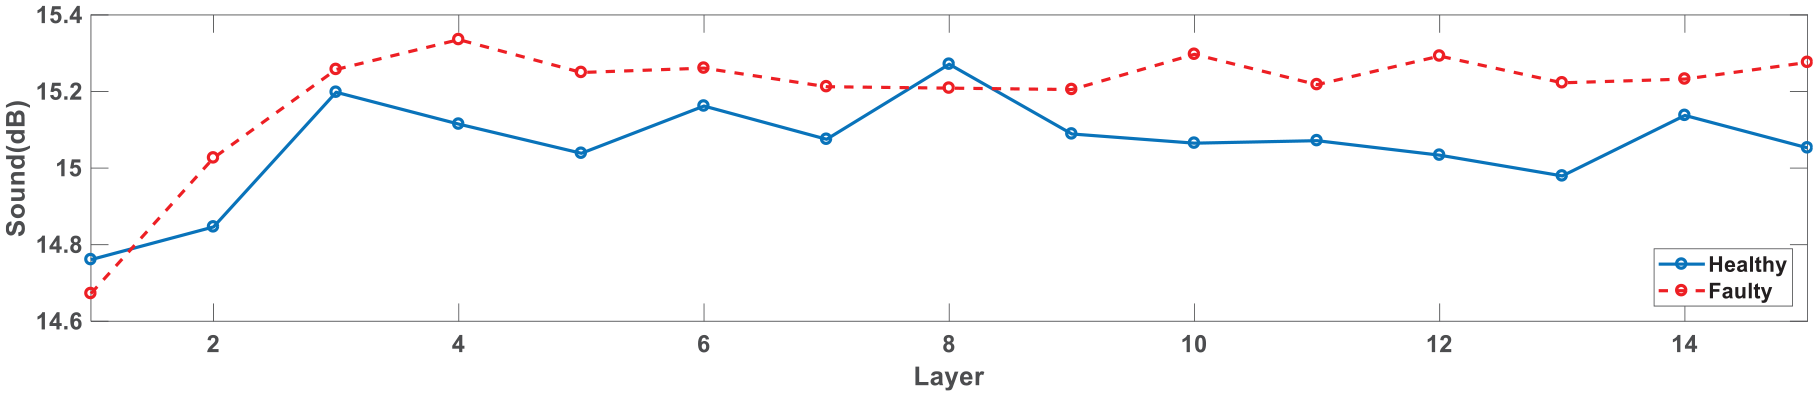
The RMS values extracted from the AE signals in the healthy and faulty states.
Temperature signal processing
In the FDM 3D printing process, a temperature distribution of each layer was observed by using an infrared camera. In Figure 10, the color-coded temperature distributions of odd-numbered layers of the 3D printed specimen are given for the healthy and faulty states. While investigating the temperature distributions given in Figure 10, those of each odd-numbered layer in case of the healthy state are more uniform than those in the faulty state. In particular, as can be known from Figure 10(b), a difference between maximum and minimum temperatures in each layer in the faulty state is much larger than that in the healthy state. This bigger temperature deviation in the faulty state may be due to the shifted pattern of layers of the 3D printed specimen, which is shown in Figure 4(b). Due to this shifting behavior in the faulty state, the 3D printed layer was not deposited on the previous layer correctly, and some region of the layer could be exposed in the air. Therefore, this region could have a higher cooling rate, and the temperature deviation could then be increased. The quantitative results on the temperature deviation for the healthy and faulty states are given in Figure 11. As can be seen in Figure 11, the temperature deviation values of each odd-numbered layer for the faulty state are much larger than those for the healthy state.
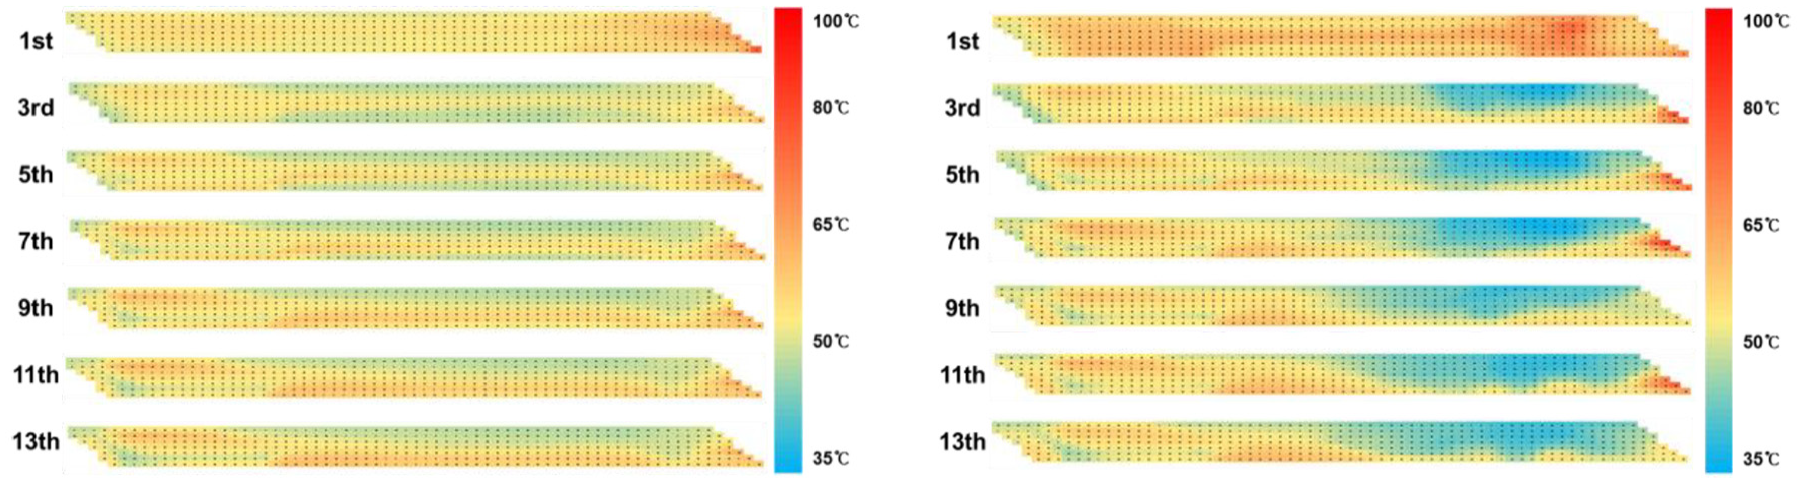
Temperature distributions of odd-numbered layers of the 3D printed specimen in the (a) healthy and (b) faulty states.
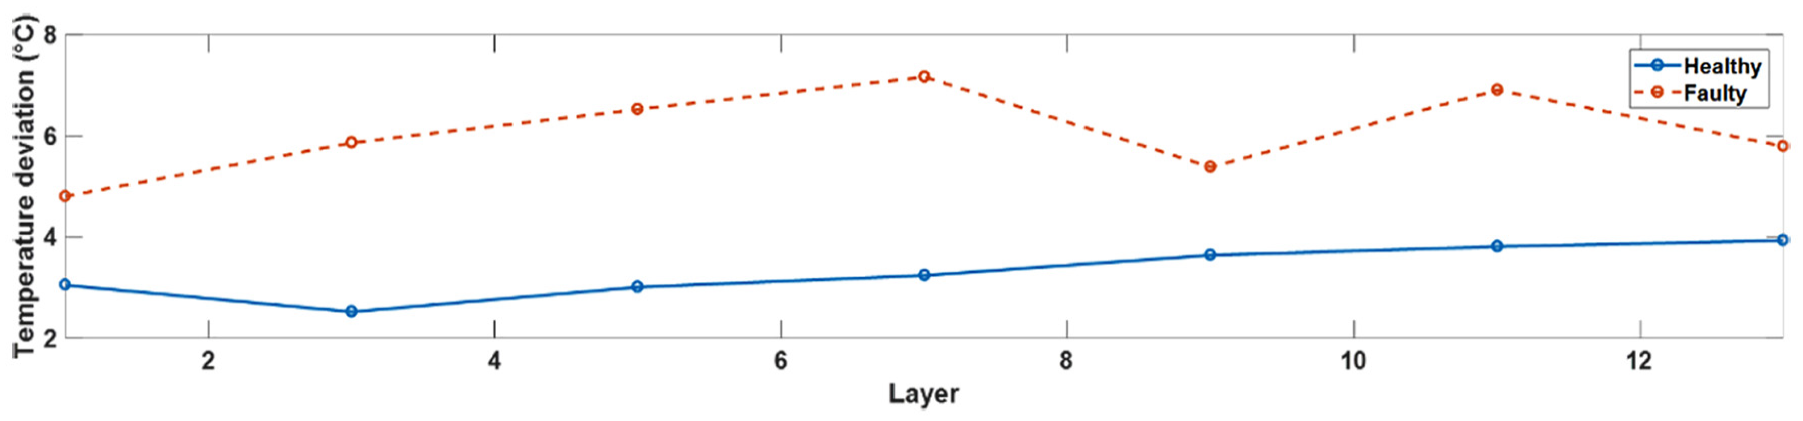
Temperature deviation values of odd-numbered layers of the 3D printed specimen in healthy and faulty states.
Modeling and validation
In general, a proper process monitoring and diagnosis model should be constructed by using critical features which were extracted from the data collected from various sensors to detect faulty process state affecting 3D printed part quality. In this research, the RMS values obtained from the accelerometer attached to the frame were used to build the model as well as those from the AE sensor. Therefore, two models were constructed by using those RMS values, respectively.
While constructing those models, a SVM algorithm has been considered since it can effectively classify a set of data into one of the two categories determining to which category new data belong based on a given set of data.16,17 Besides, a holdout cross-validation approach was adopted to improve a diagnosis accuracy. In a holdout cross-validation method, a data set for training can be randomly chosen and remaining data sets can be used for validation and testing. 18 Figure 12 shows the flowchart for developing the model detecting the faulty state of the FDM 3D printing process—the uneven leveling of the bed of the build plate.
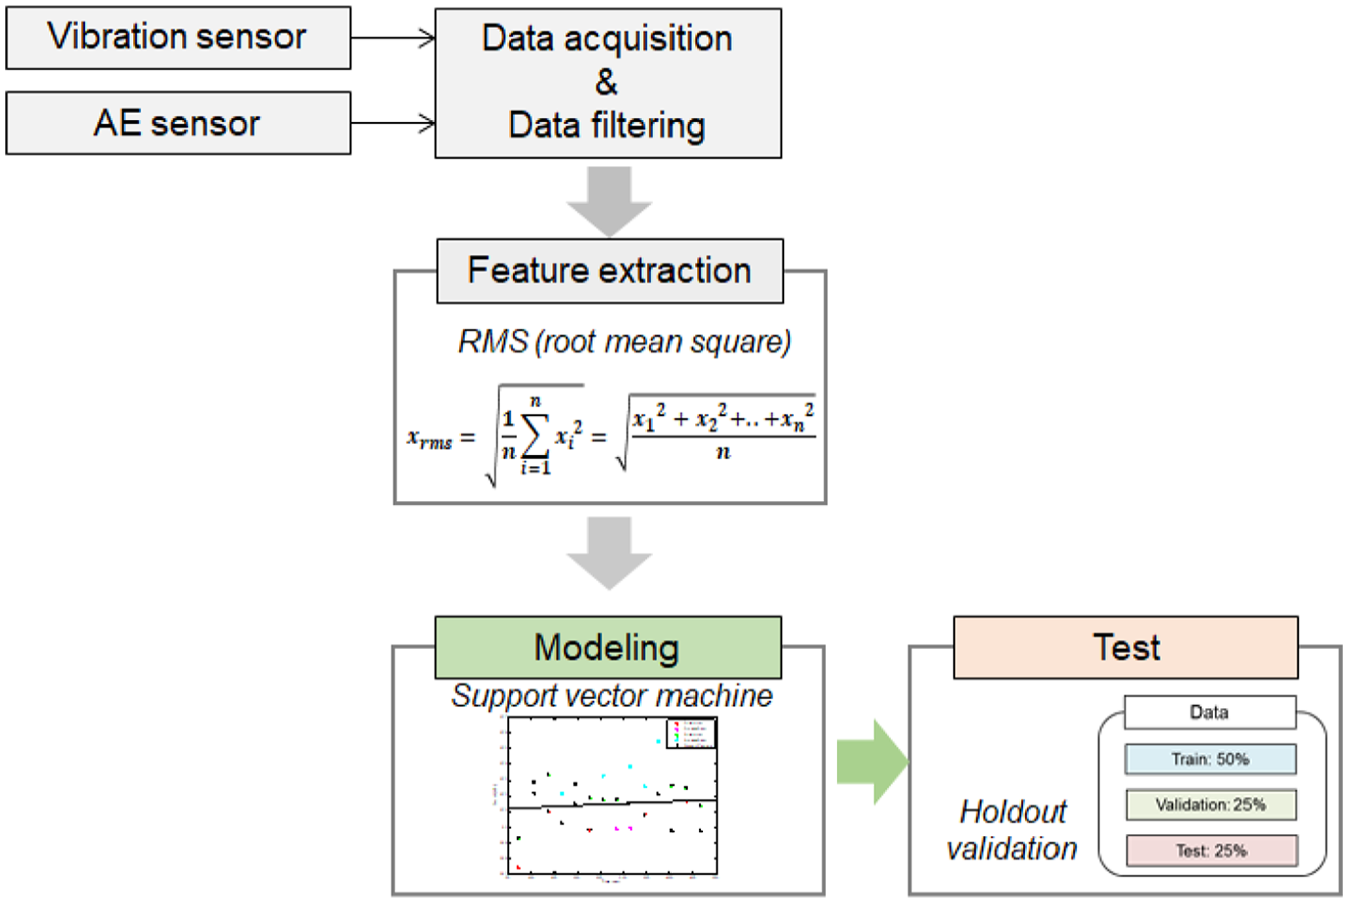
Flowchart for developing the FDM 3D printing fault detection model.
A series of the FDM 3D printing experiments were carried out, and 15 RMS values could be collected from one sensor for one experimental case. Two healthy and two faulty FDM 3D printing experimental cases were conducted, and therefore, 60 RMS values were processed from one sensor. Since there were two sensors—the accelerometer attached to the frame and the AE sensor, total 120 RMS values were then prepared. Among 120 RMS values, 60 RMS values obtained from the accelerometer were used for establishing the first model detecting the faulty state—the uneven leveling of the bed—during the FDM 3D printing process, and those from the AE sensor were used for building the second model. Then, the resulting diagnosis accuracies were compared.
While applying a holdout cross-validation approach to establish each model using 60 RMS values, 30 values were randomly selected for training with the SVM algorithm and remaining 30 values were used for validation and testing. While applying the SVM algorithm, both linear and non-linear algorithms have been considered. In Figures 13 and 14, the diagnosis results from the linear and non-linear SVM-based models using the acceleration and AE signals are graphically given as well as the original data set of 60 RMS values, respectively.
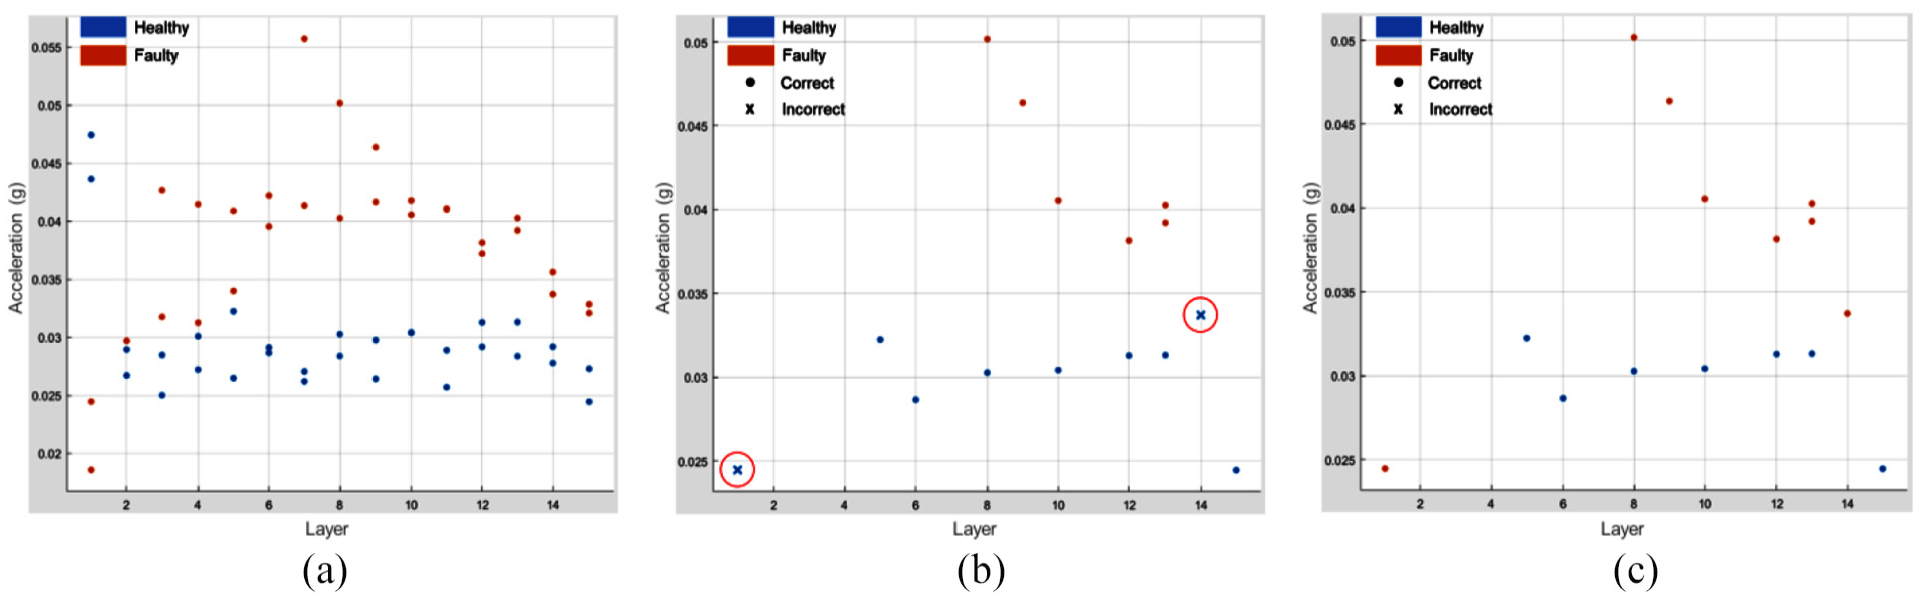
Original dataset and diagnosis results from SVM-based models using the acceleration RMS values: (a) original dataset, (b) linear SVM, and (c) non-linear SVM.
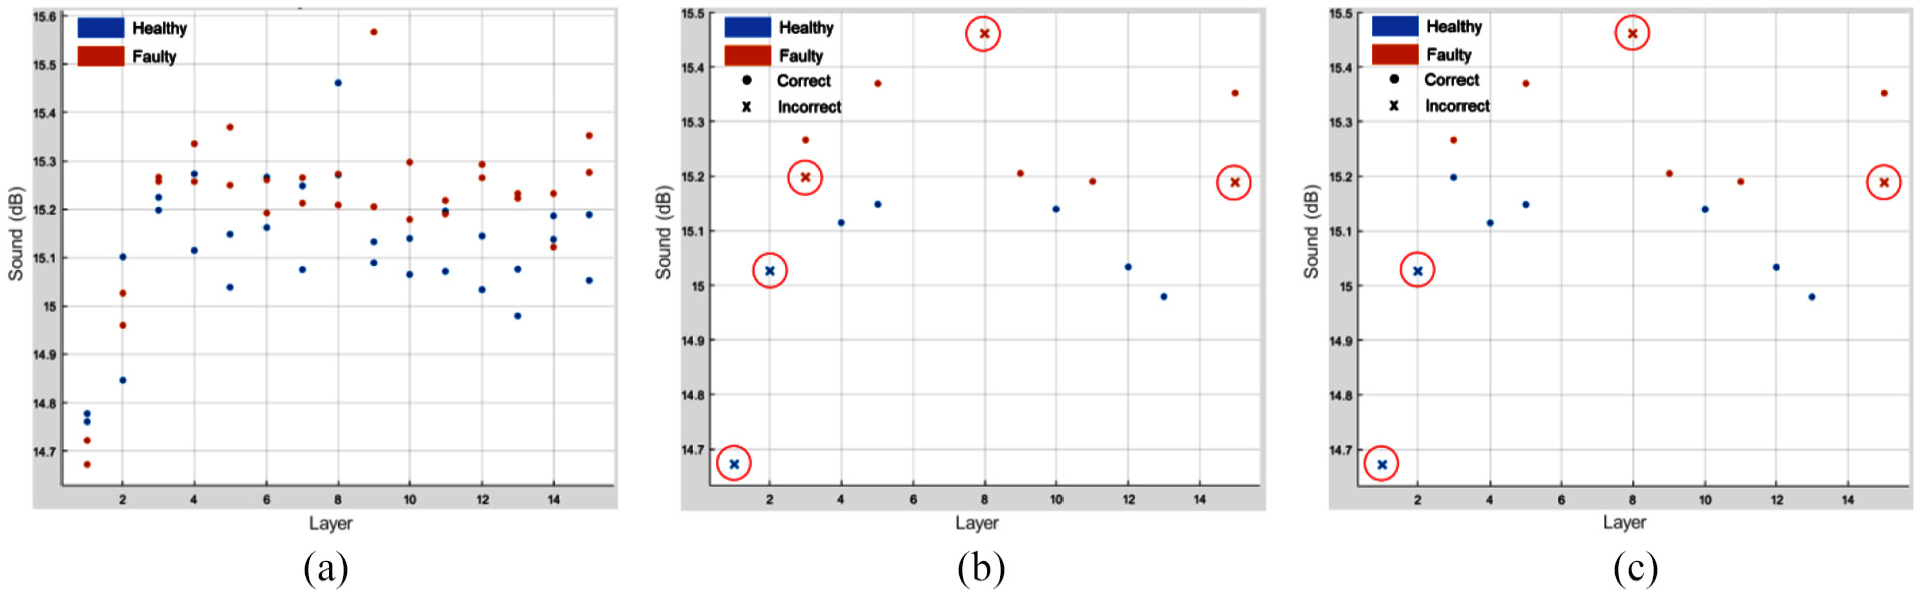
Original dataset and diagnosis results from SVM-based models using the AE RMS values: (a) original dataset, (b) linear SVM, and (c) non-linear SVM.
As can be seen in Figures 13, the diagnosis accuracies from the linear and non-linear SVM-based models using the acceleration RMS values were 86.7% and 100%, respectively. However, those from the models using the AE RMS values were 66.7% and 73.3%, respectively, which are given in Figure 14. Therefore, in summary, the non-linear SVM-based model using the RMS values of acceleration signals that were collected at the frame was most effective to diagnose health states of the FDM process.
Summary and conclusion
In this research, the health monitoring and diagnosis framework for FDM process was proposed by using the collected sensor data based on the SVM algorithm. For the faulty state of FDM process, the uneven leveling of the bed attached to the build plate was considered, which could cause significant warpage and twisted shifting layers in the 3D printed specimens.
In order to collect data that could be associated with the healthy and faulty FDM processes, three accelerometers, one AE sensor, and one thermocouple were attached to the FDM 3D printer. The collected time-domain raw data were processed to obtain the RMS values, and their differences between the healthy and faulty processes were compared. Then, the RMS values obtained from the frame acceleration signals and the AE signals were chosen, since they had the biggest differences between the healthy and faulty processes.
The linear and non-linear SVM algorithms were applied to build the diagnosis models monitoring the faulty state of the FDM process by training those RMS values. Meanwhile, a hold-out cross-validation approach was applied to enhance diagnosis accuracy. After validating the models, it was demonstrated that the non-linear SVM-based model using the frame acceleration RMS values showed the best performance.
The proposed framework can be used for an in situ monitoring and diagnosis of health states of the FDM process after installing appropriate sensors. Thus, quality of 3D printed specimens can be monitored and predicted based on the framework in an industrial site.
Footnotes
Declaration of conflicting interests
The author(s) declared no potential conflicts of interest with respect to the research, authorship, and/or publication of this article.
Funding
The author(s) disclosed receipt of the following financial support for the research, authorship, and/or publication of this article: This work was supported by the National Research Foundation of Korea (NRF) grant funded by the Korea government (Nos. NRF-2015R1A2A1A10055948 and NRF-2018R1A2A1A05079477) and the Industrial Core Technology Development Program (“Development of Prognostics and Quality Improvement Technologies for Enhancing Productivity and Yield Rate of Automobile Components by Minimizing Downtime of Manufacturing Robots/Process Equipment,” No. 10073196) funded by the Ministry of Trade, Industry and Energy, Korea.