
Abstract
Traditional (direction-parallel and contour-parallel) and non-traditional (trochoidal) tool paths are generated by specialized geometric algorithms based on the pocket shape and various parameters. However, the tool paths generated with those methods do not usually consider the required machining power. In this work, a method for generating power-aware tool paths is presented, which uses the power consumption estimation for the calculation of the tool path. A virtual milling system was developed to integrate with the tool path generation algorithm in order to obtain tool paths with precise power requirement control. The virtual milling system and the tests used to calibrate it are described within this article, as well as the proposed tool path generation algorithm. Results from machining a test pocket are presented, including the real and the estimated power requirements. Those results were compared with a contour-parallel tool path strategy, which has a shorter machining time but has higher in-process power consumption.
Keywords
Introduction
For several years, there has been a significant increase in the consumption of electric energy in several sectors in the world. 1 The industry sector is responsible for the consumption of 42% of electricity 1 and for 21% of greenhouse gas (GHG) emissions. 2 This effect is a result of the energy demand from the processes carried out in the manufacture of products in several sectors.
In the manufacturing perspective, machining processes are widely used for making products and, therefore, it is very important to develop researches that seek to reduce the consumption of electrical energy in machining processes.3–7
The energy consumption of machining processes has been the focus of many studies as a consequence of the interest in reducing the ecological footprint of manufacturing systems.8–11 The high electrical power demand of machining equipment has been recognized as an important component of this footprint.12,13 In this context, Balogun and Mativenga 14 presented a comparison of some recent publications where different models and methods are used to study the electrical power demand of machining processes.
Aramcharoen and Mativenga 15 proposed to identify and characterize power consumption, associating it with different machine components and auxiliary equipment. As machining centres are complex machines having multiple components, this task is usually not trivial.16–18 One of the difficulties is that components such as fans and lubrication pumps have a power requirement that changes over time. 19 However, those studies should help machine designers and builders to make more efficient systems. 8
Although the machining tool path strategy is known to influence power consumption,8,15,20,21 a large amount of research works that propose tool path generation methods normally focus on the relationship between material removal rate (MRR) and the processing time.22,23 Also, they do not consider proposing the generation of tool paths that take into account power consumption.
In this context, this article describes a system that generates power-aware tool paths, that is, tool paths that depend on the machining power requirement. The generated power-aware tool paths are compared with the traditional contour-parallel (CP) tool path strategy, and an analysis of the results is carried out.
Literature review
A significant amount of researchers have published methods to model and minimize power consumption. For instance, Lv et al., 17 Yoon et al., 24 Yan and Li 25 and Mori et al. 26 proposed methods to optimize the machine power consumption by studying the relationship between the operating parameters and the power requirement. They repeated a relatively simple cut varying the cutting parameters. For every cut, the power requirement is measured and the output is analysed using a statistical method in order to identify an optimal combination of parameters.
He et al. 27 proposed a method to estimate energy consumption of machining, based on the correlation of numerical control (NC) codes and energy-consuming components of machine tools. The test performed in the C45 steel prismatic part corresponded to a linear slotting (full immersion milling) tool path.
Liu et al. 28 presented a model to predict energy consumption in machining. Their energy consumption model is hybrid, that is, cutting power is obtained analytically through calculation of cutting forces, and experimental data from slot milling were used to obtain empirically the relationship between total power and cutting power. They compared their model with other models under different cutting conditions, and very good results were obtained considering either MRR only or both MRR and spindle speed.
Sealy et al. 29 studied the characteristics of energy consumption in hard milling, including process parameters and tool wear. AISI H13 tool steel (50 HRC) was machined, and they inferred that tool wear has the greatest influence on net cutting specific energy compared with feed rate and cutting speed. Also, energy efficiency increased with MRR. However, a simple one-way linear tool path was used in the experiments.
Deng et al. 30 proposed a method to optimize the machining parameters in order to reduce the specific energy consumption and the processing time. Real constraint conditions were considered, and the model was solved using a genetic algorithm. However, the influence of different tool paths on power consumption was not considered.
Peng and Xu 9 developed an energy analysis system that uses a hybrid energy consumption modelling, which includes the STEP-NC standard. 31 Tests were performed in three and five-axis machines, leading to a significant reduction in energy consumption and machining time. However, the performed operations corresponded to slot milling.
Diaz et al. 32 proposed setting a lower limit to the MRR value (75 mm3/s in their machine-material setup), establishing that machining cuts with MRR values lower than that should be avoided, since such values would lead to a high specific energy.
The studies cited heretofore in this section consider the machining tool path an important factor, but they do not assess how different tool paths affect the electric energy consumption, beyond the relationship between MRR and the processing time.
Avram and Xirouchakis 33 proposed a method to evaluate and reduce energy consumption considering some 2.5-dimensional (2.5D) machining strategies and machine components interactions. The employed strategies were as follows: (a) zigzag face milling, (b) contour milling a shoulder and (c) contour milling a pocket. Dry, minimum quantity lubrication and wet lubrication were tested in the machining of aluminium Al-7022 parts, and a high value of spindle speed (19,500 r/min) was used in some tests. They concluded that their method can be used to calculate the total energy required by a machine tool system for milling a 2.5D part. In order to reduce energy consumption in machining, they suggested a significant reduction of the non-cutting activities (e.g. amount of tool changes and the tool change time). They did not perform the generation of a power-aware tool path.
Kong et al. 21 developed a method to estimate the energy consumption and GHG emissions of a computer numerical control (CNC) machine. They considered acceleration and deceleration of machine tool axes in the operations, as well as the direction of axes movement. The tool path strategies that were considered include zigzag, spiral linear, spiral circular and trochoidal. They concluded that the moving direction of the tool path influences the energy demand, and that the geographic location of the machine results in different amounts and characteristics of GHG emissions. No power-aware tool path was considered in their analysis.
Aramcharoen and Mativenga 15 presented a methodology to predict energy demand for milling operations comparing different tool paths for pocket milling: zag, zigzag, contour and spiral. Up and down-milling were considered, as well as machining in different machine axes. Surface roughness, tool wear and machining time were also taken into account. They inferred the following: (a) their model can be used to estimate energy requirement with high accuracy when compared to online monitoring, (b) contour and spiral milling enables reducing energy demand by more than five times compared to zigzag milling and (c) tool path strategies can lead to significant energy savings in machining and recommend that more studies should be carried out on tool paths.
Shin et al. 34 presented a component-based energy-modelling methodology to implement online optimization. Component models were proposed, which sought to predict energy at the tool path-level in different machining configurations. STEP-NC 31 and MTConnect Institute 35 standard interfaces were used to enable data and model exchange. The methodology was applied to a 2.5D part with features such as profile, slot, pocket and hole, and the following tool paths were considered: contouring, slotting and zigzag. No new tool paths were proposed.
Edem et al. 8 investigated the influence of tool path strategies and machine tool axis configurations on the electrical energy consumption in pocket milling. Zag, zigzag, rectangular contour and spiral were the tool path strategies considered, which were tested in two three-axis CNC machines. Milling was performed at constant MRR. They inferred that the electrical energy efficiency of tool paths varies from one machine to another depending on their structural configurations. They studied traditional tool path strategies and did not attempt to generate and investigate a new type of tool path.
An approach that can be applied in order to relate the tool path to power consumption is the investigation of how the tool path influences the specific cutting force kc. Although kc is usually related to process stability and tool life, it can also be used to calculate an estimated value of cutting power, by multiplying it by the MRR value. However, the value of kc is not constant and depends on many factors, including the undeformed chip geometry.
In this context, in order to investigate the variations of the cutting force, Hinduja et al. 36 analysed an offset tool path and concluded that slotting occurred 40% of the distance travelled. On the other hand, when the radial depth of cut was less than half the tool diameter, the time was more than 30% in that specific tool path. This variation of radial depth produces an uneven cutting force,37,38 leading to irregular values of cutting power.
Some researchers proposed to modify the tool path in order to control the cutting force.39,40 Such modifications include the following approaches: (a) adjust the feed rate in order to compensate the radial depth variations, 41 (b) use trochoidal tool path strategy42–45 and (c) use spiral tool path strategy. 46
In order to have a precise estimation of the power requirement of the process, Borgia et al. 47 used a computer simulation of the tool–material interaction. Using computational solid geometry libraries, they calculated the instantaneous MRR along the tool path.
In this work, a further step was taken: a computer simulation referred to as virtual milling system (VMS) was integrated with the tool path generation process, enabling the estimation of the power consumption along every tool path segment, leading to the generation of a power-aware tool path. A detailed description of the proposed power-aware tool path generation system is given in the next section.
Proposed method for power-aware tool path generation
Components of the power required for machining
The power required by a machining process can be divided into four portions: Pidle is the power consumed by all machine devices and accessories (e.g. computers, communication devices, small motors, lamps and other accessories) while the machine is turned on; Pspindle is the power required to rotate the spindle without performing any cut; Pfeed is the power for feeding (positioning) the tool; and Pcut is the power necessary to perform the cut.
In practice, each of those power elements represents a demand that occurs in a certain time span during the process. For example, the CNC control is constantly demanding power from the machine start-up to its shutdown, while lubrication pumps and cooling vents are activated only when needed. On the other hand, the spindle is activated only during limited time spans starting seconds before the cutting process and stopping some seconds after completing the operation.
The total power requirement is given by equation (1). It is clear that a decrease in any of the individual power elements will reduce the total power required for the process

The method proposed in this article attempts to manage the value of Pcut. This power can be approached by using the specific cutting force (equivalent to the specific energy consumption), which is the power required to machine a unitary cube (usually 1 mm3) and adjust the value by using one or more correction factors to reflect the actual conditions of the cut. A commonly used formula corresponds to equation (2)48,49

where kc is the specific cutting force (N/mm2), kc1 is the specific cutting force per 1 mm2 (N/mm2), hm is the mean chip thickness (mm), mc is a constant based on the part material and γo is the rake angle of the tool on the orthogonal plane.
Specific cutting force tests
Initially, in order to provide a good estimation of the milling power requirement, a series of milling tests with different cutting parameters were performed, all of them without the use of cutting fluid. Initially, some values of cutting speed Vc and feed per tooth fz were used in order to verify the stability of the process, and the selected values for further tests were Vc = 180 m/min, and fz = 0.15 mm/tooth, since higher values resulted in the occurrence of chatter.37,50
The machine used in this research was a 7.5-kW Charles MVC-955 machining centre, with a Siemens Sinumerik CNC 840Di. It was equipped with the power measurement device Kron Mult-K120 51 (Figure 1), which was connected to a computer using a Modbus interface in order to generate a power consumption graph. The machined material was a P20 tool steel with 31 HRC hardness. A 20-mm indexable end mill was used for machining, having three BDMT 11T308ER-JT carbide inserts with PR-1225 PVD coating, and Kyocera MEC 20-S20-11T tool holder.

Power measurement device Kron Mult-K120. 51
The tests consisted of removing through down-milling a volume with cross section ae (radial depth of cut), ap (axial depth of cut) along a straight line with length L (Figure 2) and recording the power consumption (in Watt) by the cut. A graph was created for every test (Figure 3), and mean power was calculated for idle and cutting conditions (dwell time was added before the cut). The difference between those means was recorded as cutting power for that specific parameter combination.
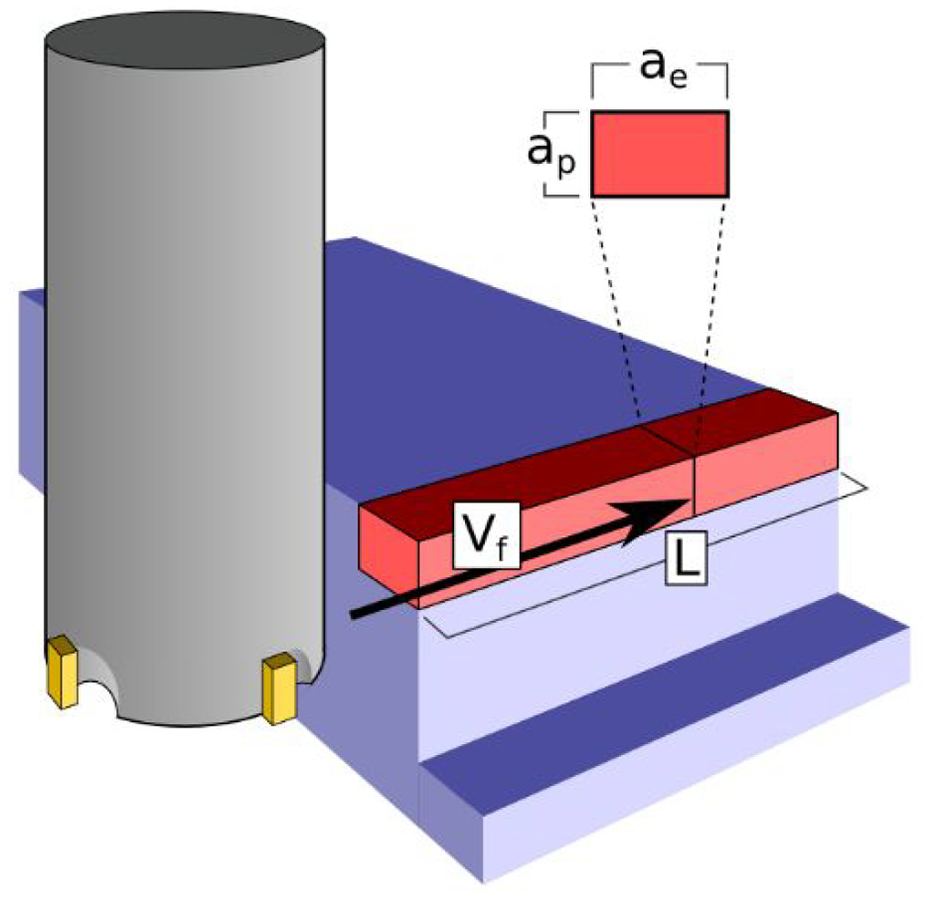
Variables considered in the milling tests.
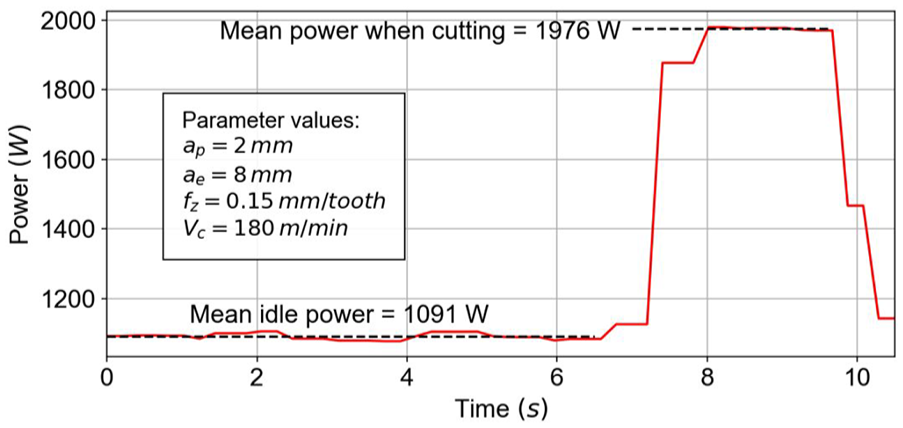
Graph obtained from a cutting test.
A total amount of 60 combinations were used to measure the power requirement in each cut by varying the values of radial and axial depths of cut. Table 1 presents the parameters used in the tests.
Values of the cutting parameters used in the machining tests.
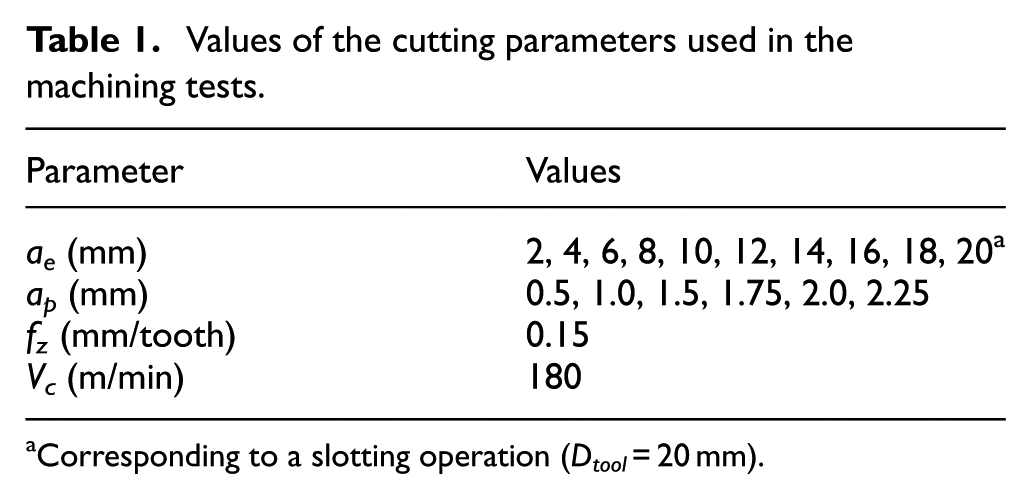
Corresponding to a slotting operation (Dtool = 20 mm).
Every test combination was used four times, and resulting averaged cutting power requirement for each (ae, ap) combination is presented in Figure 4.
Measured average Pcut from experimental tests.
MRR is given by equation (3), 52 and it was calculated for each (ae, ap) combination

where MRR is the material removal rate, ae is the radial depth of cut, ap is the axial depth of cut and vf is the feed speed.
Then, the specific cutting force kc for each (ae, ap) combination was determined using equation (4), 53 and the obtained points are shown in Figure 5. The estimated error was calculated based on the standard deviation and the number of tests, and it was included in Figure 5
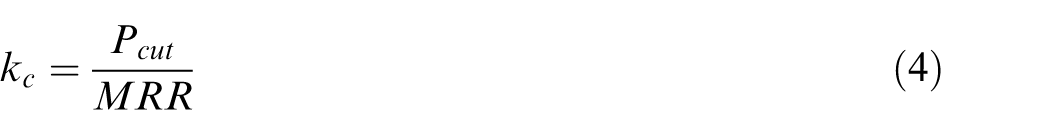
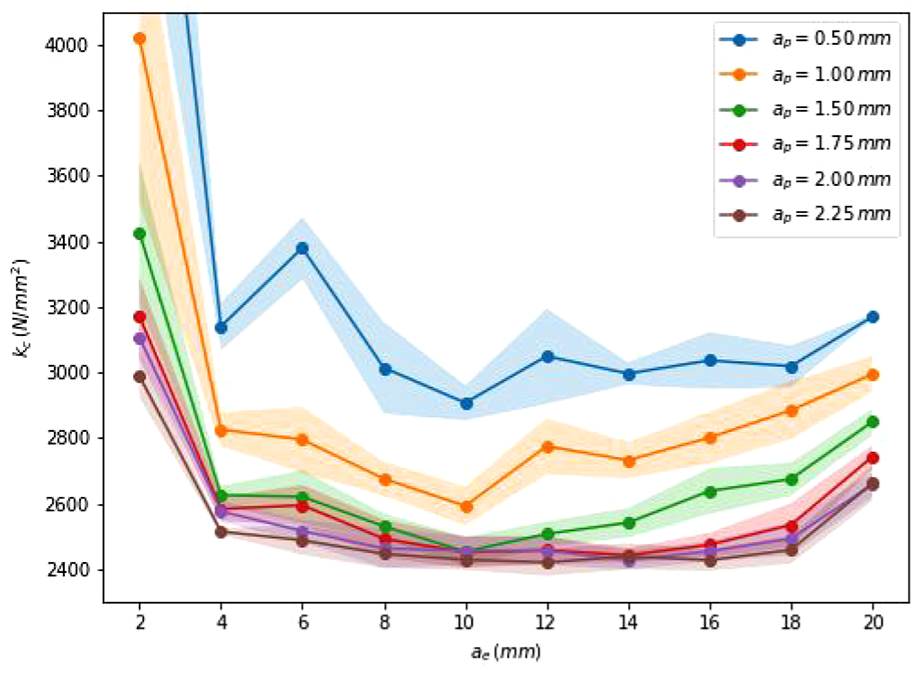
Obtained specific cutting force kc values with the estimated error.
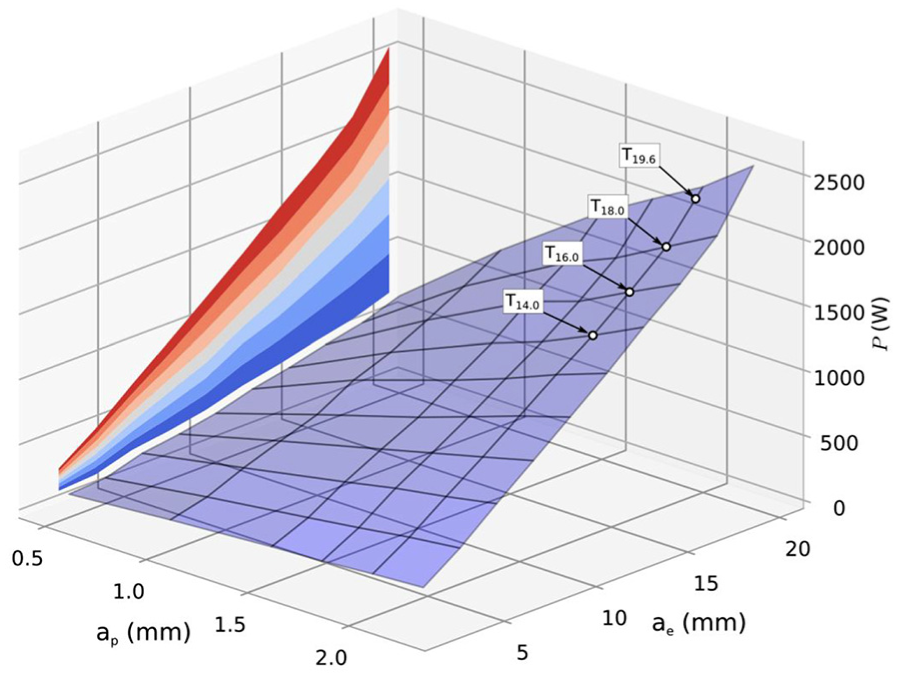
Figure 6 shows the mean values of the curves in Figure 4 plotted as a surface, with the two depths (ap and ae) in different axes. It can be inferred from the results shown in Figure 6 that there is a region in which the specific cutting force is minimum and almost constant. This occurs for ae values between 8 and 18 mm, and when ap is larger than 2.0 mm. On the other hand, the worst values of kc are those for ae values lower than 4 mm, and kc values increase significantly in a slotting operation (ae = Dtool). A possible cause for this behaviour is the relationship between the undeformed chip thickness and the value of kc. As it was shown by Balogun et al., 54 three different mechanisms (rubbing, ploughing and shearing) can occur. When the undeformed chip thickness is small, rubbing and ploughing are the dominant mechanisms, causing an increase in the specific cutting energy. This condition occurs at the starting point of the cut for up milling, and at the end for down-milling. In slotting operations, this mechanism takes place both at the start and end points of the cut. As the graphs represent the mean kc for the whole cut, the kc value in slotting operations is not as high as the kc value for small ae values (ae < 8 mm).
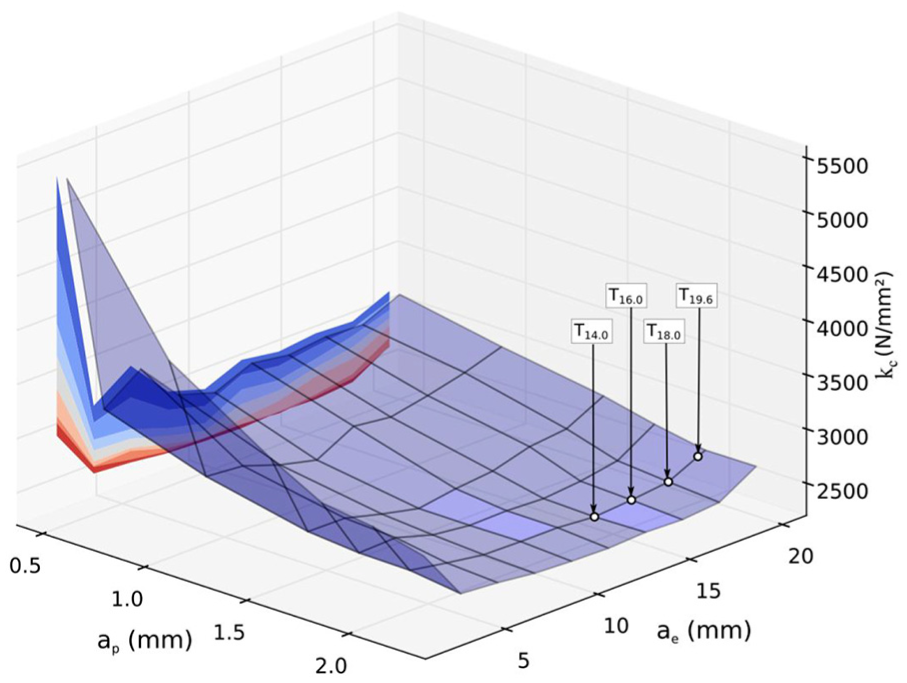
Average specific cutting force for different values of axial and radial depths of cut.
Thus, for ap values greater than 1.5 mm, in order to keep kc values low, tool path segments that result in ae values outside the 8- to 18-mm range should be avoided. Also, the tool path should keep ae values as close as possible to 18 mm, since this value results in a higher MRR.
Mean chip thickness
In milling, since the geometry of the chip changes continuously along every cut, chip thickness changes continuously. The instantaneous chip thickness value depends on the feed per tooth fz and the relative position of the part from the tool direction of feed. In this work, the mean chip thickness hm is used so as to take in account this variation.
The variation of the mean chip thickness for a radial depth of cut ae can be obtained by dividing the cutting area by the cutting length (ϕs). As the feed is constant, the cutting area is obtained by multiplying fz by ae, while the cutting length is obtained by multiplying the cutter swept angle by the tool radius (equation (5))
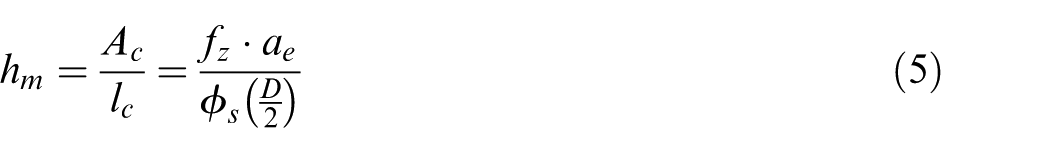
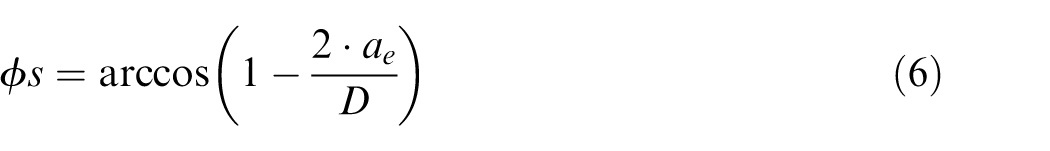
The cutter sweep angle (ϕs) can be obtained with equation (6)
The graphs of the cutter swept angle, the mean chip thickness and the cutting area as a function of the radial depth of cut are shown in Figure 7.
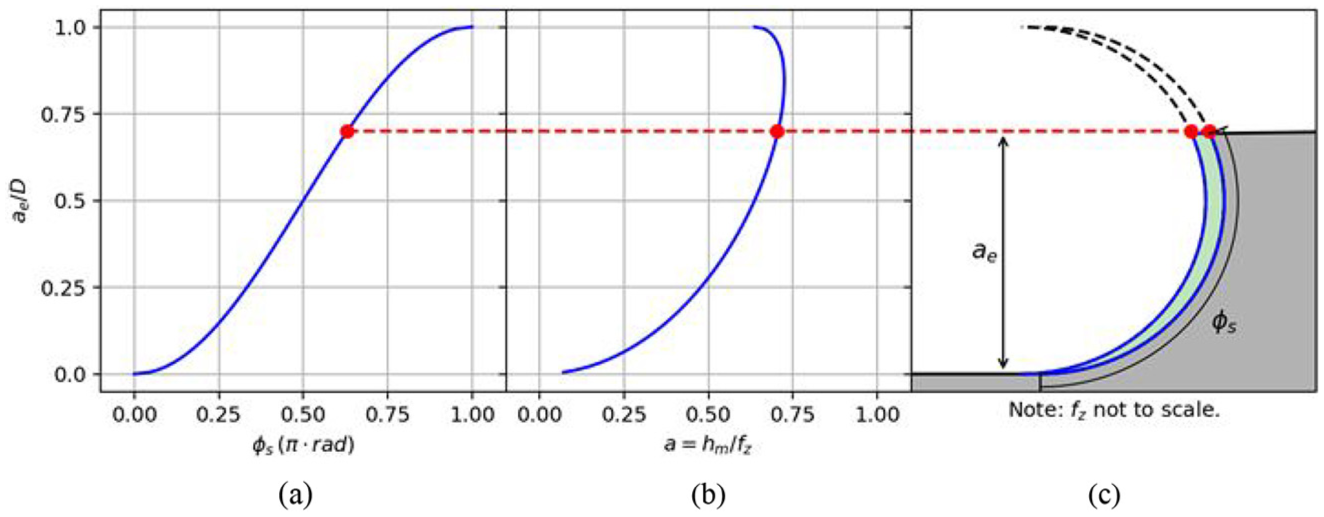
Graphs showing the (a) cutter swept angle, (b) mean chip thickness and (c) radial depth of cut.
Similarly, the mean chip thickness for an axial depth of cut ap is obtained by dividing the lateral cutting area by the cutting edge length. The area is obtained by multiplying fz and ap, whereas the cutting edge length (for a toroidal cutter) is obtained by multiplying the cutter swept angle by the tool radius. The resulting hm graph is shown in Figure 8.
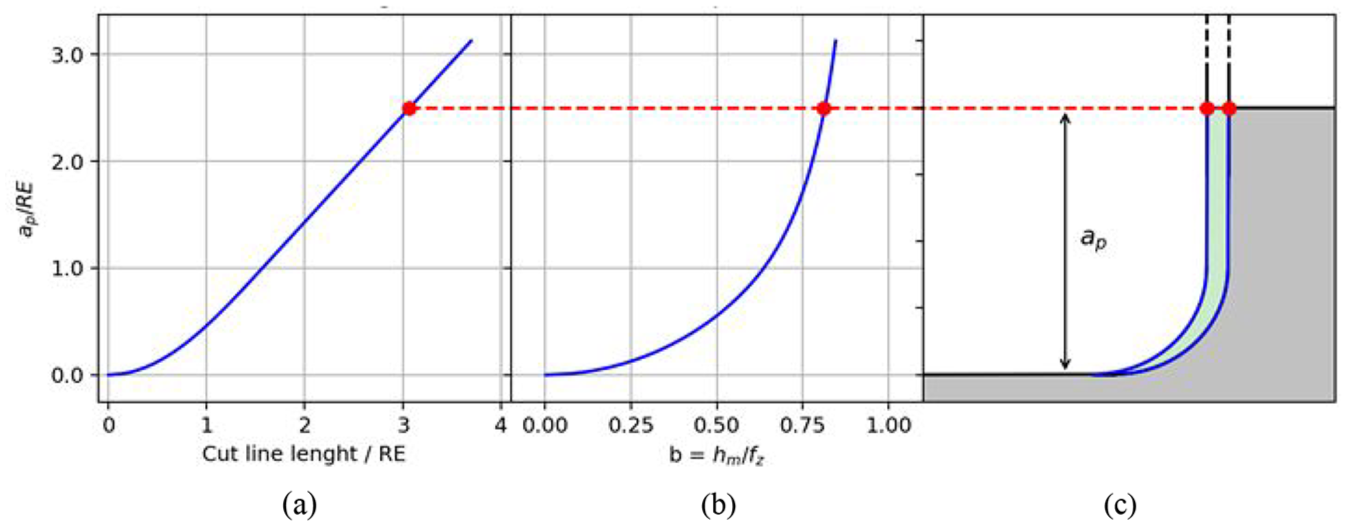
Graphs showing the (a) cutter line length, (b) mean chip thickness and (c) axial depth of cut.
Some conclusions can be drawn from those two graphs. First, regarding ae (Figure 7), if up or down-milling is used, a higher value of hm/fz is obtained using an ae/D = 0.845 (which corresponds to an ae = 16.9 mm with the used tool). On the other hand, Figure 8 shows that increasing ap leads to a higher value of hm/fz, tending to 1.
By combining the results shown in Figures 7 and 8, the mean chip thickness resulting from this combination is shown in Figure 9. This graph shows that an increase in ap/RE (axial depth of cut divided by the tool nose radius) results in a more efficient cut (due to the direct relationship between kc and hm in Kienzle’s equation), whereas for ae/D (radial depth of cut divided by the tool diameter), there is an optimal zone where there is some cutting efficiency for both very low values and for high values.
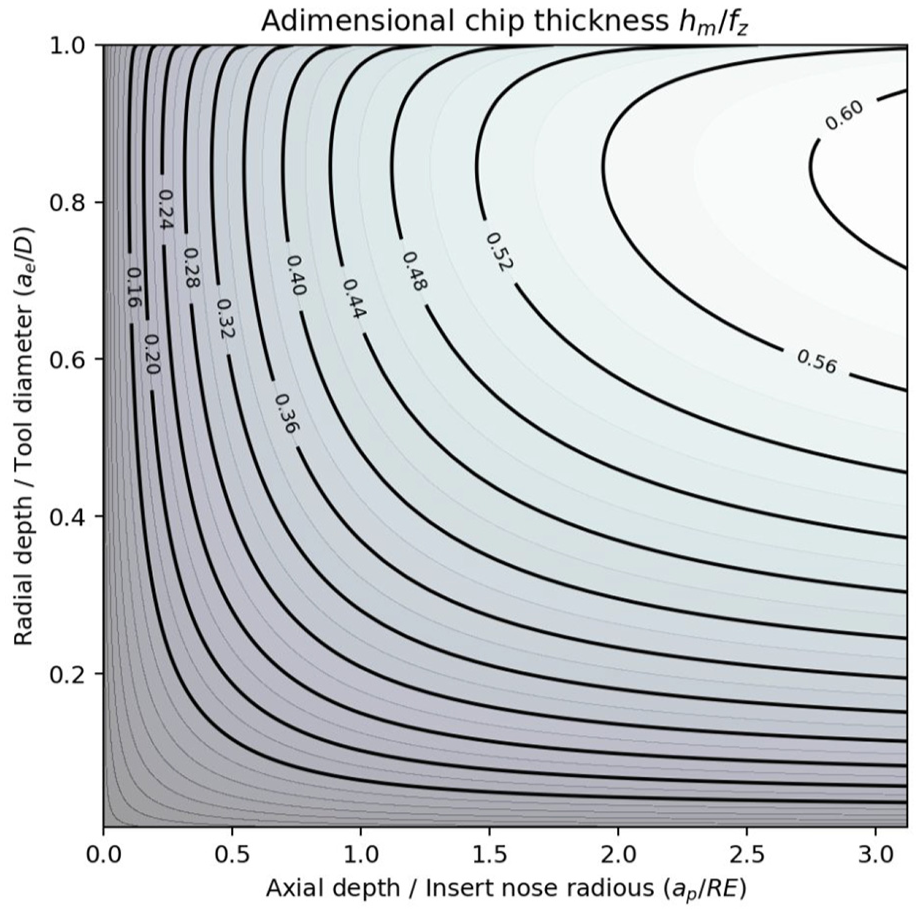
Dimensionless mean chip thickness (hm/fz).
Modified mean chip thickness
The experimental values of the specific cutting force kc and the dimensionless mean chip thickness (shown in Figure 9) were used to obtain constants kc1 and mc of equation (2). The fitted curve, corresponding to the dashed line in Figure 10, gives an approximate value of kc. Nevertheless, when comparing this fitted curve with the points generated for each ap (as shown in Figure 11), it is evident that every graph has the same characteristic shape: a minimum value of kc is reached when ae increases, and then, after achieving the maximum value of mean chip thickness, kc increases again, but this time up to a value above the fitted curve.
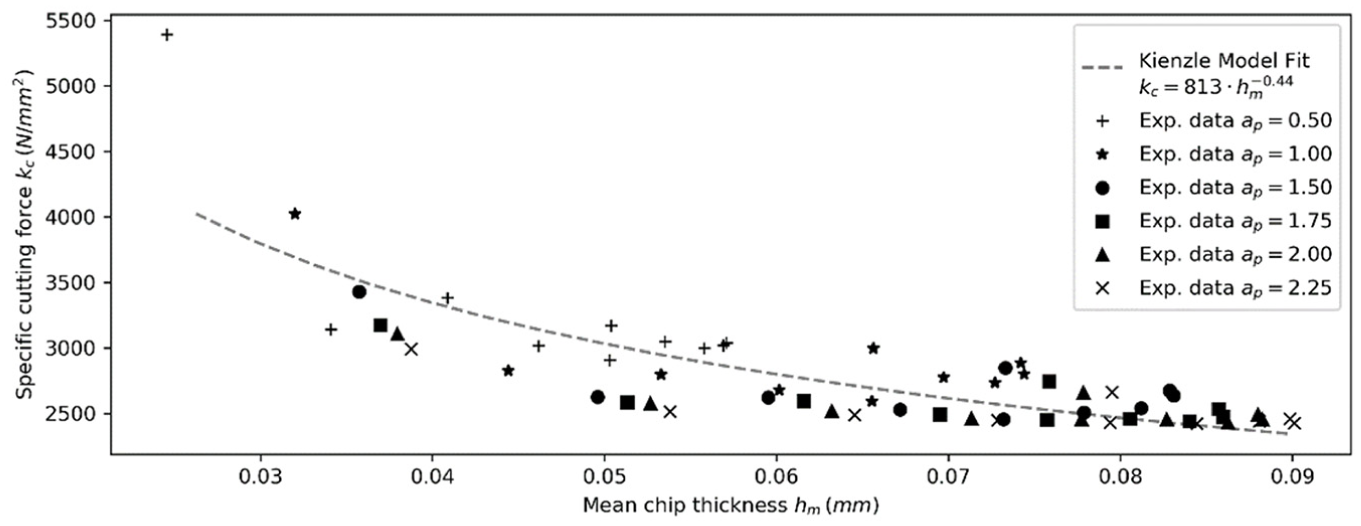
Fitted curve for kc for different values of hm and ap.
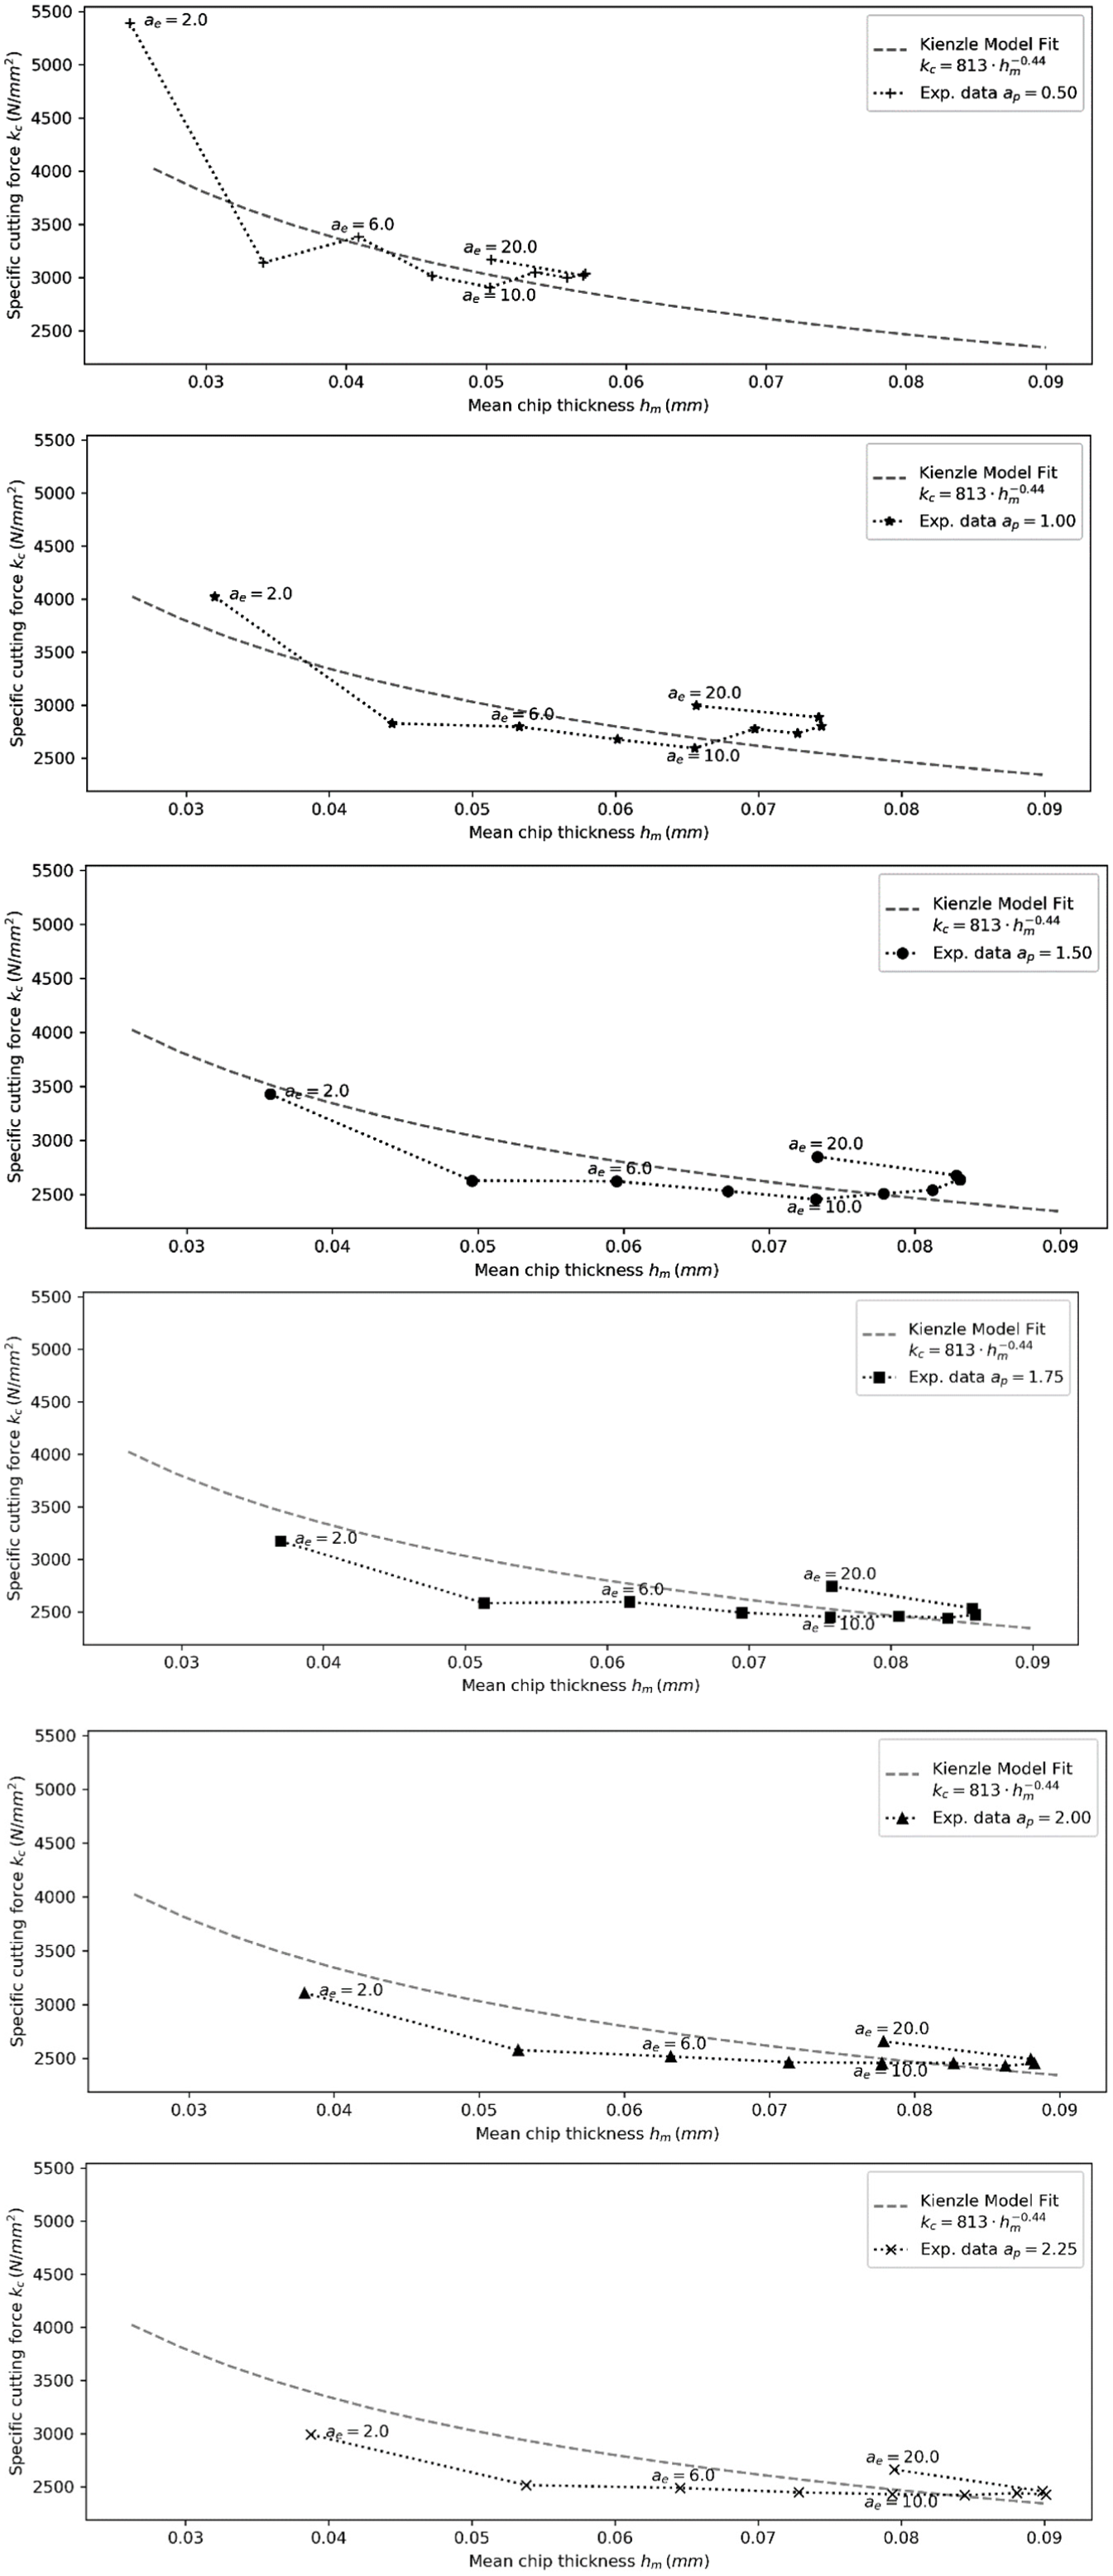
Fitted curve for kc, and the kc points for different values of hm, ae and ap.
While the reason for this behaviour is not obvious, it may be a consequence of the difference from the nominal value with the real chip thickness, whose values may differ due to the occurrence of unbalanced forces and vibration.
Thus, in order to have more precise values for kc used in the VMS, the mean chip thickness value for every (ap, ae) combination was modified from the one shown in Figure 9 to the values shown in Figure 12. These values were calculated using equation (2) to obtain the hm value from the experimental kc, and the fitted kc1 and mc values. Figure 12 shows that the values of hm remain almost constant in the area above the 0.52 curve (combinations with ap/RE = 2.25 and 0.4 < ae/D < 0.8).
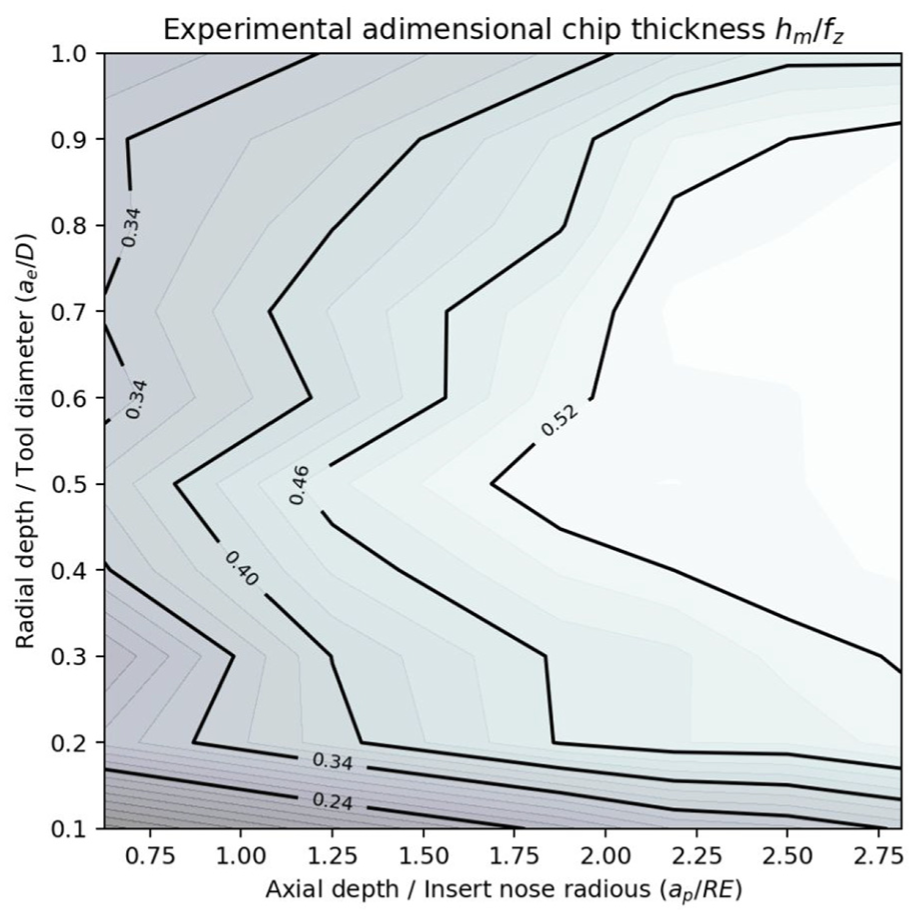
Modified dimensionless mean chip thickness hm.
VMS
Given the initial workpiece, the tool geometry and the tool path, the developed VMS calculates the interaction between the tool and the workpiece. The system was implemented in a tree-like structure where the part is composed of cubes, which are referred to as voxels (‘volume elements’).55,56 When the tool gets in contact with a voxel (which corresponds to an intersection), the voxel is automatically divided into sub-voxels recursively until a certain subdivision limit is reached. This limit is a configuration parameter of the system, and it was set to three, that is, each voxel can be subdivided up to three times, corresponding to 3 × 3 × 3 sub-voxels for each initial voxel. This recursive process is shown in Figure 13.
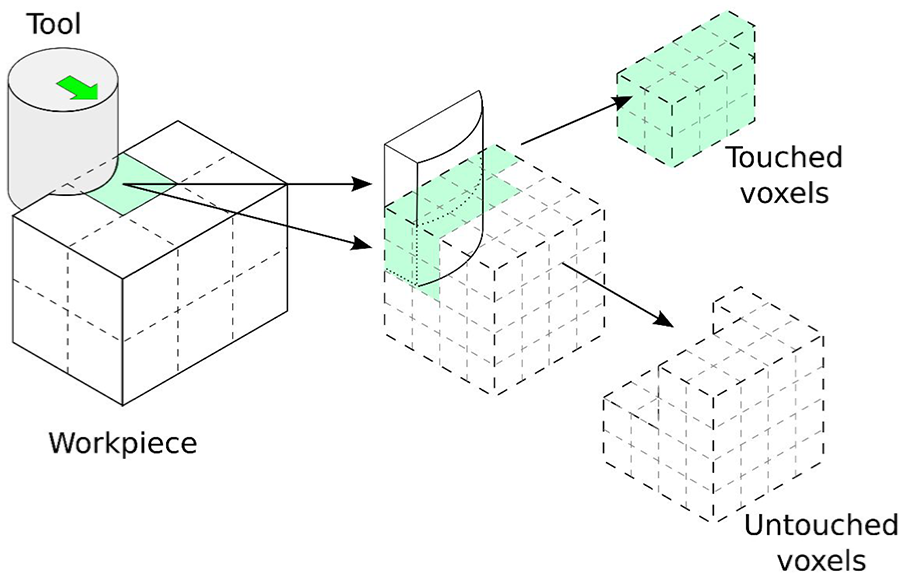
Virtual milling system and the subdivision of voxels resulting from the relative position between the tool and the workpiece.
When the tool gets in contact with a leaf voxel (which is the minimum sub-voxel), it is set as being removed, and the time step in which the material was removed is also assigned to the voxel. Moreover, the voxel’s geometric location relative to the tool and the tool path is recorded for further analysis (Figure 14).
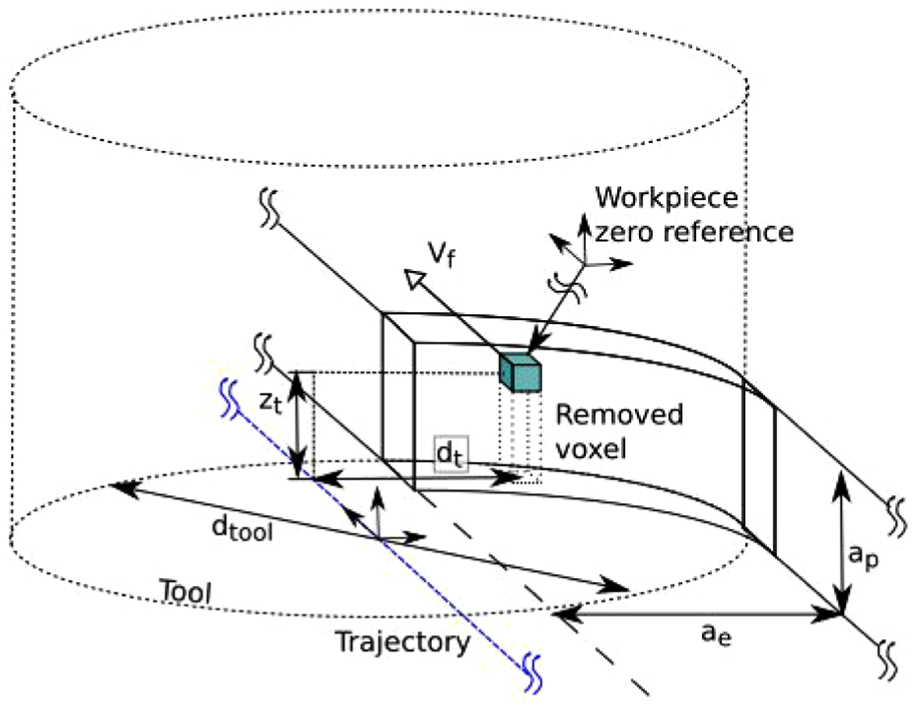
Data collected from voxels removed by the tool.
Given that voxels are aligned, the tool (e.g. a flat end milling tool moving along the z direction) initially does not intersect any voxel, but then it intersects simultaneously a large number of voxels in a small pass, and all these voxels will be removed at the same time (Figure 15(a)). In order to avoid this effect, the interaction between the tool and the leaf voxel is calculated using a point within the voxel, which is generated randomly and is located anywhere within the voxel (Figure 15(b)). This process generates some noise in the system output, but it does not interfere with the proposed tool path generation algorithm.
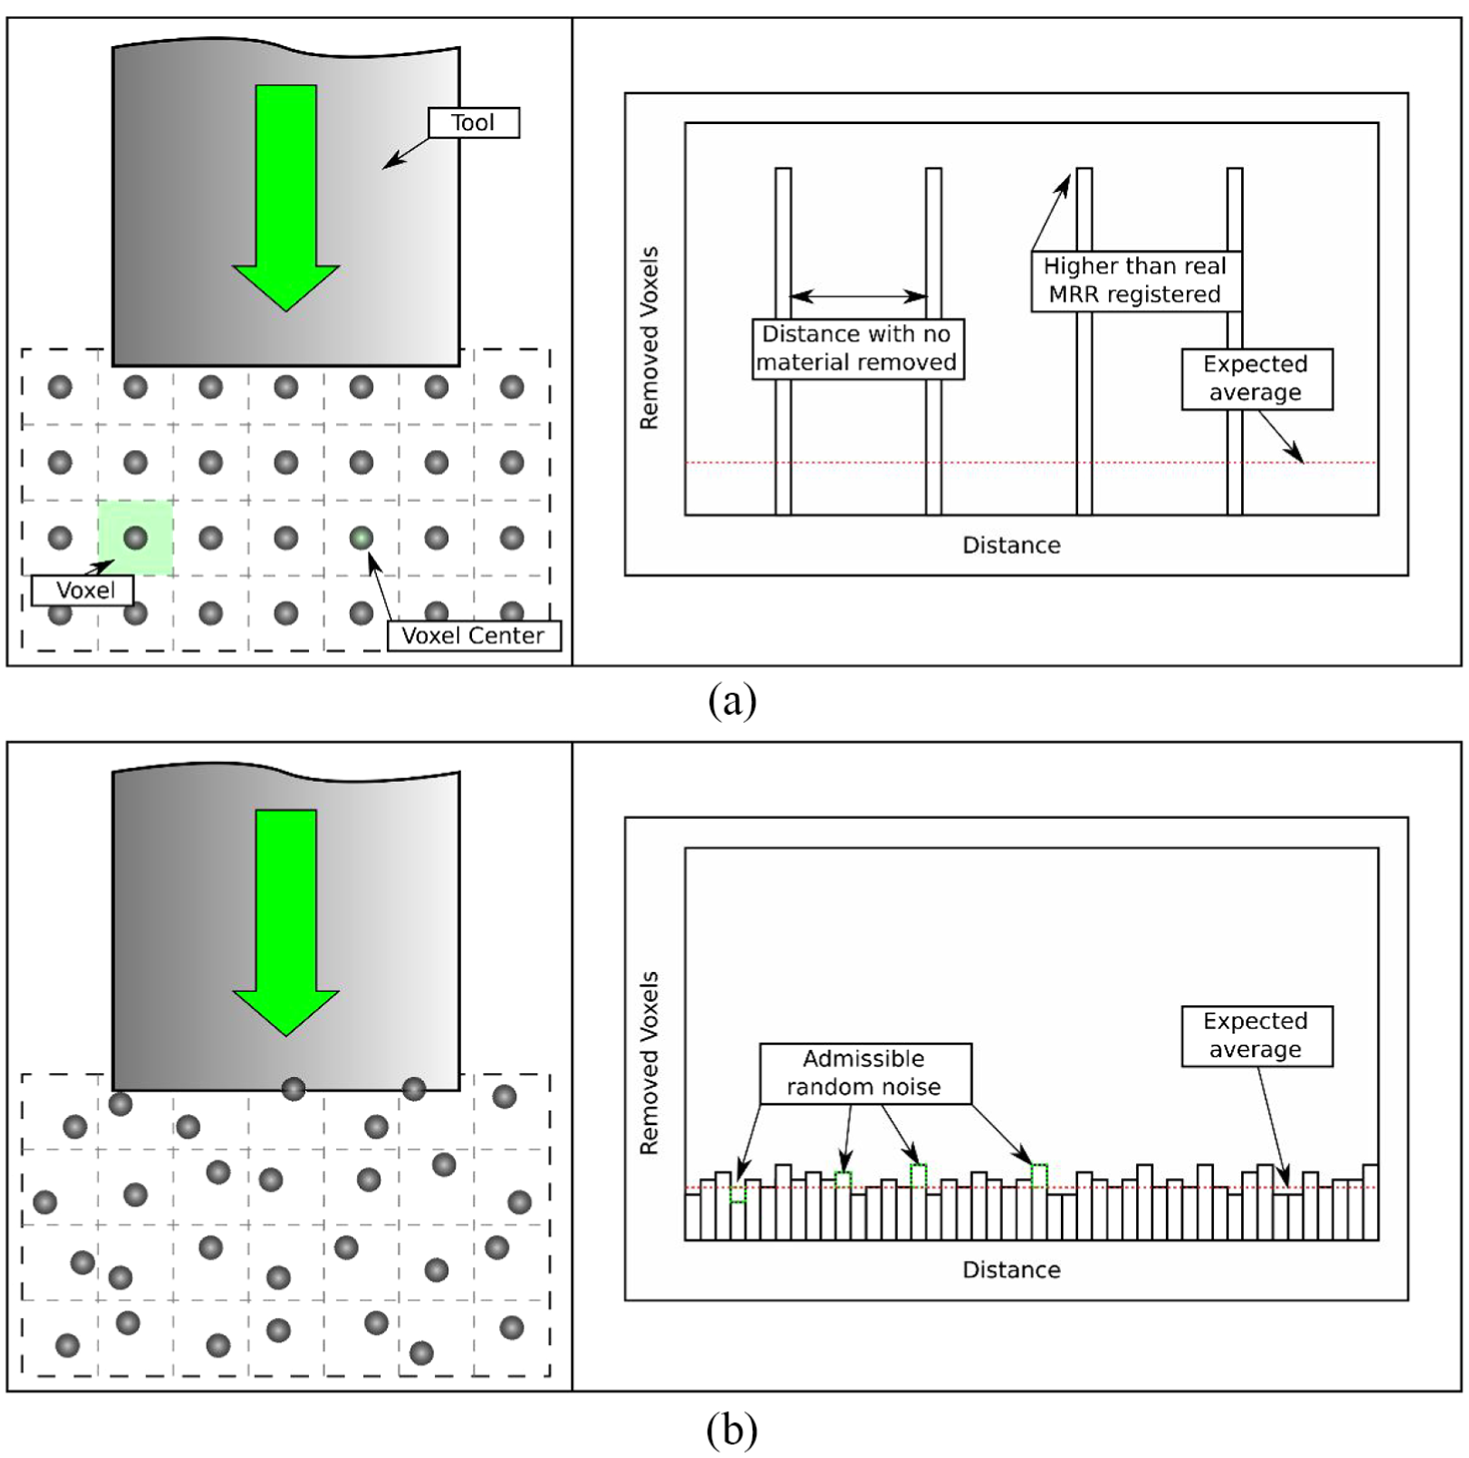
Interaction between the tool and the part: (a) voxels with their geometric centres and (b) voxels with randomized points representing their centres.
In order to have an estimated value of the power required in each feed movement, the following values are calculated: (a) the volume of material removed, determined by counting the number of voxels removed multiplied by the voxel volume and (b) the ae value, which is the difference between the relative linear position of the rightmost removed voxel and the position of the leftmost removed voxel. This process is shown in Figure 16.
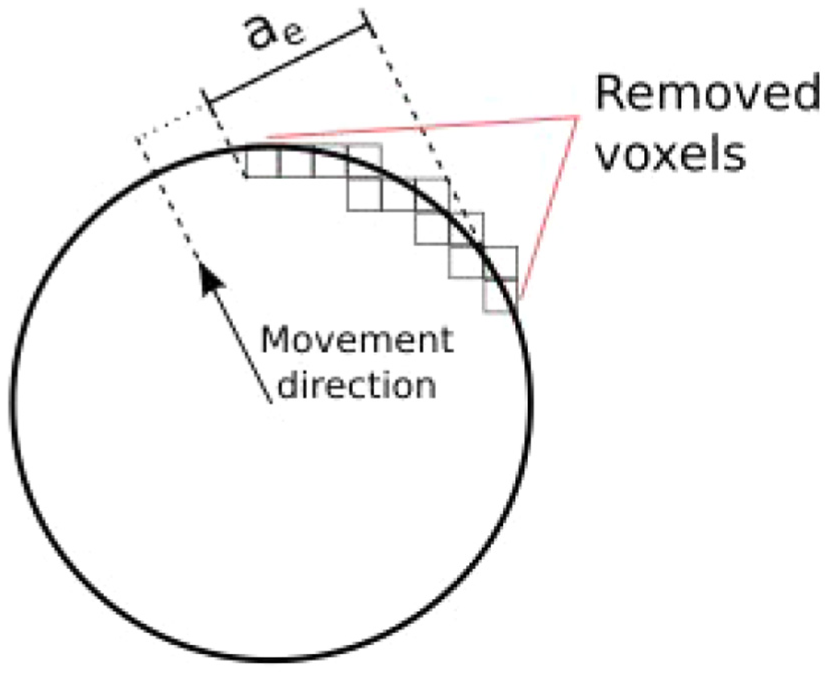
Calculation of the ae value, which uses the positions of the rightmost and leftmost removed voxels.
The proposed architecture allows the system to undo one or more steps related to the movement of the tool, restoring a previous state. This ability is essential for the tool path generation algorithm proposed in this article. The number of steps that can be undone is limited by the system memory and, in order to limit the memory usage, a garbage collector module was implemented to free memory when certain parts of the path are not modified.
Localized Voronoi mountain gradient mesh
The proposed algorithm requires the generation of the Voronoi mountain of the pocket geometry57–59 (Figure 17).
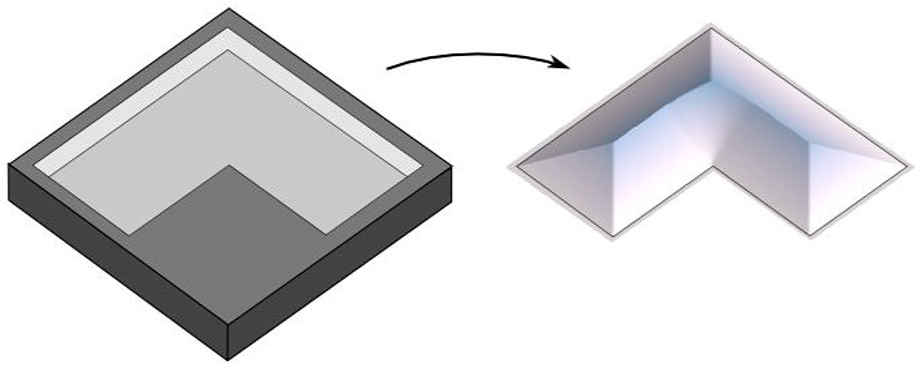
An L-shaped pocket and its Voronoi mountain.
The used algorithm was described in Ochoa González and Ferreira, 60 where a grid is formed by some rectangular cells stored in a structure in which every cell has one or more related boundary lines (or ‘sites’), including all the sites that are nearest every point in the cell.
This grid is obtained through the following procedure: (a) the endpoints of every pocket boundary are used to subdivide the cells, forcing all end points to coincide with cell corners; (b) the distance from every cell to the pocket boundary lines (or sites) is determined, keeping all those who apply as the nearest site to some of the points in that cell; (c) if there are two or more related sites, the cell is subdivided and the process is repeated with the obtained cells, else the cell is not altered.
The output of this process is a selectively refined mesh containing the following information for each cell: the minimal distance to a boundary element, an approximate Voronoi mountain gradient and a list of the nearest sites, enabling a fast point-to-boundary distance calculation.
Power-aware tool path generation algorithm
The direction-parallel and CP tool path strategies61,62 do not usually keep the ae value constant (or even constrain ae to a specific range), especially for complex pockets. Thus, in order to provide some control of the ae value, the following algorithm is proposed:
The ap value and the number of passes are selected, based on the depth of the pocket and the characteristics of the tool. In the test setup, the value used for ap corresponded to the largest ap that divided the total pocket depth in equal cuts. Thus, for a pocket depth of 8 mm, ap = 2 mm (four equal cuts).
Using this ap value and either the power requirement graph Pcut (for a tool path limited by the power requirement, Figure 4) or the specific cutting force (for an energy-efficient tool path, Figure 5), the value of ae that will result in the desired power/energy, called aetarget, is calculated.
The aetarget value is used as an upper limit, and a lower limit value is established (aemin). For the example tool paths presented in this article, a value of aemin = (aetarget − 2 mm) was used.
The tool uses a helical path to start the cut. This helix is centred in some of the highest points of the Voronoi mountain.
After the tool enters the workpiece, the tool path is built by adding path segments, evaluating the ae value and modifying the segments if necessary. Initially, starting from the tool entry point, the tool path is pointed towards a direction descending from the Voronoi mountain. The tool feed direction is measured always relative to the Voronoi mountain height map, with three possible directions: (a) neutral (perpendicular to the gradient), (b) ascending (positive to the gradient), and (c) descending (contrary to the gradient) (Figure 18).
The tool advances in the direction given in the last step.
If this movement takes the tool out the pocket, a step is undone, and the direction is made neutral. The algorithm jumps to step 6. In order to evaluate the tool-boundary interaction, the minimum distance between the centre of the tool and the pocket boundary is compared with the tool radius. This process is accomplished using the previously obtained Voronoi mountain.
The removed material and the ae value are calculated, and these values are used to determine (a) the required cutting power Pcut (with the Kienzle equation –equation (2)) and (b) the modified mean chip thickness hm.
If the ae value is larger than aetarget, a number of steps (njumpback) are undone, and the direction is made positive. On the other hand, if the ae value is lower than aemin and the tool is not in contact with the pocket boundary, a number of steps (njumpback) are undone, and the direction is made negative. Those steps backwards allow a tool path with limited curvature, by changing the direction before the limits are attained, as shown in Figure 19.
If the ae value is in the High Critical Range, the direction is modified to a positive value, but no steps are undone (Figure 19(b)).
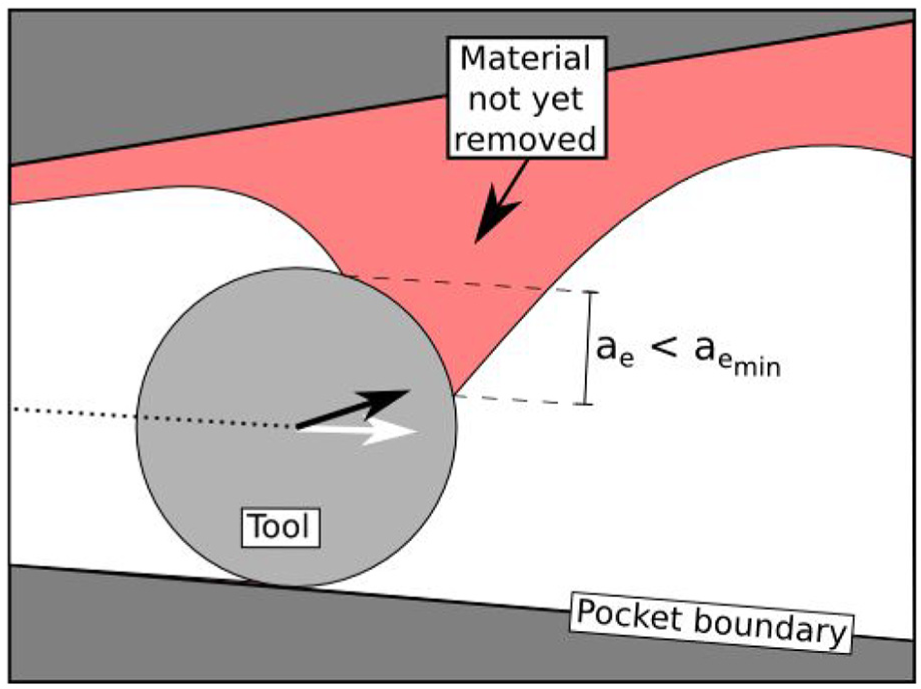
If the ae value is in the Low Critical Range, the direction is modified to a negative value, but no steps are undone (Figure 19(d)). This rule has an exception: if the tool is in contact with the pocket boundary but the material not yet removed is on the other side of the tool, the direction is modified to a more positive value as shown by the black arrow in Figure 20. Again, in order to evaluate tool–boundary interaction, the minimum distance between the tool centre and the pocket boundary is compared with the tool radius.
If a complete loop in contact with the boundary of the pocket is detected, end the tool path generation, else go to step 6.
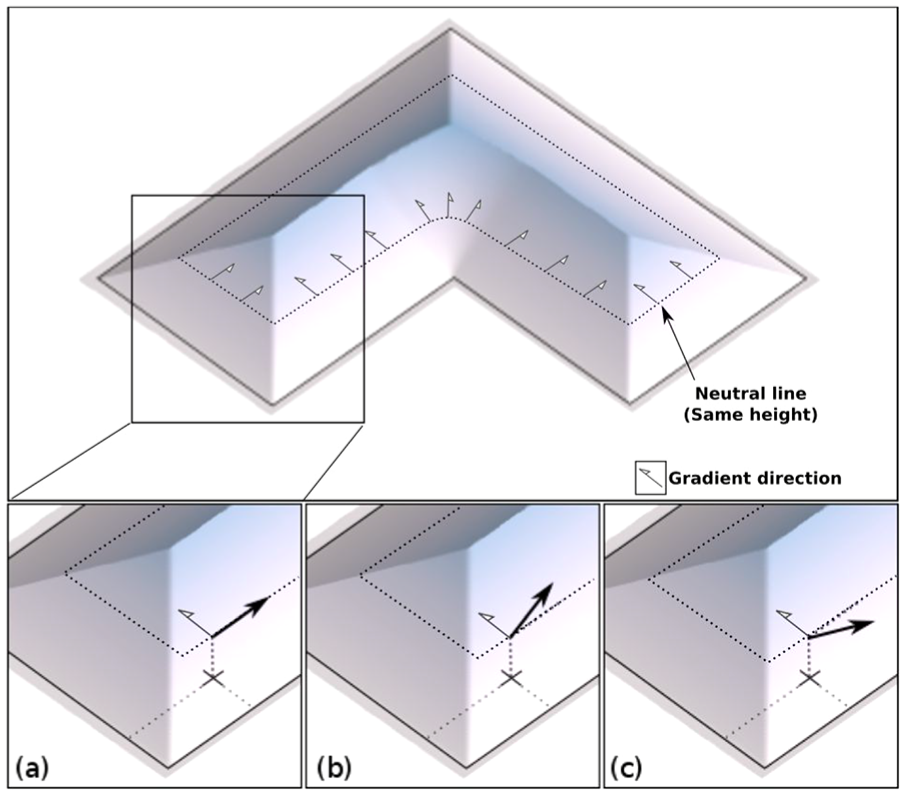
Directions of the Voronoi mountain: (a) neutral, (b) ascending and (c) descending.
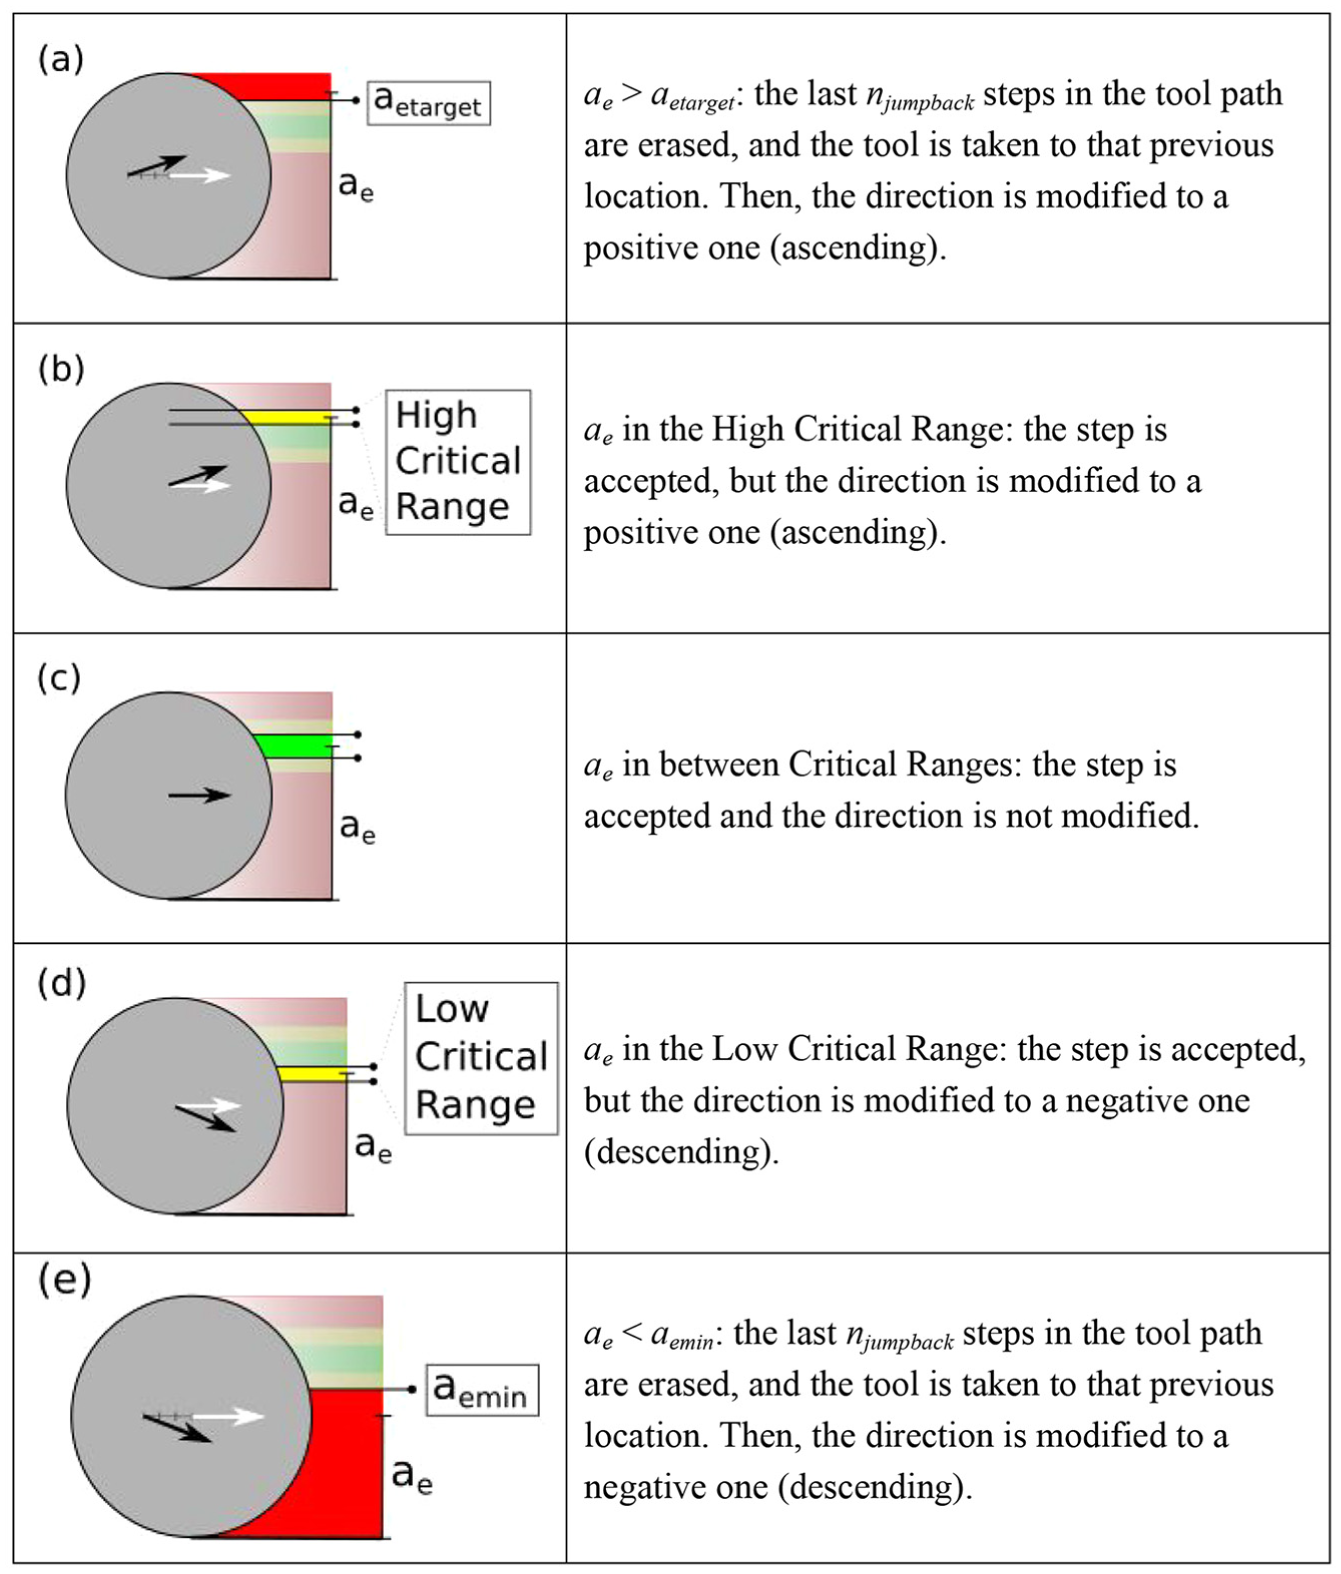
Steps 9, 10 and 11 of the power-aware tool path generation algorithm.
Step 11 exception: moving the tool away from a machined wall.
Generated tool paths for the example pocket
The proposed algorithm was implemented in the Python 63 language, and an important library that was used in the development of the system was NumPy. 64 The algorithm was used to generate power-aware tool paths to mill the flat bottom pocket with two islands shown in Figure 21.
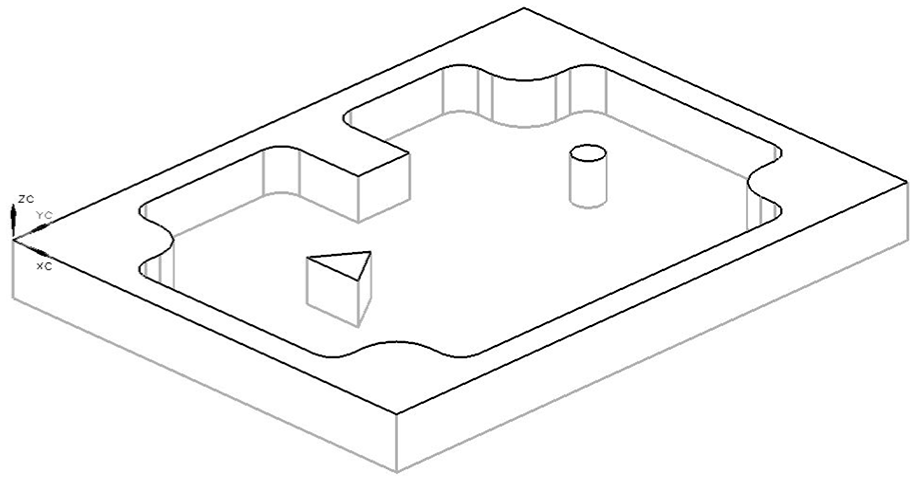
Machined test pocket.
The following upper limits of ae were used to generate the tool paths: 14.0, 16.0, 18.0 and 19.6 mm (these test points are shown in Figures 4 and 5). A constant axial depth of cut ap = 2.0 mm was used in the tests. By examining the graph in Figure 4, the maximum power requirement should be 1460, 1690, 1930 and 2212 W, respectively.
The resulting power-aware tool paths are shown in Figure 22, while Figure 23(a) and (b) shows two CP tool paths (ae equal to 18.0 and 14.0 mm, respectively), both generated using Siemens NX 7.5 software. Finally, Figure 24 shows a trochoidal tool path generated using the algorithm proposed in Ferreira and Ochoa González. 59 It should be pointed out that, in all the tool paths generated, the tool enters the workpiece in a helical path. In this way, after the tool enters the pocket, the material that has not yet been removed is the same in all tool path strategies. The place of entry usually corresponds to one of the highest points of the Voronoi mountain. In every case, the CPU time to generate the tool paths was about 200 s in an i5 processor computer.
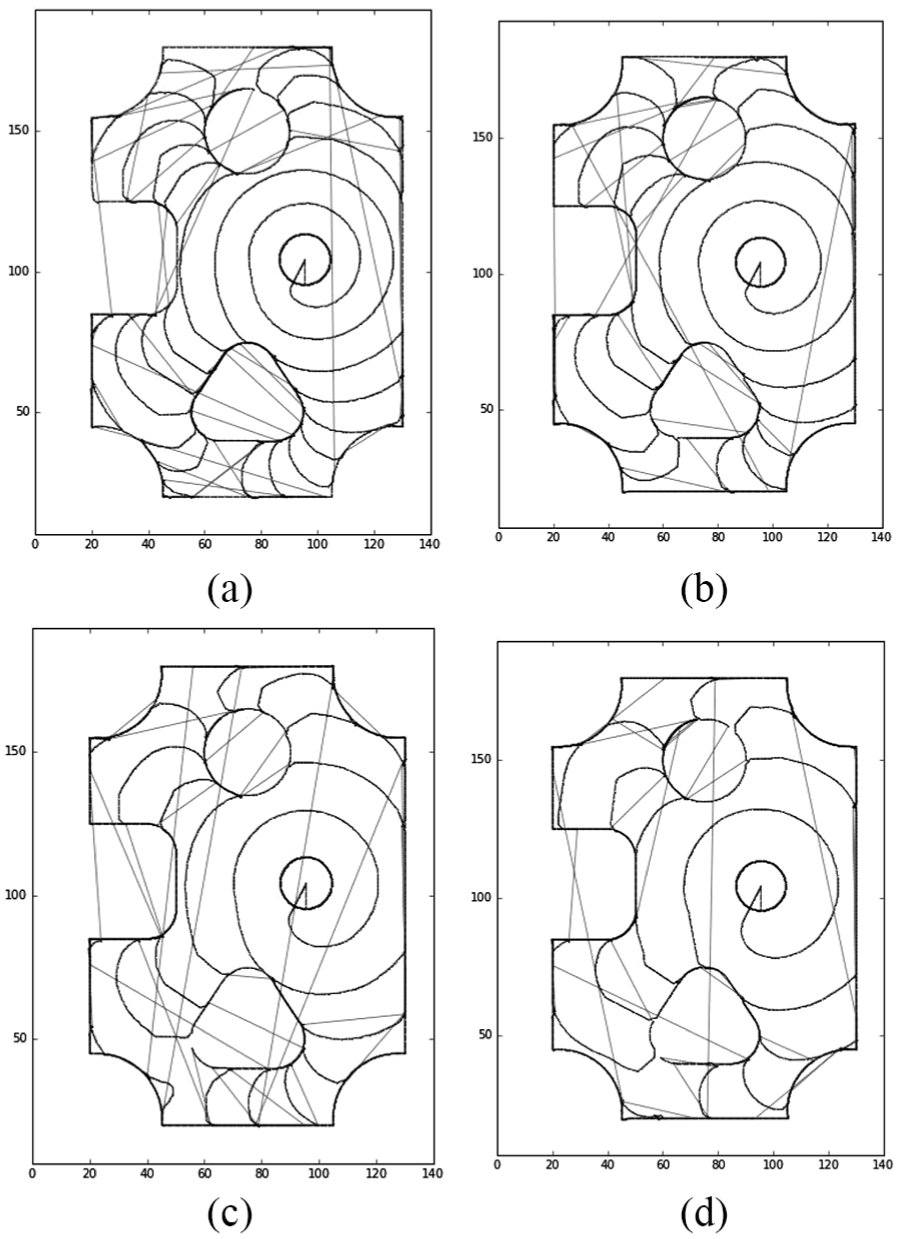
Generated power-aware tool paths for different ae values: (a) 14 mm, (b) 16 mm, (c) 18 mm and (d) 19.6 mm.
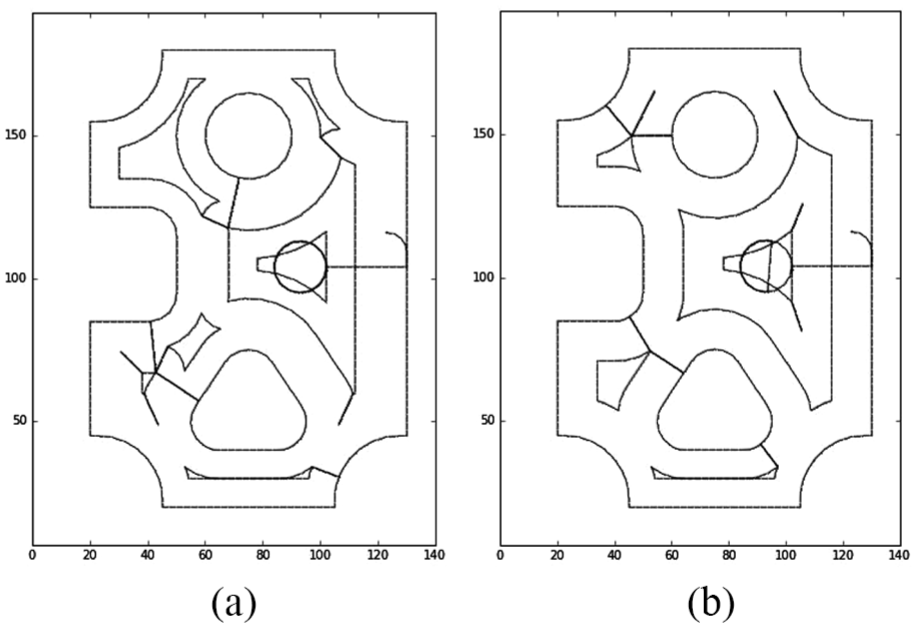
Generated contour-parallel tool paths using Siemens NX 7.5 software: (a) ae = 18 mm and (b) ae = 14 mm
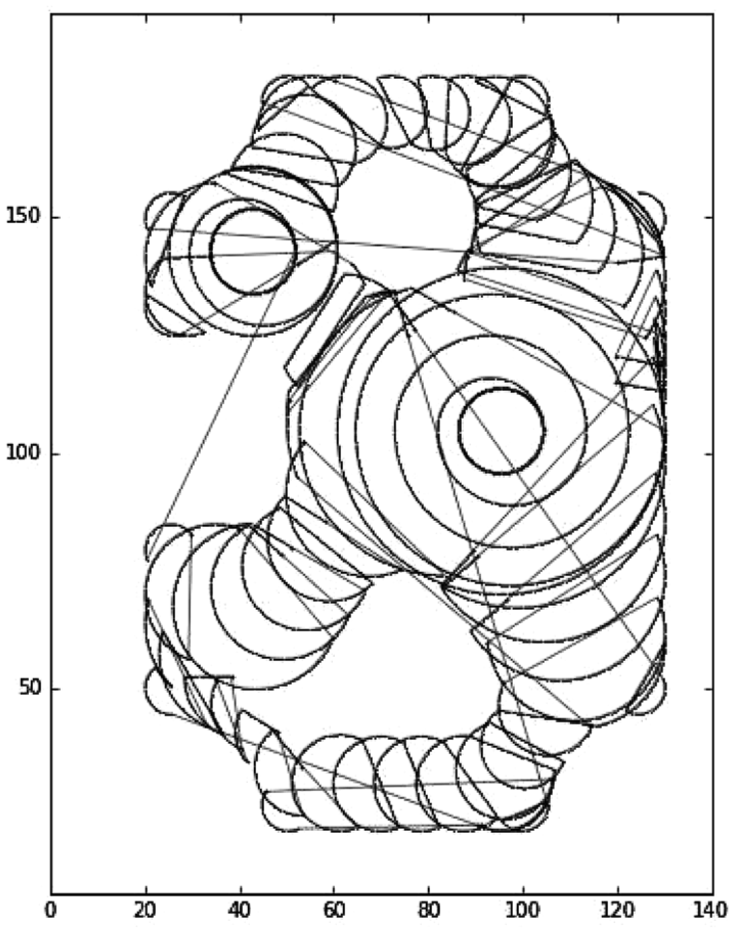
Generated trochoidal tool path using the algorithm proposed by Ferreira and Ochoa 59 (ae = 18 mm)
The generated tool paths were analysed using the VMS. Histogram plots of ae for the tool paths in Figures 22–24 are presented in Figure 25. It can be noticed in the graphs of Figure 25 that the proposed algorithm generates tool paths in which the largest amount of cutting segments have an ae value below the desired target, while the traditional CP tool paths have most of its ae values exceeding the target ae value. On the other hand, the trochoidal tool path is capable to meet the target ae value, but it produces more cuts with small ae values, which, as shown in Figure 6, will result in higher values of specific cutting force.
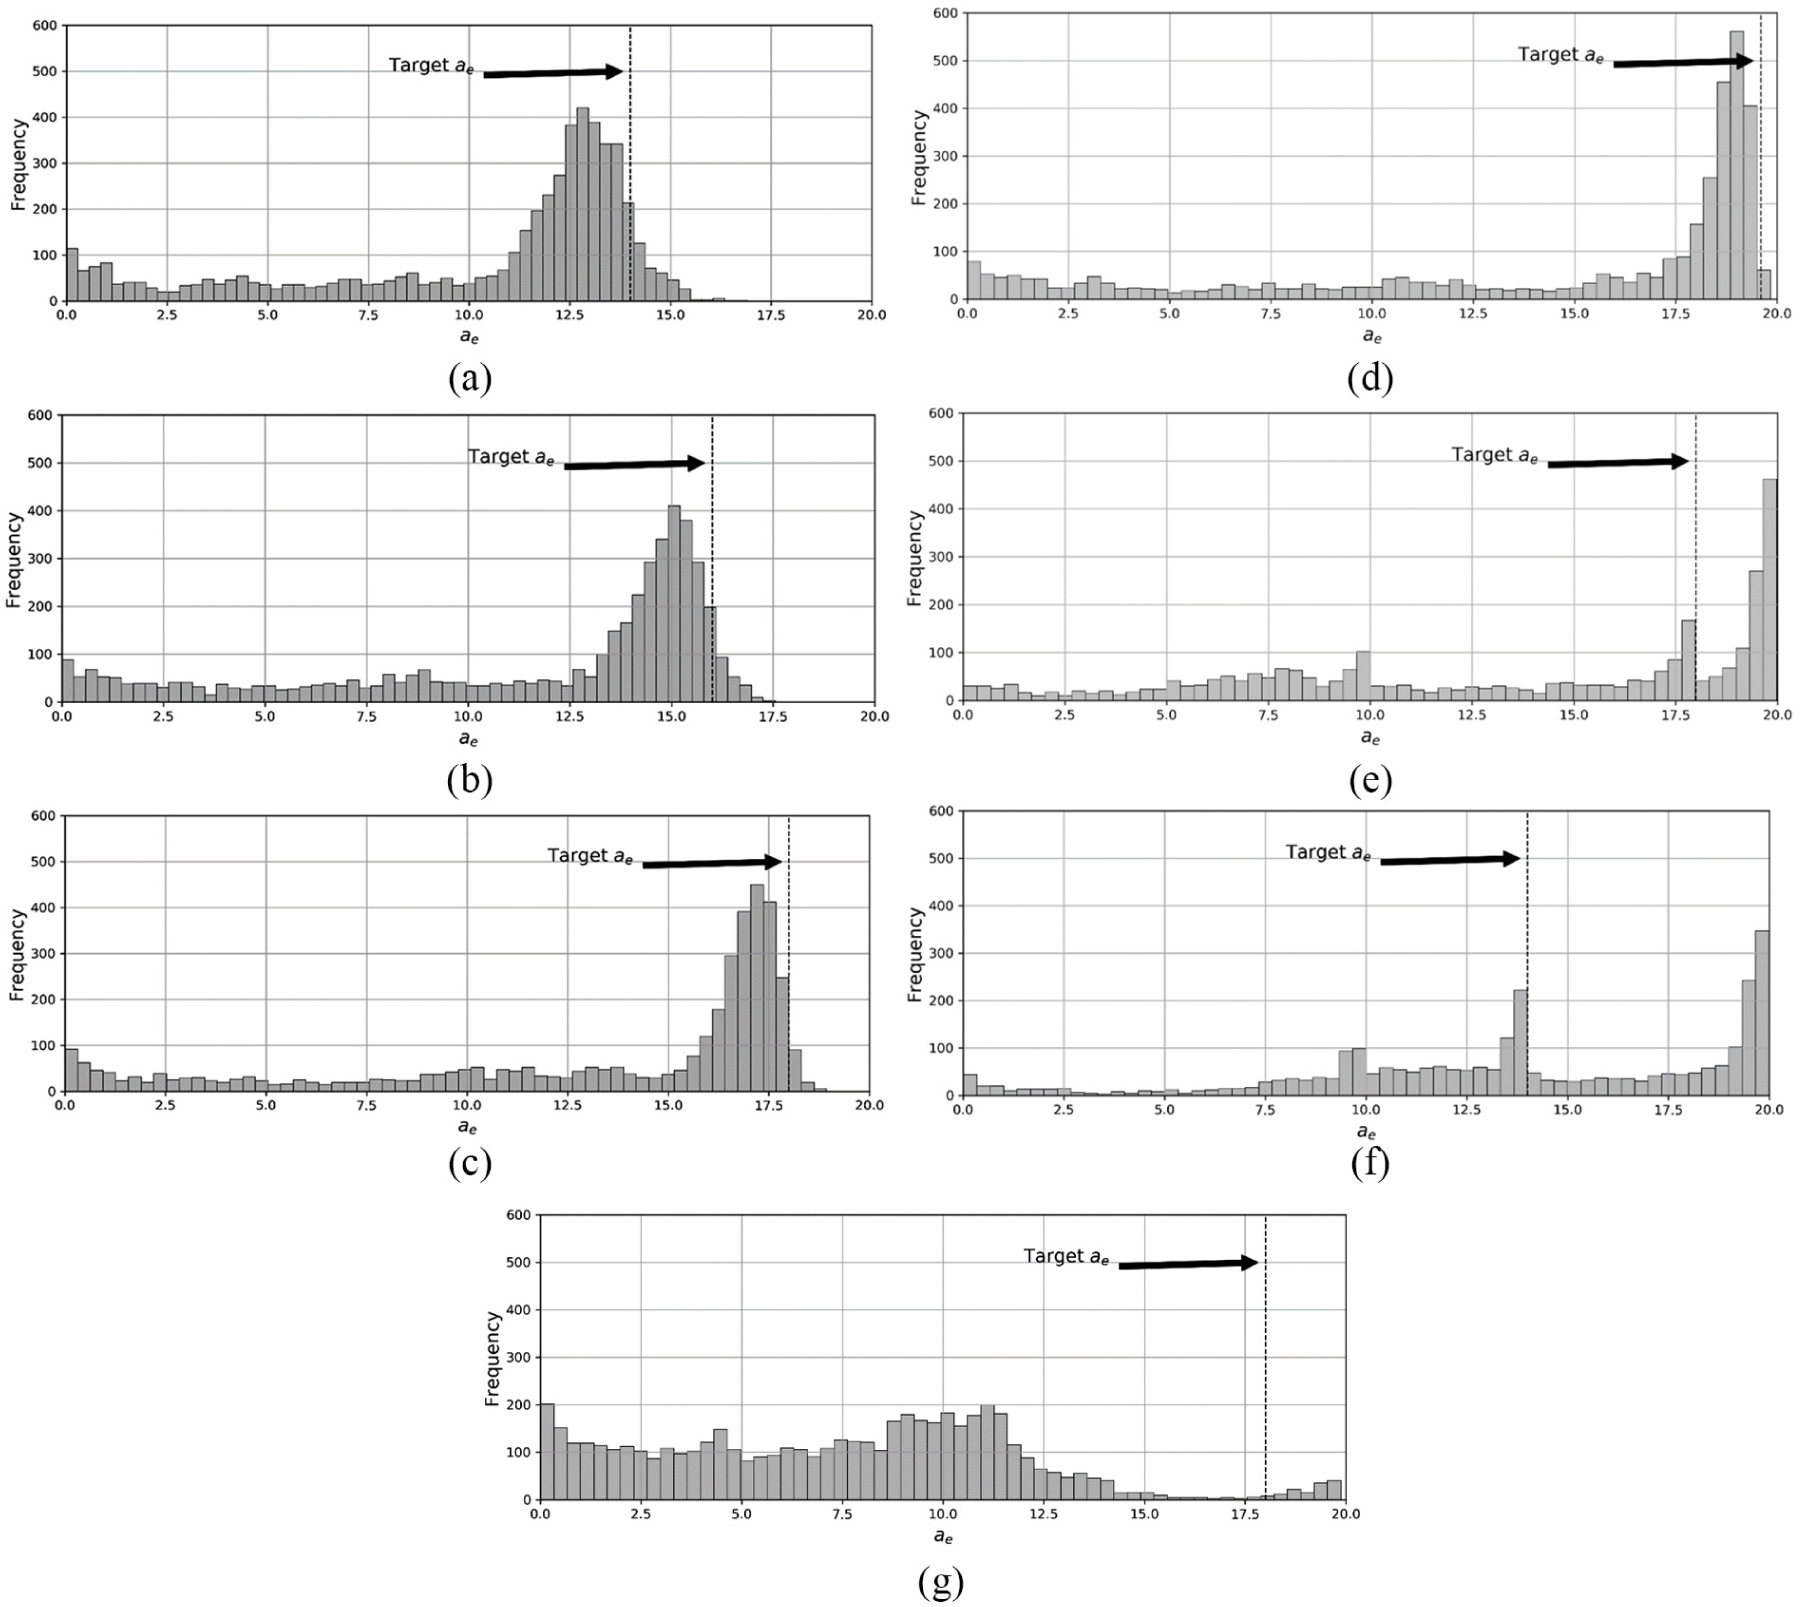
VSM generated histograms of ae counts for each tool path shown in: (a) 14.0 mm, (b) 16.0 mm, (c) 18.0 mm, (d) 19.6 mm, (e) contour-parallel (ae = 18.0 mm), (f) contour-parallel (ae = 14.0 mm) and (g) trochoidal (ae = 18.0 mm).
Experimental results
The parts were machined using all the obtained tool paths, and during the process, the NC program (G-code) line number, tool position and power consumption were recorded. The tests were carried out in 300 × 200 × 50 mm3 P20 tool steel parts (same material used in the previous tests), and cutting was carried out in dry condition.
For each tool path used to mill the pocket, one replicate experiment was conducted, and the resulting Pcut + Pfeed values were averaged. The obtained data were analysed in order to identify the higher power peak. By numerically integrating the area below the Pcut curve, the total cutting energy Ecut was calculated. Finally, the specific cutting force was obtained by dividing the Ecut value by the total removed material volume. Also, the specific cutting force (corresponding to Pfeed and Pcut) was obtained by numerically integrating the area under the power graph and dividing the result by the total removed material volume. The results are presented in Table 2 and Figure 26.
Pocket milling tool path results.
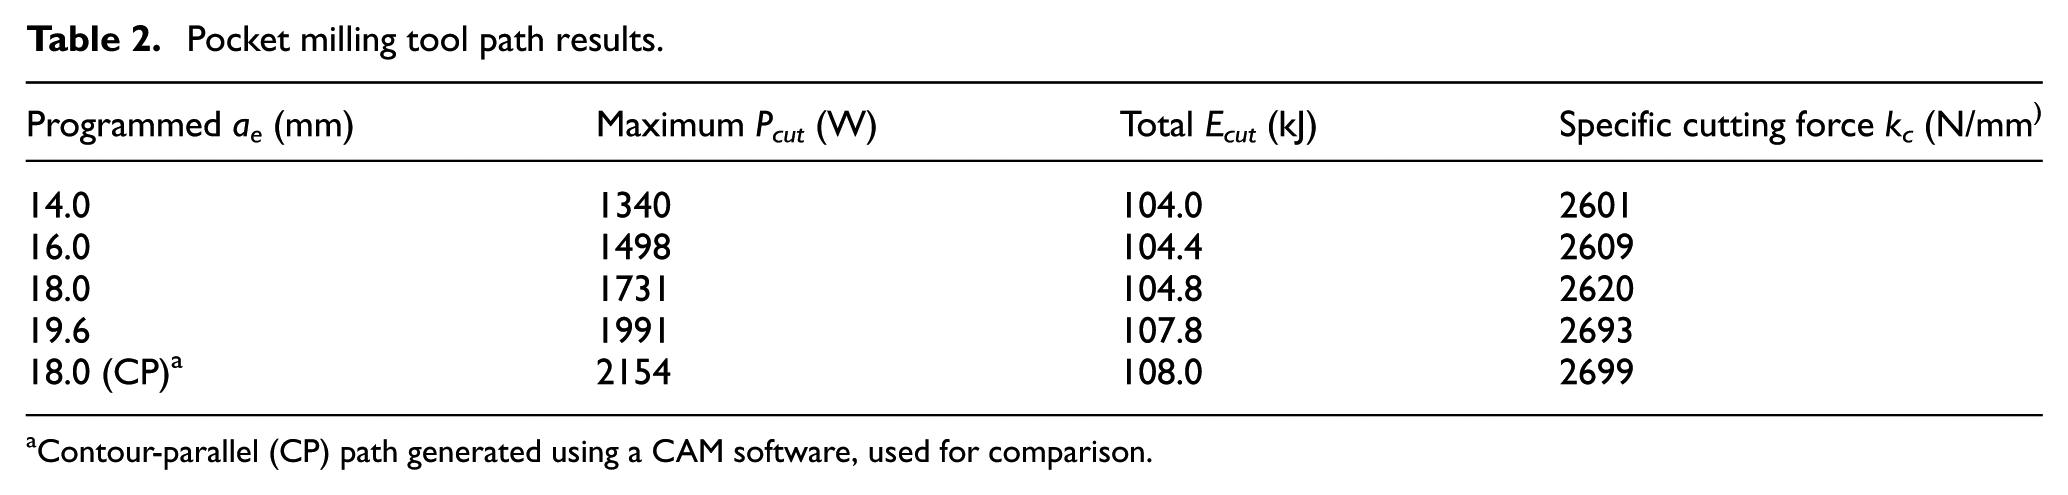
Contour-parallel (CP) path generated using a CAM software, used for comparison.
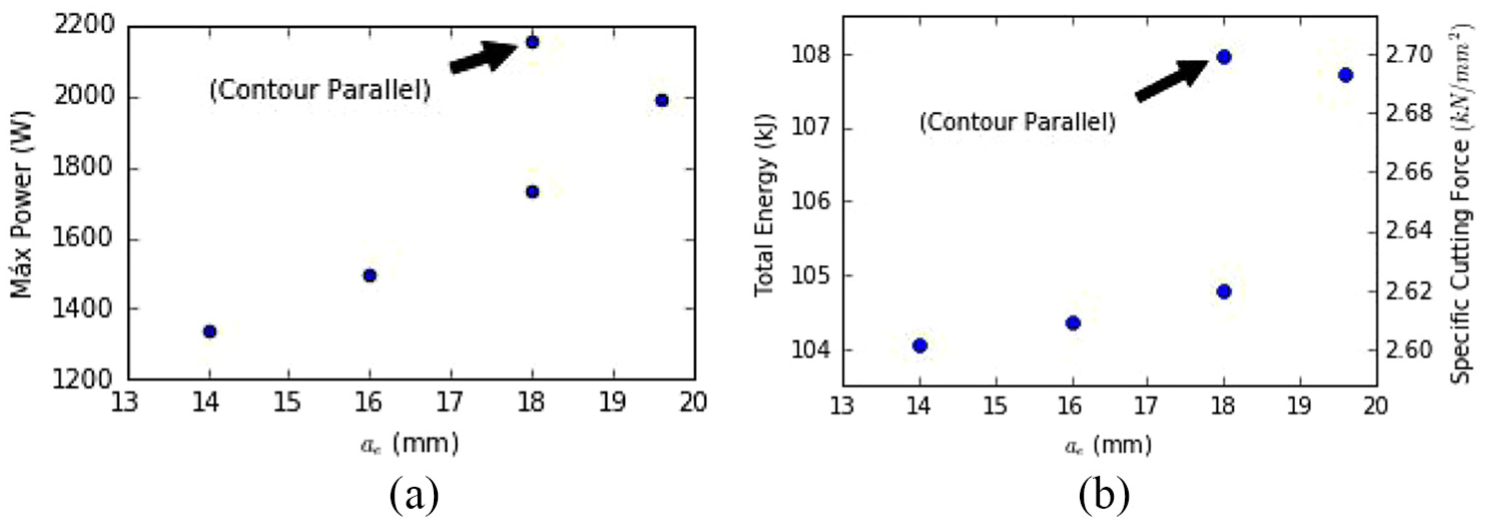
Pocket milling tool path results: (a) average Pcut and (b) average Ecut and calculated kc.
It can be noticed that the tool paths generated by the proposed algorithm achieve lower values of maximum Pcut compared with the CP tool path with ae = 18 mm. However, it is important to emphasize that these values correspond only to the cutting energy. Considering the Pidle value and the fact that the CP tool path processing time is shorter than the machining time of the proposed method, the CP tool path leads to a lower value of the total energy consumed.
In Figure 27, three process power consumption graphs are presented for the tool path shown in Figure 22(c). Figure 27(a) shows the power consumption measured directly at the machine, while Figure 27(b) illustrates the power requirement graph resulting from the VMS. Figure 27(c) depicts the power consumption by the machine operating without machining the part (it includes motor usage).
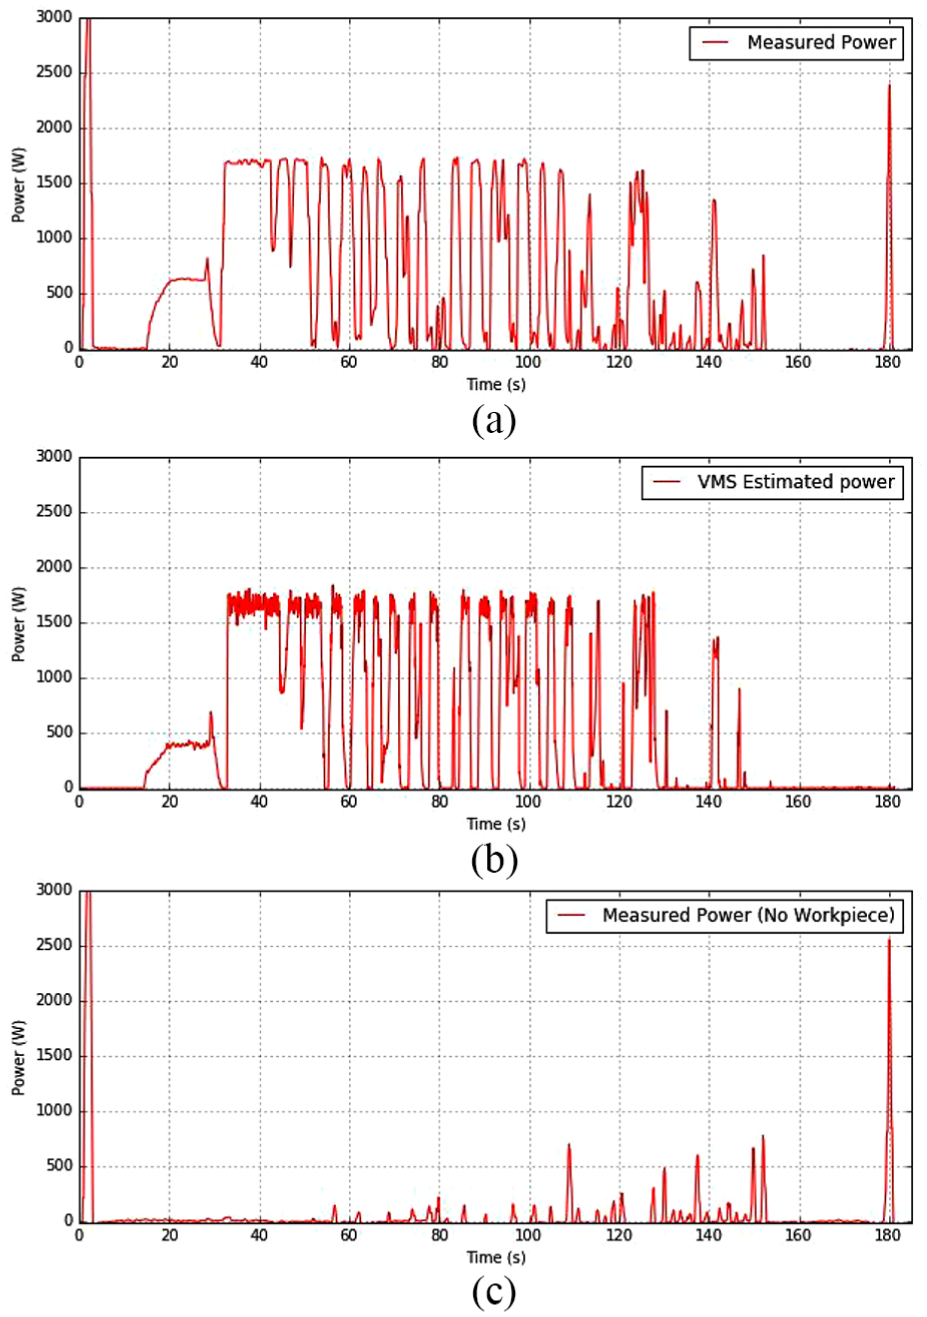
Power consumption graphs: (a) actual milling, (b) simulated by VMS and (c) no machining (measured).
Conclusion
In this work, a system for generating power-aware tool paths was proposed, which is based on the power consumption estimation along every tool path segment. Since CAM software usually does not generate tool paths that take power consumption into account, it is important to carry out researches that seek to generate such tool paths due to the need to reduce energy consumption in manufacturing systems.
Based on the results obtained, the proposed method generates tools paths that have a lower in-process power consumption compared with the CP tool path strategy, but a longer machining time. Better energy efficiency can be obtained by selecting an adequate value of ae and its management along the tool path. However, as the gain is relatively small, the global efficiency could be worsened because the processing times are usually longer.
The proposed VMS system and its calibration by using the data from experimental tests can be used to have an estimation of the needed process power.
It is suggested as a future work the assessment of other tool path generation algorithms that use the proposed VMS. It is also suggested extending VMS to evaluate the power requirement in four and five-axis milling tool paths. As it is possible that the consideration of ae and ap will not be sufficient to characterize properly the cutting geometry, some other parameters could be included. Also, it is suggested the machining of harder materials (e.g. hardness of about 55 HRC), which are also commonly used in dies and moulds, since the cutting power will be higher than the one obtained for the less hard material (31 HRC) machined in this work, and compare the total energy consumption with traditional tool path strategies such as CP. Finally, it is suggested to investigate the use of mechanistic modelling of cutting forces65,66 for the generation of power-aware tool paths.
Footnotes
Declaration of conflicting interests
The author(s) declared no potential conflicts of interest with respect to the research, authorship, and/or publication of this article.
Funding
The author(s) disclosed receipt of the following financial support for the research, authorship, and/or publication of this article: This work was supported by the National Council for Scientific and Technological Development (CNPq) of Brazil.