
Abstract
Mechanical micro-machining of Ti6Al4V is finding great demand because of its wide range of application in various fields such as communication, optics and biomedical devices. Increasing demands on functioning and performance requires components to be free from burrs after the machining process. Presence of burrs on micro-mechanical parts or features significantly affects quality and proper assembly of the parts. Also in micro-machining, the size of burr is comparable to that of micro-features. Since the formation of burr is inevitable in any machining process, generally the deburring operation is performed to remove burrs. Burr thickness is one of the important parameters which describe the time and method necessary for the deburring operation. Burrs on micro-parts are generally characterized using scanning electron microscope, which is a time-consuming, costly and non-value-added activity. However, a proper mathematical model will help predict burr thickness easily. In this article, a mathematical model to predict burr thickness during micro-end milling of Ti6Al4V is presented. The proposed model was developed based on the principle of continuity of work at the transition from chip formation to burr formation. Ti6Al4V titanium alloy is one of the materials which generates segmented (saw-tooth) chips at low cutting speeds. Hence, initially an appropriate material constitutive model was selected based on better prediction of burr thickness. Then, to reduce the prediction error, machining temperature was evaluated for all experimental conditions and included in the model. From the initial study, it was found that Hyperbolic TANgent material model gives a better prediction compared to Johnson–Cook material model. Later, after including machining temperature into the model it was observed that the prediction error was reduced. The proposed model was validated with the experimental results.
Keywords
Introduction
Conventional milling and micro-milling operations are used in various fields such as the production of dies and molds used in the injection molding of micro-fluidic devices and manufacturing of micro-channels. 1 Formation of burrs in any machining operation is inevitable and also the removal of these burrs calls for additional operation such as deburring. 2 Burr removal is a non-value-added activity 3 and the removal of the micro-burr is very difficult. 4 Micro-features/components, especially in the field of optics, communications, biomedical devices and medicine demand burr-free components. Hence, burr formed during the micro-milling process is widely being studied within the research community. Even though burr produced during the micro-end milling process is small, it causes blockage of micro-channels and proper assembly of micro-parts. Also, the removal of micro-burrs is very difficult compared to burrs on macro-parts. Hence, modeling and control of burr formation during micro-end milling is very important.
A number of studies have reported on the investigation of burr formation during conventional and micro-end milling/machining process. Olvera and Barrow 5 analyzed the formation of exit and top burr in the macro-milling process. Lin 6 has done an investigation on burr formation and tool chipping. Gillespie and Blotter 7 have described four different types of burr during machining such as poisson burr, rollover burr, tear burr and cutoff burr. Chern and Dornfeld 8 defined five different types of burrs during face milling of aluminum alloys such as wave-type, curl-type, knife-type, edge breakout and secondary burrs. Vipindas et al. 9 and Jaffery et al. 10 studied the effect of the process parameters on burr formation and surface roughness during micro-end milling of Ti6Al4V. Lee and Dornfeld 11 performed optimization of cutting parameters to minimize burr in a face milling operation. Taguchi method was used for the optimization of cutting parameters for minimum burr height. Also artificial neural network was constructed to predict the burr type.
Mathai et al. 12 have developed a model to predict burr width and analyzed the effect of machining parameters such as spindle speed, feed, tool wear, backing material and adhesive used to attach the foil to the backing material on the burr height during the micro-milling process. It is also suggested that burr formation in a thin material depends on the mode of cutting such as tearing or chip formation. Lekkala et al. 1 studied the influence of the process parameters on the formation of various types of burrs during the micro-end milling process. They have also presented an analytical model to predict the burr height for exit burr. Kiswanto et al. 13 have done an experimental investigation on the effect of cutting parameters on surface roughness and burr formation during micro-milling. Analysis of variance (ANOVA) technique was used to establish the relationship between the cutting parameters and response variables. Presence of bottom burr was observed as the tool gets wear out. Niknam and Songmene 14 performed an experimental investigation to statistically determine significant cutting parameters influencing the burr size during the slot milling operation. It was found that the depth of cut, feed per tooth and tool nose radius are the most dominant process parameters on the burr formation. Ding et al. 15 suggested that in the micro-end milling process feed per tooth has a significant effect on the burr formation. Olvera and Barrow 16 and Tripathi and Dornfeld 17 studied the influence of the workpiece exit angle on burr formation.
Niknam and Songmene 18 have presented an analytical model for the thickness of the burr produced during end milling of ductile materials considering the influence of cutting force on burr formation. Zhang et al. 19 developed a model to predict micro-exit burr height. It was observed that the ratio of undeformed chip thickness to cutter edge radius significantly affects the poisson burr height and minimum burr height was observed when the undeformed chip thickness-to-cutter edge radius ratio approaches one. Dong et al. 20 presented finite element modeling of burr formation in the end-face grinding process and developed online burr removal equipment. Ozel et al. 21 have done an experimental investigation to evaluate the performance of the coated and cubic boron nitride (cBN)-coated micro-end milling tool. Based on the observation of surface roughness, burr formation and tool wear, it was concluded that the cBN-coated tool delivers better performance during micro-milling of Ti6Al4V. Ko and Dornfeld 22 proposed a quantitative model of burr formation for orthogonal machining including fracture of the workpiece during burr formation.
Vyas and Shaw 23 have suggested that cyclic cracking is the root cause for the formation of saw-tooth chip during machining of hard brittle materials. Molinari et al. 24 have analyzed the dependence of cutting speed on the formation of adiabatic shear band during machining of Ti6Al4V. They have pointed out that the formation of segmented chips at low cutting speed is due to the deformation of adiabatic shear band resulting from weak thermomechanical instability. Bäker et al. 25 used a deformation model to simulate the segmented chip formation during the machining process by neglecting any fracture criterion. Calamaz et al. 26 proposed a material behavior model to analyze the chip formation during machining of titanium alloys known as Hyperbolic TANgent (TANH). The predicted chip morphology was found to be matching with the experimental results. Sima and Ozel 27 have investigated the influence of material behavior models on serrated chip formation during machining of Ti6Al4V. It was found that flow stress influences the chip formation mechanism, forces and temperature. They have recommended a modified Johnson–Cook (JC) material model, known as TANH, 26 for machining simulation of Ti6Al4V. It was also pointed out that between 300 °C and 700 °C flow softening is predominant and causes adiabatic shearing during machining of Ti6Al4V.
Ducobu et al. 28 also studied the formation of saw-tooth chip during machining of Ti6Al4V. It was found that TANH law is more suitable for the simulation of saw-tooth chip formation during machining of Ti6Al4V. Karpat 29 integrated the temperature-dependent flow softening behavior into the material constitutive model to simulate saw-tooth chip formation during machining of Ti6Al4V. It was found that flow softening initiates at around 350 °C–500 °C. Komanduri and Von Turkovich 30 also suggested the formation of segmented chips during machining of titanium alloys. According to Hua and Shivpuri, 31 chip segmentation during machining of Ti6Al4V is due to crack initiation followed by propagation inside the primary shear zone.
This article presents a mathematical model to determine burr thickness during micro-end milling of Ti6Al4V. Most of the burr modeling work was concentrated on machining of ductile materials 18 and used the JC material constitutive model to find out flow stress. Since Ti6Al4V generally generates saw-tooth chips at relatively small cutting speeds, 26 it is very important to use an appropriate material constitutive model for accurate simulation of the machining process. This study is organized in two phases. In phase 1, two material constitutive models, namely, TANH and JC, were used for the prediction of burr thickness. The main objective of phase 1 is to identify an appropriate material constitutive model which will give better prediction of burr thickness during machining of Ti6Al4V. In phase 2, the material model identified in phase 1 is used for the prediction of burr thickness. In order to reduce prediction error, the machining temperature under all experimental conditions was evaluated and included in the model. Since the end milling process cannot be considered as orthogonal machining, oblique cutting theory was used to determine strain, strain rate and shear band thickness which occurs during chip formation. Finally, the model was validated by the experimental results.
Analytical modeling of burr thickness
The following section explains the methodology and assumptions adopted to predict burr thickness under the given experimental conditions.
Methodology and assumptions
The methodology used in this study to predict burr thickness has been split into two phases. The first phase will be concentrated on determining an appropriate material constitutive model to be used for Ti6Al4V for better prediction of burr thickness. In the first phase, machining temperature is assumed to be constant as 800 K for all machining conditions. In the second phase, the material constitutive model found out from phase 1 will be used for burr thickness calculation and also the machining temperature in every experimental condition is calculated and included in the model. Finally, the results obtained in phase 2 are compared with the results obtained in phase 1 to show the influence of machining temperature on the burr thickness prediction and validated with the experimental results.
Phase 1 methodology
The methodology used in phase 1 to determine the appropriate material constitutive model is given below and also shown in Figure 1. The basic steps involved are as follows:
Assumptions used to simplify the analysis;
Analytical modeling of burr thickness;
Selection of material constitutive model. In phase 1, both JC and TANH material models are used. Material constants required for the JC and TANH models are adopted from the published literature; 32
Oblique cutting principle was used for the evaluation of all machining parameters;
Evaluation of strain;
Evaluation of shear band width in segmented chip and then finding out the strain rate;
Determination of flow stress using the JC and TANH material models;
Determination of burr thickness using the analytical model;
Experimental evaluation of burr thickness;
Comparison of experimental results with the predicted values based on the JC and TANH material models;
Finalizing the appropriate material constitutive model.
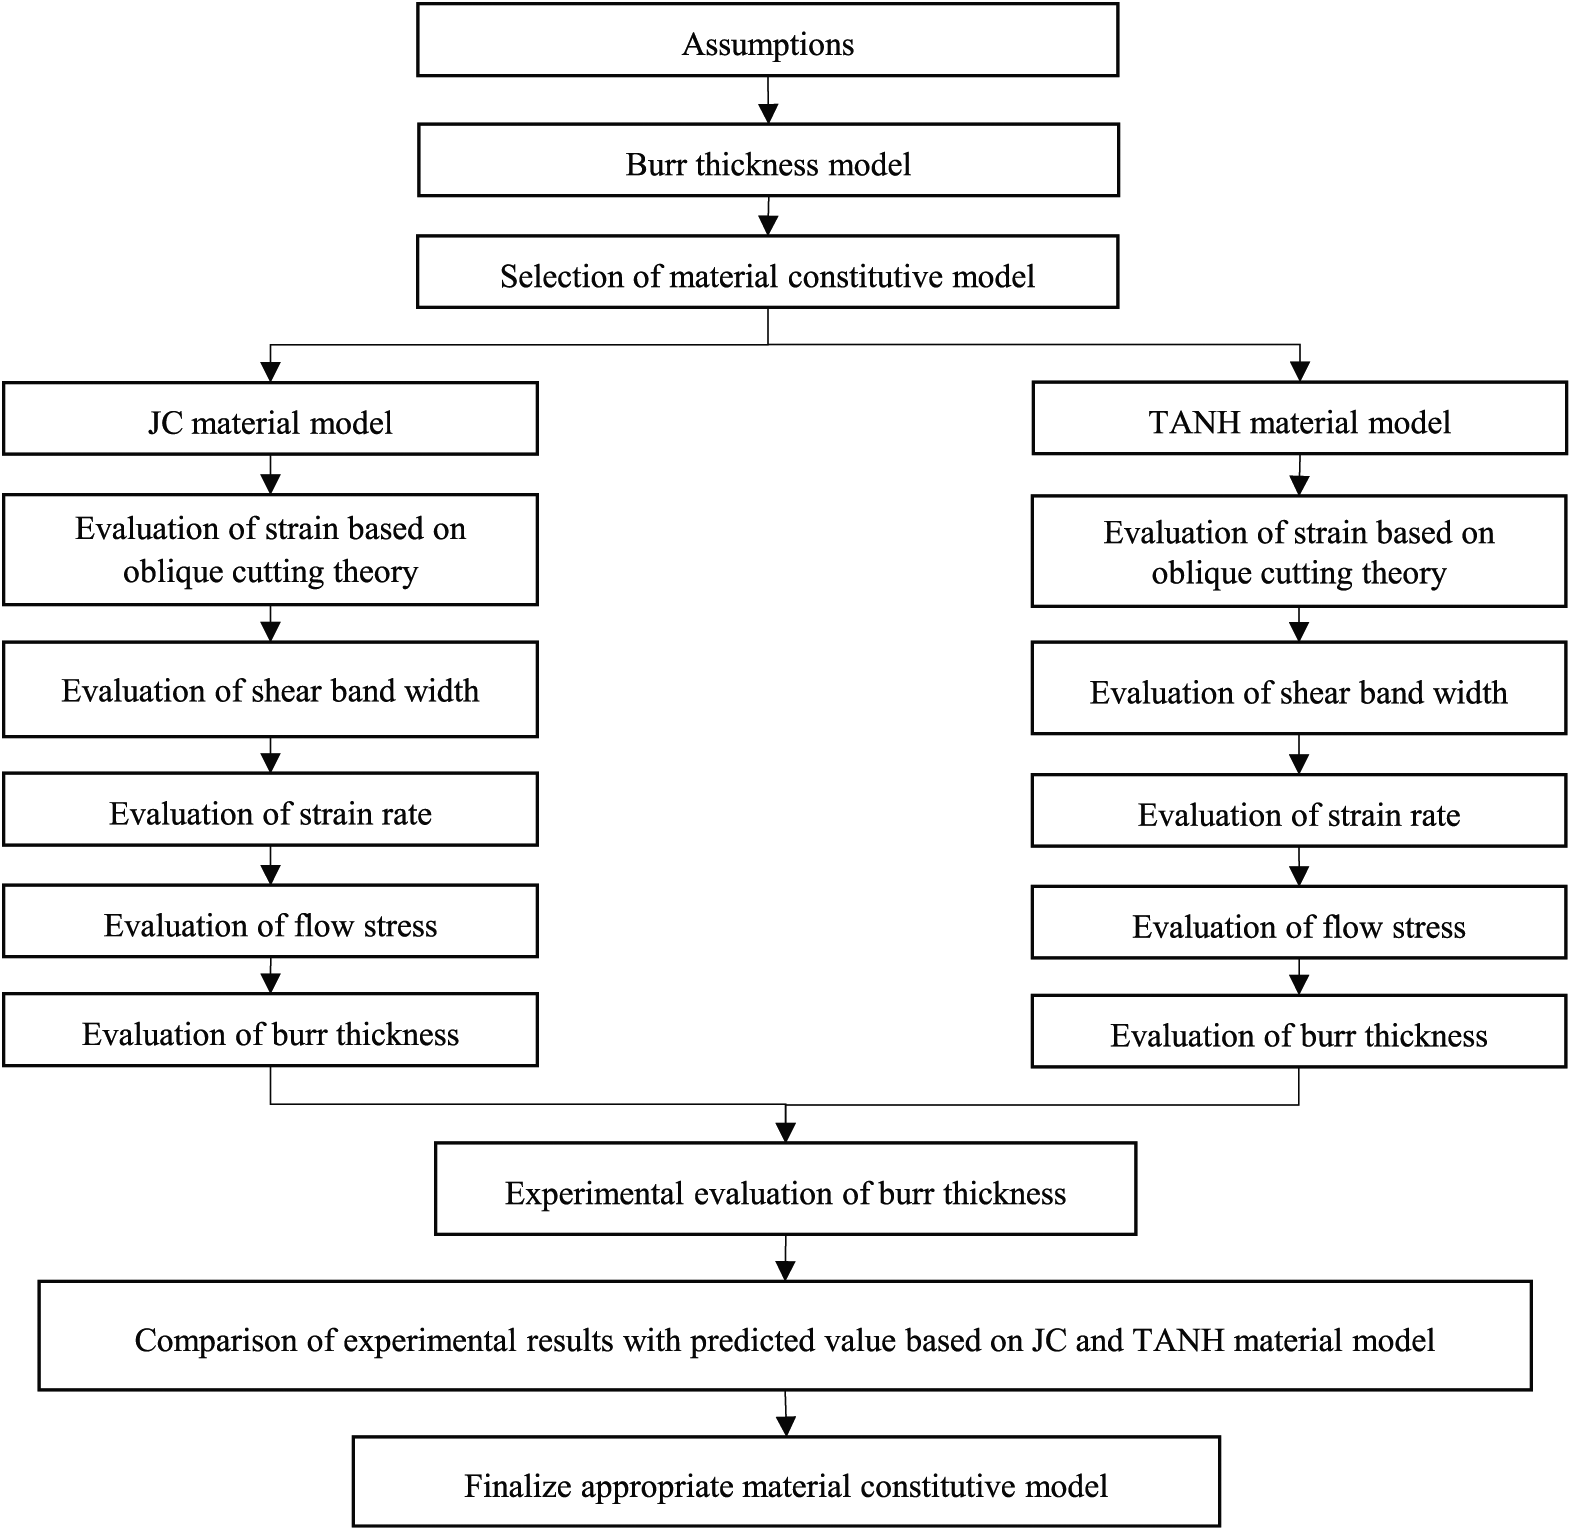
Phase 1 methodology flow chart.
Assumptions
Assumptions made in this study are as follows:
The model is based on the exit burr formation geometry.
In phase 1 of this study, temperature is assumed to be constant for all cutting conditions. Hence, the workpiece material properties are assumed to be constant for all the experimental conditions.
The tool engagement and the onset of plastic hinging happen simultaneously in the exit region.
The transition from chip formation to burr formation occurs at the transition point. Considering continuity of cutting force at the transition point, the work done for chip formation is equal to the work done for burr formation.
Work done for burr bending and curled chip of the burr at the exit region are ignored.
The value of initial negative shear angle is taken as 20°. 33
Inclination angle of cutting edge to cutting velocity is assumed to be equal to the helix angle of the tool. 34
Phase 2 methodology
Phase 2 mainly concentrates on including machining temperature on the prediction of burr thickness. The methodology used for phase 2 is given below and shown in Figure 2:
Selection of an appropriate material constitutive model from phase 1;
Evaluation of strain;
Evaluation of shear band width in segmented chip and then finding out the strain rate;
Determination of machining temperature;
Determination of flow stress using the appropriate material constitutive model obtained from phase 1;
Determination of burr thickness using an analytical model;
Experimental evaluation of burr thickness;
Comparison of experimental results with the predicted values and the predicted value with constant temperature assumption.
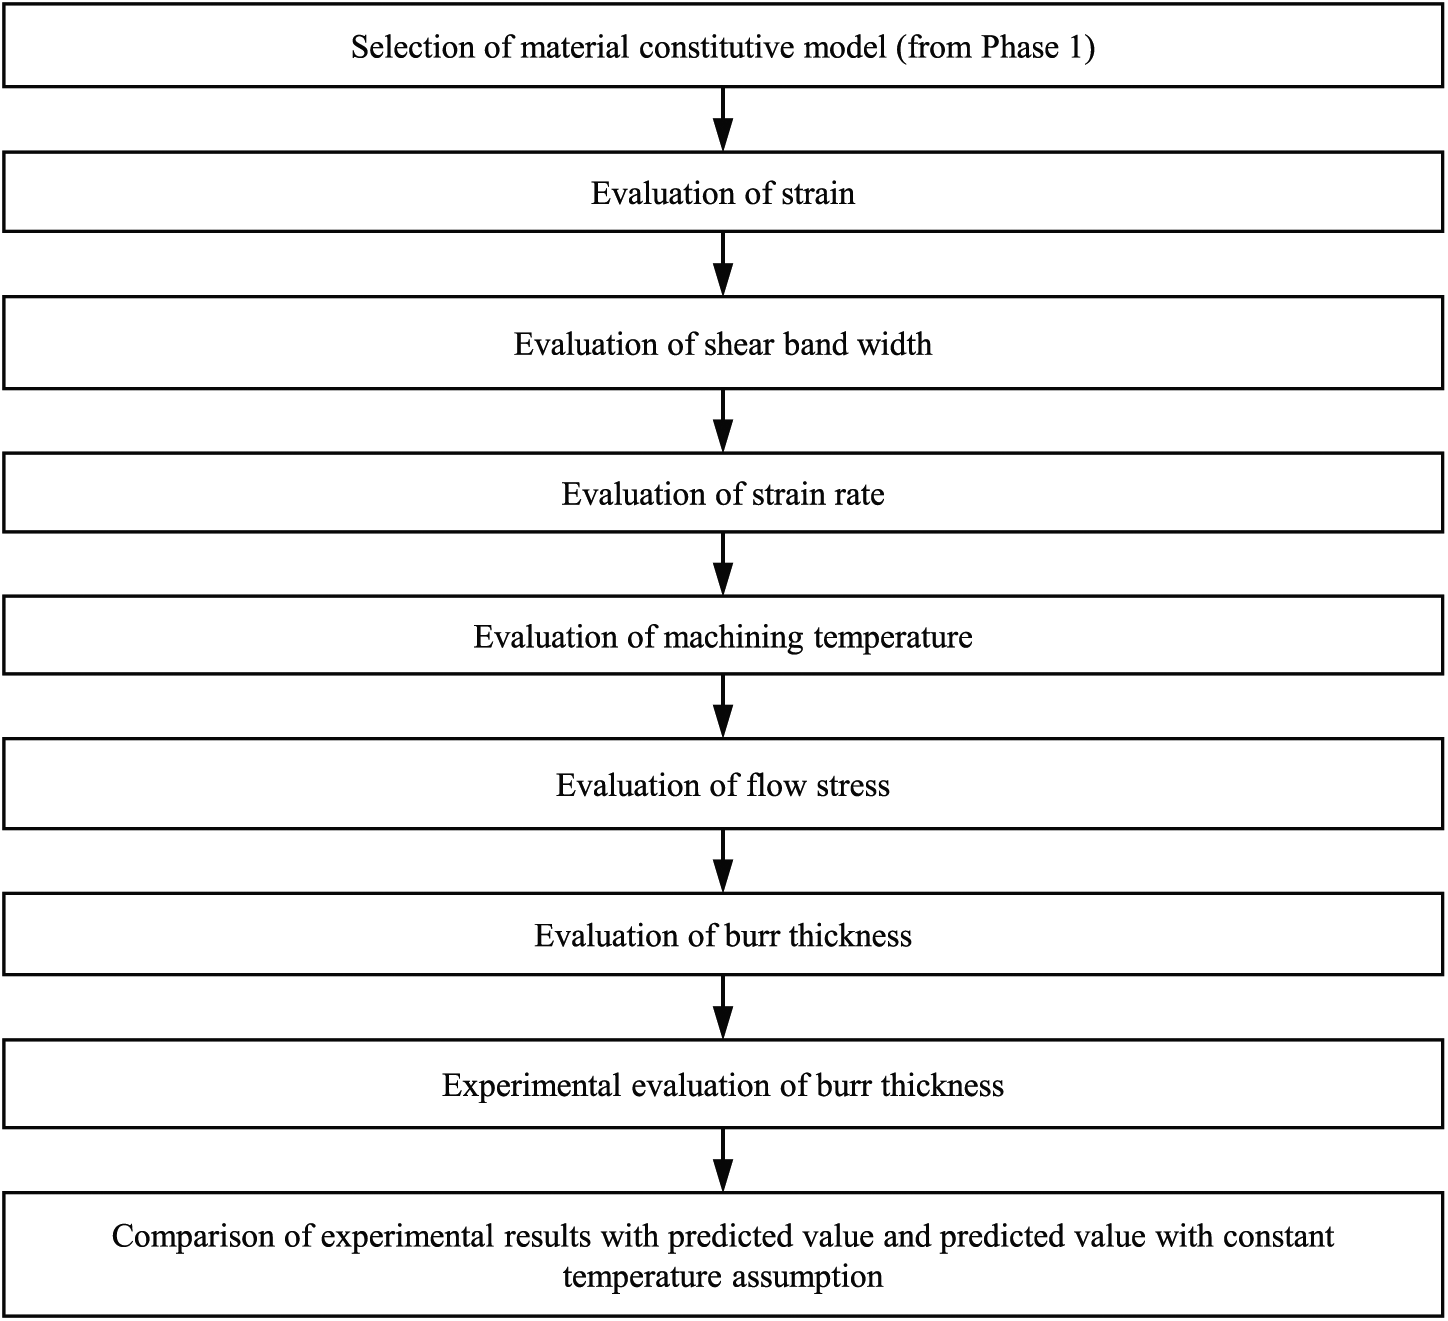
Phase 2 methodology flow chart.
In triangles APB and A′PB depicted in Figure 3, the burr thickness, PB, is equal to

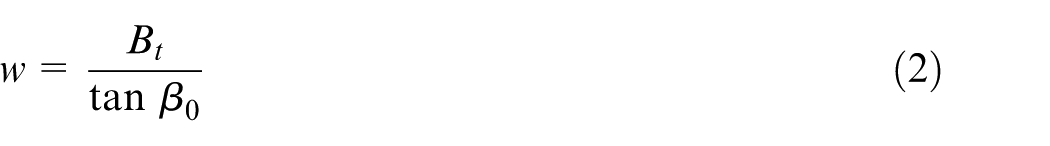
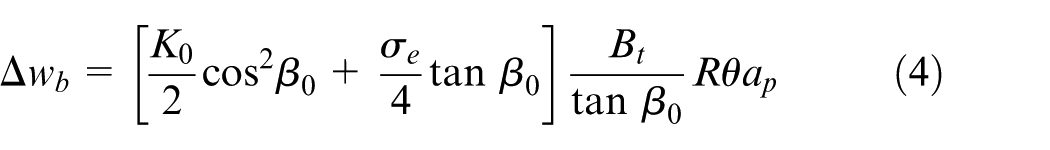
where β0 represents the initial negative shear angle. Ko and Dornfeld 33 have suggested that the value of β0 can be assumed to be 20° irrespective of materials and cutting conditions. From Figure 3, the total incremental tool distance traveled is Rdθ, where R is the cutter radius. Ko and Dornfeld 22 have proposed the energy required for burr formation during machining as follows
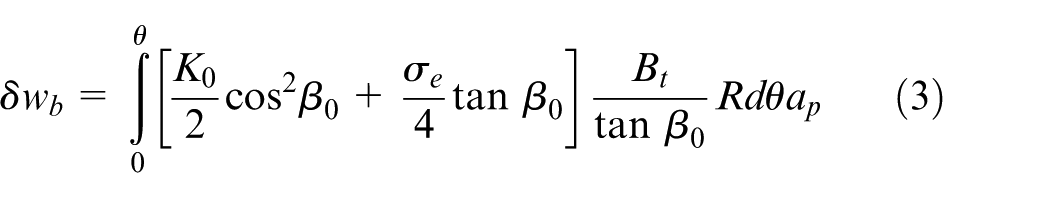
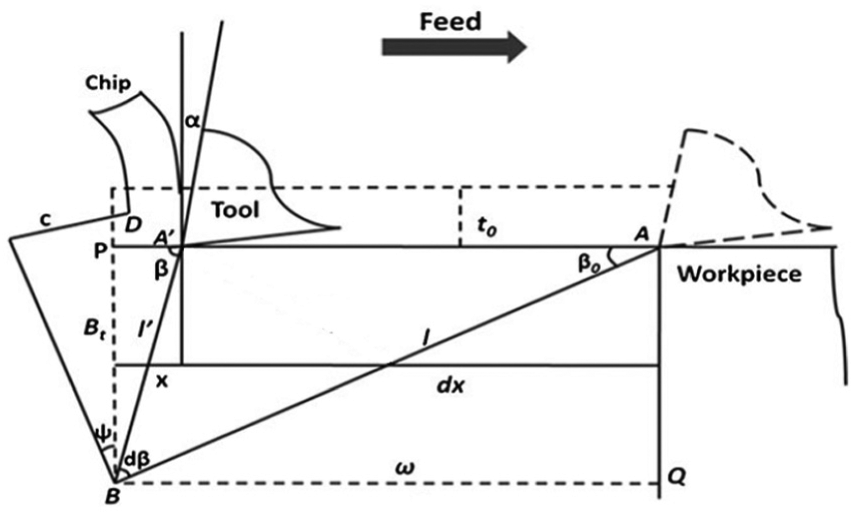
Geometry of burr initiation and formation. 22
Extending equation (3) to the transition point in the micro-milling exit region
where
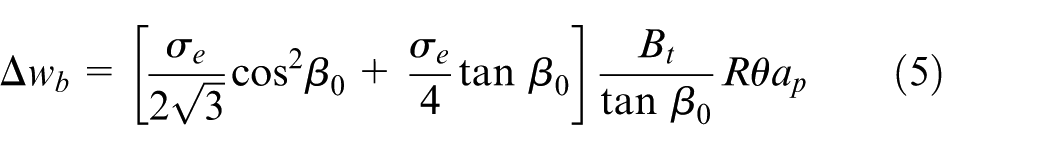
The total work required for chip formation can be approximated to the work done by the tangential force. The total work required for chip formation is
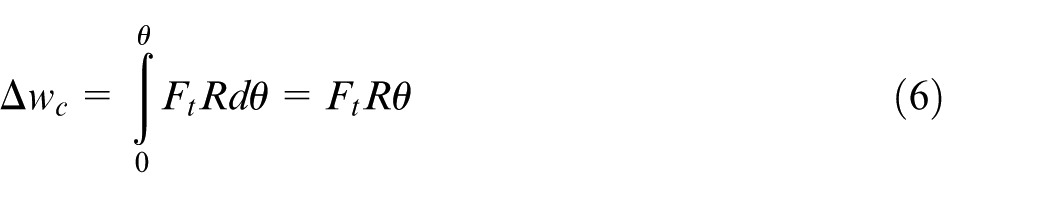
If a small advancement of the tool is considered, then according to continuity of the cutting force work done in chip formation is assumed to be equal to the work done for burr formation

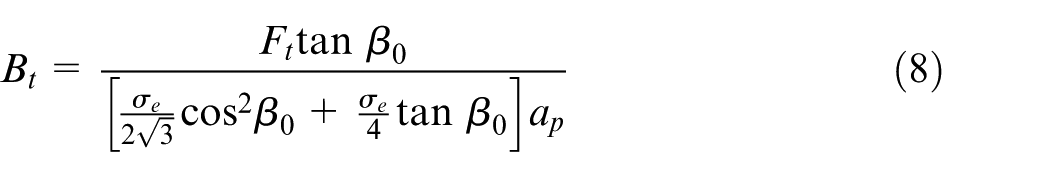
Substituting equations (5) and (6), respectively, in equation (7), burr thickness can be expressed as follows
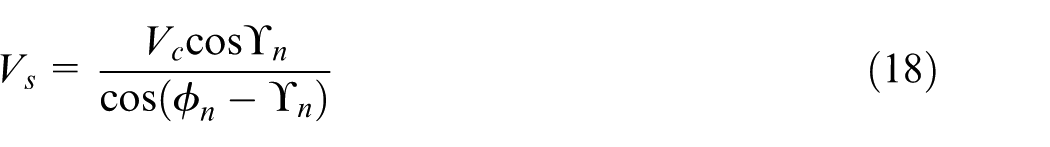
Oblique cutting principle
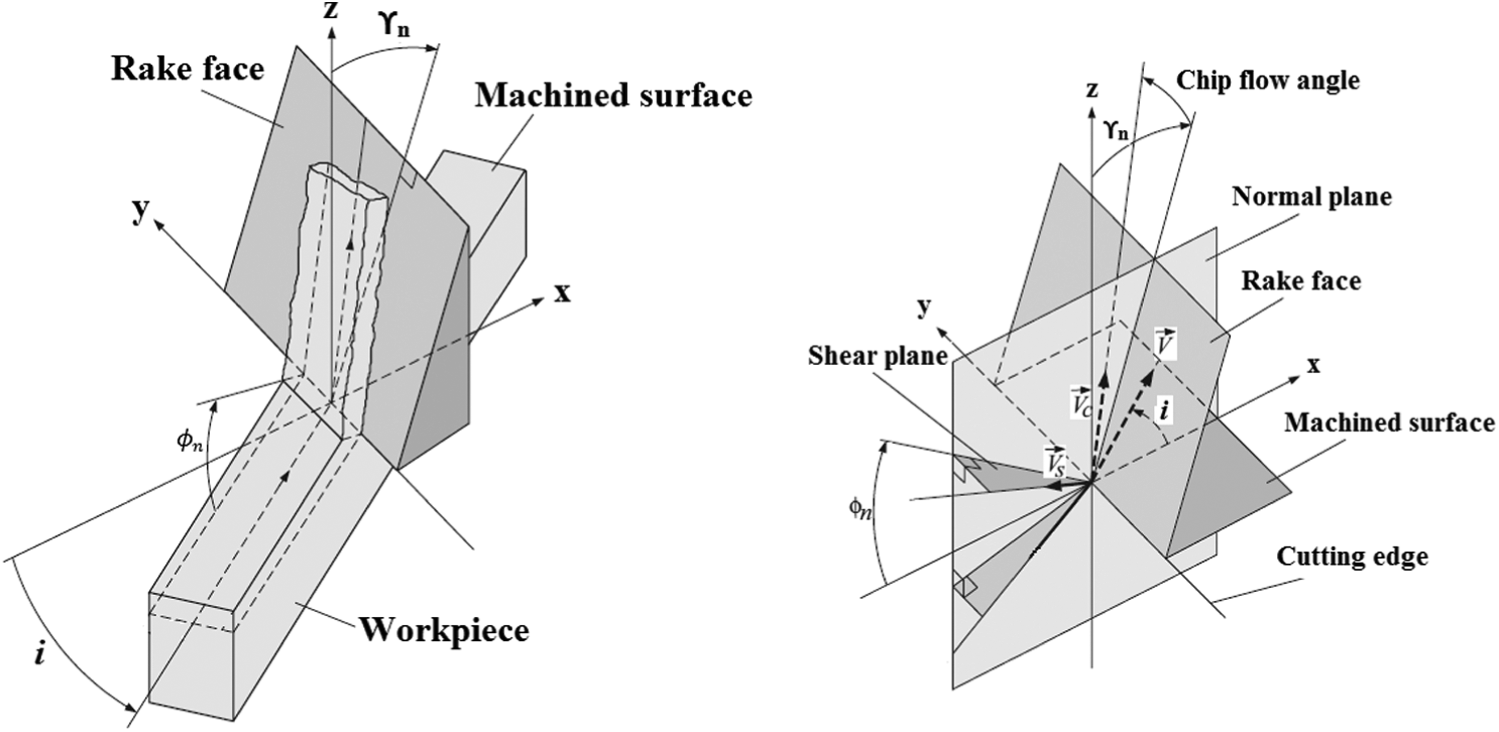
Since the micro-end milling process was adopted in this study, a three-dimensional (3D) oblique machining model was used in this article. In oblique machining, cutting edge is inclined to the velocity vector, generally referred to as the angle of inclination. Figure 4 shows a schematic representation of oblique cutting, where the x-axis is perpendicular to the cutting edge and lies on the machined surface, the y-axis is aligned along the cutting edge and the z-axis is perpendicular to the xy-plane. The important planes in oblique cutting are shear plane, rake face, machined surface (xy-plane) and normal plane (xz-plane). It is acceptable to assume that the mechanics of oblique cutting in the normal plane are equivalent to that of orthogonal cutting. 35 The angle between the shear plane and the xy-plane is called normal shear angle. The angle between the z-axis and a vector on the rake face lying on the normal plane is the normal rake angle. End milling (conventional/micro) cutter with helical tooth can be considered as an oblique cutting process with the angle of inclination, i, being equal to the helix angle of the tool. 34 According to Stabler’s rule, chip flow angle can be approximated to the inclination angle. 36 Figure 5 shows the representation of micro-end milling with oblique cutting geometry on a differential cutting edge. 37 Normal rake angle, ϒ n , can be determined as follows 38

where ϒ o is the orthogonal rake angle which can be found out as given in equation (10) 38
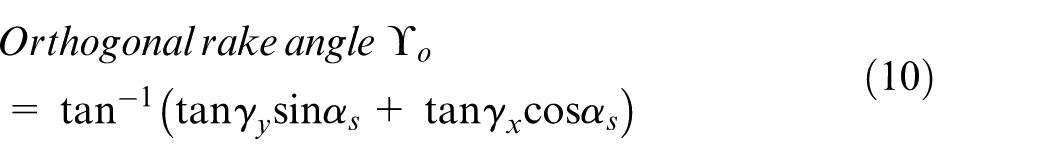
where ϒ y , ϒ x and αs are the back rake, side rake and side clearance angles, respectively.
Sketch of oblique cutting.
Representation of micro-end milling with oblique cutting geometry. 37
In the micro-machining process, rake angle is considered to be effective rake angle when uncut chip thickness is below the minimum uncut chip thickness (MUCT). De Oliveira et al. 39 have suggested that MUCT can be assumed to be within one-fourth and one-third of the cutting edge radius irrespective of workpiece material. Cutting edge radius of the tool used in this study is ∼3 μm, and hence MUCT is taken as 1 μm. Effective rake angle during micro-machining when uncut chip thickness is less than the MUCT is shown in Figure 6 and can be calculated as given in equation (11) 40
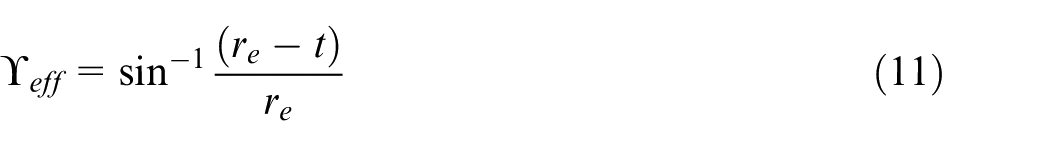
Calculation of effective rake angle.
Flow stress calculation
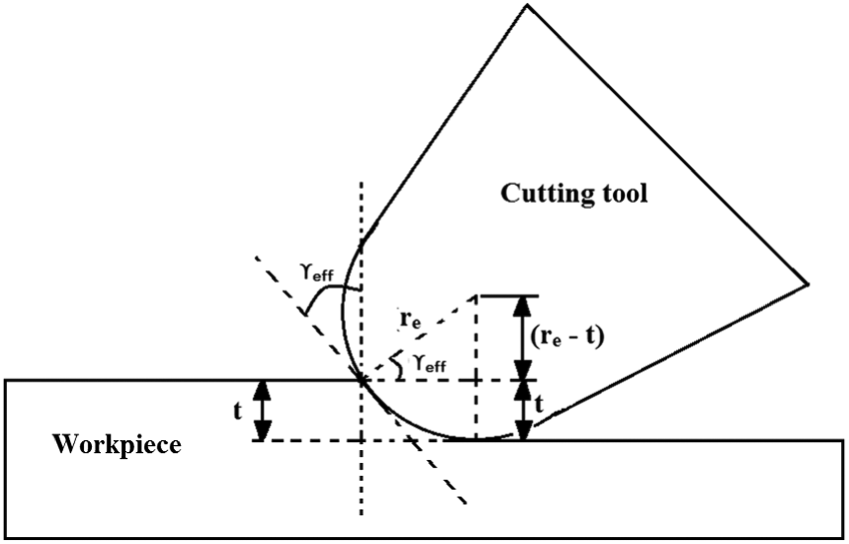
Flow stress is one of the important parameters to be evaluated to determine the burr thickness, which is defined as the stress required to initiate yielding of a workpiece material during machining. 38 There are a number of material constitutive laws that relate flow stress with strain, strain rate and temperature. The JC material model 41 is one of the commonly used constitutive models in the literature due to its simplicity. It relates flow stress with strain, strain rate and temperature in a multiplicative manner through the parameters A, B, C, n and m. In this study, the JC material model is used for obtaining flow stress of the work material, 42 which is given as
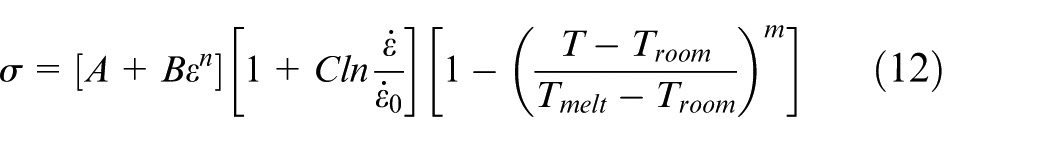
The selection of material constitutive law is very important for accurate simulation of the machining process in terms of prediction of chip morphology, estimation of cutting forces and so on. Many studies26–28 have reported that the JC model is not accurate for the simulation of machining processes, where segmented chips (saw-toothed chips) are produced. Therefore, a material model which will predict the formation of segmented chip will best describe the machining of the Ti6Al4V alloy, as it generates segmented chips during the machining process. 31 Calamaz et al. 26 have proposed a new material model, known as TANH, which can accurately simulate/describe the formation of segmented chips during machining of Ti6Al4V. The TANH model has taken into account the strain softening phenomenon along with the strain rate hardening and thermal softening phenomena. Figure 7 shows the results reported by Calamaz et al. 26 Figure 7(a) shows the chip shape when machined with a cutting speed of 60 m/min and a feed of 0.1 mm. Figure 7(b) shows the simulated chip using the JC law, which gives a continuous chip that is far different from the actual segmented chip. Figure 7(c) shows the result obtained using the TANH model. In this case, segmented chip formation is clearly visible and the simulated chip resembles the experimental chip in shape. It can be noted that with the TANH model chip segmentation can be clearly observed, whereas the JC law predicts a continuous chip. In the recent literature, a large number of researchers26–28 recommend to use the TANH model instead of the JC model to simulate saw-toothed chips during machining of Ti6Al4V. Therefore, in the initial phase of this study, the TANH model is also used to find out flow stress, which is one of the parameter in the burr thickness model, and its results are compared with the results of the JC model. The TANH equation is given as 26
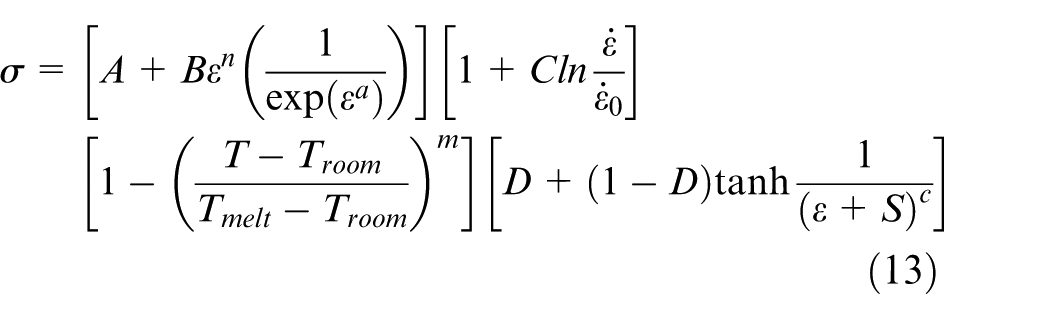
where

Experimental and simulated chip when machining Ti6Al4V at a cutting speed of 60 m/min and a feed of 0.1 mm: (a) experimental chips, (b) simulated chips using the Johnson–Cook model and (c) simulated chips using the TANH model. 26
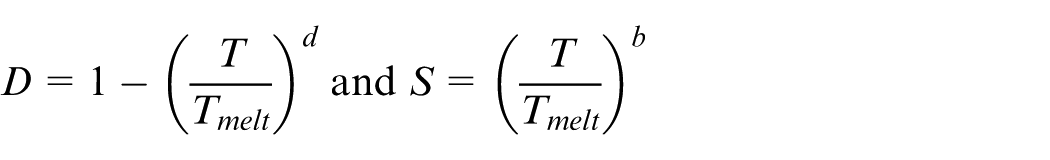
Parameters A, B, C, m and n are similar to those specified for the JC model, whereas new parameters introduced in the TANH model are a, b, c and d. Tmelt is the melting temperature, Troom is the room temperature, ε is the plastic strain and
Strain calculation (ε)
In order to evaluate strain during the machining process, it is assumed that the strain is equivalent to the shear strain during machining. The shear strain produced in an oblique cutting can be found out using equation (14) 36
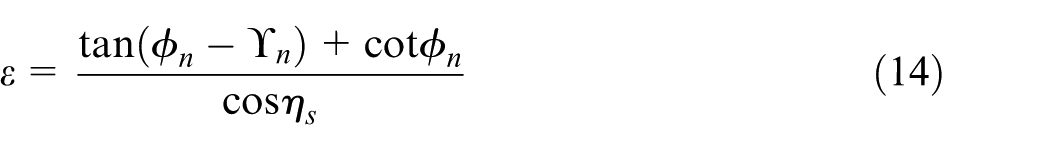
where
where
Strain rate calculation
During machining of Ti6Al4V, where shear localization phenomenon exists, the effect of shear band formation needs to be considered while calculating the strain rate
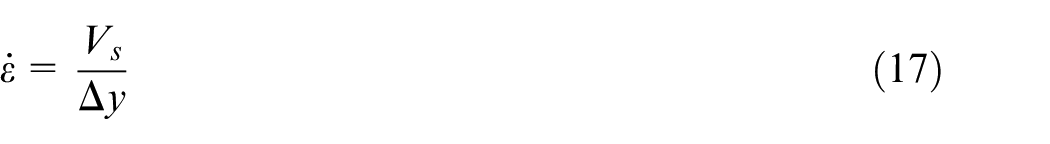
where
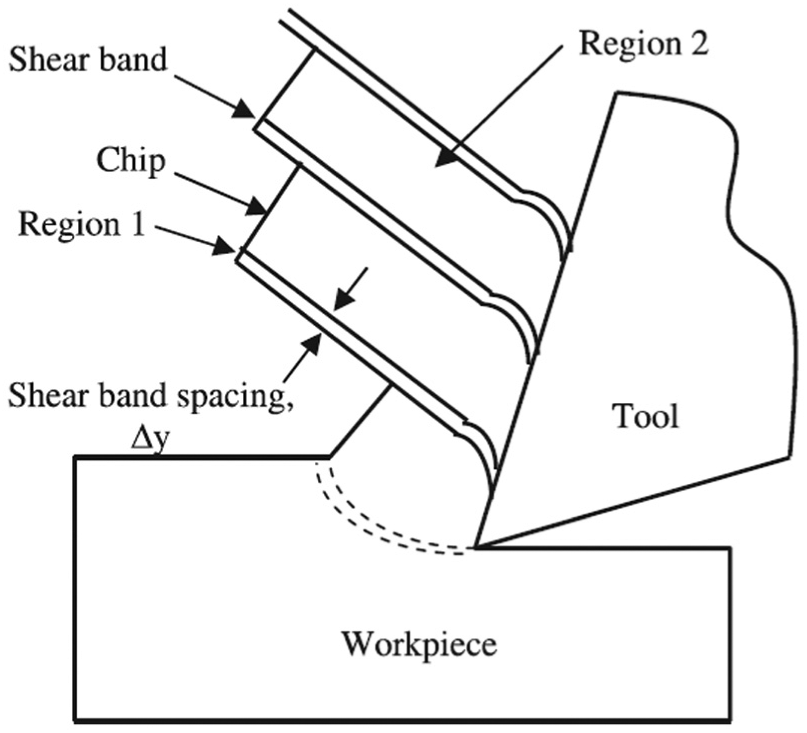
Schematic representation of shear localized chip formation during machining of Ti6Al4V.
Shear band spacing, Δy, is evaluated as given in the next section.
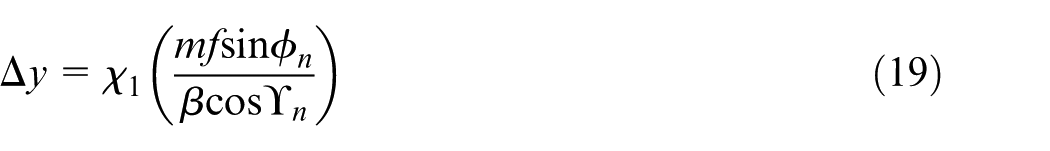
Shear band spacing calculation (Δy)
During machining of Ti6Al4V, the chip is serrated in nature and the strain in it is not uniformly distributed but is confined to a narrow band between the segments 26 as indicated in Figure 9. Vyas and Shaw 23 suggested that the main reason for saw-tooth chip formation may be due to the adiabatic shear bands. They have also pointed out that the formation of adiabatic shear band during machining of titanium alloy is due its poor thermal properties such as low thermal conductivity and low specific heat, which would result in a concentration of thermal energy in these bands. The expression for shear band spacing, Δy, during machining of Ti6Al4V is given by equation (19) 43
where
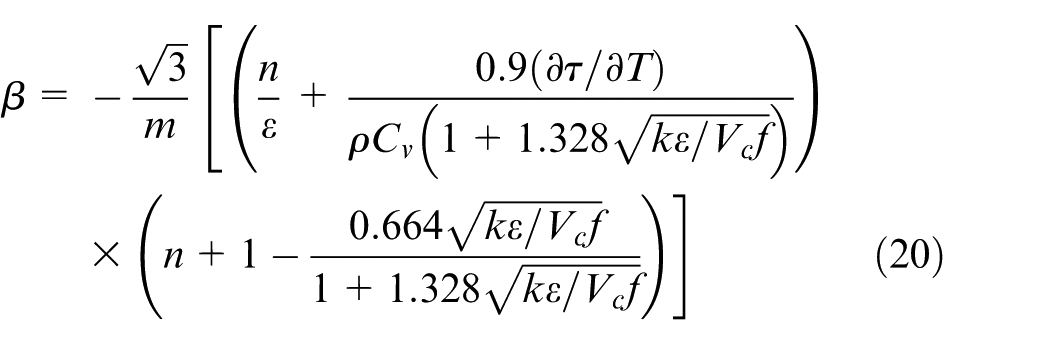
where
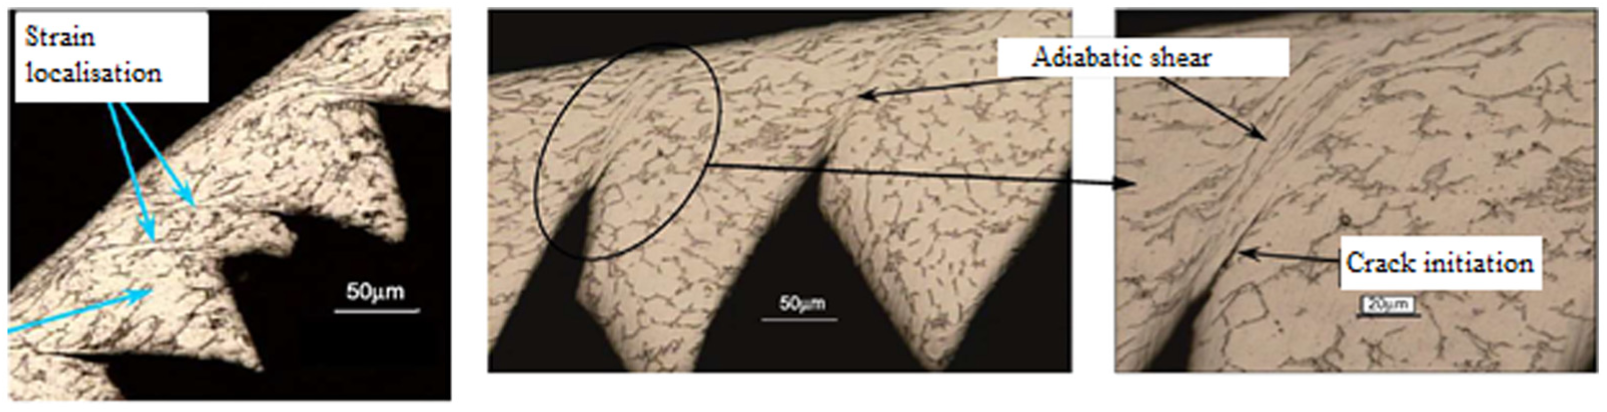
Strain localization and adiabatic shear band in Ti6Al4V. 26
Evaluation of machining temperature
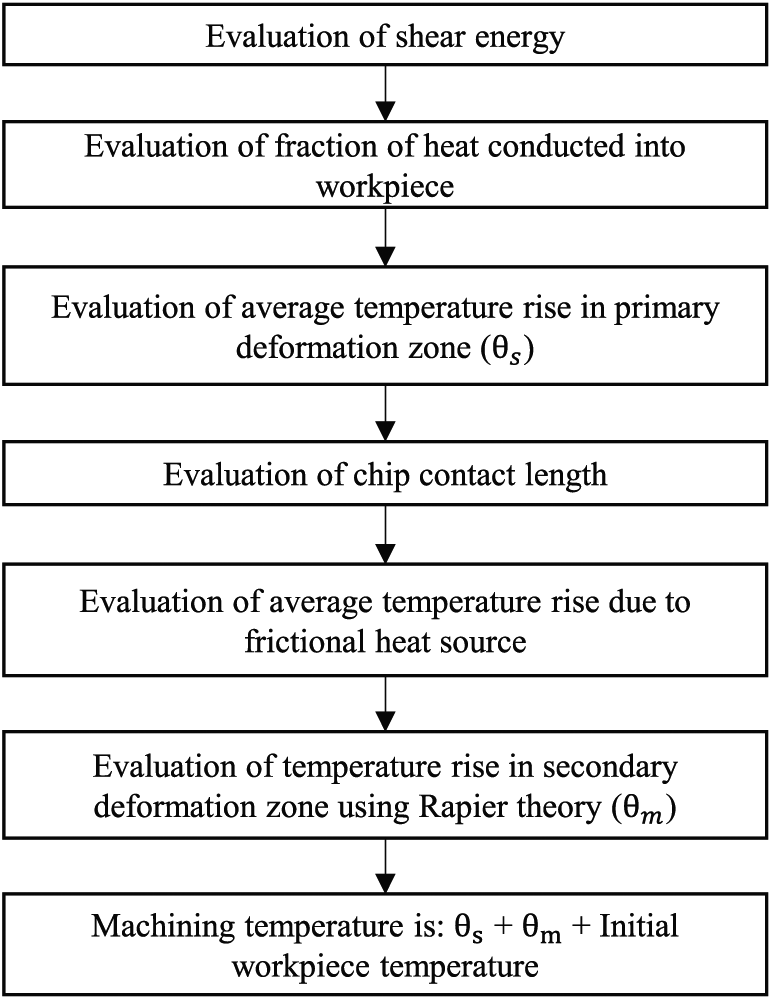
For accurate estimation of flow stress at all cutting conditions, it is required to determine the machining temperature under every experimental condition. Figure 10 shows the methodology adopted to determine machining temperature. In the machining process, the total heat generated is the sum of heats generated in the primary and secondary deformation zones. The following sections describe the procedure to find out temperature at the primary and secondary deformation zones.
Methodology to evaluate machining temperature.
Temperature in primary deformation zone
The average temperature rise of the material passing through the primary deformation zone is 45
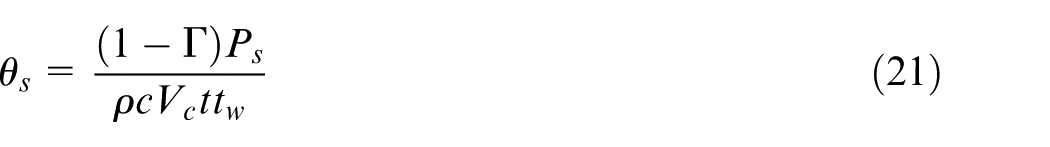
where Ps is the rate of heat generated in the primary deformation zone, Г is the fraction of Ps conducted into the workpiece, t is the undeformed chip thickness, tw is the width of the undeformed chip thickness, c is the specific heat capacity of the workpiece material, ρ is its density and Vc is the cutting speed. Г can be defined as given below 46
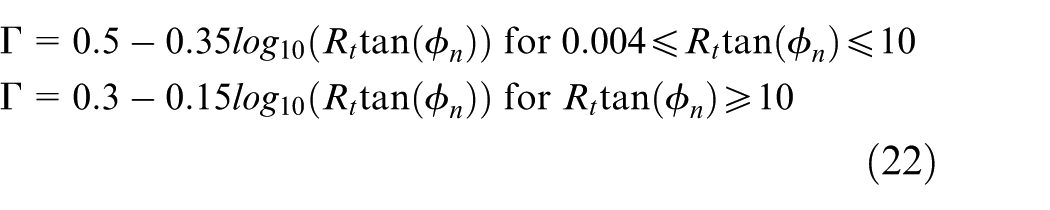
Here Rt (thermal number) is defined as 45
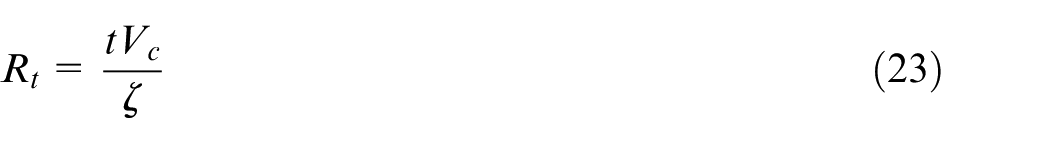
and ζ is the thermal diffusivity given by
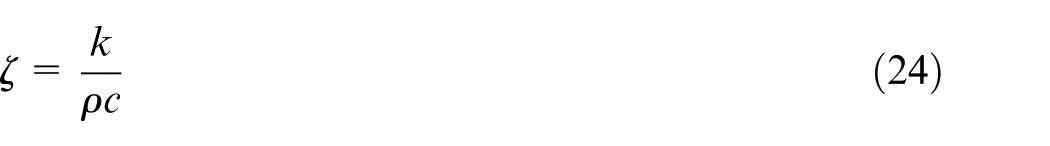
where k is the thermal conductivity of the workpiece material.
Temperature in secondary deformation zone
Rapier 47 has established a relationship between maximum temperature (θm) in the chip at the secondary deformation zone and the average temperature rise (θf) of the chip from the secondary deformation zone as follows
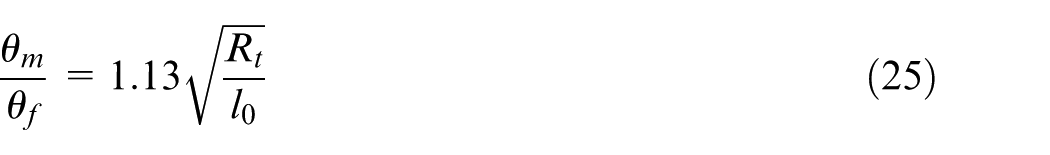
where l0 is the length of the heat source divided by the chip thickness which can be expressed as
where Pf is the frictional heat generation.
Chip contact length can be calculated as given below 46
Assuming the initial workpiece temperature (θ0) as 25 °C, the machining temperature can be calculated as

Hence, using equation (29), the machining temperature can be found out for every machining condition. This temperature can be used for the evaluation of flow stress under every experimental condition.
Results and discussion
Experimental procedure
In this study, micro-end milling experiments were carried out in a micro-machining center (DT110—Mikrotools, Singapore). Figure 11(a) shows the experimental setup used in this study. Since the machining center used has the maximum spindle speed limited to 5000 rev/min, the maximum cutting speed has been restricted to 15.7 m/min. However, the main objective of this study is to understand the influence of cutting edge radius of the tool on burr formation; feed and spindle speed were selected in such a way that feed per tooth falls within and outside the size effect region. Figure 12 shows the image of the tool captured using Alicona 3D optical profilometer (Figure 11(b)). Cutting edge radius of the tool was found to be ∼3 μm. This was done by fitting a circle to the image of the cutter edge and the radius of the circle was taken as the cutting edge radius. Hence, according to De Oliveira et al. 39 MUCT can be taken as 1 μm. Cutting parameters were selected, as shown in Table 3, in such a way that feed per tooth covers the range of 0.2–3 μm. Ti6Al4V titanium alloy has been selected as the workpiece material because of its wide range of applications such as fabrication of aircraft structures, turbine blades, medical implants and optics. Properties such as high melting point, high specific ultimate tensile strength, low thermal and electrical conductivity, resistance to corrosion and heavy loads, biocompatibility and lightness make Ti6Al4V suitable for various applications mentioned above. AlTiN coated, solid tungsten carbide micro-end mill cutter with 1000 μm diameter (AXIS Tools) was used to machine slots on the workpiece to analyze the burr formation. Figure 13 shows the specification of the tool. Chips produced in each experiment were examined through scanning electron microscope (SEM) to measure thickness and width. Finally, burr thickness was also measured using SEM to validate the model.
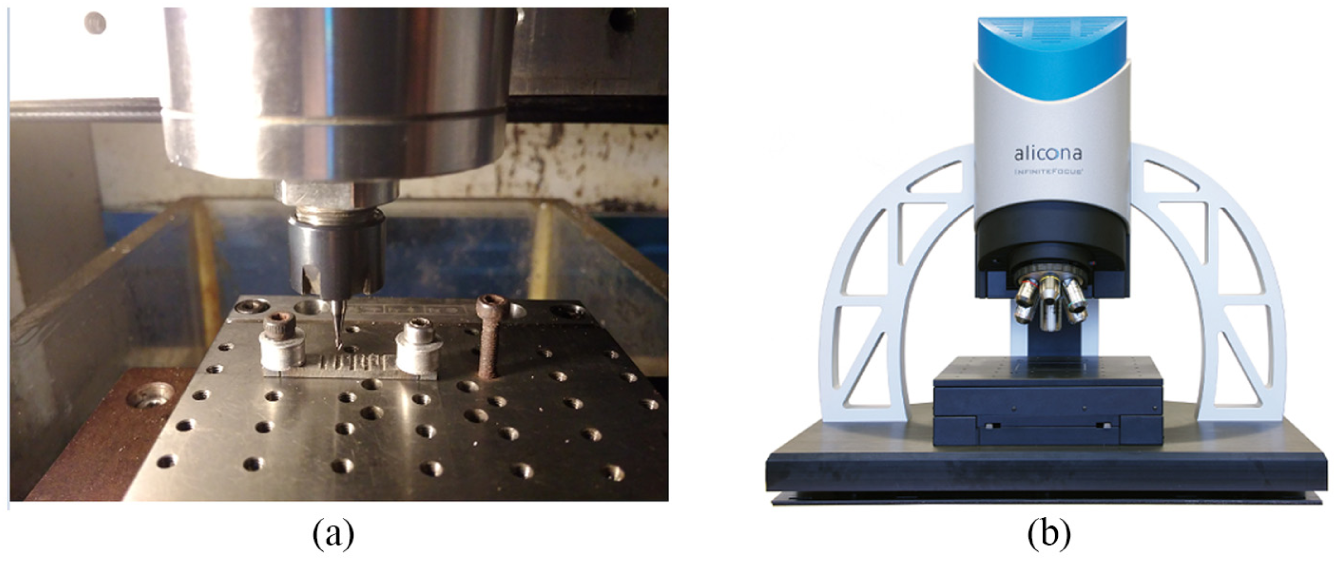
Experimental setup: (a) micro-machining center and (b) 3D optical profilometer.
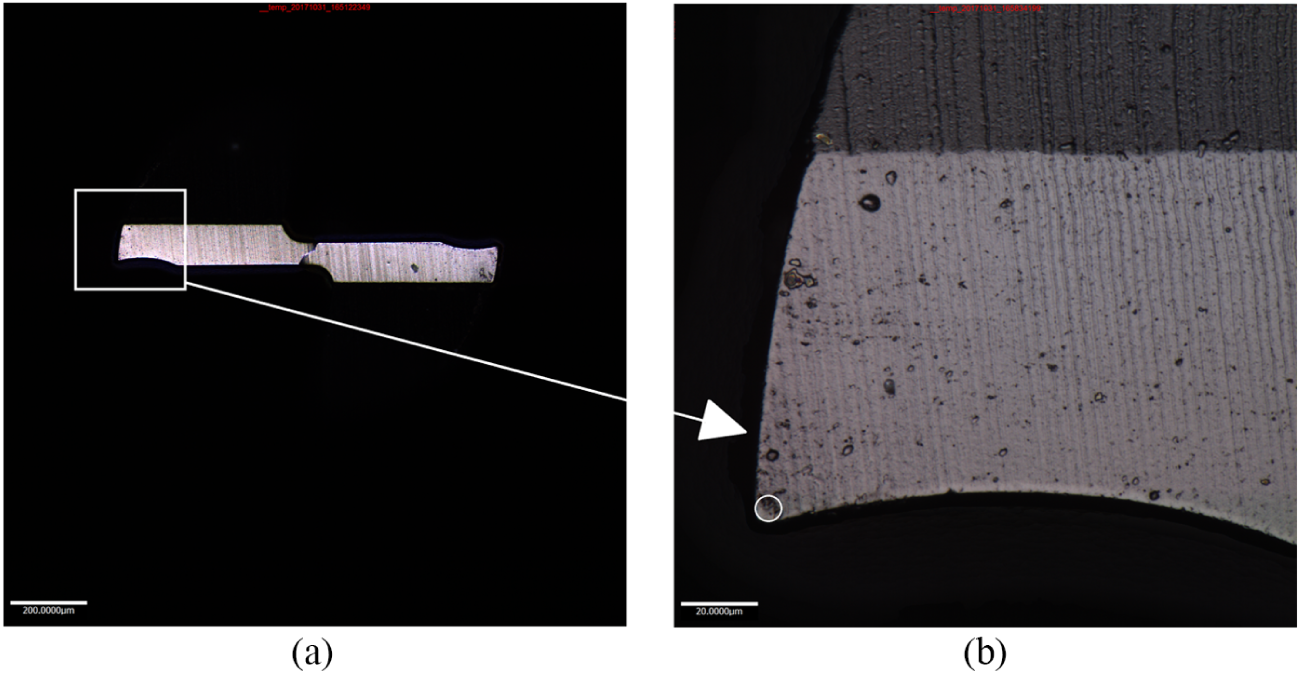
Images of (a) micro-end mill cutter and (b) cutter edge radius.
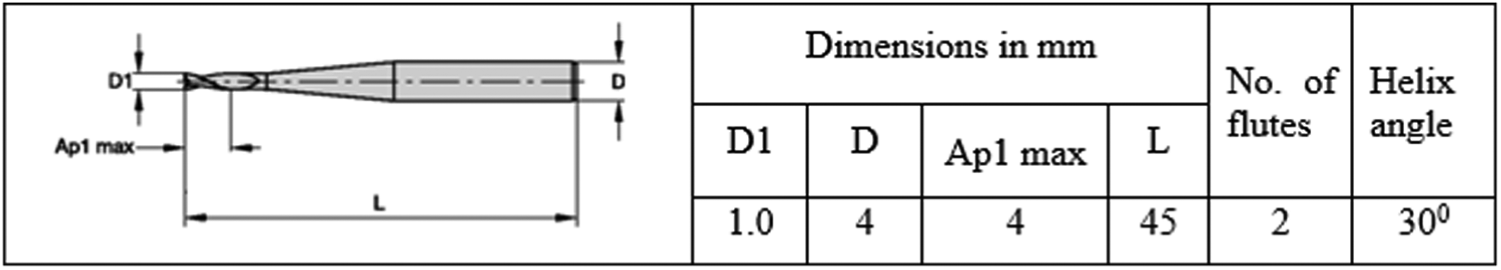
Tool specifications.
Model evaluation
In order to evaluate the burr thickness, first the force (Ft) needs to be found out, which can be determined theoretically based on oblique cutting principle. The value of initial negative shear angle, β0, is assumed to be 20°. In phase 1 of this study, flow stress was evaluated using two material constitutive models: (1) the JC model and (2) the TANH model. Equation (12) is used to calculate flow stress using the JC model and equation (13) is used for the TANH model. The material constants (A, B, C, m, n, a, b, c and d) for Ti6Al4V required for both the JC and TANH models, taken from Ducobu et al.,
32
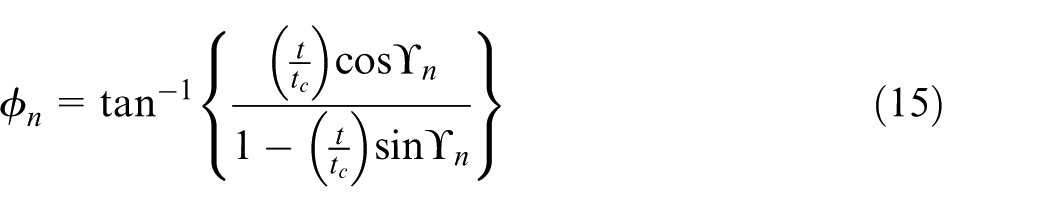
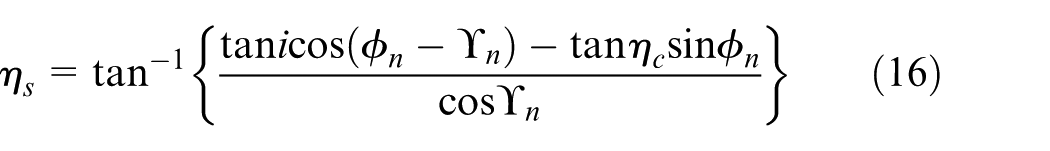
are given in Table 1. Strain and strain rate required for the evaluation of flow stress were calculated using equations (14) and (17), respectively. Other parameters such as normal shear angle, shear flow angle and shear velocity are obtained using equations (15), (16) and (18), respectively. In order to calculate shear band spacing, Δy, the flow localization parameter, β, needs to be evaluated first. Flow localization parameter can be calculated using equation (20). Physical and thermal properties of Ti6Al4V are taken from Ducobu et al.,
28
which is listed in Table 2. In order to calculate shear band spacing, an appropriate value of Taylor–Quinney coefficient has to be selected for the given workpiece material. Xie et al.
44
have used the Taylor–Quinney coefficient value of 0.9 for titanium alloy. Hence, in this article this coefficient is taken as 0.9. Thermal softening parameter
Constants of the TANH and JC models suggested for Ti6Al4V. 32
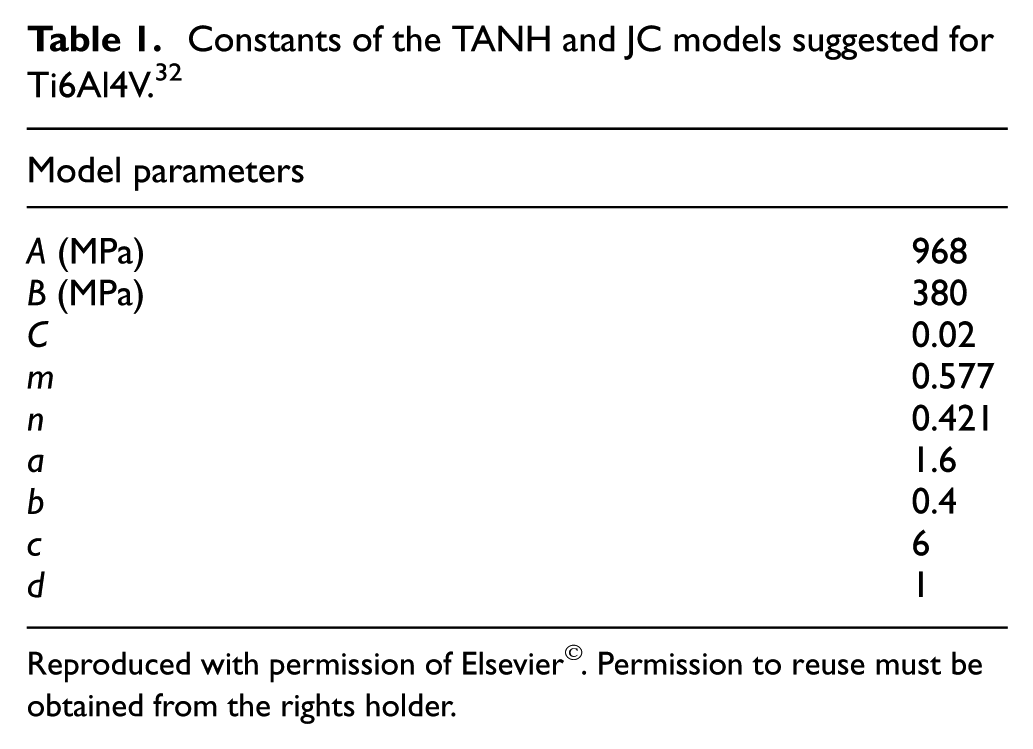
Reproduced with permission of Elsevier©. Permission to reuse must be obtained from the rights holder.
Material properties of Ti6Al4V. 28
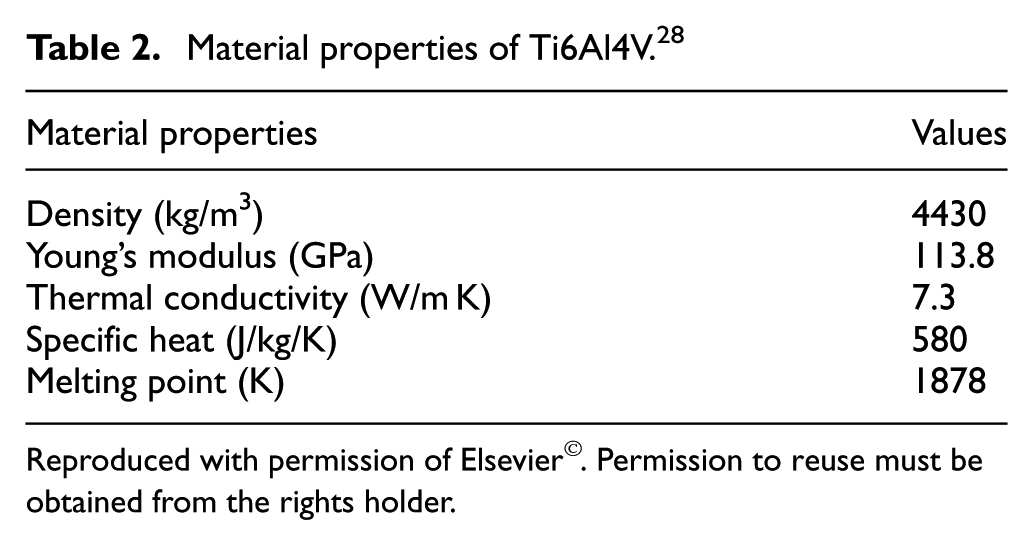
Reproduced with permission of Elsevier©. Permission to reuse must be obtained from the rights holder.
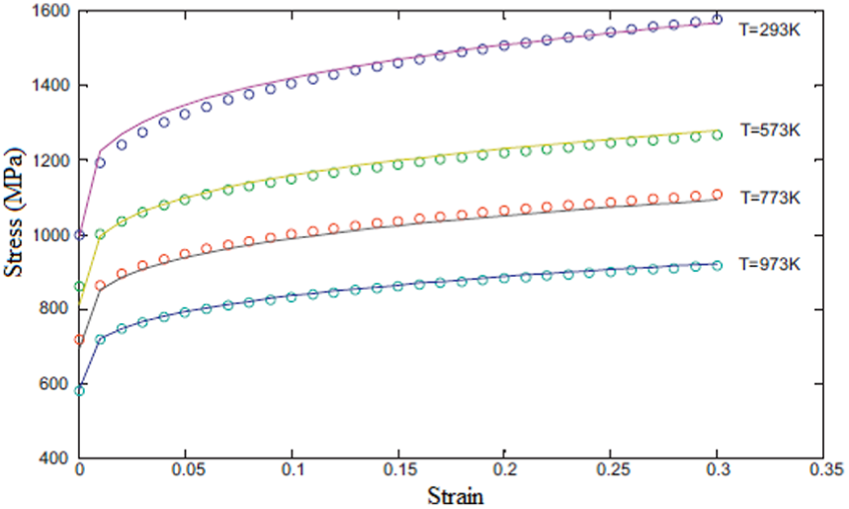
Variation of flow stress at various temperatures for Ti6Al4V to determine thermal softening parameter. 29
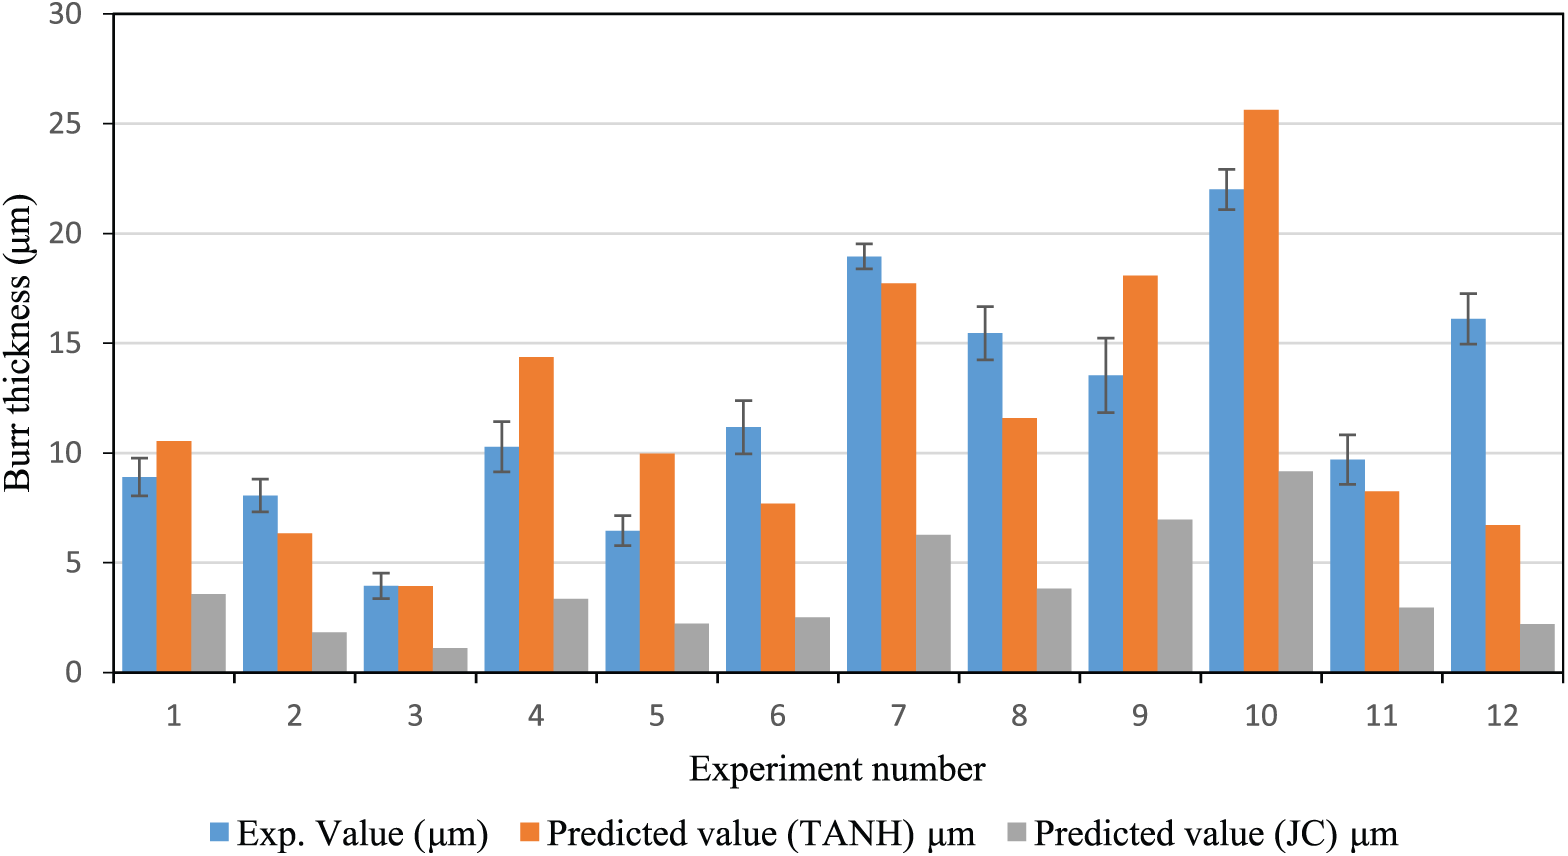
Comparison of burr thickness predicted based on the JC and TANH models with the experimental results
Figure 15 shows the SEM images of the chips produced during machining of Ti6Al4V for some of the experimental runs shown in Table 3. It is evident from Figure 15 that the segmented (saw-toothed) chips are produced. Hence, the use of the TANH material constitutive model in this study is justified. In phase 1 of this study, burr thickness was calculated based on flow stress evaluated using the JC and TANH models. Table 3 shows complete experimental runs and the predicted and experimental results of burr thickness. Figure 16 shows the burr produced during micro-end milling of Ti6Al4V for some of the experimental runs. A comparison between the experimental and theoretical (based on both JC- and TANH-model-based calculations) results of burr thickness is shown in Figure 17. From Figure 17, it is evident that the TANH model gives better results compared to the JC model. Even though the TANH model gives better results, its deviation from the experimental observation is due to the fact that in phase 1 of this study the machining temperature was assumed to be constant for all the experimental conditions. From Figure 17, it can be noticed that for experiment 12 the deviation between the experimental and predicted results is more. One possible reason for this could be that in phase 1 of this study the machining temperature was assumed to be constant for all experimental conditions. Hence, there is a possibility of a large difference between the actual machining temperature and the assumed temperature. This could have been attributed to the large prediction error for experiment 12. From this analysis, it can be concluded that the TANH model is the appropriate material constitutive model for the prediction of burr thickness during machining of Ti6Al4V. Hence, in phase 2 of this study only the TANH material model will be used.
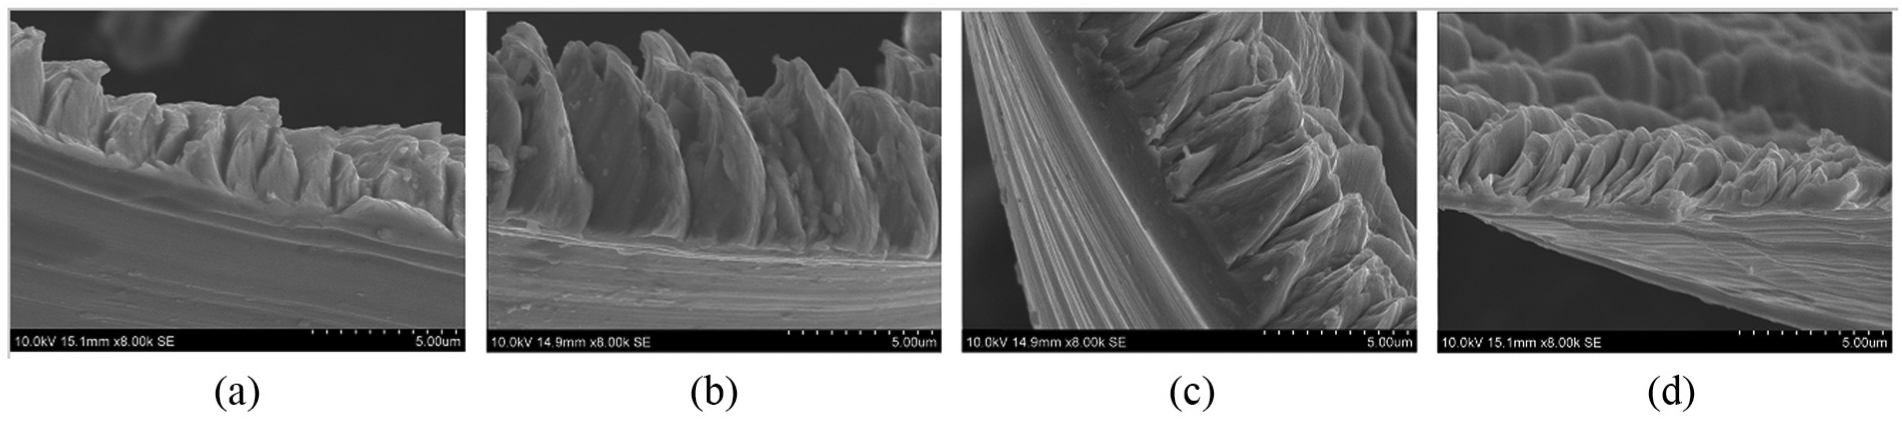
SEM images of chips showing saw-tooth chip formation under (a) s = 3000 rev/min, f = 2 mm/min, d = 0.1 mm (b) s = 3000 rev/min, f = 2 mm/min, d = 0.15 mm (c) s = 5000 rev/min, f = 2 mm/min, d = 0.15 mm(d) s = 1000 rev/min, f = 4 mm/min, d = 0.15 mm
Experimental conditions and results.
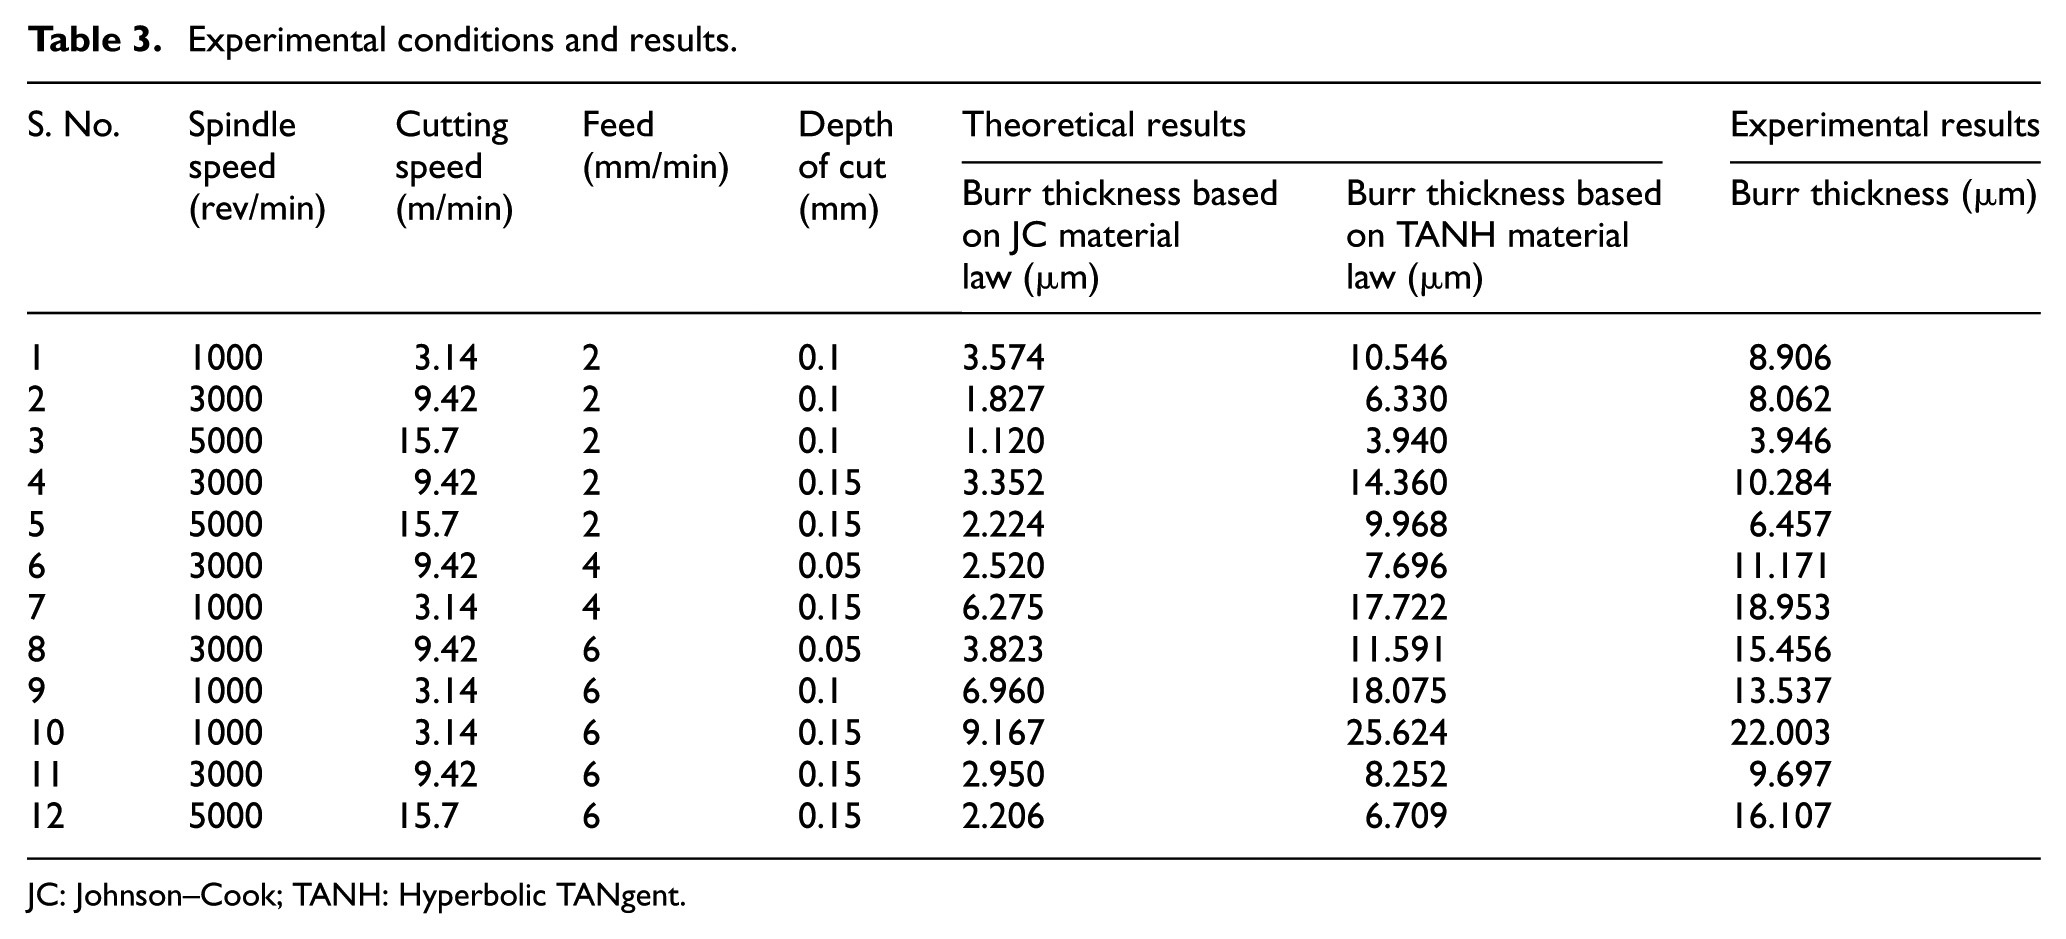
JC: Johnson–Cook; TANH: Hyperbolic TANgent.
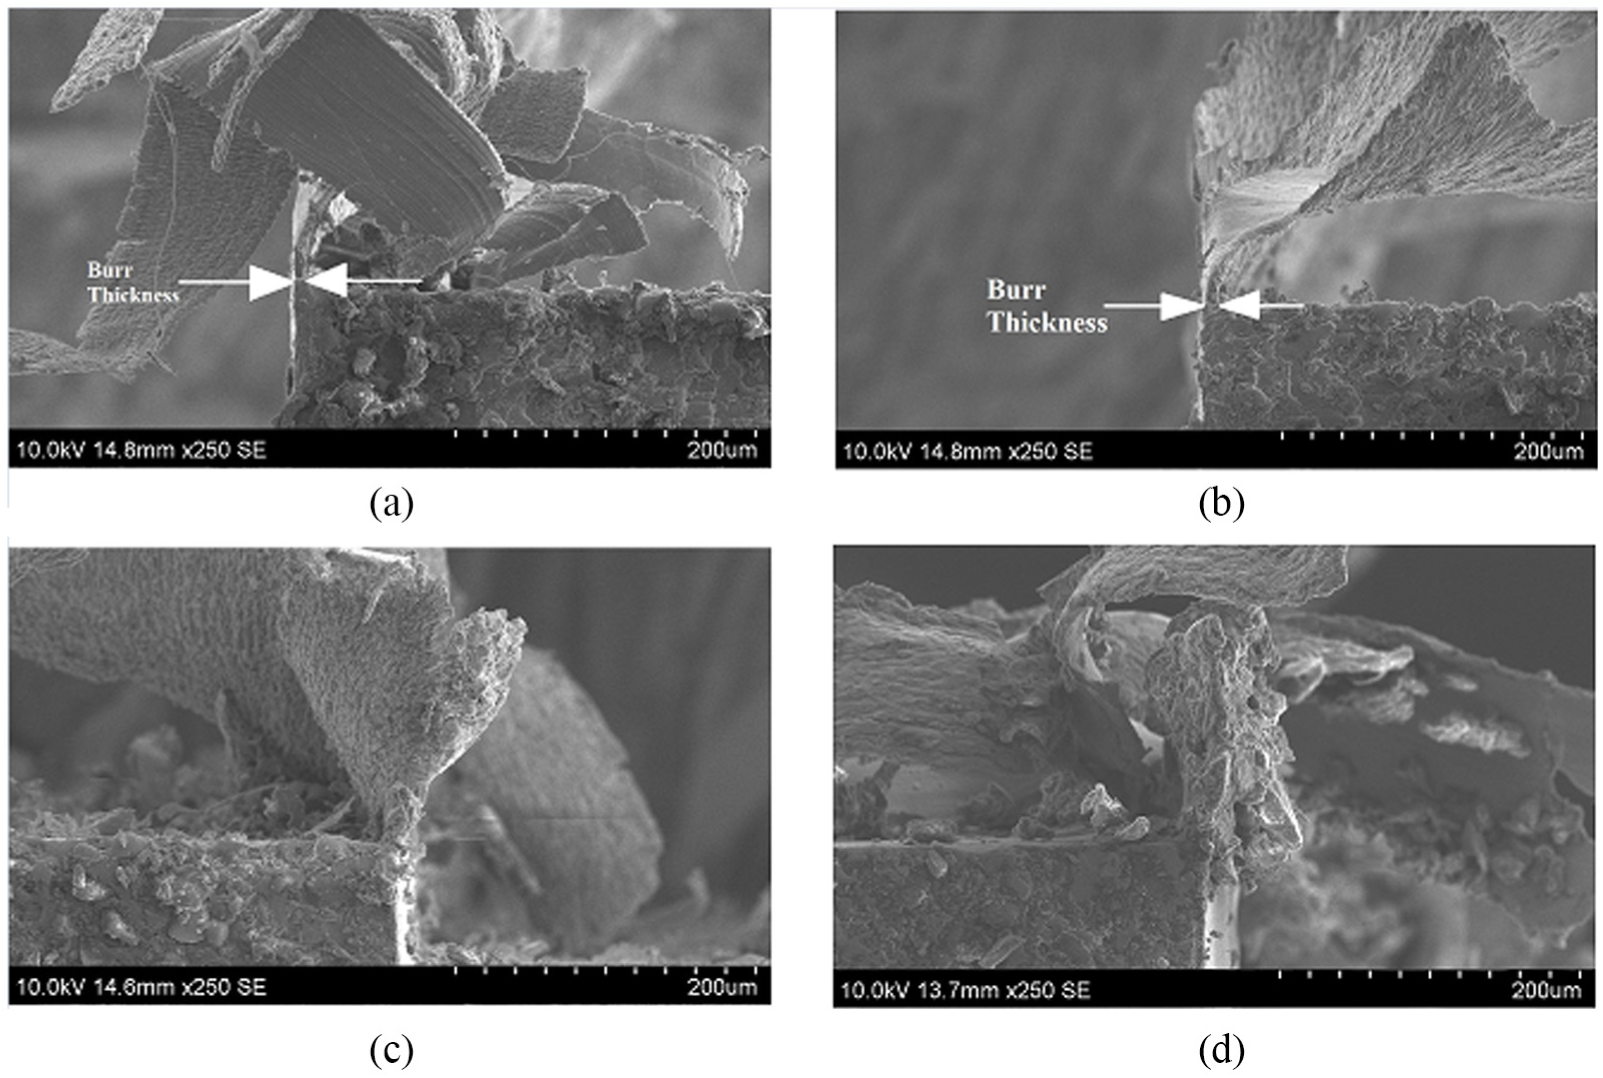
Images of burr produced under different experimental conditions: (a) s = 1000 rev/min, f = 2 mm/min, d = 0.1 mm; (b) s = 3000 rev/min, f = 2 mm/min, d = 0.1 mm; (c) s = 3000 rev/min, f = 4 mm/min, d = 0.05 mm and (d) s = 1000 rev/min, f = 4 mm/min, d = 0.15 mm.
Comparison of burr thickness predicted using the JC and TANH models with experimental results.
Temperature-dependent burr thickness prediction
Based on the results obtained in phase 1 (section “Comparison of burr thickness predicted based on the JC and TANH models with the experimental results”), here onwards only the TANH material model will be used for the calculation of flow stress. In order to reduce the prediction error resulted from the constant machining temperature assumption for all the cutting conditions, machining temperature is evaluated for every experimental condition and included in the model. Figure 18 shows the comparison between the predicted results after including machining temperature into the model with the experimental results. In order to show the improvement in the prediction, the results obtained with the constant machining temperature assumption are also shown in Figure 18. It can be clearly observed that by including machining temperature under every experimental condition a better burr thickness prediction was obtained compared to that obtained under the constant machining temperature assumption.
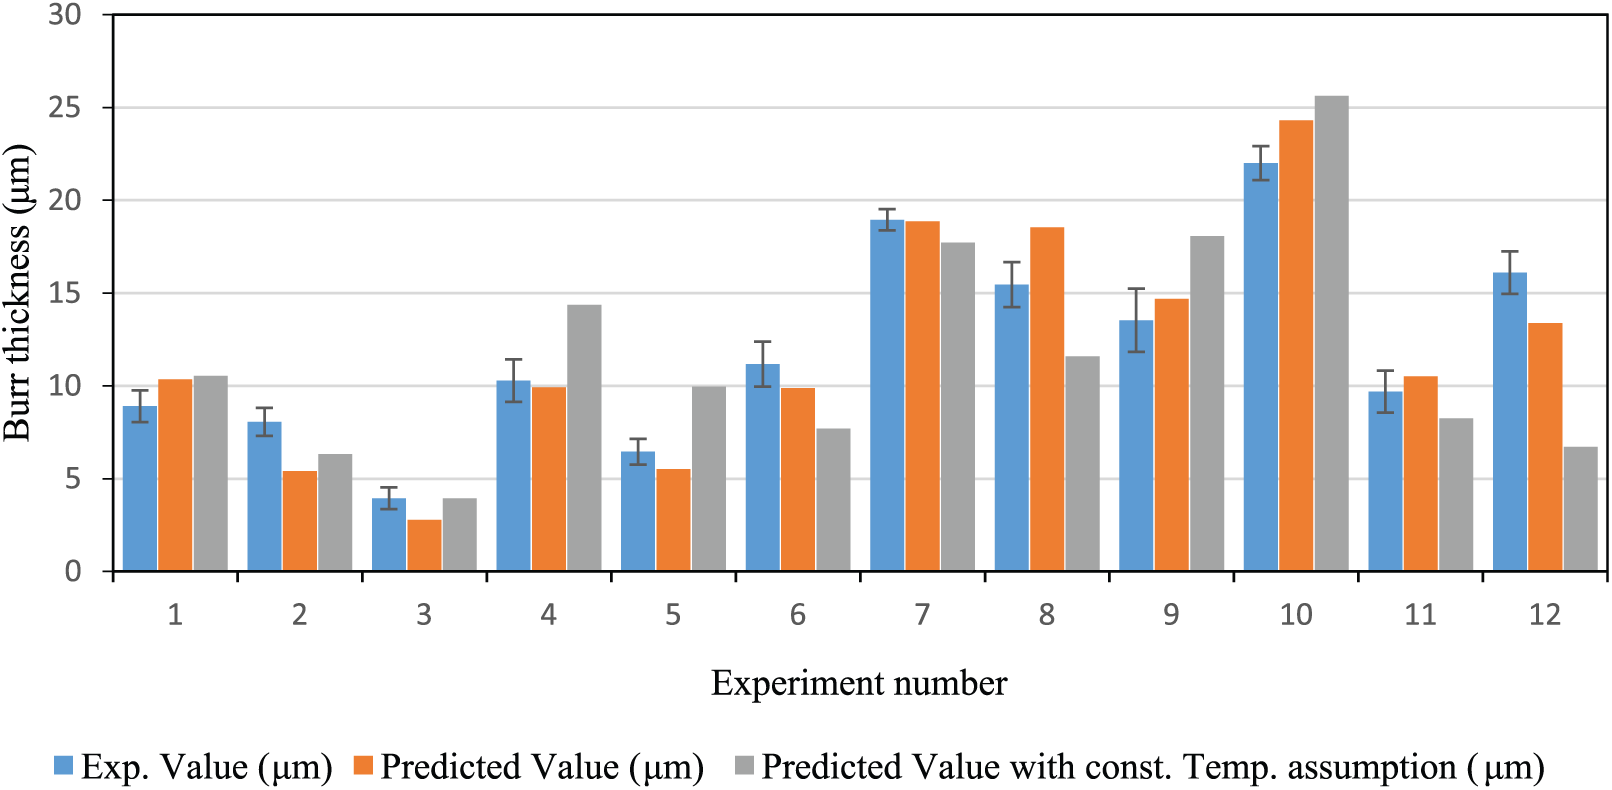
Comparison of experimental and theoretical burr thickness after including machining temperature.
Conclusion
This article is mainly focused on modeling of burr thickness during micro-end milling of Ti6Al4V. This article is organized in two phases. Phase 1 of this study is concentrated on the determination of an appropriate material constitutive model for better prediction of burr thickness during machining of Ti6Al4V. In phase 2, machining temperature is included in the model for more accurate prediction of burr thickness. The following conclusions can be drawn from this study:
A theoretical model for burr thickness during micro-end milling of Ti6Al4V was developed based on the principle of continuity of work.
The proposed model was developed considering various aspects such as (1) oblique cutting theory, (2) shear band spacing during chip formation, which is predominant in machining of titanium alloy, and (3) flow stress considering the strain rate hardening, thermal softening and strain softening phenomena.
In the initial phase of this study, two material constitutive models, namely, the JC and TANH models, were used for the evaluation of flow stress and it was found that the TANH model gives a better burr thickness prediction compared to the JC model. The deviation between the experimental and theoretical results in this stage could be due to the constant machining temperature assumption for all the experimental conditions.
From the initial phase of this study, it was concluded that the TANH material constitutive model better describes the machining of Ti6Al4V.
By including machining temperature for all the experimental conditions into the model, a considerable reduction was observed in the deviation between the experimental and theoretical results.
Footnotes
Appendix 1
Declaration of conflicting interests
The author(s) declared no potential conflicts of interest with respect to the research, authorship and/or publication of this article.
Funding
The author(s) disclosed receipt of the following financial support for the research, authorship, and/or publication of this article: The authors would like to sincerely thank Department of Science and Technology (DST), Government of India, and Centre for Precision Measurements and Nanomechanical Testing, Department of Mechanical Engineering, National Institute of Technology Calicut, for providing support to carry out this work under the scheme “Fund for Improvement of Science and Technology” (No. SR/FST/ETI-388/2015).