
Abstract
Numerous hard, brittle metals have been shown to form segmented chips during machining operations, which has been shown to be linked to high vibration levels in turning and milling processes. This article concerns quantitative comprehension of segmentation-driven vibration in end-milling process. First, dynamic model of milling process with impact of segmented chip is presented, and a periodic cutting force model related with segmented chip is proposed. Second, for experimental observation, a series of tests are carried out concerning modal test of cutting system; chip morphology, tool vibration during cutting, surface location error, and high-frequency sampling measurements of cutting force signal are realized. The method used for calculating the frequency of segmentation chip by oblique cutting is deduced. It is found that at low feed rate, the periodic cutting force is affected by the natural frequency of cutting system, segmentation chip, and tool vibration. Finally, amplitude–frequency response for quasi-single degree of freedom is employed to elaborate the relationship between segmentation frequency and natural modes of system. The results show that when the ratio (frequency of segmented chip to natural frequency of system) is a noninteger value or above 3, no significant vibrations of cutting system are observed in milling titanium alloy Ti6Al4V.
Keywords
Introduction
Titanium alloys are known as difficult-to-machine materials, especially at higher cutting speeds, due to their several inherent properties, such as low Young’s modulus, low heat conductivity, and high hardness. These alloys are widely used in turbine industry due to their superior mechanical, chemical, and high temperature properties. 1 For these alloys, machining productivity is limited by intensive chatter and tool wear, which indirectly represent a significant portion of machining. Low Young’s modulus shows that titanium yields to pressure of cutting material. The danger of vibration behavior with weak parts increases. Thus, most researches are focused on cutting vibration for these alloys. Generally, vibrations in milling process include three parts, that is, free vibration, forced vibration, and self-excited vibration (chatter). Chatter vibration due to dynamic interactions between tool and workpiece has been widely studied in the past one century. After extending the work, 2 a three-dimensional (3D) milling dynamics model with a multivariable milling tool was proposed to predict the stability against chatter based on a modified enhanced multistage homotopy perturbation method (EMHPM). 3 A hyper-third-order full-discretization method was presented to predict milling stability. 4 According to the stress distribution along the rake face, a state-dependent distributed-delay model of orthogonal cutting was proposed to perform the bifurcation analysis. 5 A method was proposed to identify instantaneous dynamic characteristics during thin-walled part milling and analyze peripheral milling stability. 6 All these researches show that chatter is regarded as a feedback mechanism for growth of self-excited vibrations due to variations in chip thickness and cutting force and subsequent tool vibration.
However, only 25% of the process heat is dissipated in chips during titanium machining due to low heat conductivity and high hardness. 1 This means tool faces an enormous temperature load, which cause adhesion and diffusion processes and lead to high tool wear. Thus, most machining researches on this kind of difficult-to-machine material (such as titanium alloys and hardened steel 7 ) have focused on chip formation mechanisms and tool wear characterization. It has been reported that chip dimension changes as cutting conditions,8–10 tool material 11 and geometry (including wears 12 ) change. Especially, many recent researches focused on the effects of cutting speed on the morphology and mechanism of chip formation. An explicit expression of critical cutting speed for the onset of serrated chip flow was presented to predict the transition of continuously smooth chip flow to periodically serrated chip flow with the cutting speed increasing. 13 The process of chip formation and the change in chip morphology during the high-speed milling of hardened steel were investigated, and the chip of materials with different hardnesses could be controlled as a continuous chip through the optimization of a combination of cutting speed, feed per tooth, and cutting depth. 14 Even in micromill process, a micromilling cutting force model was proposed based on the conventional end-milling cutting force model through performing several modifications considering chip formation. 15 And the effects of ultrasonic-assisted turning for improving chip segmentation have been investigated. 16 High pressure in coolant also affects greatly the chip formation. 17 The chips formed in machining titanium-based alloys are typically saw toothed or segmented. 18 Generally, formation of such segmented chips is regarded as the result of a highly nonlinear and dynamic plastic deformation process, which significantly affects cutting forces, cutting vibration, cutting deflection, surface finish, and tool wear. 19 Chips produced in machining most metals and alloys can be generally classified into four distinct categories based on their geometric shapes: steady-state continuous chips, wavy chips, saw-toothed (or segmented) chips, and discontinuous chips. Saw-toothed chips or segmented chips are semi-continuous and have zones of low shear strain (continuous portion) and high shear strain (discontinuous portion). However, the exact chip formation mechanism of segmented chips is still not clearly understood. In this article, many investigations on the serrated chip formation mechanism 20 and the effects of serrated chip on micro-topography of machined surface 21 have been conducted and a mixed mode including ductile fracture and adiabatic shear of materials has also been proposed.
Additionally, many recent works have been focused on segmentation-driven vibration due to chip formation effects. Although there is no consensus view, segmentation-driven vibration in turning process has been reported in Taylor et al.22,23 The result shows that this type of vibration is a high-amplitude vibration, which can be predicted and given empirical measurements. Patwari et al. 24 experimentally investigated the influence of chip serration frequency on chatter formation during end-milling of Ti6Al4V. Palmai and Csernak 25 regarded the chip formation as an oscillator and analyzed the vibrations of workpiece during turning process. However, there is still no systematic study of this vibration due to complexity of chip formation mechanism, especially for complex milling process. Therefore, regardless of the saw-toothed chip formation mechanisms and regenerative chatter for machining titanium alloy, the objective of this study is to study comprehensive dynamic of milling titanium alloy including impact of segmentation chip.
Model of segmentation-driven vibration
The governing equation of motion for milling process is derived in this section, and the extension of vibration classifications is presented by considering impact of segmentation chip, which is deduced by segmentation chip formed periodically (called segmentation-driven vibration).
Governing equation of motion
Milling tool can be considered to have two orthogonal degrees of freedom as shown in Figure 1. Because of the complexity of milling process, accurate measurement of dynamic cutting forces due to segmentation is difficult; even in turning process, it is also troublesome. In this article, analytical technique used in turning process is employed and extended to study milling operation. It should be emphasized that three primary different characteristics between milling and turning processes, variable cutting thickness (characteristic A) with time, interruption (characteristic B), and helix angle (characteristic C), must be taken into account. According to the assumption (segmentation-driven cutting force oscillates sinusoidally around a mean value at chip segmentation frequency) presented,
22
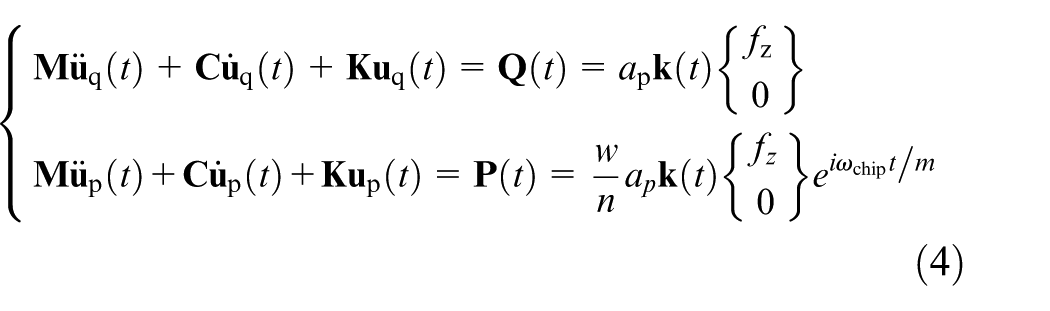
it is assumed here that the segmentation-driven cutting force in milling process is harmonically varying with respect to time and can be expressed as exponential function. The amplitude of the force is the peak amplitude of the periodic cutting forces (ΔQ0x and ΔQ0y), which are associated with stationary cutting force. Therefore, the cutting force vector,
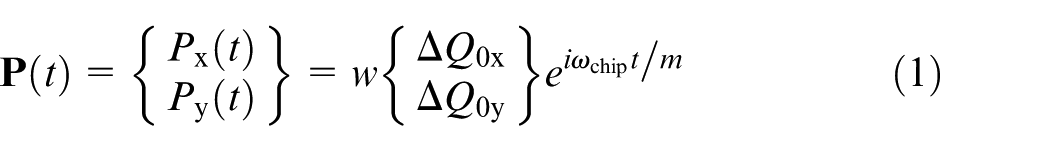
where w is an undermined conditional coefficient dependent of cutting conditions (including tool geometry and material, workpiece material, and cutting parameters), which is similar to a Heaviside step function that assumes a value 1 when segmentation chips occur and 0 when other chips occur. ωchip is segmentation frequency, ωchip = 2π/Tchip. Generally, segmentation frequency is very high, as results given in the next section. Cutting force due to segmentation, equation (1), can induce forced vibration, named as segmentation impact vibration, which is different from the forced vibration caused by stationary cutting force. On the view of dynamics, system subjected to high-frequency excitation cannot follow the excitation. Therefore, it is usually accepted that system is subjected to the excitation with frequency division, expressed as ωchip/m, in equation (1), and m is a positive integer, which is dependent of dynamic characteristics of system. The peak amplitude of the periodic cutting forces (ΔQ0x and ΔQ0y), which are associated with stationary cutting force (
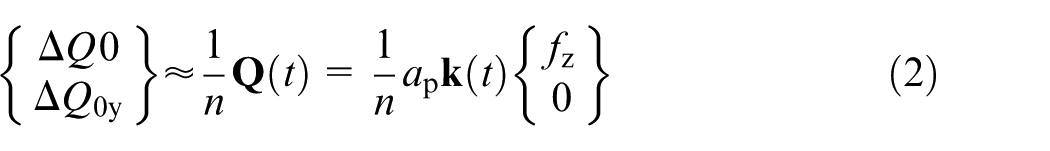
where ap is axial depth of cut and fz is feed per tooth. Elements of the so-called specific cutting force variation matrix
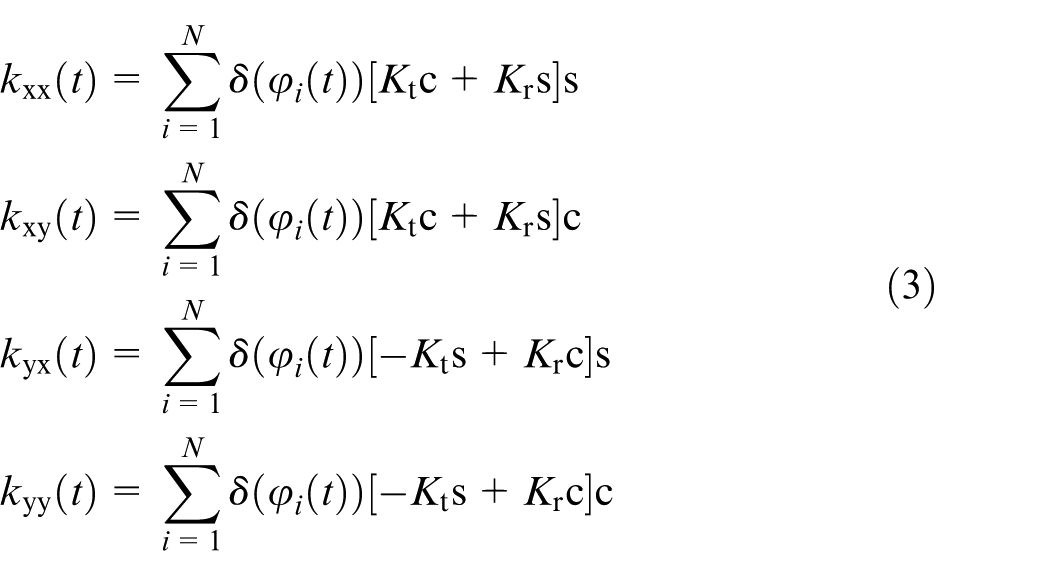
where c = cos φi(t); s = sin φi(t); N is the number of teeth; δ(φi(t)) is a Heaviside step function that assumes a value 1 when cutting tooth is engaged in cutting process and 0 when tool is out of the cut; Kt and Kr are tangential and radial cutting coefficients, respectively; φi(t) = Ωt+(i −1)2π/N is location of the ith tooth; and Ω is the rotating angular velocity (rad/s).
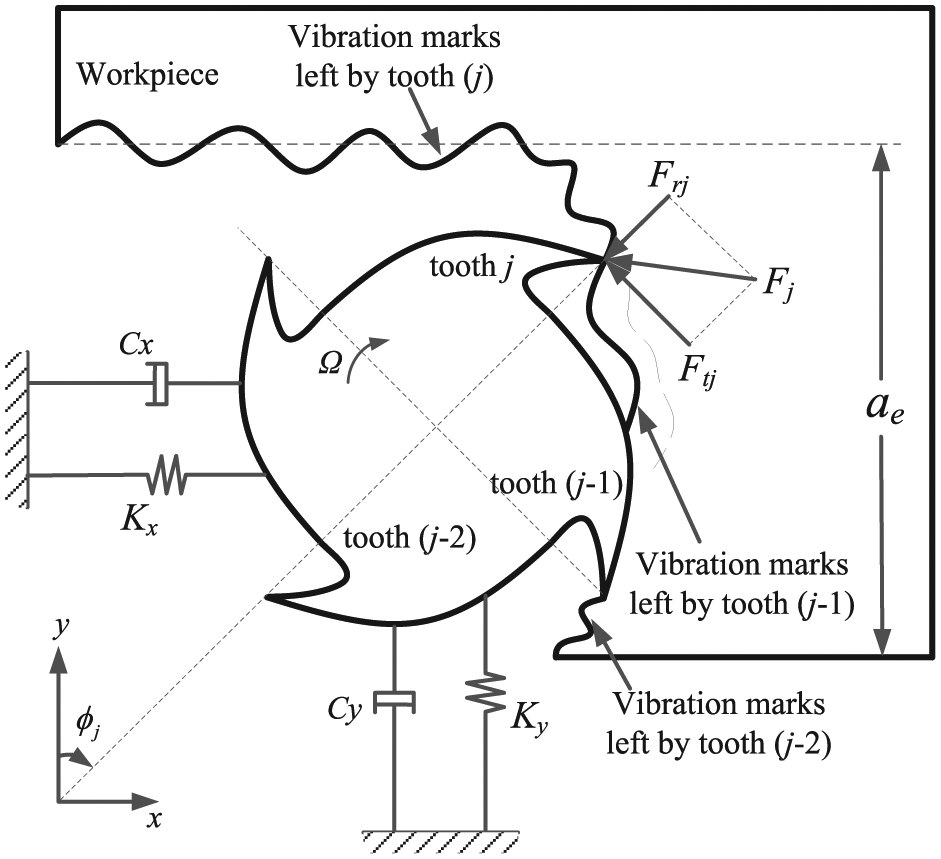
2-DOF milling model.
Since the stationary cutting force is periodically changed with time due to variable cutting thickness (characteristic A), the peak amplitude is also a periodic function of time. Here, n is a calibration constant that accounts for true amplitude of the periodic cutting force at the segmentation frequency. Therefore, governing equation of chatter-free milling system including impact vibration is
where
Additionally, except for variable cutting thickness (characteristic A), the other two primary different characteristics between milling and turning processes, interruption (characteristic B) and helix angle (characteristic C), must be considered. Characteristic B (interruption) is related with tooth pass frequency. A more comprehensive milling force model, including unequal pitch, variable helix angle, and variable rake angle, is described in Compean et al. 3 It should be mentioned that besides this mechanistic method, the numerical method can also be adopted to predict the cutting force. Gonzalo et al. 27 combined these two methods to model a milling operation in order to estimate the cutting force, where the numerical part was realized by the finite element method (FEM), and correspondingly, some complex tool geometries, such as ball-end-milling ends, can be modeled. In this article, since the impact of segmentation chip is difficult to consider in the FEM, only the mechanistic method is adopted.
As we know, there are six kinds of frequencies during milling process. 26 In comprehensive dynamic model for milling process, segmentation frequency also may appear under certain conditions, where segmentation chips occur. Due to the complexity of milling processes, segmentation frequency is associated with many factors, including helix angle, which will be studied in the next section.
Impact effects of segmentation chip
Chip segmentation frequency
Due to existence of helix angle, formation of saw-toothed chip can be simplified into oblique cutting mode. As shown in Figure 2, there is an angle, θ, between basal plane (parallel to the direction of cutting speed) and cross section of saw-toothed chip. Tooth pitch pc (saw-to-saw distance) and tooth height h (length of undeformed surface) of saw-toothed chip are, respectively, measured at different locations to investigate the geometrical characteristics of the cross section of saw-toothed chips in milling Ti6Al4V.
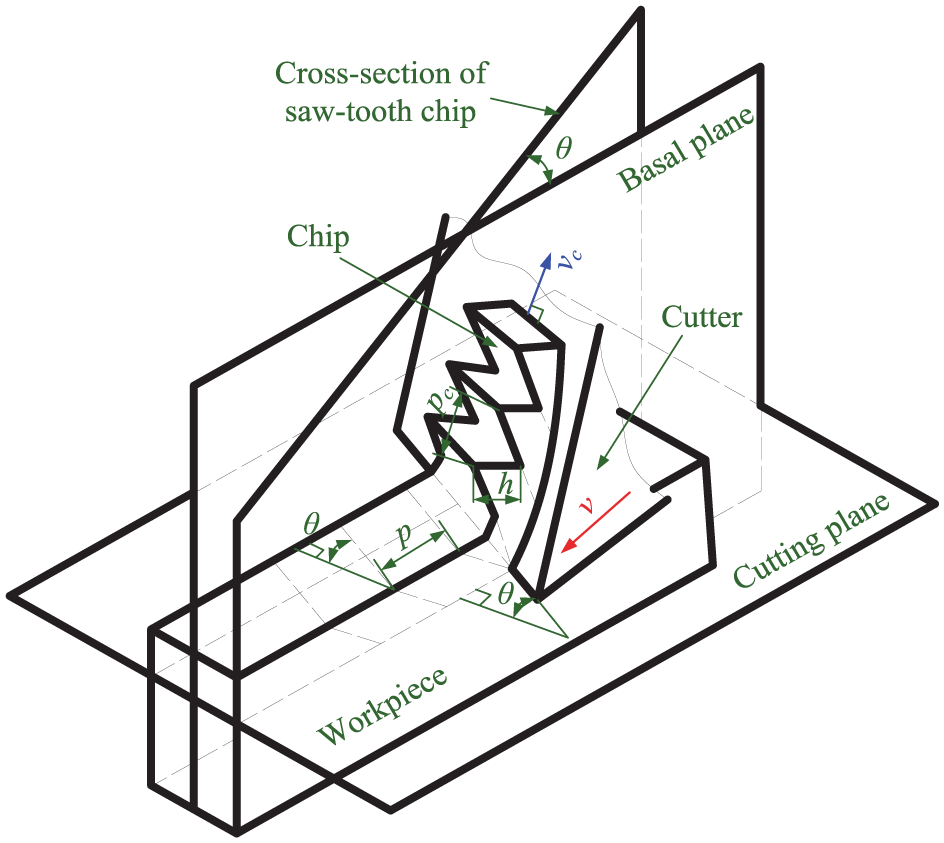
Formation of saw-toothed chip in oblique cutting.
It is assumed that mean sliding speed of chip on tool rake surface is vertical to saw tooth, and mean tooth pitch between two shearing planes is periodic in segmented-chip region (Figure 2). Thus, segmentation frequency of saw-toothed chips may be found as follows
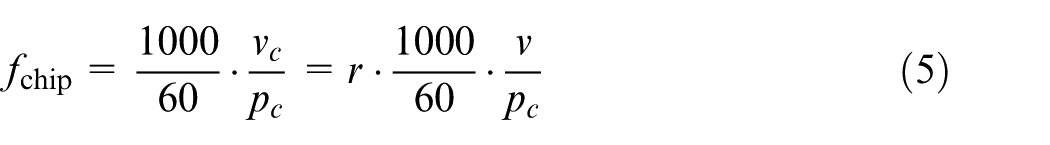
where fchip is the chip segmentation frequency determined from chip geometry; vc is the sliding speed of chip, which is vertical to saw tooth; pc is the saw-tooth pitch between two shearing planes; v is the cutting speed; and r is the cutting ratio for chip, that is, r = vc/v.
Microscopic measuring results of the replica reveal that mean distance between peak and valley on free surface of chip is accorded with the mean distance between cracks on workpiece surface, p, and proportional to feed rate and has no relationship with spindle speed. 11 Meanwhile, due to the existence of oblique cutting angle, cutting speed is not perpendicular to chip movement direction. However, this angle can be approximated using oblique cutting angle, θ. Therefore, a convenient method of finding r is to divide the mean tooth pitch (pc) by mean value of tooth height h (= p), which is expressed as
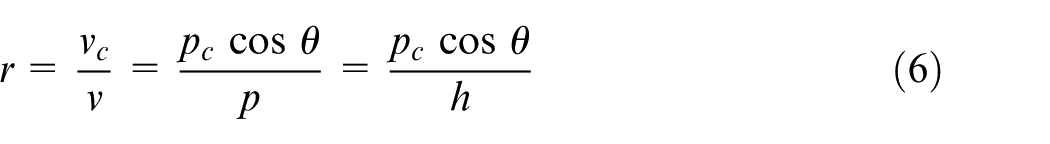
where p is the distance between cracks on workpiece surface (mm), h is the value of tooth height (mm), and θ is the angle between basal plane and cross section of saw-toothed chip. Substituting equation (6) into equation (5), segmentation frequency can be modified as follows
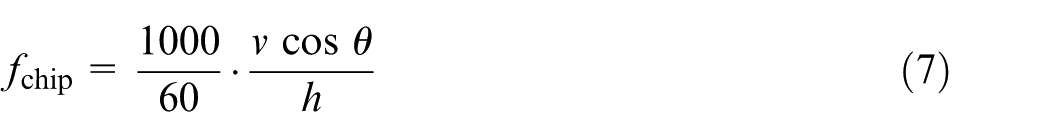
Equation (7) can be used to calculate segmentation frequency when cutting speed and tooth height are known.
Impact vibration
In order to qualitatively analyze the relationship between segmentation chip frequency and vibration of cutting system, with the assumption of cutting force as input and tool displacement as output, amplitude–frequency response analysis is employed, and amplitude ratio is adopted. As mentioned above, amplitude of response under periodic force
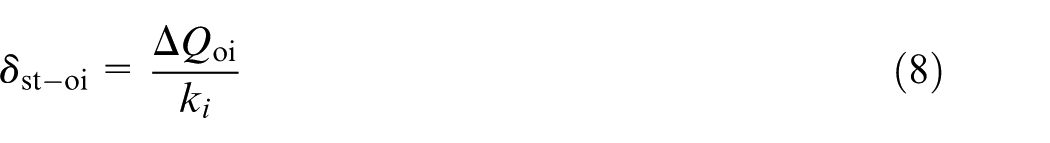
where i = x, y and kx and ky represent stiffness of cutting system in the x and y directions. The amplitude ratio represents ratio of dynamic to static amplitudes of response, also called magnification factor or amplification factor, and can be expressed as
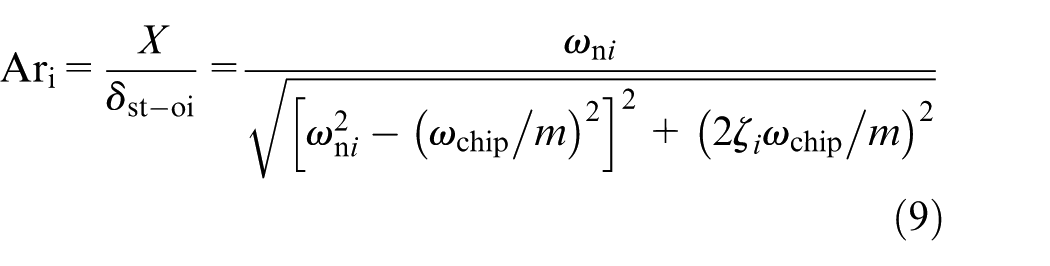
where i = x, y; ω represents frequency of exciting force; and ωnx, ζx and ωny, ζy represent natural frequency and damping ratio of cutting system in the x and y directions, respectively, all of which can be determined by impact testing in the following section.
From equation (9), it can be seen that existence of the segmentation chip may induce strong vibration and poor surface location error (SLE) when resonant occurs. In addition, it can been seen that when the frequency of the segmentation chip increases by 4 times, the first mode of a structural element could cause excessive vibration of that element, 11 which increases the chance of occurrence of high-level segmentation-driven vibration. Therefore, when selecting machining parameters, besides self-excited vibration and forced vibration, segmentation-driven vibration should also be considered simultaneously. When the division frequency of segmentation frequency is close to some natural frequency of system, resonance induced by segmentation chip occurs. Figure 3 shows stability charts (bold solid lines) and segmentation frequencies (thin dash lines). The first and second modal parameters are as follows: masses are 0.533 and 0.1609 kg (in the x and y directions, same as below), damping ratios are both 0.015, and values of stiffness are 1.20 × 10⁶ and 1.01 × 10⁶ N/m. Cutting coefficients are Kt = 1.80 × 10⁹ N/m2 and Kr = 2.88 × 10⁸ N/m2, which can be determined by many methods presented in several literatures, such as the root mean square method of average cutting forces in milling tests, 28 the identification method with the orthogonal to oblique experimental data 29 and the direct way by the 3D cutting simulations or experimental oblique cutting tests. 27 Other computational parameters are as follows: diameter of cutter D is 8 mm, helix angle α is 30°, number of tooth N is 2, radial depth of cut ae is 2 mm, feed per tooth fz is 0.1 mm/tooth, and down-milling and tooth height h is assumed as a constant value and is 0.3 mm.
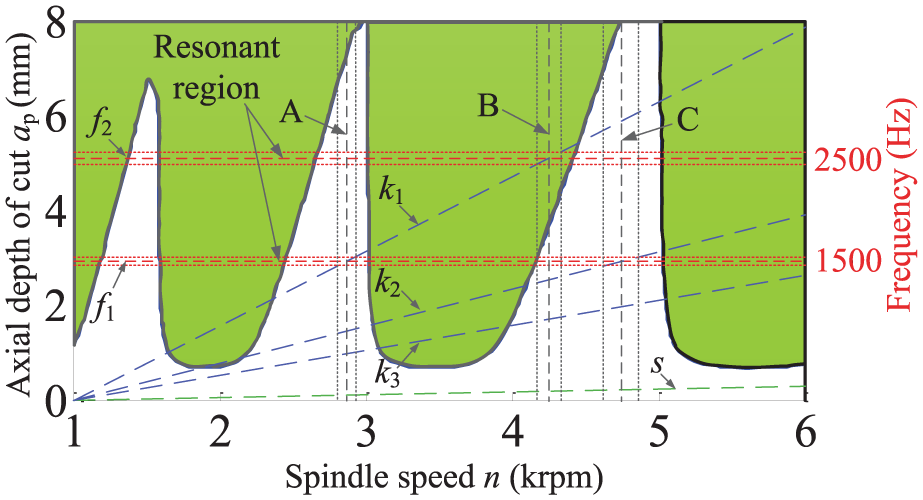
Stability charts (black and bold solid lines) and segmentation frequency curves (blue and thin dash lines).
In Figure 3, black and bold solid lines indicate the stability limits; blue and thin dash lines (k1, k2, and k3) indicate the segmentation frequency curves; and lines f1 and f2 express the first and second natural frequencies of system, respectively. Noted that the resonant regions (calculated by half power method) corresponding to the first two natural modes (f1 and f2) are shown in this figure, so there are three lines for each natural mode. Line s indicates the tooth pass excitation frequency. For multivariable milling tool, the process to calculate the stability lobes can be found in Compean et al. 3 From Figure 3, it can be seen that segmentation-driven vibration frequencies are proportional to spindle speed. It is due to the assumption that tooth height h maintains a constant value when spindle speed changes, which results in the spindle speed being the only variable when tooth height is selected in equation (7). Forced vibration may take slight influence in milling process since tooth pass frequency (curve s) is far away from resonant region of the system. However, segmentation chip may have important influence on determining dynamic characteristic of the milling process. For example, primary (curve k1) and half (curve k2) segmentation frequency intersects with resonant region in speed regions A, B, and C, which means excessive vibration can be induced by segmentation. Although the stable limit is correspondingly high in these regions, poor machined surface quality may be made due to resonance induced by segmentation. In addition, when spindle speed increases, curve k3 can also intersect with the resonant region, and there are six regions that segmentation frequency can intersect with the resonant region.
Experimental setup and design
Experimental setup
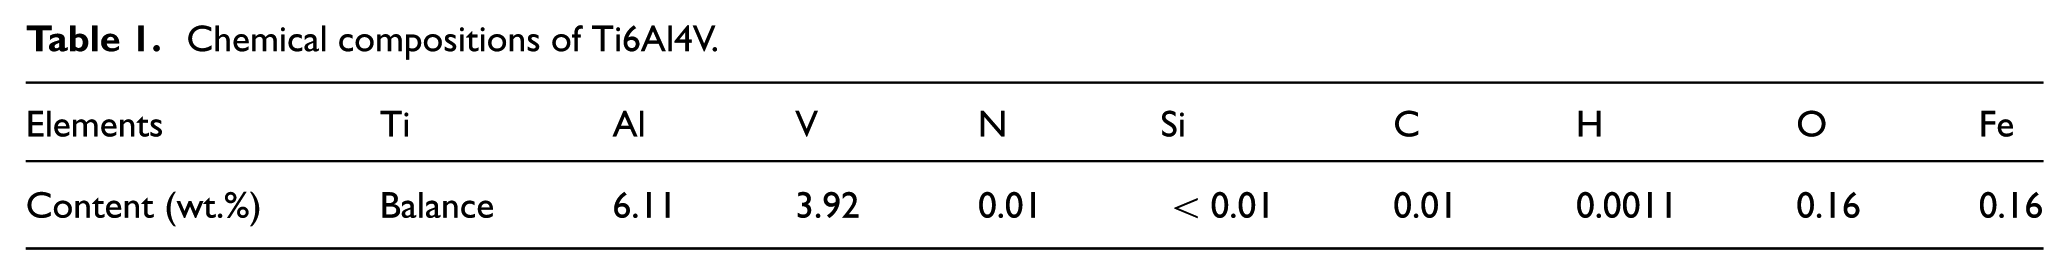
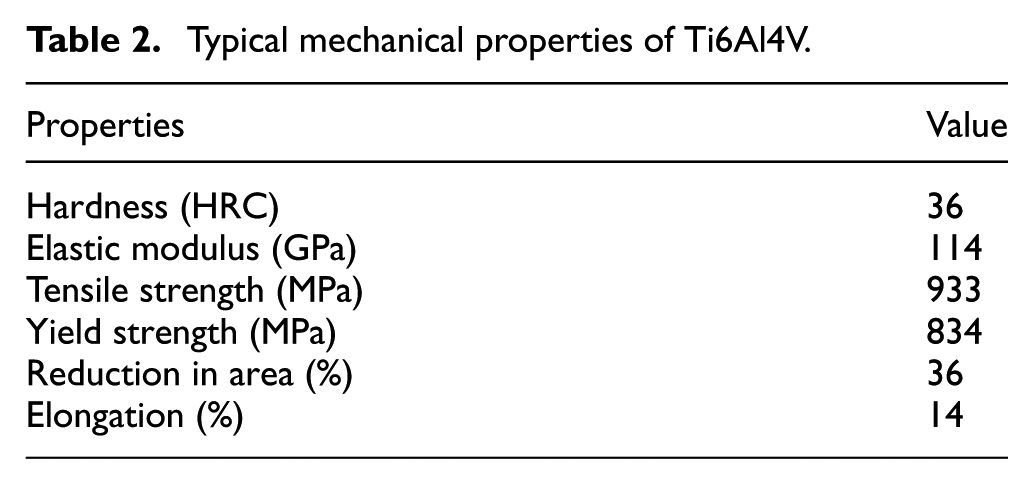
The machining center used for this study is a vertical computer numerical control (CNC) machining center (DAEWOO ACE-V500) with a spindle (15-kW motor drive) that can rotate up to 10,000 r/min. The cutting tools used in experiments is a two-fluted cemented carbide flat-end-mill (type F2AH0800AWL30 K600) supported by Kennametal tool company, with total length of 100 mm, diameter of 8 mm, and helix angle of 30°. Titanium alloy, which offers excellent mechanical properties, is able to be operated at higher temperatures. Although different types of Ti alloys (e.g. α+β-titanium alloy, γ-titanium alloy, and so on) have different mechanisms of chip formation, the purpose here is only concentrated on the influence of serrated chip on vibration regardless of the saw-toothed chip formation mechanisms and regenerative chatter for machining titanium alloy. Therefore, without loss of generality, a rectangular block (100 mm × 80 mm × 45 mm) of α+β-titanium alloy, Ti6Al4V, in the annealed con-dition, is prepared for the milling experiments. The chemical composition, thermomechanical properties, and microstructure of material are given in Tables 1 and 2 and Figure 4(a), respectively. The microstructure of Ti-6Al-4V is mainly composed of equiaxed α grains and a small amount of intergranular β phase (does not exceed 8%). The average α-grain size of Ti-6Al-4V is 20 µm. 30
Chemical compositions of Ti6Al4V.
Typical mechanical properties of Ti6Al4V.
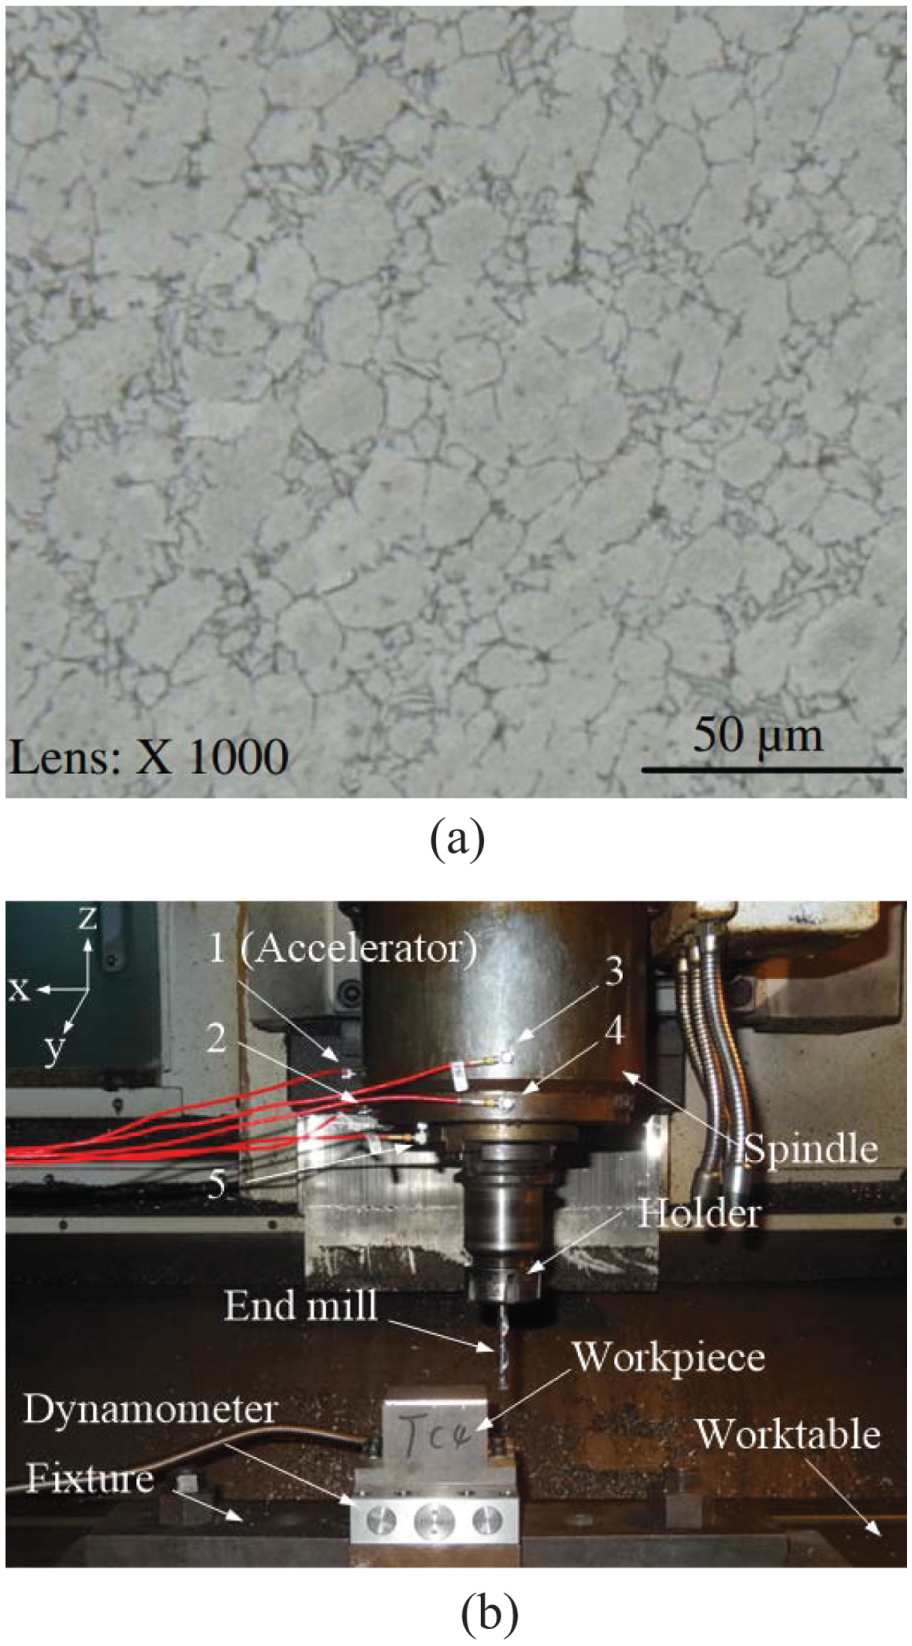
(a) Optical micrograph of Ti6Al4V alloy and (b) experimental setup.
As shown in Figure 4(b), a dynamometer (Kistler type 9257B) is mounted on machine table to measure cutting forces, and instantaneous cutting force components in the x, y, and z directions are recorded down through a signal analyzer software (type 2825A-02 Dyno Ware) after amplification using a multichannel charge amplifier (type 5070A). The feed direction is in the x direction, and workpiece is mounted on dynamometer through a specially designed fixture. In order to measure dynamic response of combination of end-mill and holder–spindle assembly, five accelerometers (Dytran type 3035B) are attached to spindle by magnet bases. The accelerations in the x, y, and z directions are measured by accelerometers 1 and 2 (x direction), 3 and 4 (y direction), and 5 (z direction), respectively (see Figure 4(b)). The instantaneous acceleration signals are collected by a data card (Brüel & Kjær (B&K) type 3560C). Then, these data are recorded and conducted fast Fourier transformation (FFT) by vibration analysis software (B&K type PULSE 10.0).
Experimental procedure
There are three different types of experiments performed in this article: dynamic tests, cutting tests, and chip identification tests.
Dynamic tests
Experimental modal analysis (EMA) is performed to obtain modal parameters of milling system. In order to investigate the effects of spindle and accessories on dynamic characteristics of the cutting system, dynamic tests are conducted on spindle-holder assembly without cutter and spindle-holder-tool assembly, respectively. To obtain the dynamics of spindle and milling machine, a series of conventional impact hammer tests are performed in this research. An impact hammer (type CL-YD-303) with sensitivity of 4.29 pC/N is employed to excite the structure. The responses are measured using five accelerators (Dytran type 3035B) with sensitivity of 100 mV/g, weight of 2.5 g, and maximum sample frequency of 10 kHz, as shown in Figure 4(b). In order to improve the quality of impact force, trigger is made using force signal, which only records the signal greater than a set value. Meanwhile, coherence function and spectrum of force are also considered in judging the quality of an impact force. Additionally, the collected data are analyzed by MATLAB toolbox, which contains an embedded anti-aliasing filter that prevents the data to be contaminated by very high-frequency noise before conducting FFT, and average values of the data are calculated. Here, an average from four samples is used. Care is taken to avoid any over loading or a double impact from hammer. The data are collected through a data card (type 3560C) supported by the B&K Corporation and recorded and conducted FFT by a vibration analysis software (B&K type PULSE 10.0) to obtain frequency response function (FRF). The real part and imaginary part of FRF are then converted into ASCII files for further processing.
Cutting tests
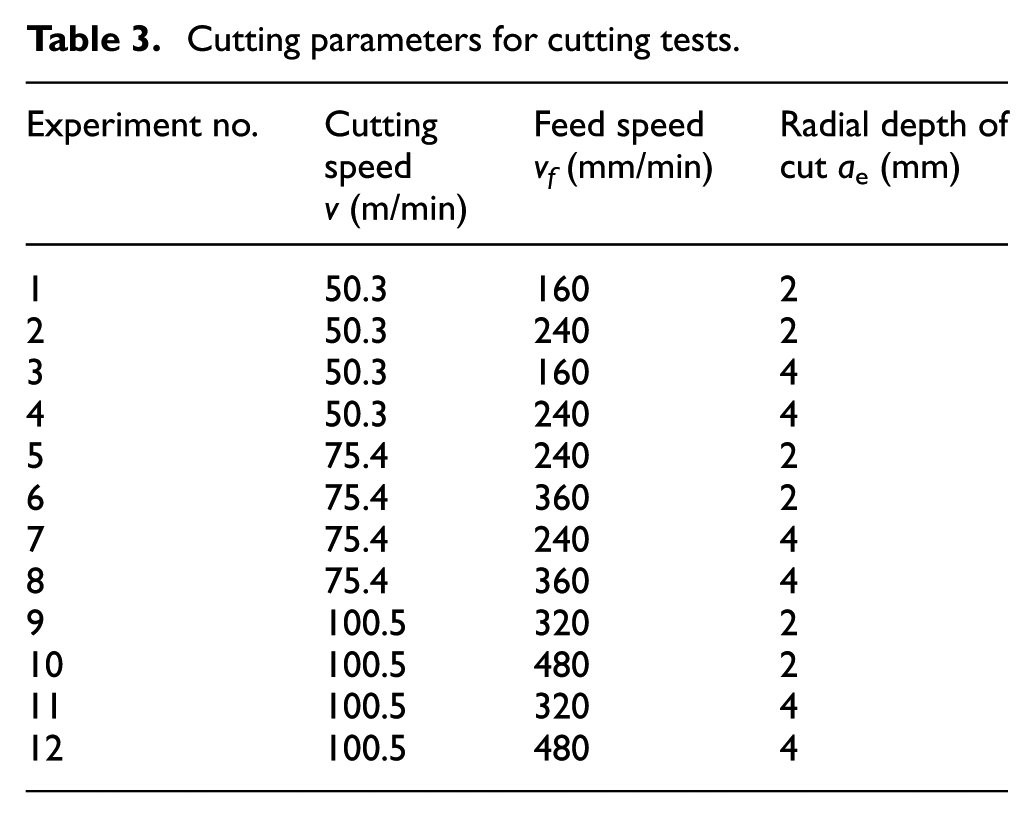
The machining tests are carried out in the type of down-milling operation and dry cutting. Down-milling results in a thick-to-thin chip, which is the best practice for titanium milling, yielding better tool life than up-milling. The thin chip reduces the shock load and the chance of breaking of the tool’s cutting edge. To satisfy the requirements of the study, cutting parameters are selected and determined according to the results and recommendations given in Wang et al.30,31 There are 12 cutting conditions (1–12) used, as detailed in Table 3, and the axial depth of cut is 2 mm for all conditions. Note that the stable cutting conditions are selected to avoid the chatter. 26 Additionally, both tooth pass frequencies and spindle rotating frequencies are lower than 134 Hz (maximum spindle speed is 4000 r/min according to maximum cutting speed of 100.5 m/min with tool diameter of 8 mm and two flutes) under these cutting conditions. Thus, in concerning frequency range, forced vibrations due to static cutting forces cannot occur. Cutting tests at each condition are repeated until consistencies of the experimental values are obtained. For each cutting process, both accelerations and cutting forces are measured and recorded through five accelerators and one dynamometer in the x, y, and z directions. And chips are collected and marked corresponding to the experiment number for further identifying.
Cutting parameters for cutting tests.
Chip identification tests
After cutting test, chips are collected and marked corresponding to the experiment number (1–12), for example, “chip 6” indicates that chip is formed under cutting condition 6 (v = 75.4 m/min, vf = 360 mm/min, ae = 2 mm, ap = 2 mm). Chips obtained after machining are first mounted with epoxy so that they can stand on their edge in order to make the cross section after polishing straight across its length. Note that milling process is interrupted and oblique cutting because of helix angle. The chips formed are serious curly and irregular. Thus, chips need to be unfolded carefully before mounting with epoxy. Additionally, to accurately adjust the chip location when mounting them, the cutting direction and chip flow direction also need to be marked attentively. The obtained mosaic blocks are examined with a VHX-600E optical microscope (KEYENCE Co.).
The cross section of a typical segmented chip obtained is shown in Figure 5, including the geometrical features that have been measured. Line A–B is the cross section of original undeformed surface, and its length is characterized by h. For each cutting condition, typically 10 times measurements are performed to determine an average value for h. The slipping angle (α, where C points to) is defined as the angle between the shear band and the tangent of the machined surface at the end of the shear band. pc indicates the distance between two teeth.
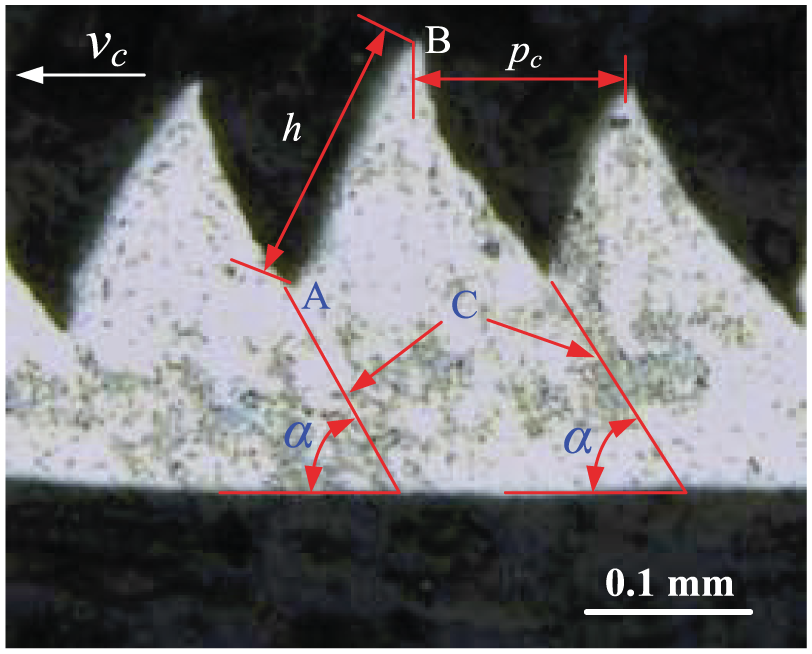
Segmentation dimensions for typical saw-toothed chips.
Result analysis and discussions
Modal characteristics
In modal tests, the length of tool overhang from holder is considered to be a very important factor when analyzing tool characteristics. Thus, in order to obtain the spindle–holder–tool assembly with better distinct modes, different tool overhang lengths are tried to see whether there is any region where the tool mode could be observed without coupling with other spindle modes. The converted real part and imaginary part of FRF are used to extract modal parameters. The code used to carry on the data fitting to the experimental findings based on the least squares method principle is written in MATLAB to obtain the desired FRF. The FRFs of spindle–holder assembly and their fitted curves in the x and y directions are shown in Figure 6.
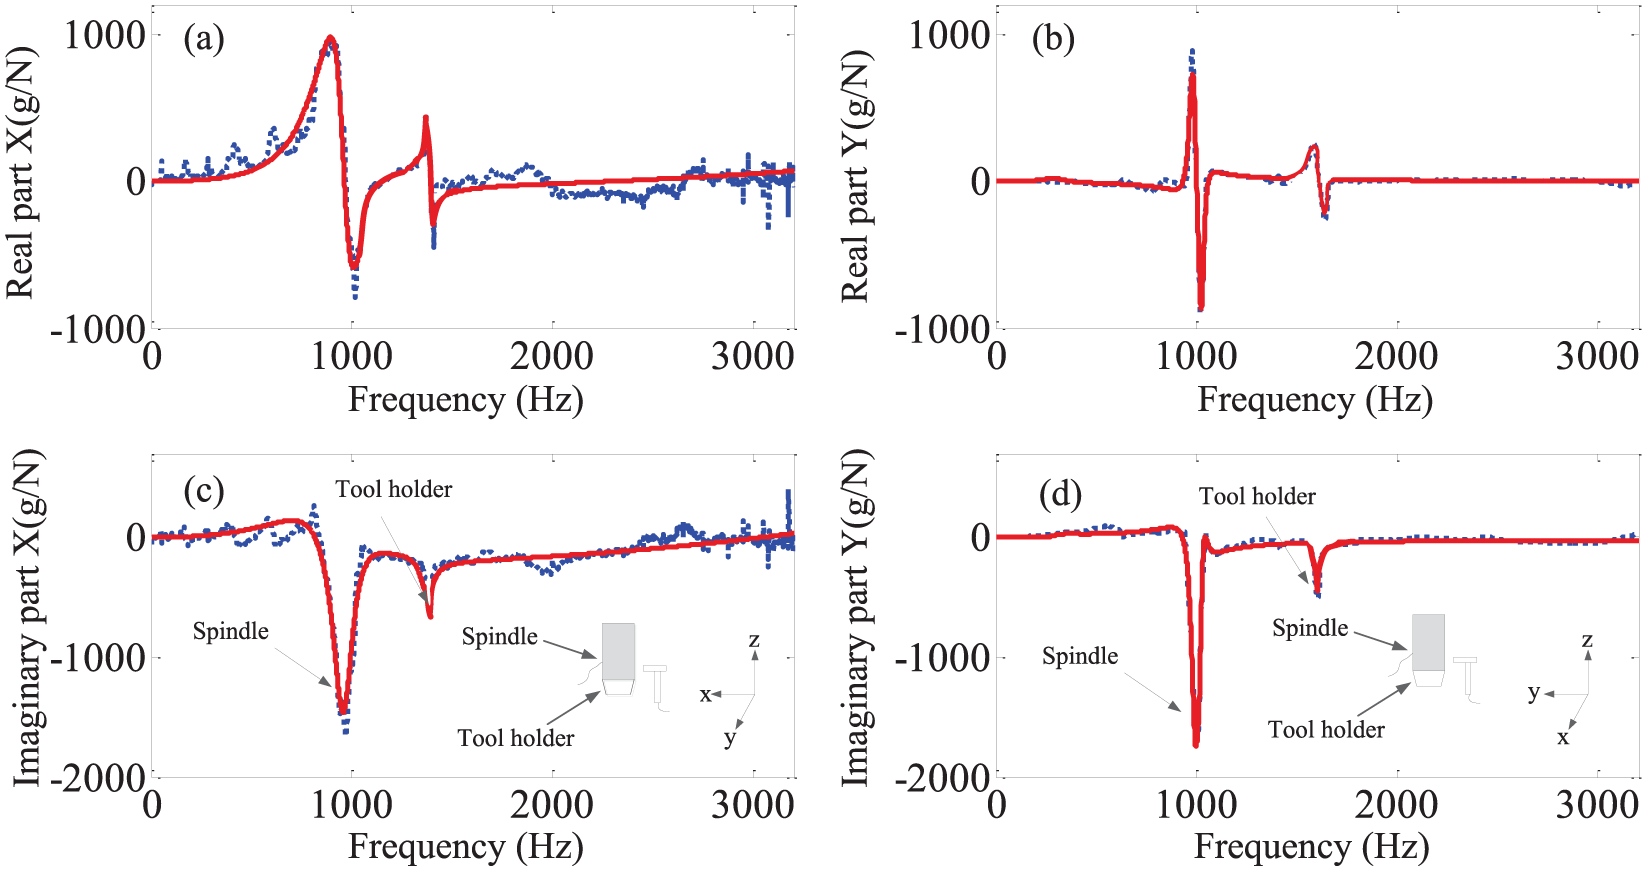
FRFs of spindle–holder assembly in the x and y directions: (a, c) FRFs in the x direction, (b, d) FRFs in the y direction, (a, b) real parts, and (c, d) imaginary parts.
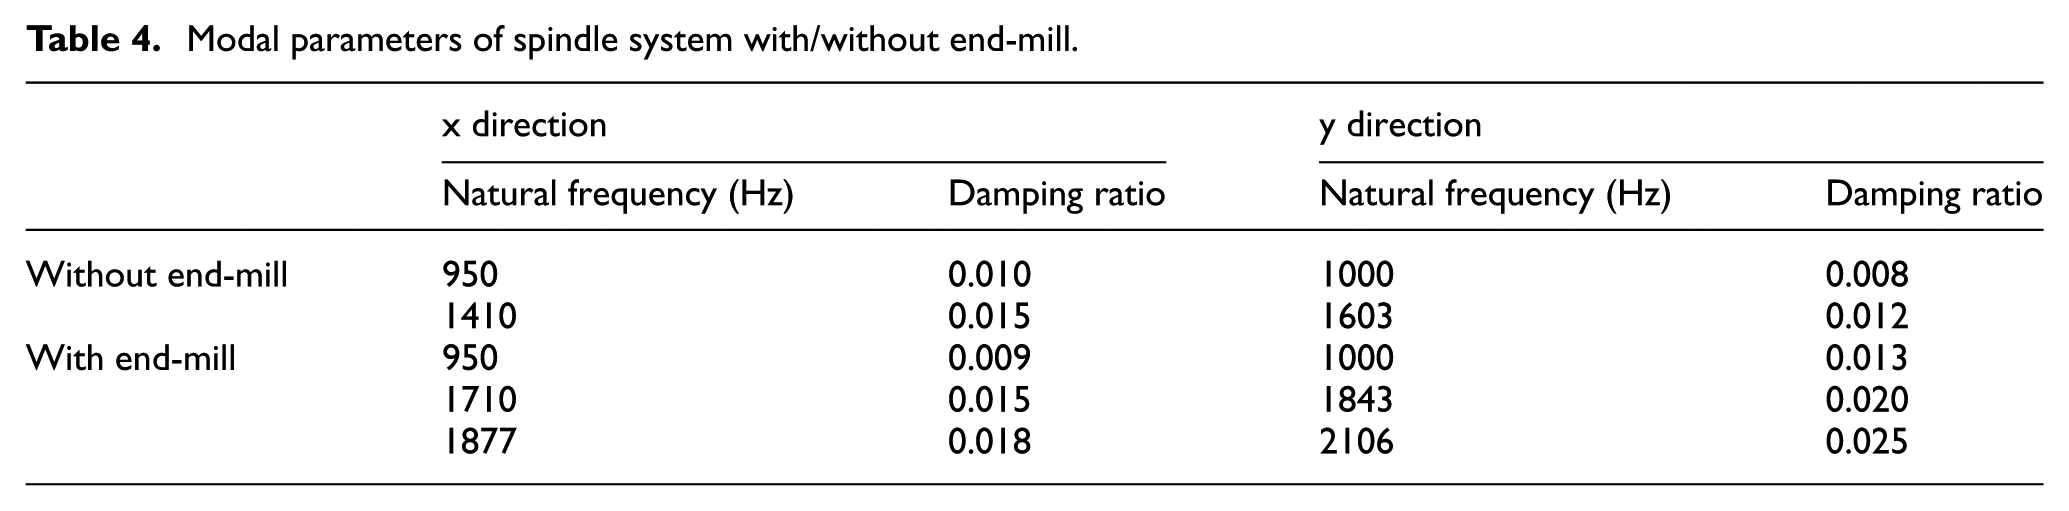
From Figure 6, it is obvious that the two natural frequencies are distinct, and the natural frequencies of spindle–holder assembly in the x direction are 950 (spindle) and 1410 Hz (holder), respectively. However, these frequencies also clearly indicate that any wrong judgments in the tool overhang length made will result in coupling modes and lead to difficulties in identifying modal parameters of spindle–tool system at later stages. Taking this into consideration, selection of tool overhang lengths is made to avoid any coupling with the existing modes. After performing careful measurements, it is found that an overhang of 60 mm will be the best length to observe the tool characteristics. In this condition, the real and imaginary parts of FRFs for spindle–holder–tool assembly in the x and y directions are shown in Figure 7. From Figure 7, it can be seen that in the x direction, a new frequency, 1877 Hz, appears, and the natural frequency, 1410 Hz, is shifted to 1740 Hz. The natural frequency appeared newly, 1877 Hz, is due to contribution of cutter. Although the chosen length seemed to have had a coupling effect (e.g. the second mode is close to the third mode, and coupling effects of these two modes exist more or less) on the existing modes, it is still considered to be the best overhang length and used to demonstrate the dynamic behaviors of spindle–tool system. Similar behaviors can be also noted in the y direction. According to the magnitude–frequency responses measured, the damping can be calculated using expression, c = 1/(|T|ωn) (|T| is module of FRF, and ωn is natural frequency), which is based on half power method. 32 Table 4 shows the measured modal parameters.
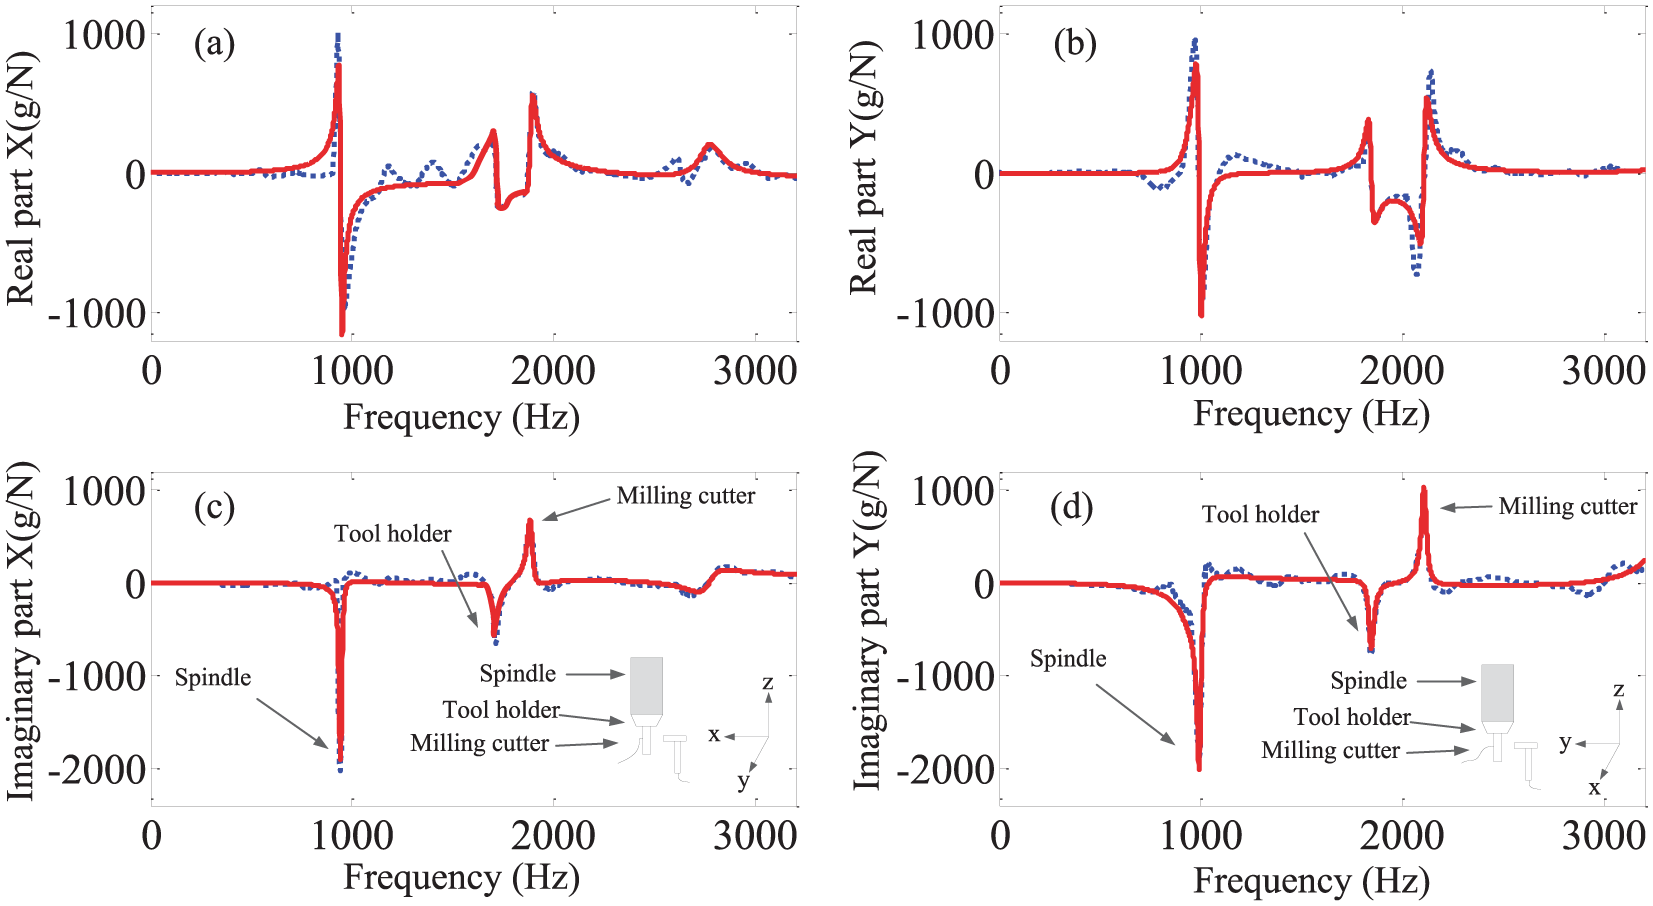
FRFs of spindle–holder–tool assembly in the x and y directions: (a, c) FRFs in the x direction, (b, d) FRFs in the y direction, (a, b) real parts, and (c, d) imaginary parts.
Modal parameters of spindle system with/without end-mill.
Characterization of chip morphology
The chip morphology is an important aspect which is commonly considered to evaluate the performance of cutting operations and contains a lot of important information. For example, in this article, the segmentation formed frequency is obtained from the cross section of the top surface. However, the chip types are determined by the combined effects of types of cut (continuous or intermittent cut), work material properties, cutting tool geometry, cutting parameters, cutting fluids (type of fluids and method of applications), and other factors. Therefore, different cutting conditions can contribute to different chip morphologies.
Chip morphology
Generally, chip is described in three different angles, namely, back surface, cross section of the top surface, and free surface. As shown in Figure 8(a), instead of rectangle chips produced by orthogonal cutting, all these chips are in spiral shapes. In order to have a clear observation on the back surface, chip is carefully flattened to avoid breaking. Figure 8(b) shows the flattened chip, and due to the characteristics of spirality, the shape of flattened chip is parallelogram. Figure 8(c) shows the smooth and shiny back surface of chip under the combined actions of high contact pressures, frictional forces, and high temperatures. It can be seen from these figures that there are some parallel stripes on back surface induced by irregular cutting edges and/or potential hard particles. Although the distributions of contact stress, friction, and temperature at tool/chip interface are different under various machining parameters, the back surfaces share very similar characteristics.
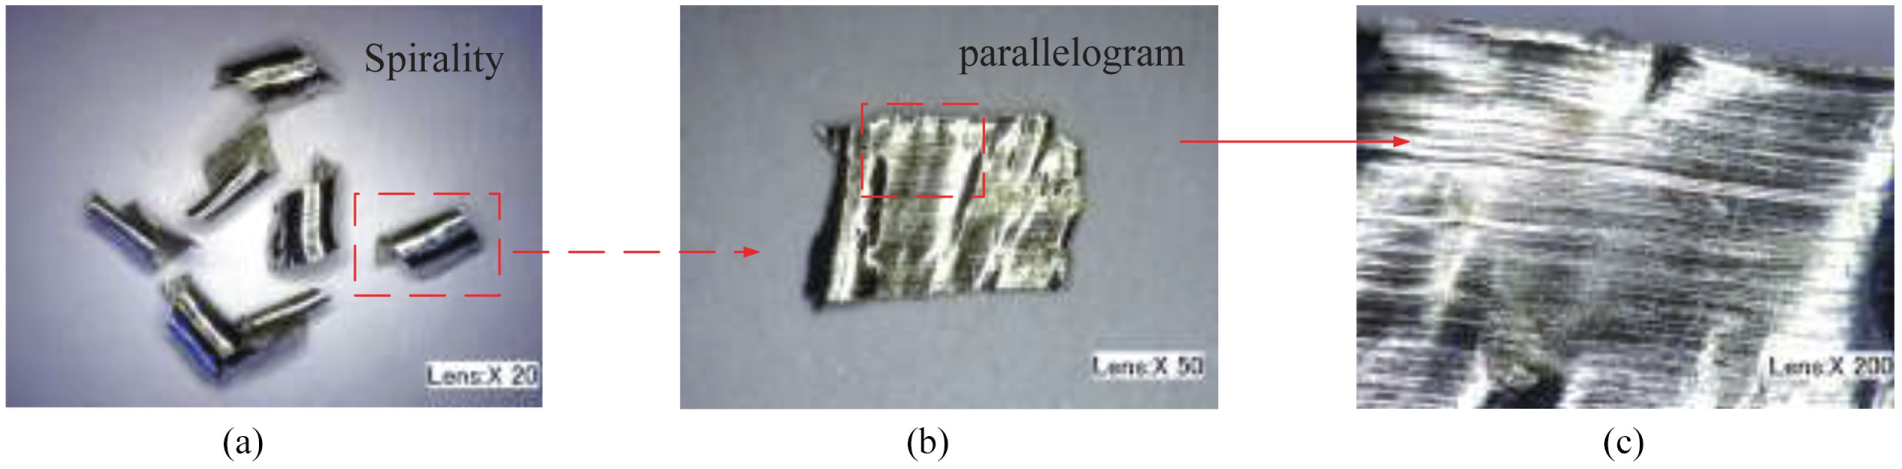
Chip morphologies on back surface of experiment 9: (a) without flattening chip (lens: ×20), (b) flattened chip (lens: ×50), and (c) local amplification chip (lens: ×200).
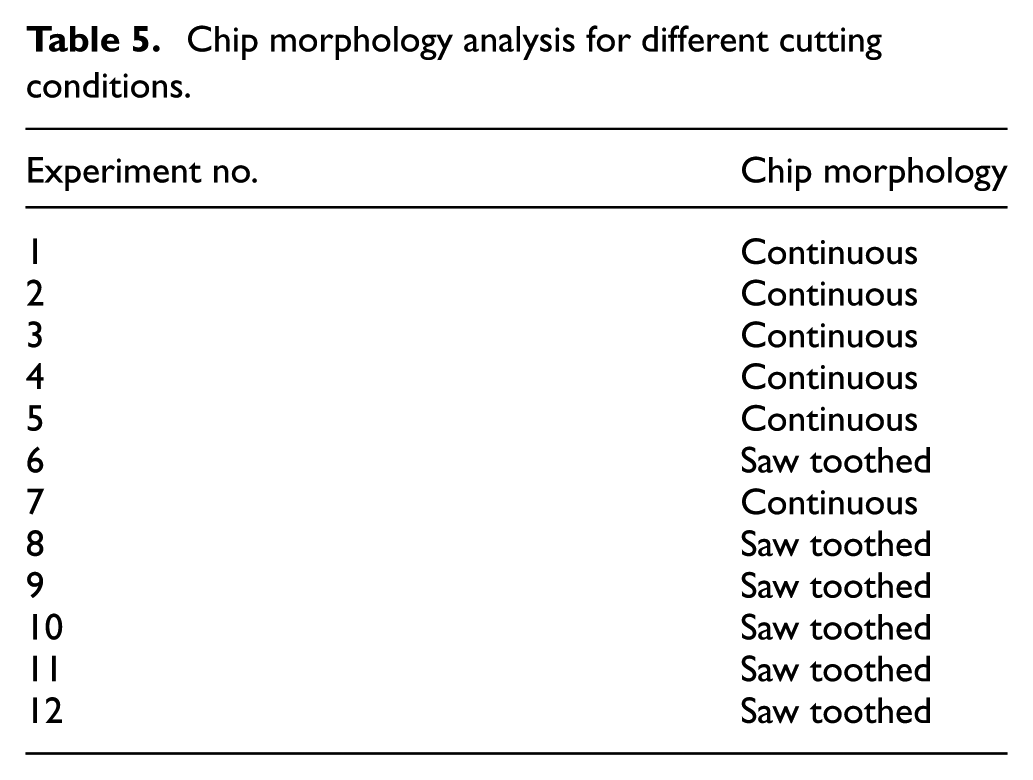
The images of cross-sectional top view of chips at different cutting speeds are shown in Figure 9. This view has been used by the majority of machining researchers. The characteristics of chips can be easily observed from the cross section of the top surface, for example, characteristics of saw-toothed chip can be observed in Figure 9(b)–(d) (chips 8, 9, and 10). From Figure 9, two different types of chips can be observed: near uniformly deformed continuous chip and saw-toothed chip. The continuous chips are produced at low cutting speeds and feeds, while saw-toothed chips are produced at relatively high cutting speeds and feeds. The chip morphology transition from continuous chip to saw-toothed chip is favored by combination of increasing cutting speeds and feeds. The combined effects of cutting speed and feed on chip morphology transition are summarized in Table 5. Based on the observation, cutting speed is the major contributor of serration, while the effect of feed speed is secondary.
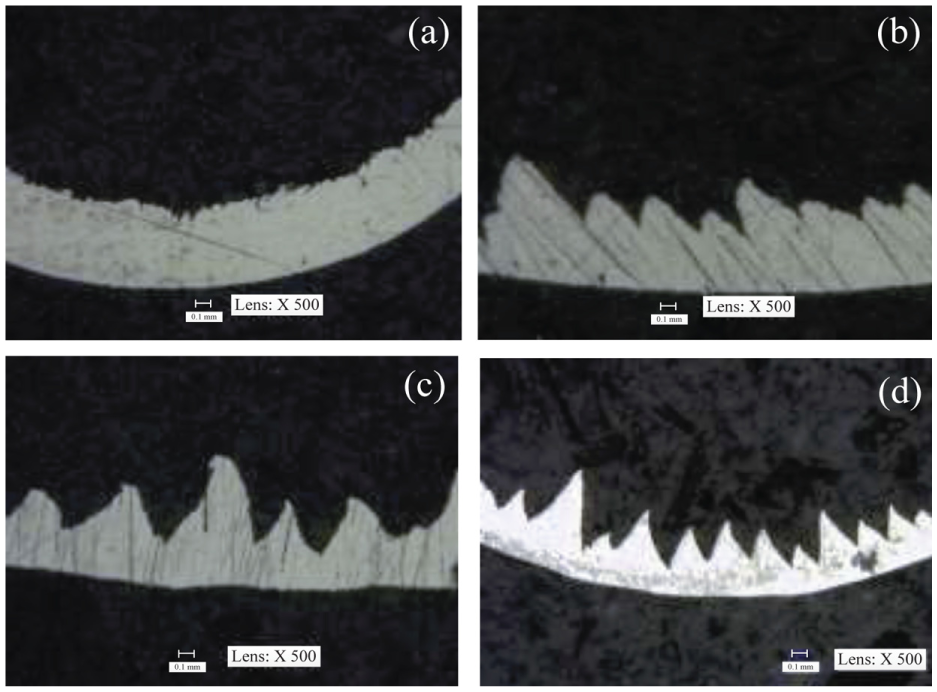
Cross-sectional top views of specified chips (lens: ×500): (a) chip 1, (b) chip 8, (c) chip 9, and (d) chip 10.
Chip morphology analysis for different cutting conditions.
Segmentation chip frequency
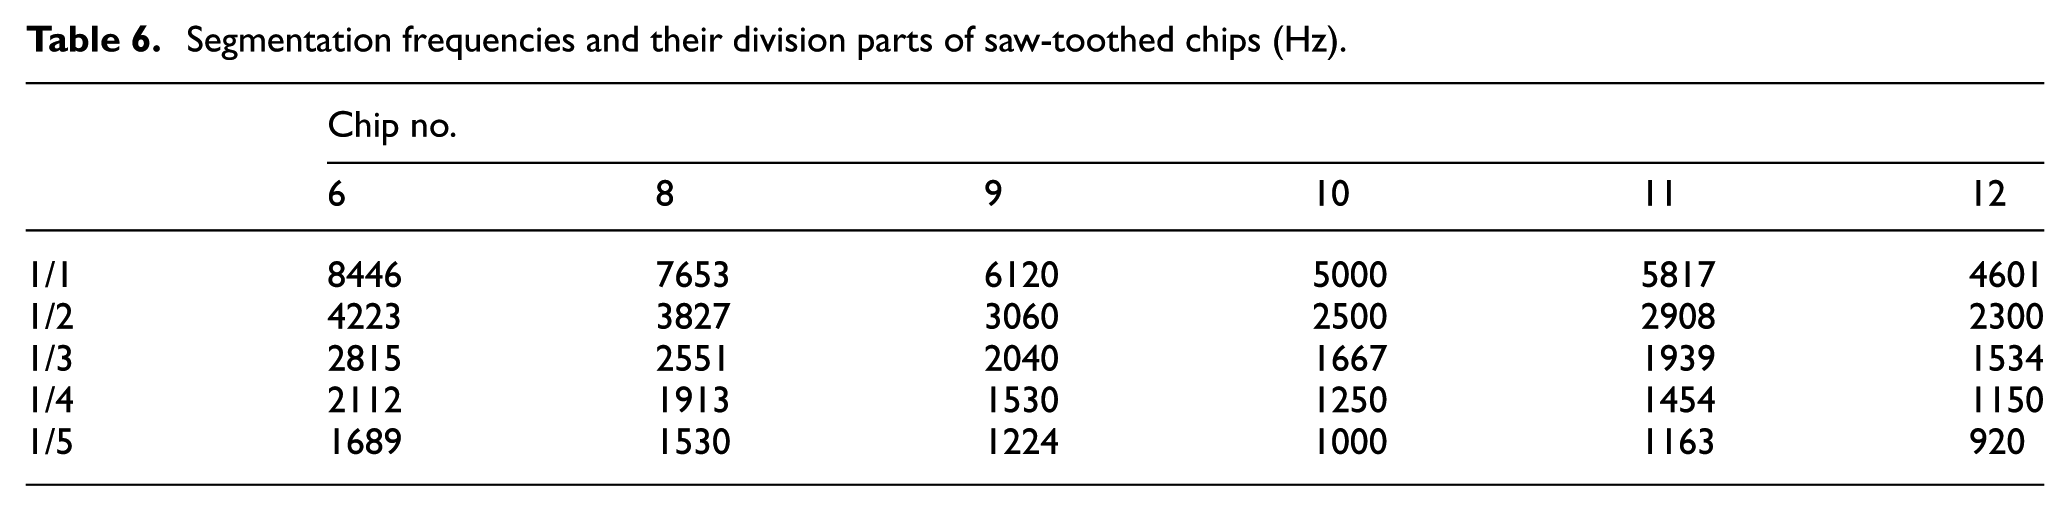
As analyzed previously, when cutting speed and tooth height are given, equation (7) can be used to calculate the segmentation frequency. Taking the saw-toothed chip in Figure 9(b) (chip 8) as an example, based on average value of tooth height h of chip measured at three different positions and cutting speed v (75.4 m/min), mean segmentation frequency of saw-toothed chip 8 is about 4601 Hz. Similarly, according to cross-sectional geometrical information (e.g. as shown in Figure 9(b) and (d)), segmentation frequencies of the other saw-toothed chips can also be calculated and given in Table 6. It can be seen that segmentation frequency has positive correlation with cutting speed, while it has negative correlation with feed rate. As for free surface of chip segmentation, since it has little influence on segmentation-driven vibration, the main attention is paid on cross section and back surface of chip segmentation. More details about free surface can be referred in the literatures. 33
Segmentation frequencies and their division parts of saw-toothed chips (Hz).
Relationship between experimental data
The cutting forces are measured in the x and y directions under 12 groups of cutting parameters given in Table 3. By observing 12 groups of cutting force components, it is worth noting that amplitudes of cutting forces in the y direction are larger than those in the x direction. Figure 10 shows the ratios of amplitudes of cutting forces in the y direction to those in the x direction. From Figure 10, it can be seen that amplitudes of cutting force components in the y direction are approximately 1.4 times than those in the x direction. Meanwhile, since shapes of two cutting force components are similar, only the y direction cutting force component is analyzed in the following section.
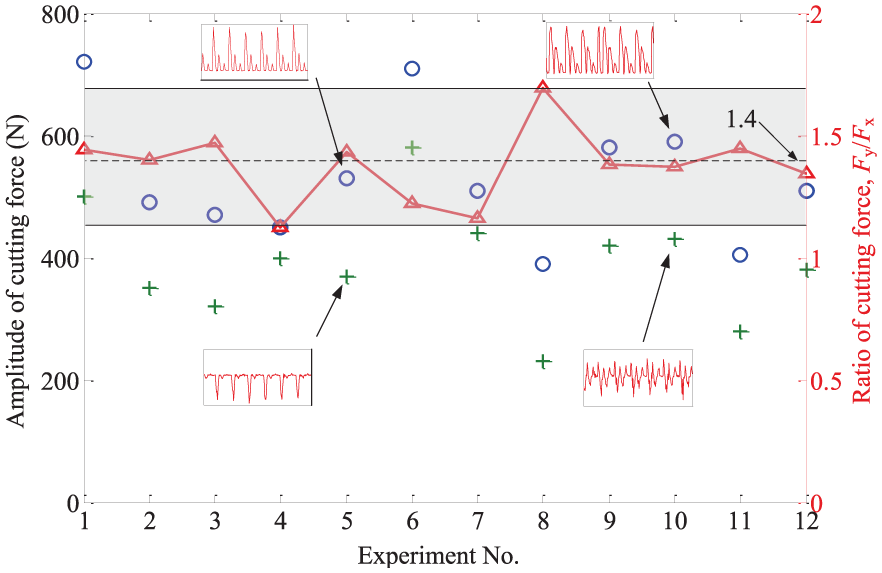
Amplitudes and ratios of cutting forces in the x and y directions.
Since cutting force measured in the y direction is mainly cared, acceleration component in the y direction is paid attention to. In order to find the relationship between cutting force, acceleration, and segmentation formed frequency, the obtained data are analyzed in the frequency domain. Figure 11 shows cutting force and acceleration in the frequency domain and imaginary part of FRF. The cutting forces are all mainly distributed in few frequencies. For example, in experiment 10, cutting force is distributed in 970, 1530, 1820, and 2000 Hz, which means cutting forces appear periodic fluctuation. This phenomenon may be attributed to cutting parameters, cutting types, cutting tools, and so on. In addition, acceleration also has similar phenomenon. However, these frequencies concentrate on some certain frequency, between which there is a multiple relationship. For example, in experiment 1, the distributed frequencies are 500, 1000, and 1500 Hz, whose primary frequency is 500 Hz.
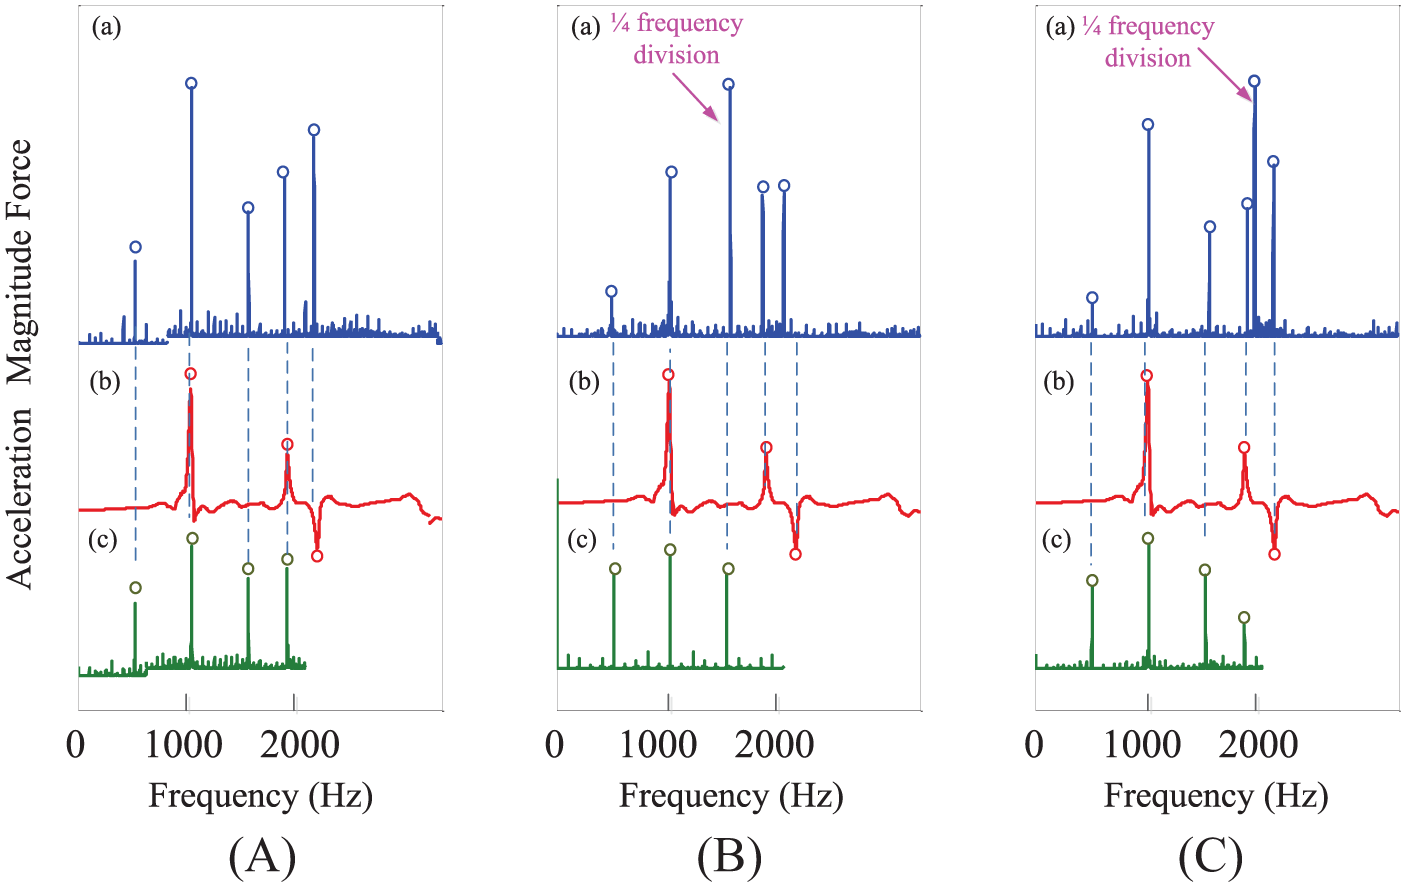
Relative frequency patterns of saw-toothed chips and continuous chip: (A) experiment 1, (B) experiment 8, (C) experiment 9, (a) cutting forces in the y direction, (b) imaginary parts of FRFs of system, and (c) acceleration data in the y direction.
It should be mentioned that the segmentation frequency is an order magnitude higher than that of acceleration, cutting force component, and modal parameters of the system. However, according to vibration theory, some fractional formation frequencies of saw-toothed chip can excite the lower-order modes of system and reduce responses with lower frequencies. Therefore, frequency division of segmentation frequency will be used in further analysis. Figure 11 also demonstrates that there are some correspondences between dominate frequencies of system modes, cutting acceleration, cutting force, and formation of saw-toothed chip. For example, in experiment 10 (Figure 11(B)), natural frequencies of the assembly are all included in cutting force frequency pattern, as well as cutting acceleration. Meanwhile, it is worth noting that both acceleration and cutting force have peaks in 1/4 frequency division of the saw-toothed chip. The similar phenomenon also exists in experiment 11 (Figure 11(C)). However, in experiment 1 (Figure 11(A)), cutting force frequencies only concentrate on natural frequencies of spindle–holder–tool assembly. The reason is that cutting force can be decomposed into three parts, namely, self-excited force, stationary cutting force, and segmentation formed force. However, self-excited force can be neglected due to the stability machining condition. Thus, segmentation formed force and stationary cutting force play the important role. Additionally, as shown in Table 5, it should be noted that experiment 1 produces continuous chip, while experiments 10 and 11 produce saw-toothed chip. Therefore, maximum cutting force is distributed in natural frequency of the milling system in experiment 1.
Influence of segmentation-driven vibration
As shown in Figure 10, the ratios of cutting force components in the x and y directions do not change significantly and are still in the vicinity of a value. Therefore, the amplitude ratio expressed in equation (9) is approximately proportion to the amplitude of response and can indirectly be used to uncover the vibration of cutting system. Based on Equation (9) and the system modal data (first mode: ωn1=1000Hz, ζ1=0.013; second mode: ωn2=1843Hz, ζ2=0.020; third mode: ωn3=2106Hz, ζ3=0.025) given in Table 4, Figure 12 shows the amplification factor curve for different frequencies (in the frequency range of 600-4500Hz). In Figure 12, variations of amplitude factors in the y direction for the three modes are indicated in red solid line (first mode), blue dashed line (second mode), and green dotted line (third mode), respectively. The fractional frequencies of segmentation frequency given in Table 6 are also shown. Symbol + indicates 1/2 frequency division, symbol Δ indicates 1/3 frequency division, symbol □ indicates 1/4 frequency division, and symbol ○ indicates 1/5 frequency division.
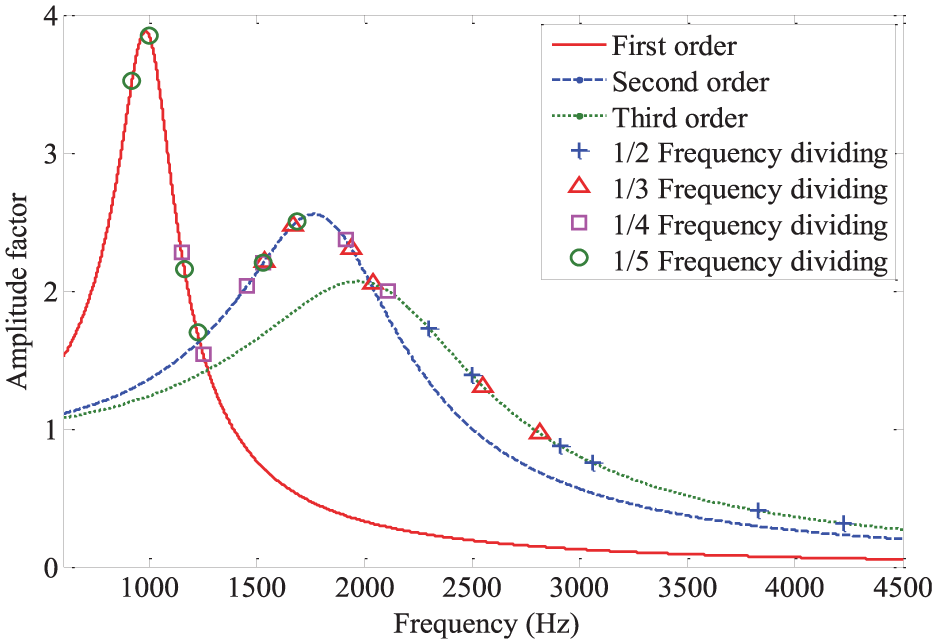
Variation of amplitude factor in the y direction with frequency.
Although the efforts have been made to adjust the tool length for more separated system modes, the second and third modes are still close to each other and have worse separated property. The coupling effects between them should be noticeable. Therefore, it seems unreasonable to consider the dynamic behaviors of the system as three quasi-single degrees of freedom (SDOFs, equation (9)). However, in this paper, since the overall trend of amplitude factor is not affected significantly, it is assumed that these three modes are enough separated, and coupling effects between them can be neglected. From Figure 12, it can be seen that the peak amplitude ratio of the first and second modes is larger than that of the third mode, which is due to the effect of cutter.
In the adjacent regions of the peak amplitude of three modes, there are some fractional frequencies of the segmentation chip, which indicates the high amplitude of acceleration, which means that the chip segmentation induces excessive vibration. For example, in experiment 6, the 1/4 fractional frequency is near the natural frequency of the third mode (tool); in experiment 8, the 1/4 fractional frequency is near the natural frequency of the second mode (holder); in experiment 9, the 1/3 fractional frequency is close to the natural frequency of the third mode (tool); in experiment 10, the 1/5 fractional frequency is the natural frequency of the first mode (spindle); in experiment 11, the 1/3 fractional frequency is near the natural frequency of the second mode (holder); and in experiment 12, the 1/5 fractional frequency is close to the natural frequency of the first mode (spindle).
Although many factors affect chip shape and size (e.g. cutting parameters,8–10 tool edge shape, and coating), the formation of serrated chip is also a complex process. However, Figure 13 shows the amplitudes of acceleration signals measured by experiments. The comparison of these results with the results of chip shape given in Table 5 is only used to illustrate the influence of serrated chip on vibration. In fact, here the conditions of serrated chip formation were not evaluated. From Figure 13, it can be seen that the overall trend of the curve shows that the amplitudes of acceleration increase with decreasing of the base frequencies of segmentation chips. The reason is that smaller the base frequency of segmentation chip is, the closer it gets to the natural frequency of cutting system. However, in experiment 10, the trend is broken. The base frequency in experiment 10 is larger than that in experiment 6, while the amplitude of acceleration in experiment 10 is larger than that in experiment 6. This phenomenon also occurs in experiment 12. The possible reason is that the 1/3 fractional frequencies in experiments 10 (2040 Hz) and 12 (1939 Hz) are very close to the natural frequencies of the third (2106 Hz) and second (1840 Hz) modes. The coupling effects are highlighted in these conditions.
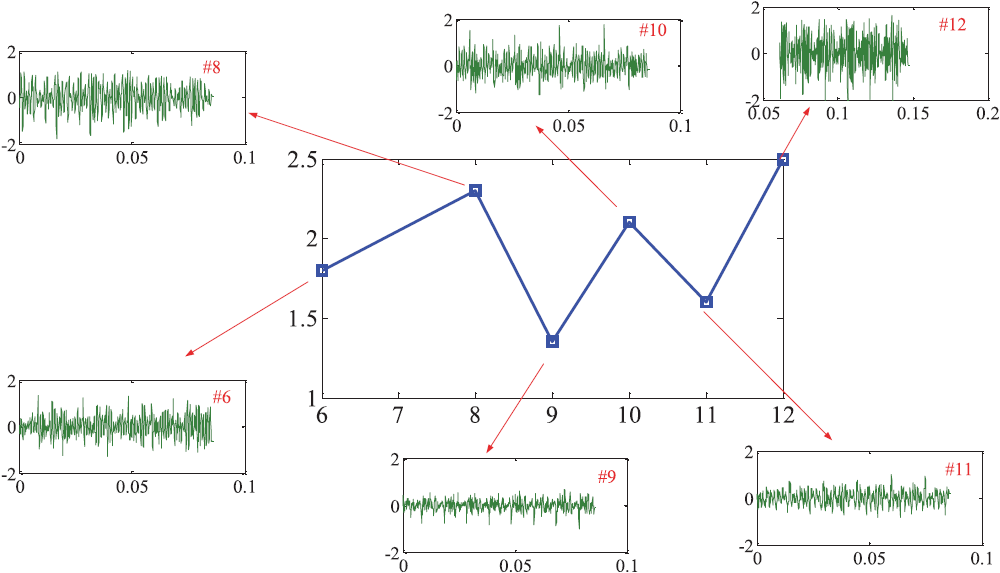
Amplitudes of acceleration signals measured in experiments.
It is worth noting that there are also some fraction frequencies (e.g. 1/5 frequency division) near the natural frequency of cutting system in other experiments, where high amplitude of acceleration does not appear. The possible reason for this phenomenon is that the ratio of base frequency of segmentation chip in these experiments to natural frequency of cutting system is >3, in which condition, the high amplitude of acceleration may not appear.
In order to quantitatively analyze the vibration induced by the segmentation, the SLE is used, and the theoretic and experimental results are compared. If the cutting process is stable, the SLE can be expressed as 34
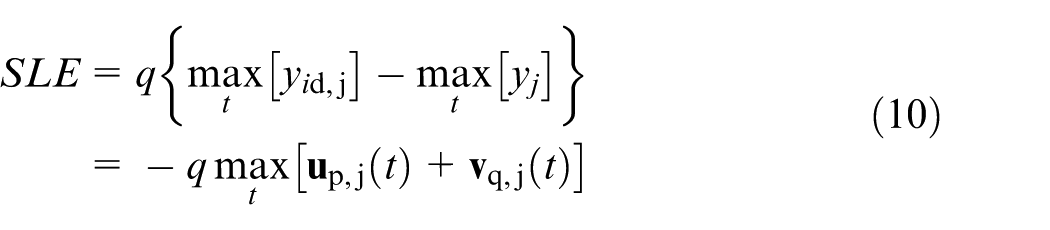
where for down-milling operations, q = 1, for up-milling, q = −1.
Here
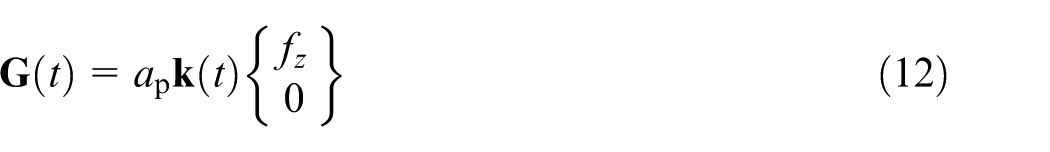
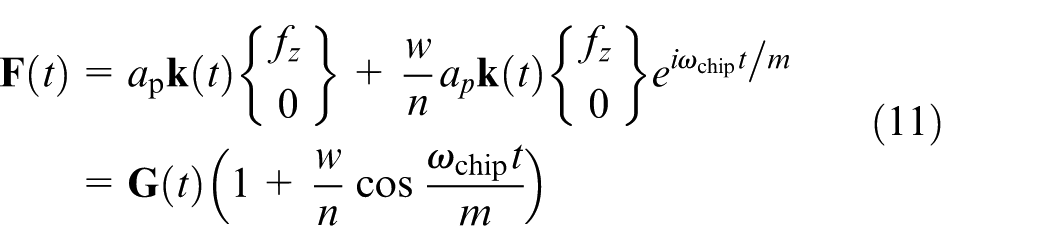
It is noted that only real part is considered in equation (11), which is similar to the method used in Taylor et al. 22 When no segmented chip appearing (w = 1), equation (12) is used for further analysis instead of equation (11), which is similar to the traditional method used in Insperger et al. 34 To obtain the general solution, the Fourier series is used to approximate the cutting force, and the expansion term is
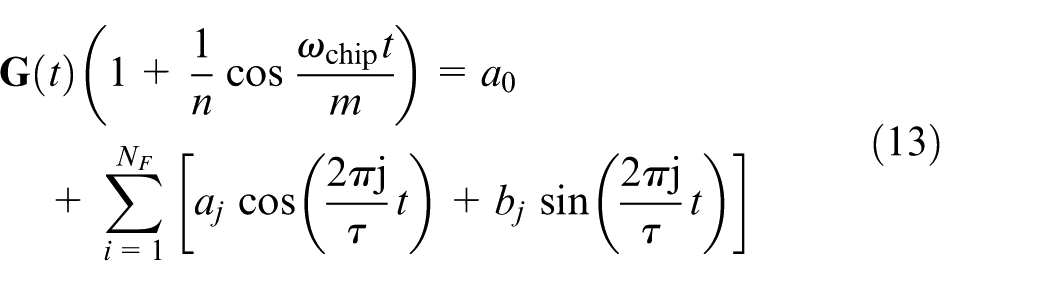
where NF is the first terms adopted.
Figure 14 shows the theoretical and experimental SLE results. The calibration parameter n is determined by least squares method based on experiments 4, 8, and 12. The computational parameters are the same with those used in Figure 3. In Figure 14, “-” and “x” indicate the results calculated using theoretical method with or without segmentation chip, respectively, and “□” indicates the results measured using experiments. Segmented chips only appear under some special conditions (e.g. 8 and 12), so the theoretical results calculated with segmentation chip are discrete data. It is also noted that these discrete data include the effect of forced vibration due to feed rate, as presented in equation (10). From Figure 14, it can be seen that the forced vibration induced by segmented-chip vibration significantly increases the SLE, although there are several differences between the theoretical and experimental results.
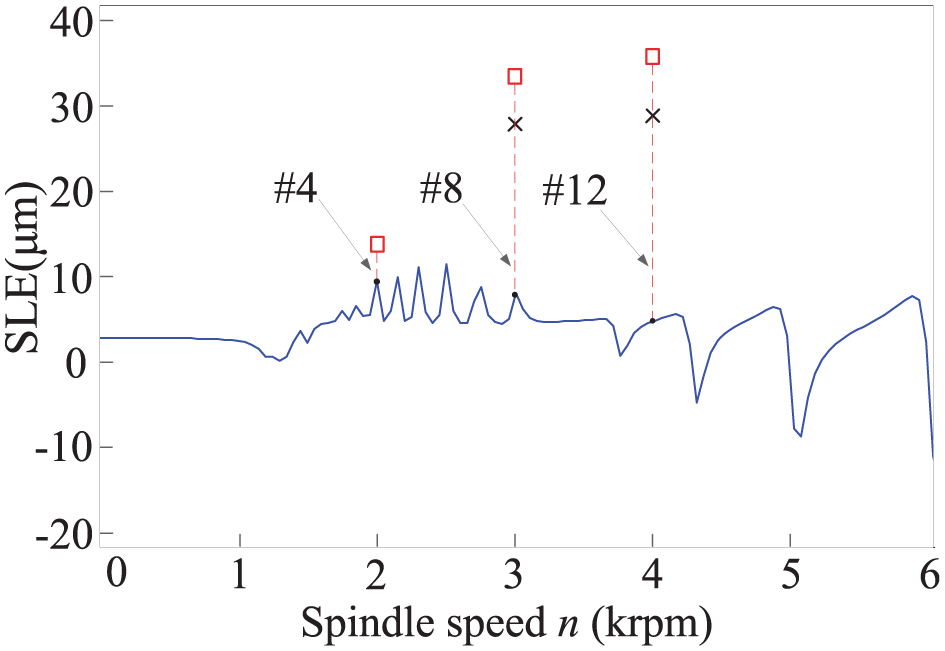
Surface location errors predicted in theoretical method and measured in tests.
In the end, as presented in equation (4), although segmentation-driven vibration differs from the forced vibration due to stationary cutting force, it is a kind of forced vibration with high frequency, whose amplitude is associated with peak amplitude of the stationary cutting force, and the vibration period is dependent of serrated chip. Therefore, this vibration is different from traditional cutting chatter, such as regenerative chatter, friction chatter, and mode-couple chatter. Because it affects the machining surface accuracy, segmentation-driven vibration should be avoided through several methods, such as optimization of cutting parameters, low-temperature machining, and high pressure–assisted machining. For more details about optimization of cutting parameters, refer to Wang and Liu 20 and Wang et al., 31 which investigated the relationship between serrated chip formation mechanism and cutting parameters, especially the cutting speed.
Conclusion
The quantitative comprehension of segmentation-driven vibration is concerned through the theoretical and experimental analysis in Ti6Al4V milling processes. The following conclusions can be summarized:
Continuous and saw-toothed chips are observed at different cutting speeds. The chip morphology transitions from continuous chip to saw-toothed chip with increasing cutting speed.
Regarding milling as oblique cutting, the segmentation frequency is determined by cutting force, v; tooth height, h; and oblique cutting angle, θ.
The large vibration of tool appears where the fraction frequency of segmentation chip is near the natural frequency of cutting system. However, it should be mentioned that when the frequency of segmentation chip is noninteger or above 3 times the natural frequency of cutting system, the high vibration of tool will not be observed.
Segmented-chip vibration which significantly increases the SLE is a forced vibration with high frequency.
The chips formed in machining titanium-based alloys, along with other difficult-to-cut alloys, are typically saw toothed. The formation of saw-toothed chip is generally considered the result of a highly nonlinear and dynamic plastic deformation process that has been shown to adversely affect cutting forces, machine deflection and vibration, tool wear, and surface finish. Such chip morphology knowledge presented in this article will help better understand and model titanium-based alloy machining process, improving their machinability and machining productivity.
Footnotes
Appendix 1
Declaration of conflicting interests
The author(s) declared no potential conflicts of interest with respect to the research, authorship, and/or publication of this article.
Funding
The author(s) disclosed receipt of the following financial support for the research, authorship, and/or publication of this article: The work was supported by grants from Tai Shan Scholar Foundation (No. TS20130922). The authors are grateful to the financial supports of the National Natural Science Foundation of China (No. 51575319), Young Scholars Program of Shandong University (No. 2015WLJH31), and Major National Science and Technology Project (No. 2014ZX04012-014).