
Abstract
The performance of potassium dihydrogen phosphate optical components is very sensitive to the waviness error. The time-varying oil source pressure leads to dynamic change in the eccentricity of hydrostatic slide; waviness errors can be induced on the finished surface of potassium dihydrogen phosphate consequently. The relationship between unsteady oil source pressure and the waviness errors of potassium dihydrogen phosphate is studied in this article. A mathematical model is built to calculate the displacement of hydrostatic slide induced by unsteady oil supply pressure. Moreover, a comprehensive fluid–structure interaction model is built to consider the influence of structural deformation of slide on the pressure distribution of oil film. Experiments are carried out to verify the proposed model. The calculated results agree well with the experimental results, and it is found that the calculated results show better accuracy when fluid–structure interaction is considered, which validates the reliability of this model.
Keywords
Introduction
Inertial confinement fusion (ICF) is the forefront of science which provides alternatives for clean energy in the future. 1 Many countries have engaged in research in this area, and the most famous one is the National Ignition Facility (NIF) of the United States which was initiated since 1990s. 2 In ICF system, as the harmonic frequency multiplier of high-power laser, the potassium dihydrogen phosphate (KDP) crystals are the key elements which affect the efficiency of the whole system greatly. 3
In ICF system, many factors have significant impact on the optical performance of KDP elements, such as the material quality of KDP crystal and the operating temperature. Another important factor is the three-dimensional (3D) topography of the finished surface. 4 Therefore, to assure the whole system works well, the machined surface of KDP components has exceedingly high specifications for topography. 5 Specifically, in 415 × 415 mm 2 , the flatness must not be larger than 3 µm, and the power spectral density (PSD) must be less than 15 nm 2 mm. In the range of 33–60 mm, the root mean square gradient (GRMS) of the finished surface should not exceed 11 nm/cm.6,7 Besides, KDP crystals have many difficult-to-cut material features, such as soft, fragile and hygroscopic. The common methods for ultra-precision machining (such as polishing and grinding) are not appropriate for KDP machining. An alternative method for producing KDP optical components is the single-point diamond turning (SPDT) as it is capable of acquiring ultra-precision surface without any other complementary processing.8,9 Therefore, SPDT is widely adopted to produce KDP crystals.
However, due to the basic principle of SPDT, the relative vibration of cutting tool and workpiece affects the topography of finished surface greatly, which results in the waviness on finished surface. The incidence angle of high-power laser could be changed due to these waviness errors on the surface of KDP components. And then, the phase mismatch and distortion of laser will occur, which dramatically decreases the frequency conversion efficiency of light path. More and more attentions have been paid to this issue recently.10,11 An et al. 12 found some waviness errors on the machined surface of KDP along the feeding direction. The amplitude of these waviness errors is less than 0.1 µm and the wavelengths are about 100 nm. They concluded that these waviness errors mainly result from the tilting motions of air-spindle. Liang and colleagues13,14 studied the relationship between the waviness errors and the dynamic performance of machine tool. Some waviness errors with amplitude of about 0.1 µm and wavelengths in the range from 17 to 42 mm are found in the KDP surface, and these errors mainly result from the multimode vibration of machine tool. 15 Their work provided theoretical guide for the design of machine tool. Chen and colleagues16,17 investigated the steep profile on the machined surface of KDP crystal. They considered that this kind of profile will reduce the laser-induced damage threshold of KDP optical lens. Uriarte et al. 18 investigated the stiffness chain of a micromilling machine. The stiffness chain (including the machine, the tool-holder and the tool) is theoretically modeled and experimentally verified. Their researches indicated that the compliance of tool itself is the main source of error in micromilling.
In a previous research, some mid-frequency errors are found along the feeding direction. 19 The amplitude of these waviness errors is about 10 nm, and the wavelengths are gathered in the range of 0.5–1.5 mm. These errors are induced by the oil source pressure fluctuation of hydraulic system. In this article, a mathematical model is built to numerically investigate the vibration of hydrostatic slide caused by oil source pressure fluctuation. Furthermore, a fluid–structure interaction (FSI) effect inside the hydrostatic slide is considered to improve the calculation accuracy. The topography of the finished surface is measured and analyzed to verify the proposed model.
The mathematical model
Figure 1 demonstrates the layout of a home-made ultra-precision SPDT machine tool for KDP machining. It adopts a vertical architecture; an air-spindle and a hydrostatic slide are used to provide almost frictionless support for mobile parts. A direct current motor and a linear motor are adopted to actuate the air-spindle and the hydrostatic slide, respectively. The hydrostatic slide is semi-closed type for the sake of easy to assemble. The main components of hydraulic system are also shown in Figure 1. It provides adjustable oil source pressure, filtrates and cools the hydraulic oil to ensure the hydrostatic slide works properly.
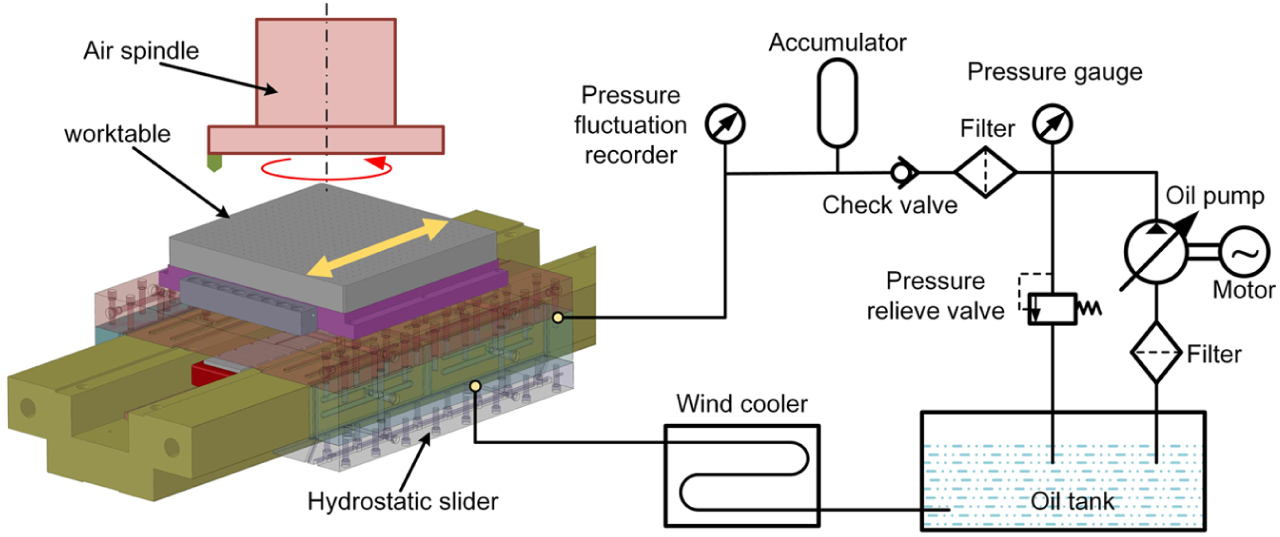
The layout of ultra-precision SPDT machine tool.
In ideal conditions, the oil source pressure is constant, and the relationship between load-carrying capacity (LCC) of oil film and its thickness is demonstrated in Figure 2(a). However, in actual working conditions, due to the vibration of hydraulic system, the pressure of hydraulic system varies with time continuously in the range of several kilopascals. It means that the LCC of oil film is dynamically changing in the working condition. When the time-varying oil source pressure is considered, the relationship of LCC, oil film thickness and oil source pressure is demonstrated in Figure 2(b).
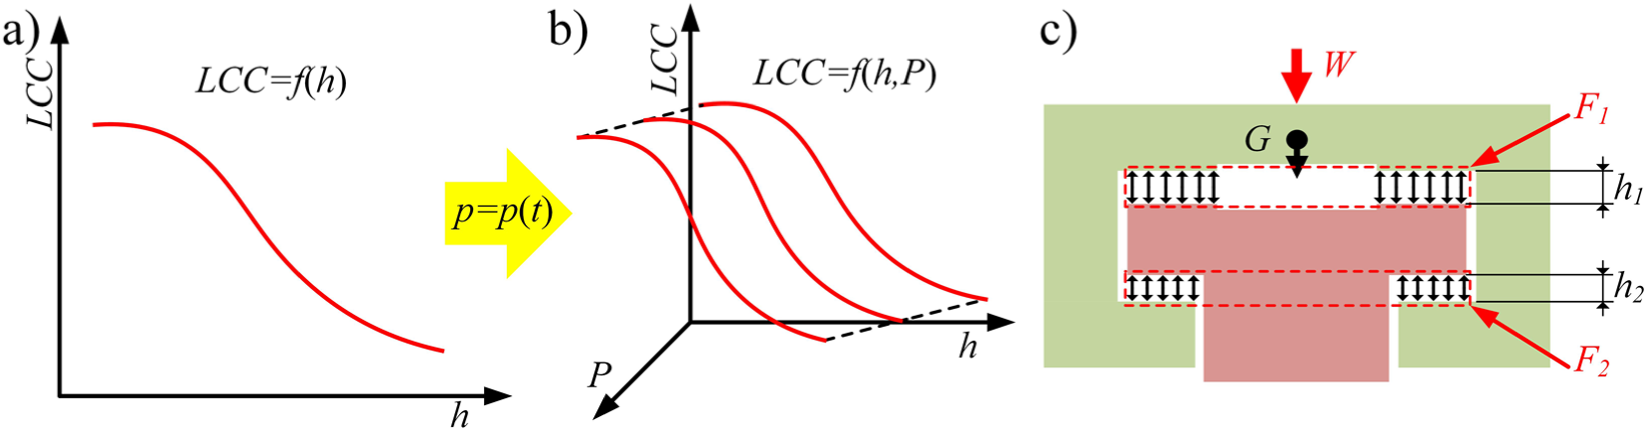
The force analysis of slide in the working condition: (a) the relationship between LCC of oil film and its thickness, (b) the relationship of LCC, oil film thickness and oil source pressure and (c) the force analysis of slide.
Figure 2(c) analyzes the forces applied on hydrostatic slide in the working condition. G is the gravity of slide. W is the external applied load of slide. F1 and F2 are the oil film forces of the upper and lower oil films, respectively. h1 and h2 are the oil film thicknesses of the upper and lower films, respectively (see the Appendix for the description of all symbols used in this paper). Therefore, the static equilibrium equation of slide can be written as equation (1). For certain oil supply pressure, the slide could find an equilibrium position where equation (1) can be satisfied. If the hydrostatic slide works with a different oil supply pressure, a new equilibrium position will be found to meet equation (1). It means that unsteady oil source pressure will lead to a dynamic change in the eccentricity of hydrostatic slide. So the thickness of upper and lower oil films is also varying with time when unsteady oil source pressure is considered. If the deformation of slide caused by oil film pressure, external load and gravity is ignored, h1 and h2 satisfy equation (2). h0 is the designed oil film thickness


According to the modal analysis results of hydrostatic slide in our previous research,
20
its first-order natural frequency is about 194 Hz, which is much higher than the frequency of oil source pressure fluctuation (less than 1 Hz). Therefore, the dynamic effect of hydrostatic slide induced by oil source pressure fluctuation can be ignored, and the slide is almost in equilibrium at each moment. It means that the vibration process of hydrostatic slide could be regarded as a quasi-static process. For a certain moment t = ti, the oil source pressure is P(ti), and the hydrostatic slide could find an equilibrium position where the gravity, the external load and the upper and lower oil film forces are balanced. At this position, the corresponding upper and lower oil film thicknesses are h1(ti) and h2(ti), respectively. Then, the displacement of slide dslide(ti) can be calculated by equation (3).

Equations (1) and (2) are the mathematical model for calculating the displacement of hydrostatic slide induced by oil source pressure fluctuation. The above analysis indicates that if the relationship between LCC, oil source pressure and the oil film thickness is acquired, for certain oil supply pressure fluctuation, the corresponding displacement of slide can be obtained easily.
The ultra-precision machine tool works in a coupling field, including mechanical field, fluid field, thermal field and electromagnetic field. The interactions between them impact the overall performance (such as dynamic characteristics, thermal behavior) of ultra-precision machine tool greatly.21,22 For the hydrostatic slide, the interaction between fluid fields and solid structure should be considered when investigating its performance. Because the deformation of slide caused by pressurized oil changes the shape and thickness of oil film, the pressure distribution of oil film changes. The LCC of oil film will be changed consequently. Therefore, to accurately calculate the displacement of slide induced by oil source pressure fluctuation, the conditions mentioned above should be taken into consideration.
FSI model
FSI is the interaction between deformable solid structure and adjacent fluid field around the solid structure. 23 In engineering practice, the FSI method is widely adopted to investigate the FSI issue. It is capable of investigating the deformation and displacement of solid structure caused by fluid field and their influence on the flow status of fluid field. To accurately calculate the deformation of slide and its effect on the pressure distribution of oil films, the FSI method is adopted in this article. The coupling equations of FSI method involve the governing equations of solid structure and fluid field. These two fields are solved separately with defined time step, and they exchange data between each time step. The deformation of solid structure can be calculated by solving equation (4)
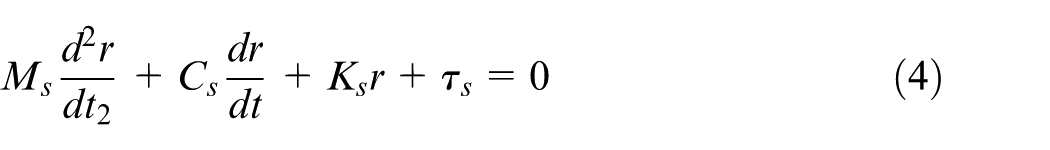
where Ms, Cs and Ks are the mass matrix, damping matrix and stiffness matrix, respectively. r is the displacement of solid structure, and τs is the stress. The solid structure transfers displacement data of the FSI surface to fluid field. Then, the pressure distribution of oil film can be obtained by solving equations (5) and (6)
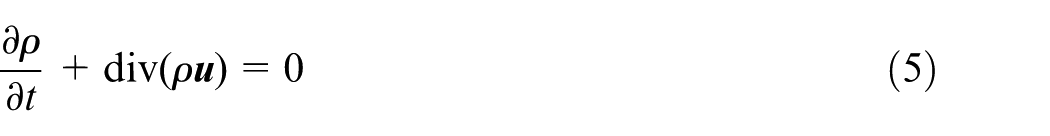
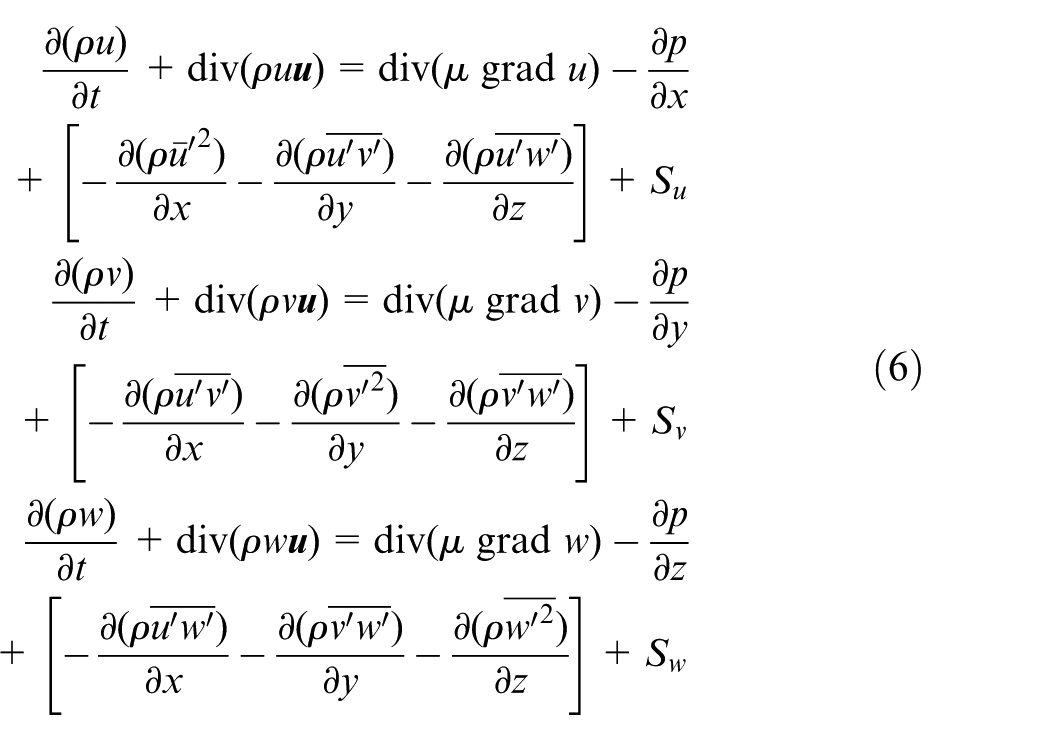
where ρ indicates the density,
The comprehensive FSI simulation model of hydrostatic slide is demonstrated in Figure 3(a). It consists of the fluid field of three oil films and the solid field of slide. The hydrostatic slide is semi-closed type and has two symmetry faces. Therefore, to improve calculation efficiency, a quarter of hydrostatic slide is modeled. The deformation of slide is calculated by finite element method (FEM) software ANSYS, and the CFD code FLUENT is used to calculate the governing equations of oil films. The upper, middle and lower oil films have similar computational meshes, and their boundary conditions are identical. Therefore, only the CFD model of lower oil film is detailed as illustrated in Figure 3(b). The total cell numbers of the upper, middle and lower oil films are 926,440, 860,300 and 853,630, respectively. As shown in Figure 3(b), the inlet is the entrance of pressurized oil, while the outlet is the exit of pressurized oil. In CFD calculation, the supply pressure applied on the inlet is 0.5 MPa (gauge pressure), the pressure applied on the outlet is 0 MPa (gauge pressure) and the operating pressure is 101,325 Pa. The hydraulic oil adopted in this study has a density of 822 kg/m3, and its viscosity is 0.00575 kg/(m s). The RNG k-ε model is adopted to model the turbulence. The effect of swirl on turbulence is included in the RNG model, and it has an additional term in the ε equation that improves the accuracy for rapidly strained flows. Hence, the RNG k-ε model is accurate and reliable for a wider class of flows. Besides, the famous SIMPLE scheme of FLUENT software is adopted in solving the governing equations of fluid field.
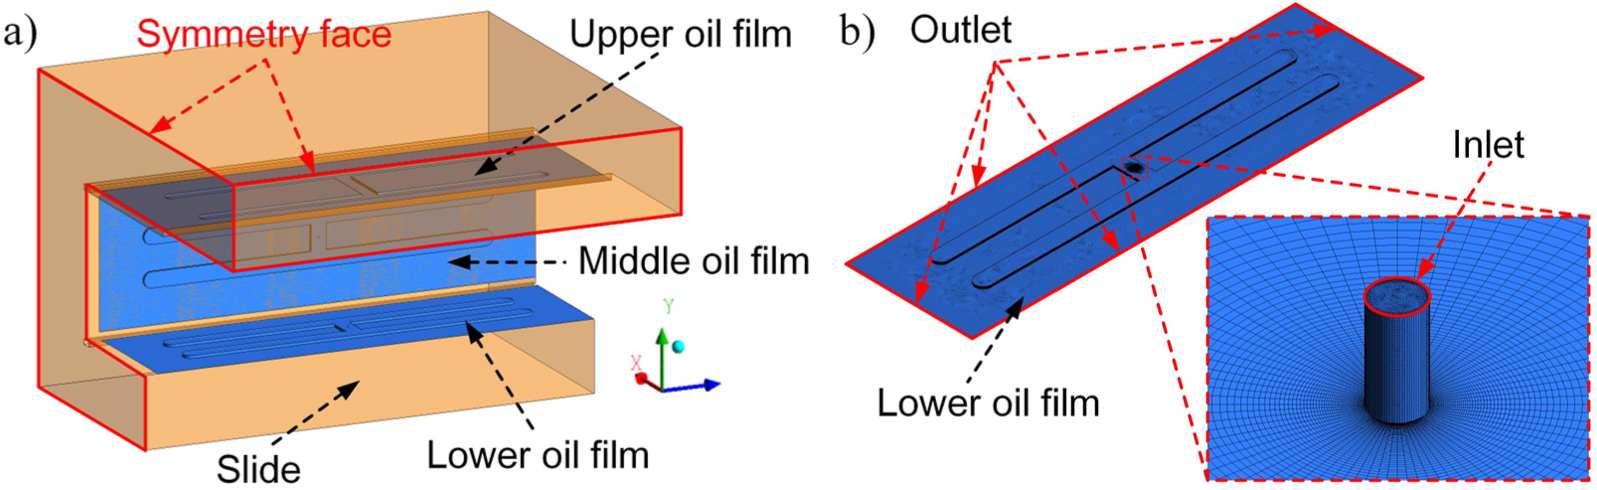
FSI model of hydrostatic slide: (a) the FSI model of hydrostatic slide and (b) the CFD model of lower oil film.
The calculation results are shown in Figure 4. (The oil film thickness is 25 µm, and the oil supply pressure is 0.5 MPa.) Figure 4(a) presents the deformation of slide in y-axis. It can be clearly seen that the slide is deformed under pressure load of oil film, and the maximum deformation reaches 8.4 µm. It accounts for 33.6% of the designed oil film. As the oil film thickness greatly impacts the pressure distribution, the LCC of oil film will change remarkably. The pressure contour of oil film is visualized in Figure 4(b). When FSI effect is ignored, the ideal LCC of the upper oil film is 11,428 N. While it decreases to 9879 N after slide is deformed.
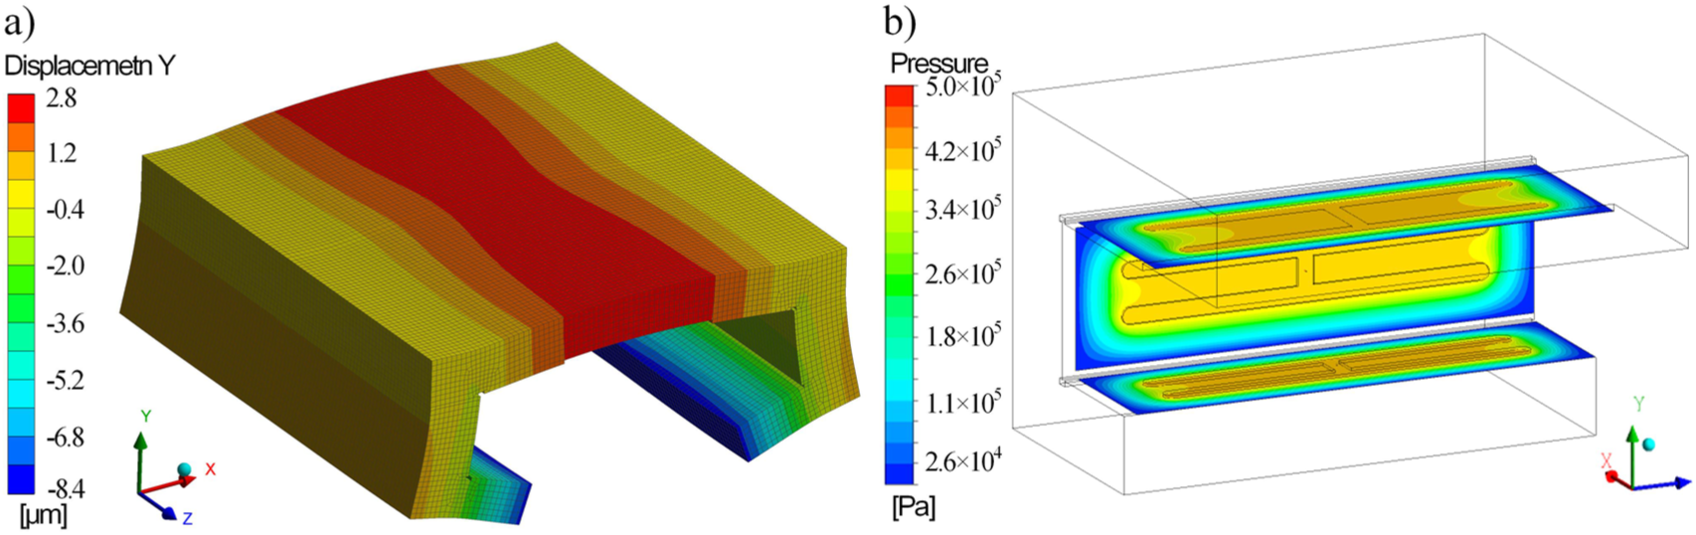
The calculation result of FSI model: (a) the deformation of slide in y-axis and (b) the pressure contour of oil film.
Calculating the LCC of oil film with varying oil film thickness under different oil supply pressures, a series of LCC with corresponding h and P can be acquired. Then, the relationship of LCC, P and h can be analyzed by data fitting. Take the upper oil film as an example, the fitting surface of LCC for the upper oil film is demonstrated in Figure 5. For purposes of comparison, the fitting surface of LCC under ideal conditions (without consideration of deformation of slide) is also displayed. It clearly shows that the LCC of the upper oil film decreases dramatically due to FSI effect.
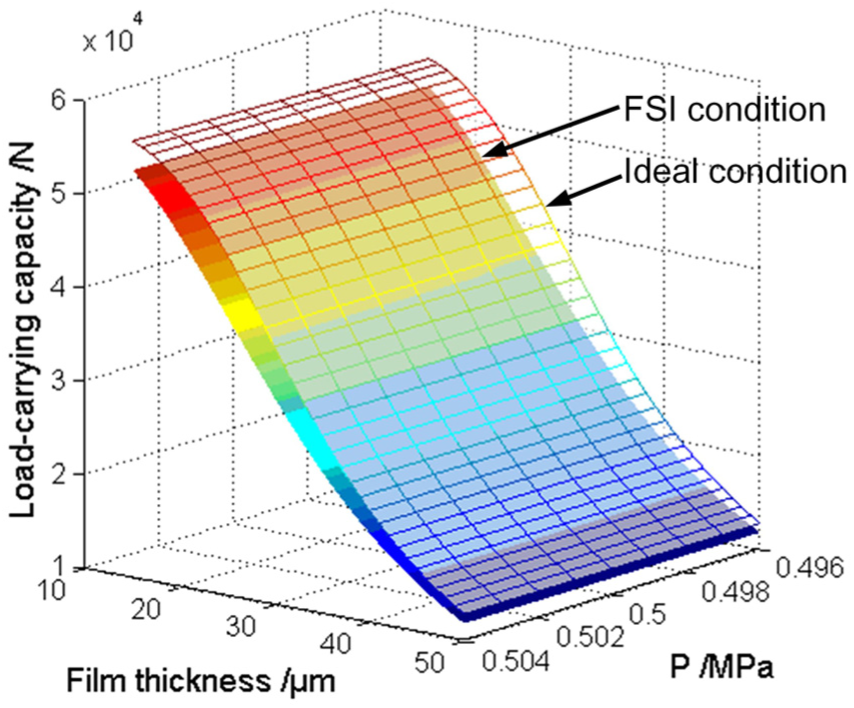
The fitting surface of F, P and h
Experiment
In this section, the oil source pressure fluctuation is first measured by a pressure fluctuation recorder. To eliminate the influences from other factors, when recording the fluctuation of oil source pressure, the aerostatic spindle is stationary, and the hydrostatic slide is fixed by linear motor. Only the oil supply system is working.
The measured results of oil source fluctuation are shown in Figure 6(a). It can be seen that though the pressure of oil supply system is set to 0.5 MPa, the actual oil pressure fluctuates near the setting pressure. The difference between maximum and minimum oil pressures reaches to 0.006 MPa. Besides, as marked in Figure 6(a), the time periods of oil pressure fluctuation are mainly in the range of 10–30 s.
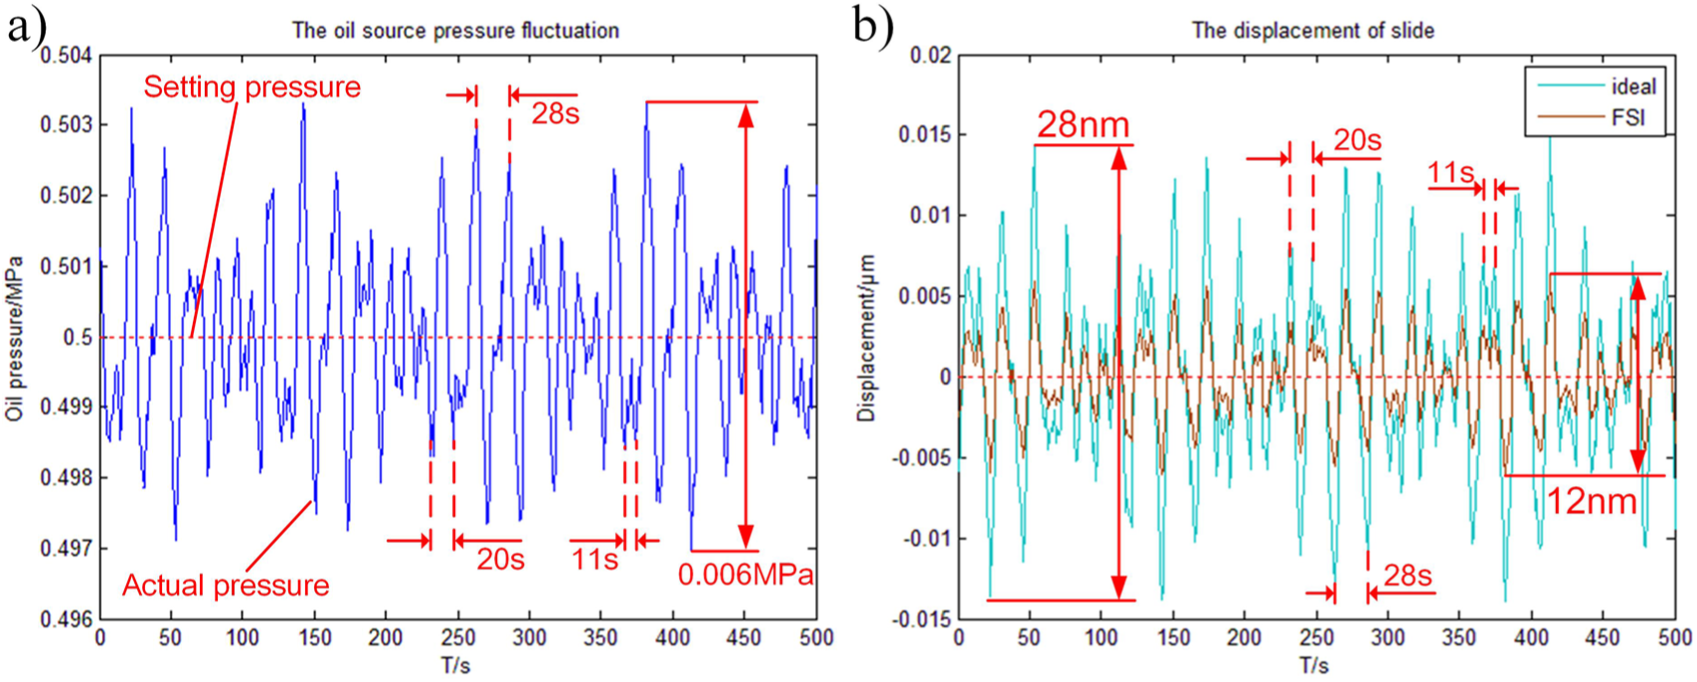
The recorded oil pressure and calculated displacement of slide: (a) the measured results of oil source fluctuation and (b) the calculated displacement of slide under FSI condition and ideal condition.
Figure 6(b) shows the calculated displacement of slide under FSI condition and ideal condition. When the FSI effect is ignored, the maximum vibration amplitude of slide is about 28 nm, which is larger than the maximum vibration amplitude of 12 nm considering FSI effect. It can be explained as following. When the structural deformation is considered, the actual LCC of air film is smaller than that of ideal condition. Hence, the change in LCC induced by oil source pressure fluctuation is smaller under FSI condition. Consequently, the vibration amplitude of slide is smaller. In addition, it can be seen that the time period of slide vibration is also in the range of 10–30 s, which is in accord with the time period of oil source pressure fluctuation. Because at each moment, the hydrostatic slide is assumed in equilibrium. So the vibration process of hydrostatic slide is regarded as a quasi-static process. For a certain oil source pressure, a certain equilibrium position of slide can be acquired. Hence, the time periods of oil source pressure fluctuation and the slide vibration are identical.
The vibration caused by oil source pressure fluctuation has nanometer-level amplitude, which is difficult to measure directly. In this article, the 3D topography of machines’ surface of KDP crystal is tested, and the waviness errors along the feeding direction are analyzed. The machining tests are implemented on the homemade SPDT machine tool with the following cutting conditions and tool parameters. The cutting depth is 15 µm. The feed speed of hydrostatic slide is 60 mm/s. The rotation speed of air-spindle is 300 r/min. The oil supply pressure is set as 0.5 MPa. The corner radius is 5 mm. The rake angle is −25°. The front clearance angle is 8°.
Figure 7(a) presents the 3D topography of the machined surface with workpiece size of 14.1 mm × 10.6 mm. The peak value and valley value of machined surface are 19.8 and −18.4 nm respectively. Figure 7(b) enlarges the topography of machined surface from the top view. It can be seen obviously that there are many stripes with varying widths along the feeding direction. Besides, according to the color bar, in the range of 2 mm × 3 mm, the amplitudes of these stripes are about 10 nm, and the peak-to-valley value reaches to 13.7 nm. To quantitatively analyze the wavelength of the stripes, PSD analysis of the machined surface along the feeding direction is implemented, as shown in Figure 7(c). It indicates that the spatial period of these stripes mainly gathered in 0.5–1.5 mm.
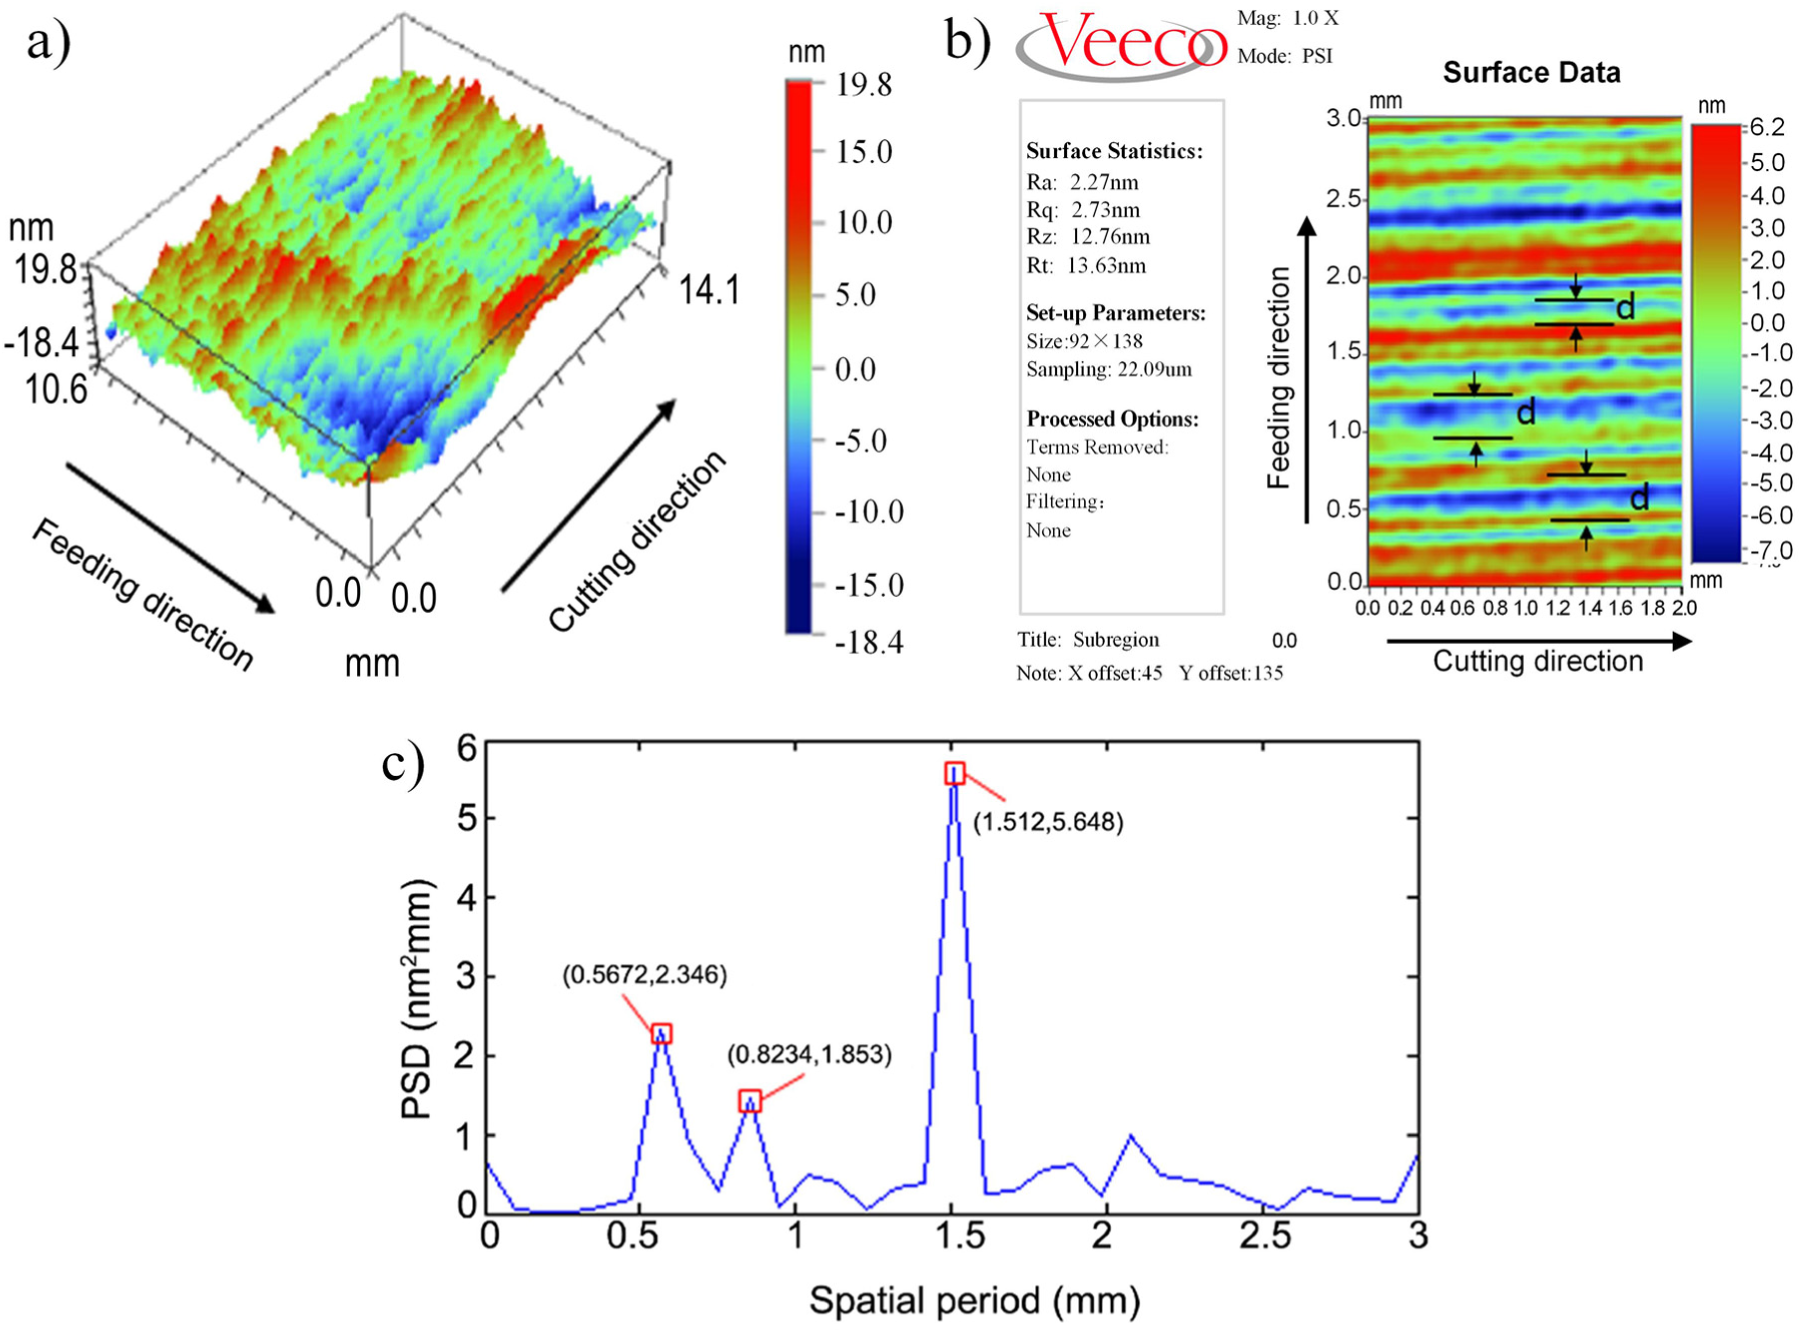
The measured result of machined surface: (a) the 3D topography of the machined surface, (b) the topography of machined surface from the top view and (c) the PSD analysis results of the machined surface along the feeding direction.
The test results and calculated results are compared as following. First, the relationship between the wavelengths of waviness error on machined surface and the time periods of the slide vibration induced by oil source pressure fluctuation is analyzed. Considering the machining process and the cutting path of cutting tool, the feed speed of hydrostatic slide is 60 µm/s, and the calculated period of slide vibration is in the range of 10–30 s as shown in Figure 6(b). Therefore, during a cycle of slide vibration, the slide moves 0.6–1.8 mm. It will result in waviness error on machined surface, and the wavelengths are in the range of 0.6–1.8 mm. The PSD analysis results of machined surface show that the spatial period of stripes is mainly in the range of 0.5–1.5 mm as shown in Figure 7(c). Hence, the time period of slide vibration is well coincident with the spatial period of the stripes on machined surface considering the feeding speed of hydrostatic slide. Then, the amplitude of stripes on machined surface and the amplitude of calculated slide vibration are compared. From Figure 7(b), the amplitudes of stripes on machined surface are about 10 nm, and the peak-to-valley value reaches to 13.7 nm. From Figure 6(b), the maximum calculated amplitude of slide vibration with consideration of FSI effect is 12 nm, and the maximum calculated amplitude of slide vibration without consideration of FSI effect is 28 nm. Hence, when FSI effect is taken into account, the calculation result is more approximate with the tested results.
Conclusion
In this article, the relationship between oil source pressure fluctuation and waviness error on machined surface of KDP crystal is studied. A mathematical model is built to calculate the displacement of hydrostatic slide induced by unsteady oil supply pressure. An FSI model of hydrostatic slide is used to investigate the influence of FSI effect on the LCC of oil film. The experiments are carried out to verify the calculation results. The main conclusions are drawn as follows:
The calculation results agree well with the tested result, which manifests that the proposed mathematical model is efficient to calculate the displacement of hydrostatic slide induced by oil source pressure fluctuation.
When FSI effect is considered, the calculated amplitude of slide vibration is more close to the tested results, which improves the accuracy of calculation results.
The FSI influences the performance of hydrostatic greatly, and the deformation of slide decreases the LCC of oil film dramatically.
The oil source pressure fluctuation could change the equilibrium position of hydrostatic slide as well as its eccentricity, which has important impact on the topography of finished surface.
Footnotes
Appendix 1
Declaration of conflicting interests
The author(s) declared no potential conflicts of interest with respect to the research, authorship and/or publication of this article.
Funding
The author(s) disclosed receipt of the following financial support for the research, authorship, and/or publication of this article: The authors deeply acknowledge the financial support from the International Science & Technology Cooperation Program of China: Research and Development of High Stiffness Nano-drive Systems of Ultra-precision Machine Tools (2015DFA70630) and National Natural Science Foundation of China (51505107).