
Abstract
Composite fiber-reinforced plastic products have many failure modes in the manufacturing stage. The cost of rework is high. To ensure a reliable manufacturing process and outcome, this article presents a new method to prioritize assembly process errors according to a risk-based cost of poor quality. The method combines a range of reliability techniques including cause–effect diagram, fault tree, and analytic hierarchy process to achieve multiple failure mode assessment. The outcome of this research provides direct links to develop risk mitigation plans to treat the prioritized risks of production errors in the composite fiber-reinforced plastic assembly process.
Keywords
Introduction
History of carbon fiber application can be traced back to 1880 when Thomas Alva Edison introduced the carbon filament by carbonizing the thread in a lamp. 1 However, it was not until 1950s when NASA applied the technology in the space program. In recent years, the aircraft manufacturer embraced the composite fiber-reinforced plastic (CFRP) technology to produce lighter and stronger aircraft. CFRP are mainly composed of different phases which gives it the matrix reinforcement property. This makes CFRP materials tough and of low density, properties that are of essence in aircraft manufacturing. The reinforcement materials used constitute the main load-bearing part while the matrix serves to distribute the load applied to the reinforcement. 2
The use of CFRP has the advantage of higher strength-to-weight ratio. 3 CFRP mechanical properties are dependent on the technique used to weave the constituent fabric. The weaving techniques commonly used nowadays include plain or twill weave, and the four or eight shaft techniques. These techniques are based on ASTM D 123 standard of the textile industry. Currently, in the aircraft manufacturing industry, the 2 × 2 twill weaving technique is widely used. The material is made by weaving one or more warp ends under two or more weft picks. This has the advantage of having a better hold in comparison with the plain weave-made materials. 4 Modern health-monitoring system can also be integrated into the CFRP material to further increase the reliability and accuracy. 5 The parts can easily be tacked together to ensure that the desired final assembly and dimensions are achieved. This produces a micro-structure in the CFRP material that does not wobble when put under oscillating shear loads.
The manufacture of aircrafts involves the use of different sizes of parts from those that are as small as playing card to those that measure up to 30 m × 6 m in size. In that case, accuracy is critical to ensure sustained design and functionality of the product. CFRP allows for use of bolted joints in areas of high load like the wings. These joints have the advantage that they can be undone with a lot of ease, hence ensuring a reliable process with lower risks. The disadvantage of these joints is the reduction in strength due to a high concentration of stress around the notches. The design process needs to take into consideration that some aircraft parts will have reduced strength. 6 This has led to emergent techniques in wing structures by combining carbon fiber cloth and resin epoxy matrix under elevated temperature to produce a strong material. The end product is tough and can withstand fatigue at high altitude and contribute strength-to-weight ratio characteristics. It is calculated that 50% of carbon fiber is used in Boeing 787 aero-frame structures.
However, the bolted joints on CFRP panels require thousands of holes to be drilled for the assembly of aero structures. CFRP are known to delaminate easily in the drilling process causing deterioration of mechanical and corrosion-resistant properties. 7 Research to minimize exit delamination for multiple drilling of CFRP showed that the geometrical shape of the main cutting edges of a drill played a decisive role. 8 Research into a strategy on tolerance design could be used to optimize manufacturing cost and quality loss under assembly constraints but the applicability to CFRP was difficult. 9 Due to the large number of possible variables in the process, the cost of rework and repairs has risen since the use of CFRP in the aircraft industry due to excessive drilling accounting for the major flaws occurring in CFRP assembly. The manufacturers are still unable to establish risk mitigation plan for non-conformance in the current assembly process and to avoid any product escaped to customer posing safety risks to passengers.
The objective of this article is the risk assessment of operational errors’ failure modes that occur in the assembly process of aircraft structure. Qualitative data have been used to conduct the analysis into quantitative assessment for decision-making. A method to rank the risk based on qualitative judgment in making cost–value prioritization is developed and validated by real industry data.
Literature review
Extensive research has been done in various fields of CFRP such as materials configuration, tooling configurations, and processes. 10 In contrast, the reliability in producing CFRP in aircraft structure assembly did not have much research attention. In aerospace industry, the traditional task of assembling airframe is drilling thousands of holes for fastener installation. However, the CFRP material is far more difficult to drill than the conventional material due to high abrasive and brittleness. 11 This leads to poor-quality CFRP panels and high rate of rework in hole-drilling.
Omachonu et al. 12 examined the components of quality cost (internal failure, external failure, appraisal cost, and prevention cost) in the context of two key manufacturing inputs: materials and machines. They found that there was an inverse relationship between appraisal cost plus prevention cost and failure cost. The relationships between the practices of quality costs have been studied in terms of various levels of organizational performance.13,14 The purpose of this literature review is to research whether there has been published research assessing the impact on quality in a manufacturing environment, or any planning methodologies for engineering a minimum risk system managing CFRP assembly errors. 15
Quality management strategies
The construction of aircraft frame is one of the most accurate processes. During the aircraft assembly, drilling is important since improper drilling could lead to defects. Given the abrasive nature of composite materials used in making aircraft frames, drilling poses a major challenge which produce defects that high stress can be found around the edges of holes. The effect of stress concentration is the largest at the hole edges and usually reduces significantly at a distance of three times of the hole diameter.16,17
Drilling defects greatly decrease the weight-bearing load and the durability of an aircraft. CFRP does not exhibit plasticity in the same way as aluminum alloys and suffer high geometric stress concentration at holes, notches, and similar features. 18 Drilled holes in “Achilles heel” constitute weak regions from which tensile failure may occur as a result of the concentration of localized tensile strain. Hence, joints should be designed such that fastener bearing is the critical mode of failure. However, to achieve this, hole edge distance should be greater than those for aluminum alloy structure. The design requirement for bearing load in CFRP basically is 2.5D + 0.05 inches (equivalent to 1.27 mm), where D represents the diameter of the drilled hole. 19
The use of CFRP materials in the aircraft manufacturing industry has enabled engineers to achieve outstanding results. However, application of CFRP is not easy though since it has some major challenges. Since it is highly brittle and tough, ultimate care needs to be taken for the material where damage leads to greater costs and consumes more time during manufacturing. Current techniques in minimizing defects are not being studied in detail. Large amount of time is spent in reworking due to the high cost of CFRP material. This issue affects the whole aircraft manufacturing system if the conventional production-inventory management approach is adopted. However, if the quality level may change during the production process, there is a need to include the process–quality design approach which considers the varied quality-related costs. 20 Therefore, further feasible studies need to be done in the operation area to minimize the non-conformance by determining the cost factor and operation reliability.
Cost of quality
The costs associated with rectifying production errors are the cost of poor quality (COPQ). Identification of major cost-reduction opportunities in the specific segments of an organization therefore aids in making it possible to prioritize for effective use of resources to reduce the dissatisfaction among its customers. 21 However, to successfully deal with the COPQ, an organization needs to quantify the quality cost based on the cost categorization. 22
In order to assess the impact of poor assembly process, Falck et al. 23 studied the assembly of 24,443 cars and found that poor assembly ergonomics caused increased risks of quality errors of several times higher for high and medium physical load assemblies. Tiwari et al. 24 suggested that internal failure costs are key contribution to financial impact based on the quality model. Smallman 25 stressed on the interaction of risk management, and quality cost fraternity is needed in identifying risk and financial risk that impact management. A study in the health sector also suggested that all risk can be mitigated through quality risk management, and application of reliability tools and quality can learn to prioritize the cost through risk management. 26 The optimum COPQ varies from one company to another but research shows that for complex industries, the total costs are higher, with failure costs having the largest percentage and prevention costs having a smaller percent to the total costs.
Reliability and cost
In the manufacturing world, the reliability of products is very critical to the outcome of the functionality of the finished product. 27 In order to ensure that the final product is of good quality, it is important that the production engineers involve right from the initial stages the product meets the set quality standards. Failure mode and effects analysis (FMEA) is a tool which has been found helpful in the analysis of failure mode and also the reliability. 28
When using FMEA tool, one identifies all the potential failures in the production cycle and the effects of these failures.29,30 The tool also aids in the identification of the criticality of the failures. This makes the tool effective in the reliability prediction and planning of the production cycle.
When applied in early or during operation, engineers have the advantage of making changes that are less costly in comparison with the changes that are made at the product warranty stage. According to Teng and Ho, 31 the FMEA procedure is done in two phases. The first phase is done during the design stage in the production cycle, detailing the failures of each component and the entire manufacturing process. In the second phase of the FMEA, the failures are evaluated and ranked. After this, the design is revised and all possible modifications are made. The ranking should be done in a hierarchical manner with the most critical failure ranked as the highest and given first priority during the revision of the design. In the revision, it is critical to ensure that the highest ranked failure does not appear again after redesigning.
Sankar and Prabhu 32 established a modified approach to prioritize failures using ordered matrix approach where all relevant qualitative and quantitative data are recorded. The matrix showed the between-failure modes, causes, and effect through ordered ranking, and common cause matrix were prioritized. Based on Von Ahsen, 33 the internal cost and external cost were estimated using risk priority number (RPN) and cost estimation. The studies show the application of FMEA in quality cost in economic perspective and consideration is feasible, and will also be useful within an organization to manage risk and aid to managerial decision-making in achieving a more efficient utilization of resources for product and process optimization.
Carmignani 34 examined the use of analytic hierarchy process (AHP) in priority-cost-based approach. The case study was developed to prioritize the critical failure which is used to determine the profitability solution. The RPN based on severity, occurrence, and detection was used to calculate and transfer into profitability index to identify hierarchy fault area for improvement. Furthermore, Braglia 35 suggested the multi-attribute failure model analysis (MAFMA) in performing the complete analysis on prioritizing the failure that identified a reliability technique for corrective actions. The analysis embedded multiple attributes within the AHP in order to pin point the critical cause of failure based on qualitative approach. It was also suggested that the application could be validated continuously on qualitative judgment and adjustment in the FMEA analysis. AHP technique was developed in 1970s and has turned out to be one of the most useful and widely accepted methods of making complex analysis. Over the years, it has undergone various transformations producing an improved version of the original technique. 36
Not all manufacturing processes can be automated. In fact, aerospace manufacturing industry still incorporates many human work activities. 37 Inevitably, human errors often exist irrespective of how much training the operators have done. The measure of human error rate requires the quantification of human error probabilities (HEP). 38 According to Swain and Guttmann, 39 the application of FMEA also had its limitations given the reliance on human, where the RPN for human factors was difficult to quantify. Kirwan40,41 recommended that the data requirement for human reliability could be obtained through synthetic data or based on expert judgment and converted into quantification techniques. The research also found that the data collection in human reliability analysis was largely qualitative in nature in operational experience. In addition, Singh et al. 42 quantified human performance required for quality improvement in disk-maintenance operation. In identifying the human error quantification, this method was adopted similarly to Grozdanovic. 43
It is clear from literature review that a wide variety of reliability assessment methods are available but they are isolated processes. There is little research to mitigate risks of COPQ in manufacturing activities. This research aims to address this issue by developing a new integrated method of quality assessment that can identify an action plan for mitigating COPQ.
Quality risk ranking by reliability assessment
A non-conformance data set can be used to assess the COPQ, for example, the internal failure costs are subjected to time spent for repairs which includes labor, time, and materials. The drilling process is a core method in assembling and fabricating aircraft structure. To develop the underlying principles of managing risks, the defect data in CFRP product assembly were obtained from the manufacturing process of a movable trailing edge (Figure 1). It consists of upper skin, lower skin, ribs, and spars. The drilling process is crucial to assemble these parts. Non-conformance parts assembled are detrimental in maintaining the engineering requirements and airworthiness.
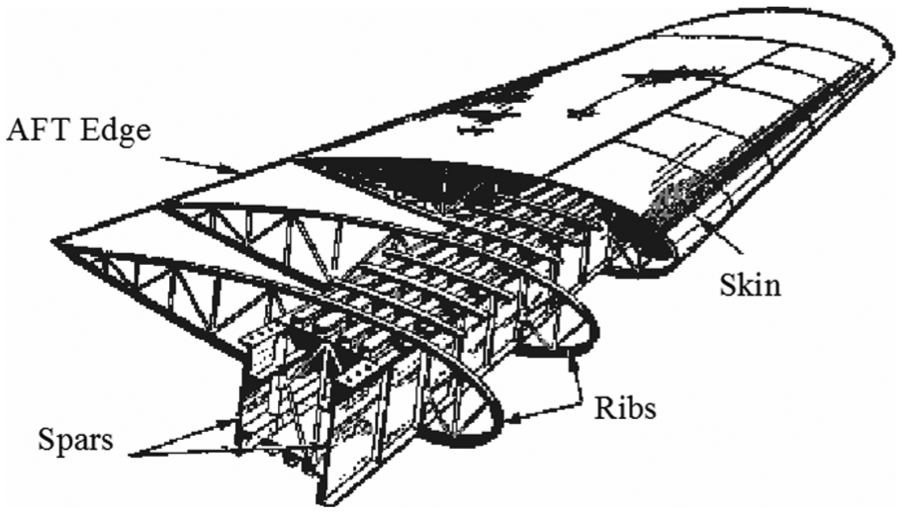
Illustration of CFRP movable trailing edge.
Obviously, there are many advantages to eliminate these defects in manufacturing. However, the resources that can be allocated to establish remedial processes for these defects are often limited, and the time available to make the necessary corrections is short. This research was initiated to study the faults found in assembly process and to develop a prioritization method that assists management to put resources to the most urgent and cost-effective error-correction task. To start the research, data collection was obtained from non-conformance database in 3 months. The main non-conformance can be categorized in four main areas as shown in the non-conformance columns in Table 1. Drilling errors accounted for 48% of the non-conformance, while assembly error and failed inspection share another 48% of the problem. It can be seen that the defects have a direct proportional impact on hours of rework, where the trend of the cumulative percentage ratio is almost certain, that is, 45% of rework hours of correcting defects are involved in drilling error and 44% contribution for an assembly error in processing. However, rework denotes additional work being performed, it adds cost to the task being performed to meet requirement such as disassembly, repair, and replacement, which constitute the COPQs.
Key costs of quality categorized according to non-conformance and failure modes.
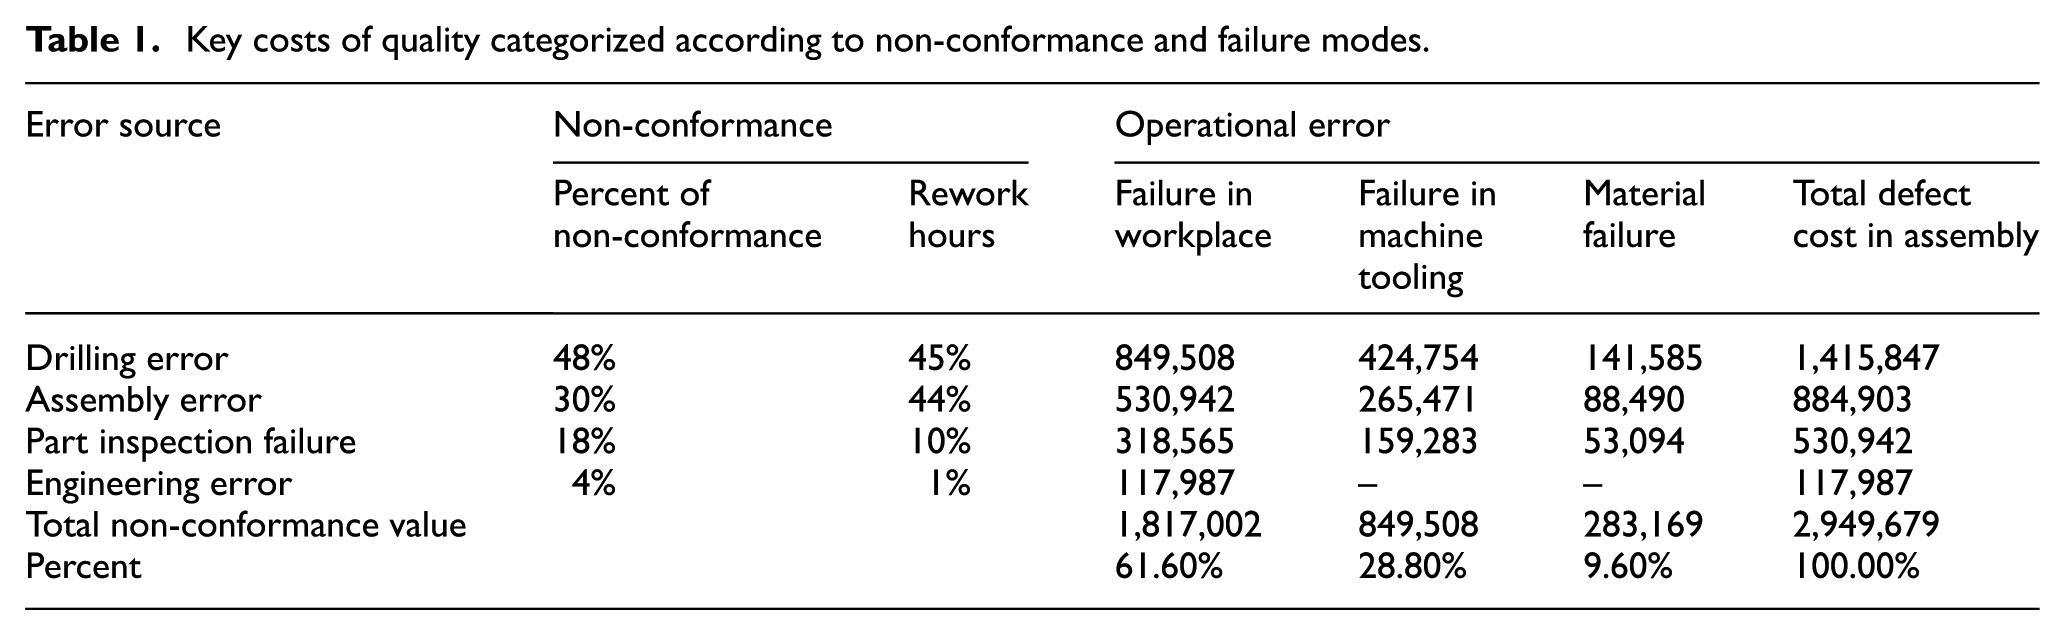
It is estimated that the total cost of non-conformities amounted to US$2,949,680 including 2638 h of labor for repair. The COPQs are categorized into three failure modes as shown in the columns under operational error in Table 1.
The information in Table 1 can help management to focus on their effort to failures in workplace but it is not detail enough to develop action plans to eliminate these failures. This research proposes a novel method to tackle each operational error to the point that a set of remedial actions can be identified and prioritized according to the causes of failures.
The method can be described with the following steps:
For each of the error, a cause–effect diagram (also known as fish bone chart) is developed, normally with the involvement of personnel from quality, production, and engineering departments. The cause–effect diagram will help to identify the causes of the error and will form the basis for deciding remedial actions.
Using the list of causes in the cause–effect diagram, perform a FMEA to determine the RPNs, which will establish a priority list of causes to be tackled.
From the FMEA RPN list, select a reasonable number of top causes and create their vector of priority (VP) using AHP methodology. The number of causes to be used depends on the amount of effort or resources that this exercise is going to be allocated.
A fault tree linking the selected causes to the operational error is then created. The causes are OR-ed to form the secondary and higher level faults because they can generate the errors independently.
The quality risk ranking method is shown diagrammatically in Figure 2.
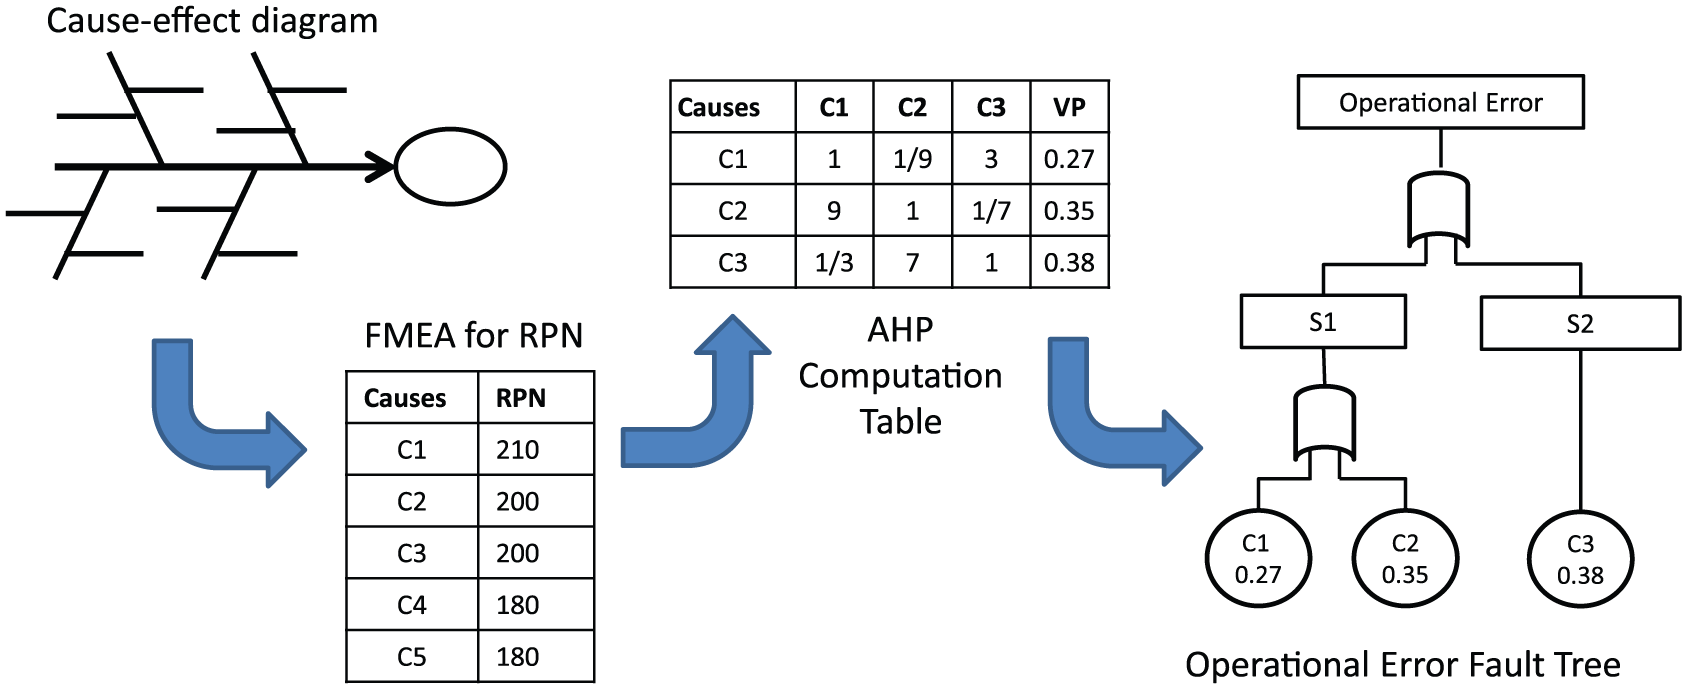
Quality risk ranking method.
In the operational error fault tree, the probabilities of failures can be calculated based on probability logic. Using the notations in Figure 3, we have
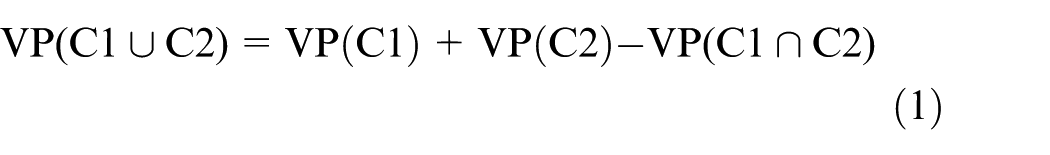
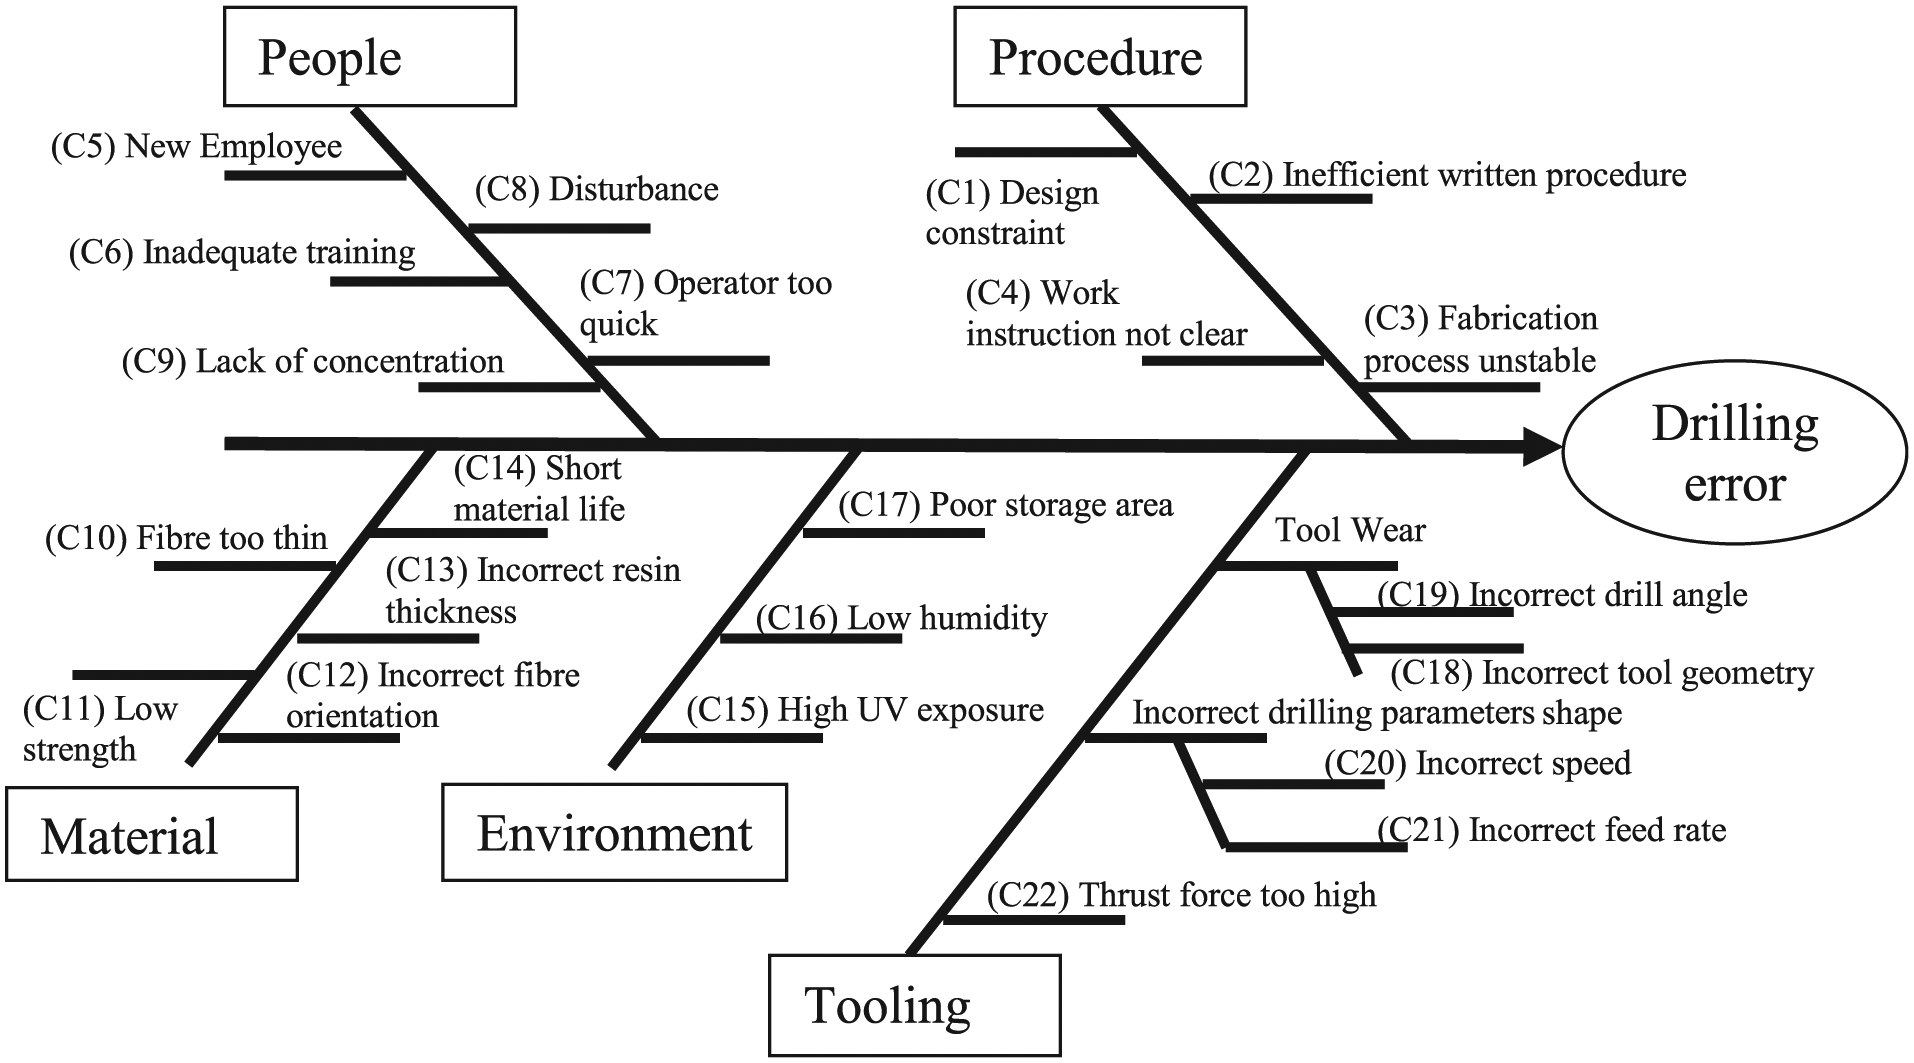
Cause–effect diagram.
The causes C1 and C2 are independent and hence VP(C1∩C2) = 0. Therefore

Similarly, the operational error or any secondary or higher level faults can be calculated as follows

Since the secondary and higher level faults are derived from the primary faults, VP(S1∩S2) is also zero. Equation (3) can then be simplified as

Based on the prioritized faults, an action plan can then be developed and the resources required to implement the action plan can be budgeted. It should be noted that the operational error has unity probability meaning that if any of the causes of failures occur, the operational error is certain. This property can be used to validate any computational error in the tree.
Case study
This case study is based on the 3 months’ defects data on the CFRP movable trailing edge assembly described in section “Quality risk ranking by reliability assessment.” Approximately 4000 holes are drilled per unit set. The chances of drilling-induced defects are vital and are the primary cost factors. The case study focuses on the three top COPQs in Table 1.
Assessment of drilling errors
As CFRP is widely used in aircraft structures and drilling is the main activity for assembling structures, the delamination of fiber is commonly recorded non-conformance. Delamination defects occur due to high brittleness of carbon matrix reinforcement, which causes high stress and fatigue to the air planes at high altitude. Studies predicted that delamination occurred due to the compression (axial force load) toward stack-up plies layers of CFRP. To understand the causes, the cause–effect diagram (Figure 3) is constructed based on the qualitative information and data-gathering from assembly process. The brainstorming activities have been carried out on the basis of field knowledge and listed according to the important aspects. Overall, 22 causes are listed for high importance in different branches of the cause–effect diagram labeled in Figure 3.
The process of FMEA formulation was initiated based on qualitative consideration by manufacturing management and on potential cost-effective measures. The FMEA analysis classified drilling-error defects quantitatively by assigning values to the following factors: severity, occurrences, and detection. The product of these three factors is the RPN which can impact internal failure cost in organization by the bottom-up approach (Table 2). In this instance, RPNs above 150 were considered in the prioritized list.
High-priority causes.
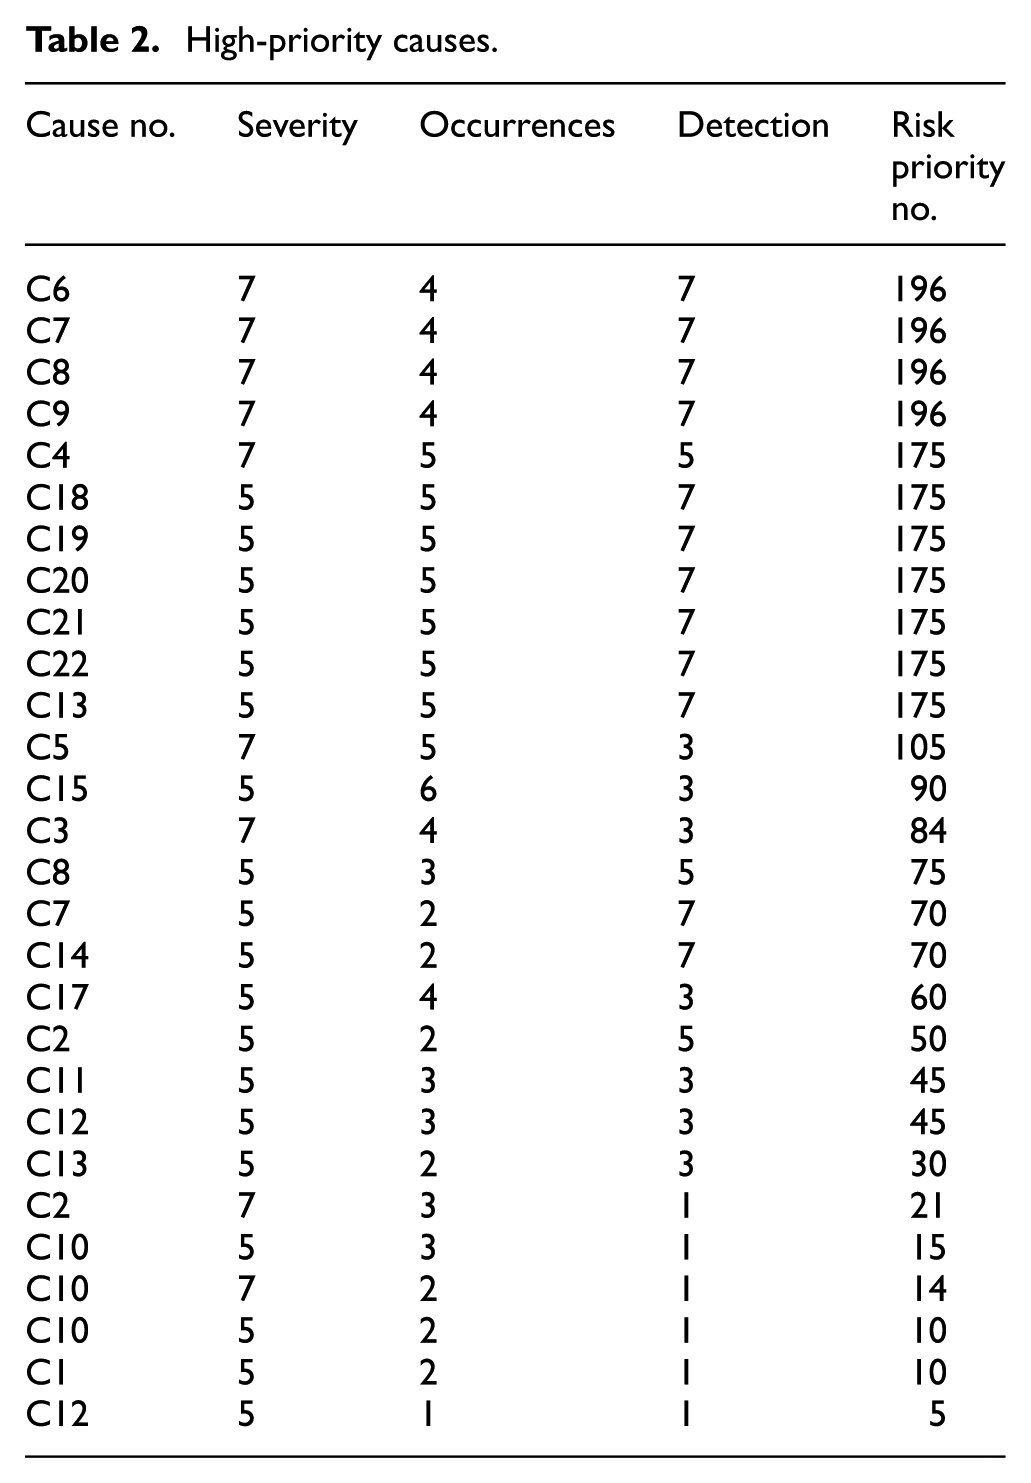
A total of 11 high-priority causes are considered from Table 2. The meaning of cause numbers is the 22 causes in Figure 3. However, the probability of occurrence has been assumed on the basis of judgmental point of view. Some failures are more probable to occur than others. In order to analyze further, the quantitative assessment is required to compare the effectiveness of qualitative occurrence against the high-priority causes due to multiple failures between processes. Further analysis is done using AHP methodology. This research uses a five-grade two-increment scale of intensity of importance as shown in Table 3.
AHP rating scale used.
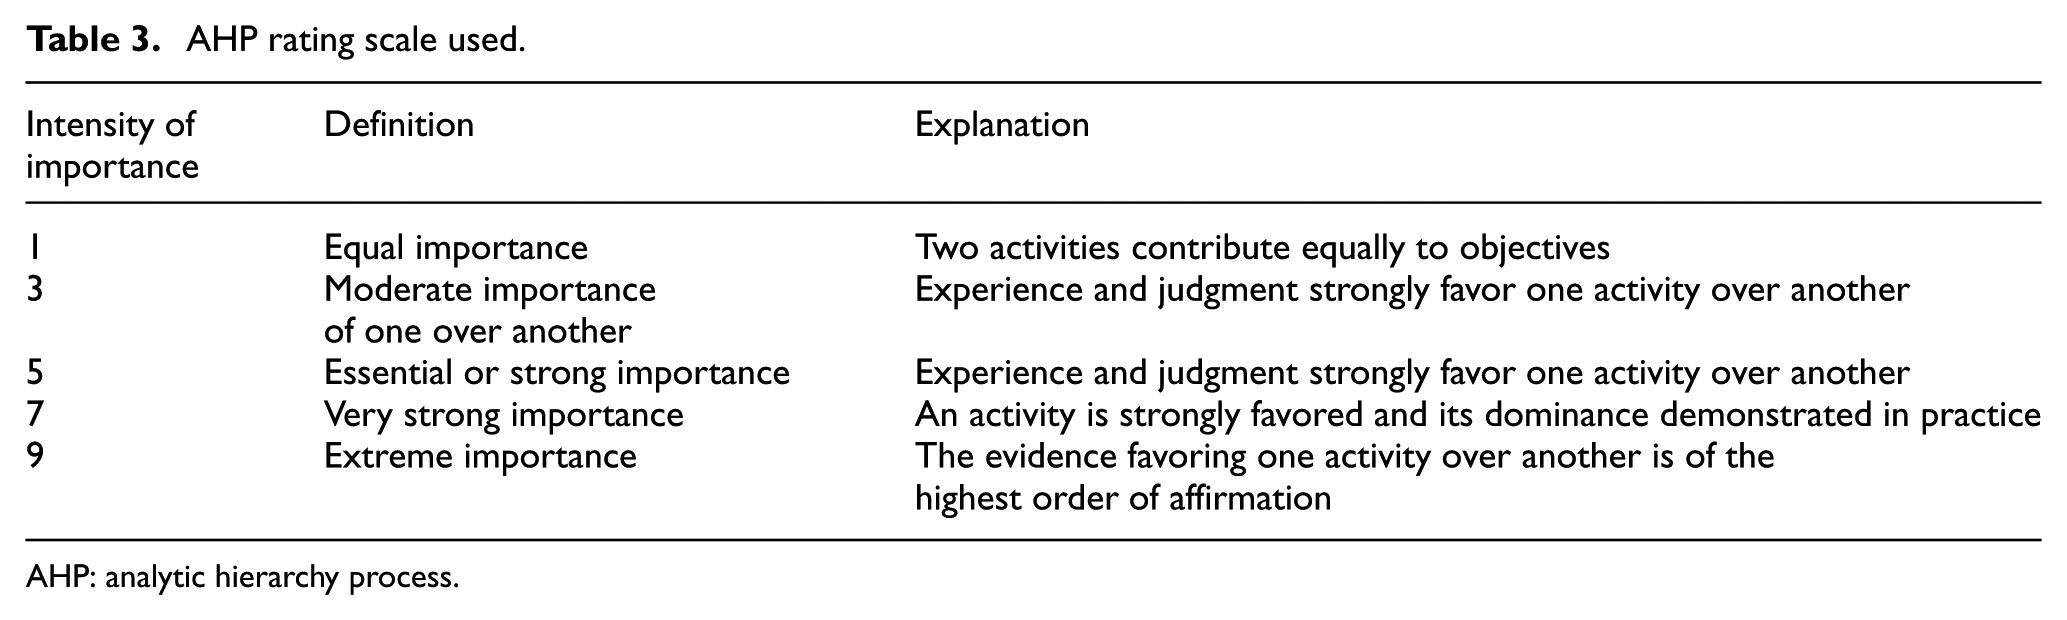
AHP: analytic hierarchy process.
The result of AHP with paired comparison for the 11 causes with RPN over 150 is shown in Table 4. The VPs are then calculated and treated as the probability of events leading to that cause of error (Table 4).
Cause failures prioritized by AHP.
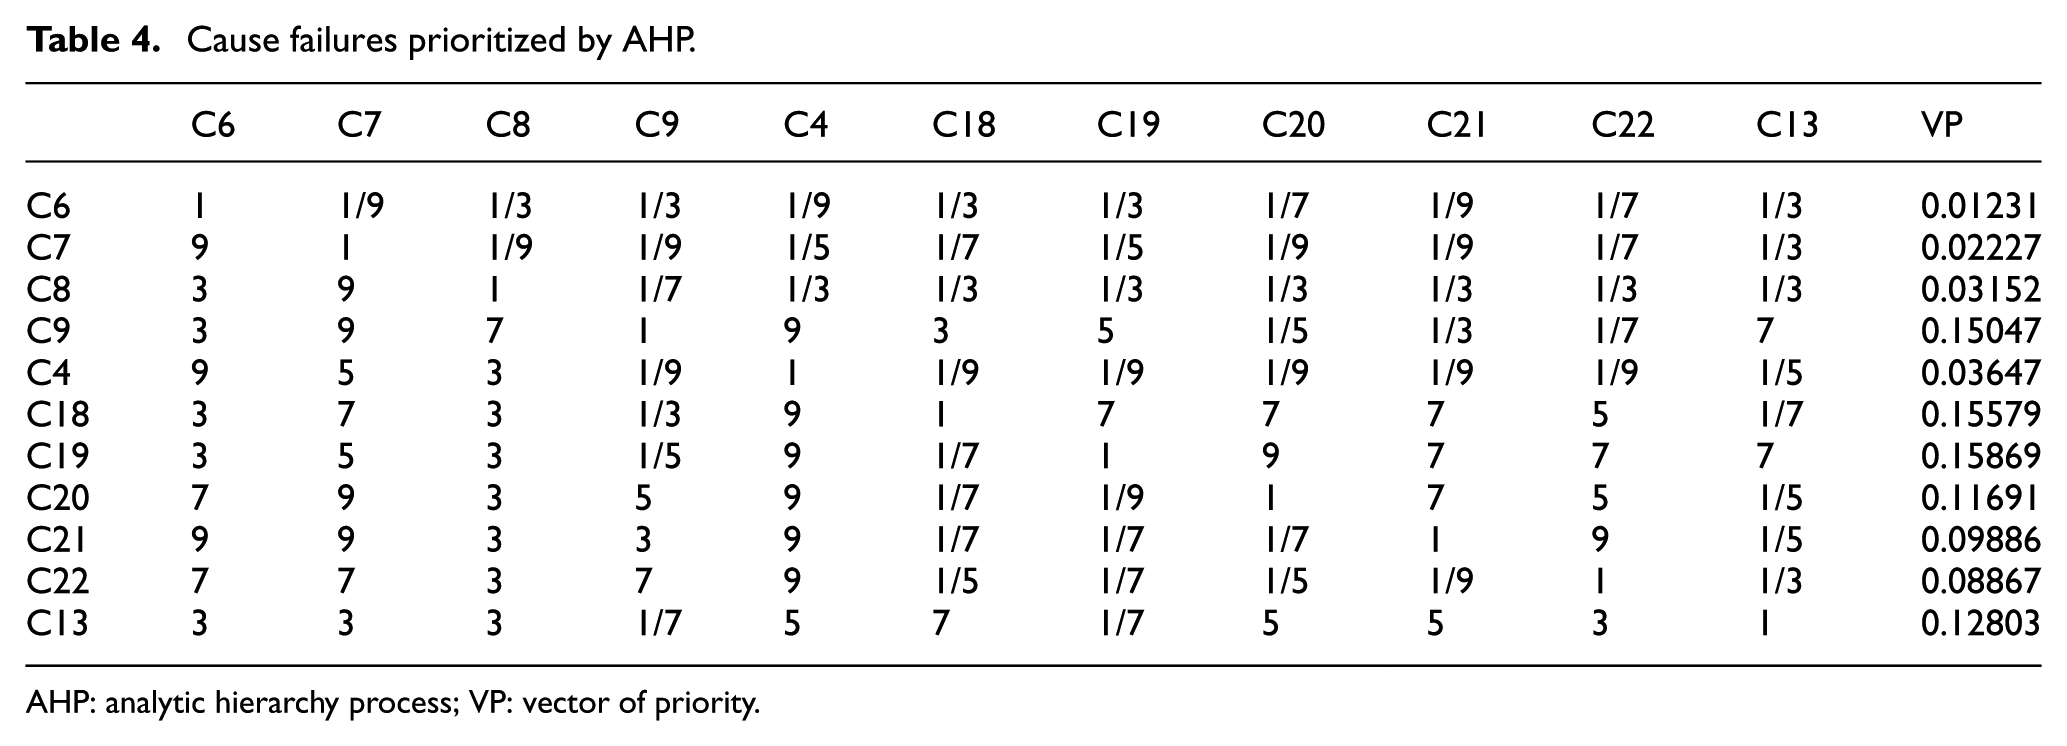
AHP: analytic hierarchy process; VP: vector of priority.
The fault tree is then constructed to incorporate the primary causes and the secondary faults as shown in Figure 4. The probabilities of failures in the tree are computed according to equations (1) and (3).
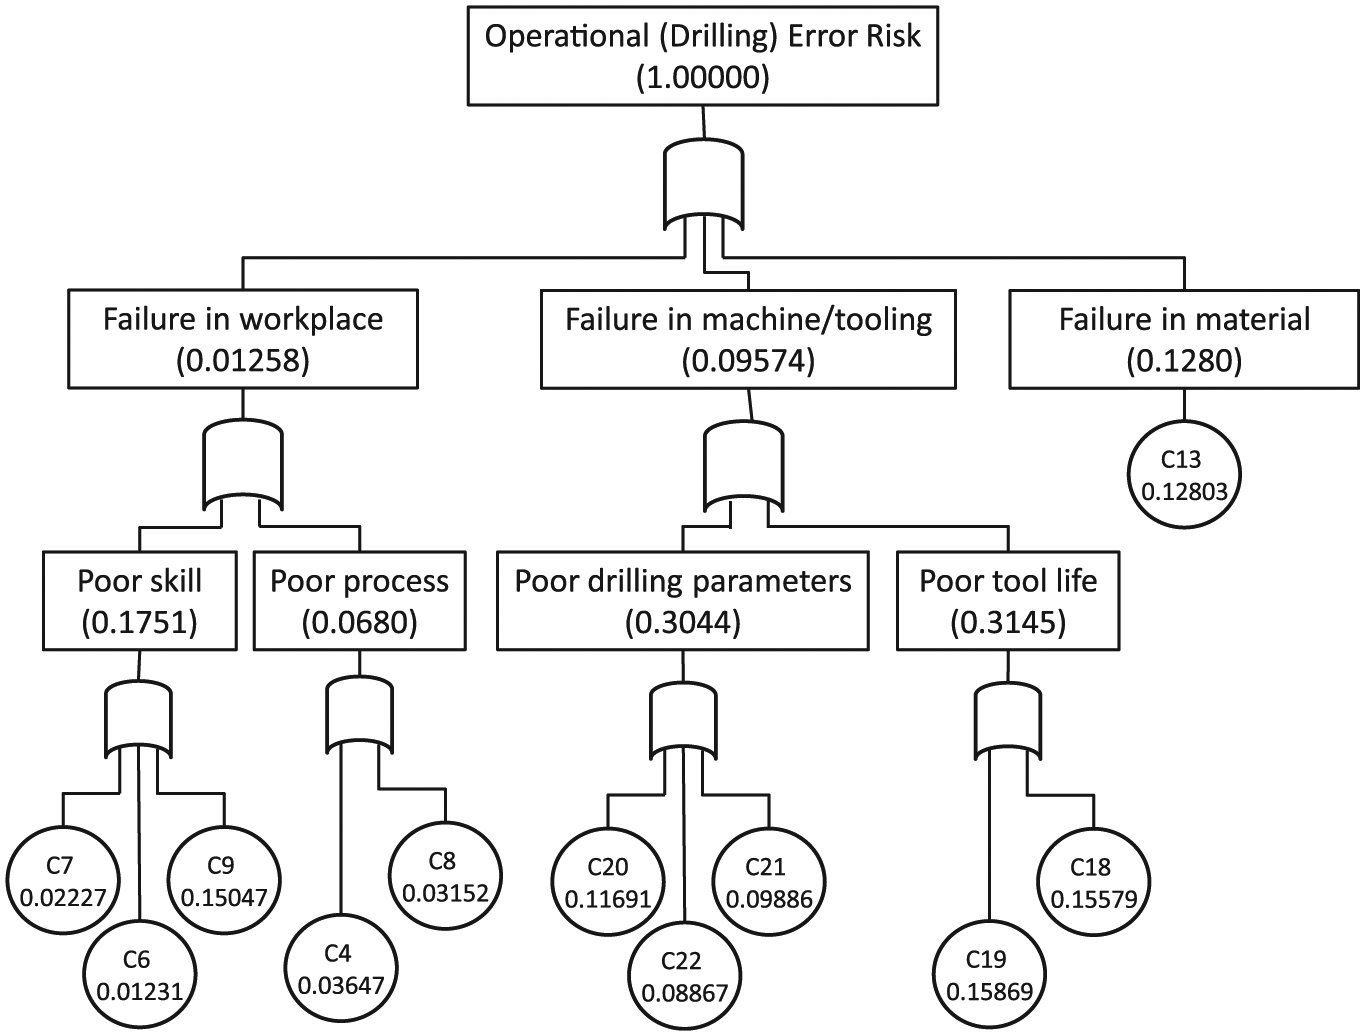
Fault tree analysis of drilling errors’ operational risk.
The operational risk of drilling errors represents the inability of the CFRP assembly process to handle the combination of the critical causes of failure in the drilling process.
Assessment of assembly errors
For this failure mode, the causes–effect diagram is quite simple and the causes are listed together with the RPN values that are computed from FMEA as shown in Table 5. The causes are further linked to the potential failures for determining the operational risks leading to assembly errors.
FMEA for assembly errors.
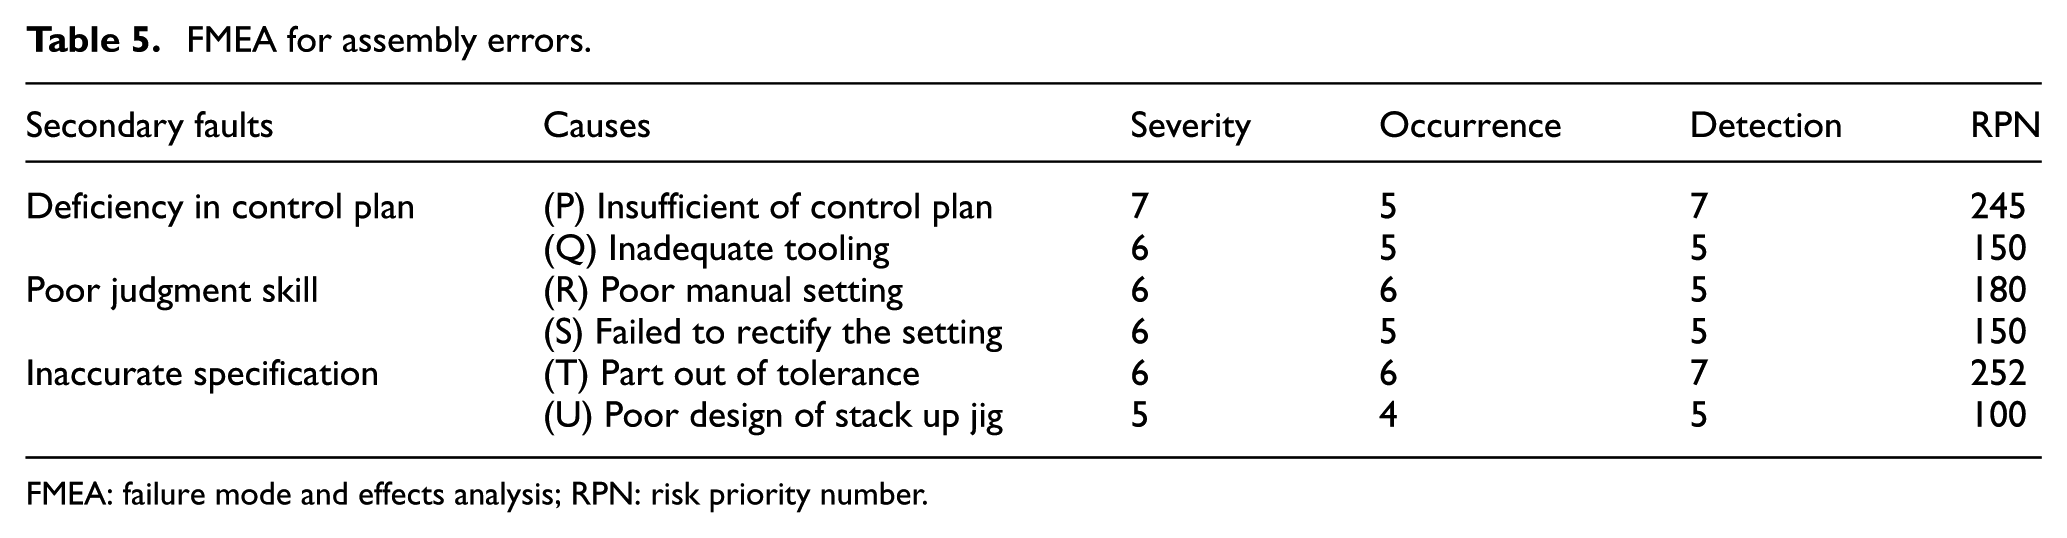
FMEA: failure mode and effects analysis; RPN: risk priority number.
Using the AHP assessment method, the probabilities are estimated in a similar way as the case of drilling errors and entered into the fault tree in Figure 5. In this case, there are six causes only. All causes are used in the fault tree. The probabilities of operational risk for assembly errors can then be computed in the fault tree as shown in Figure 5.
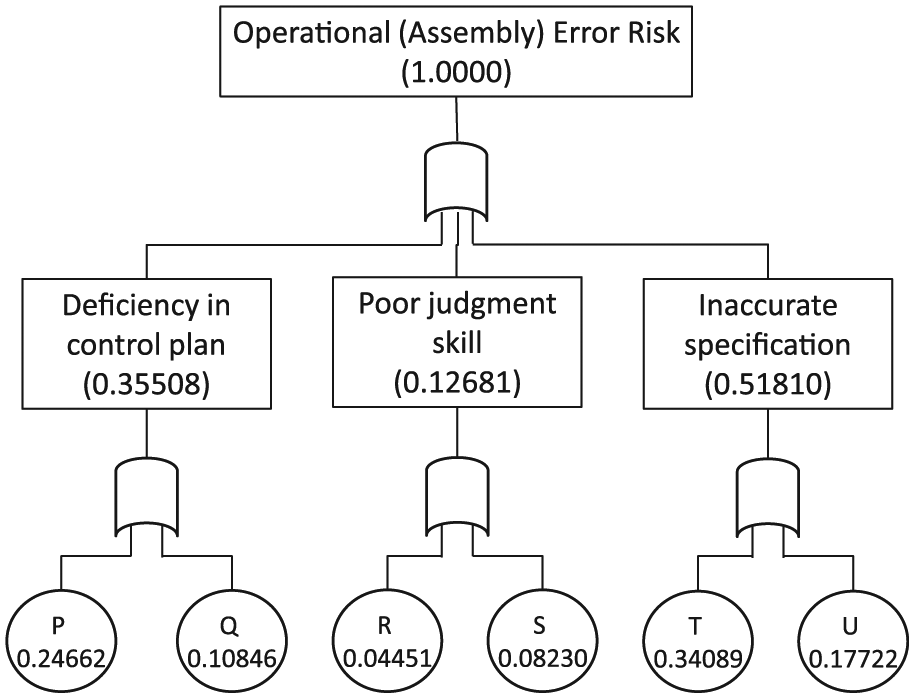
Fault tree analysis of assembly errors.
Assessment of part inspection errors
Over 90% of the drilling activities took place by manual drilling. After drilling, the parts were inspected by the operator and supervisor. Although all operators were trained personnel, there were many other factors in the manufacturing environment affecting their ability to identify abnormal holes. The cause–effect diagram in Figure 6 shows the individual causes for errors in part inspection.
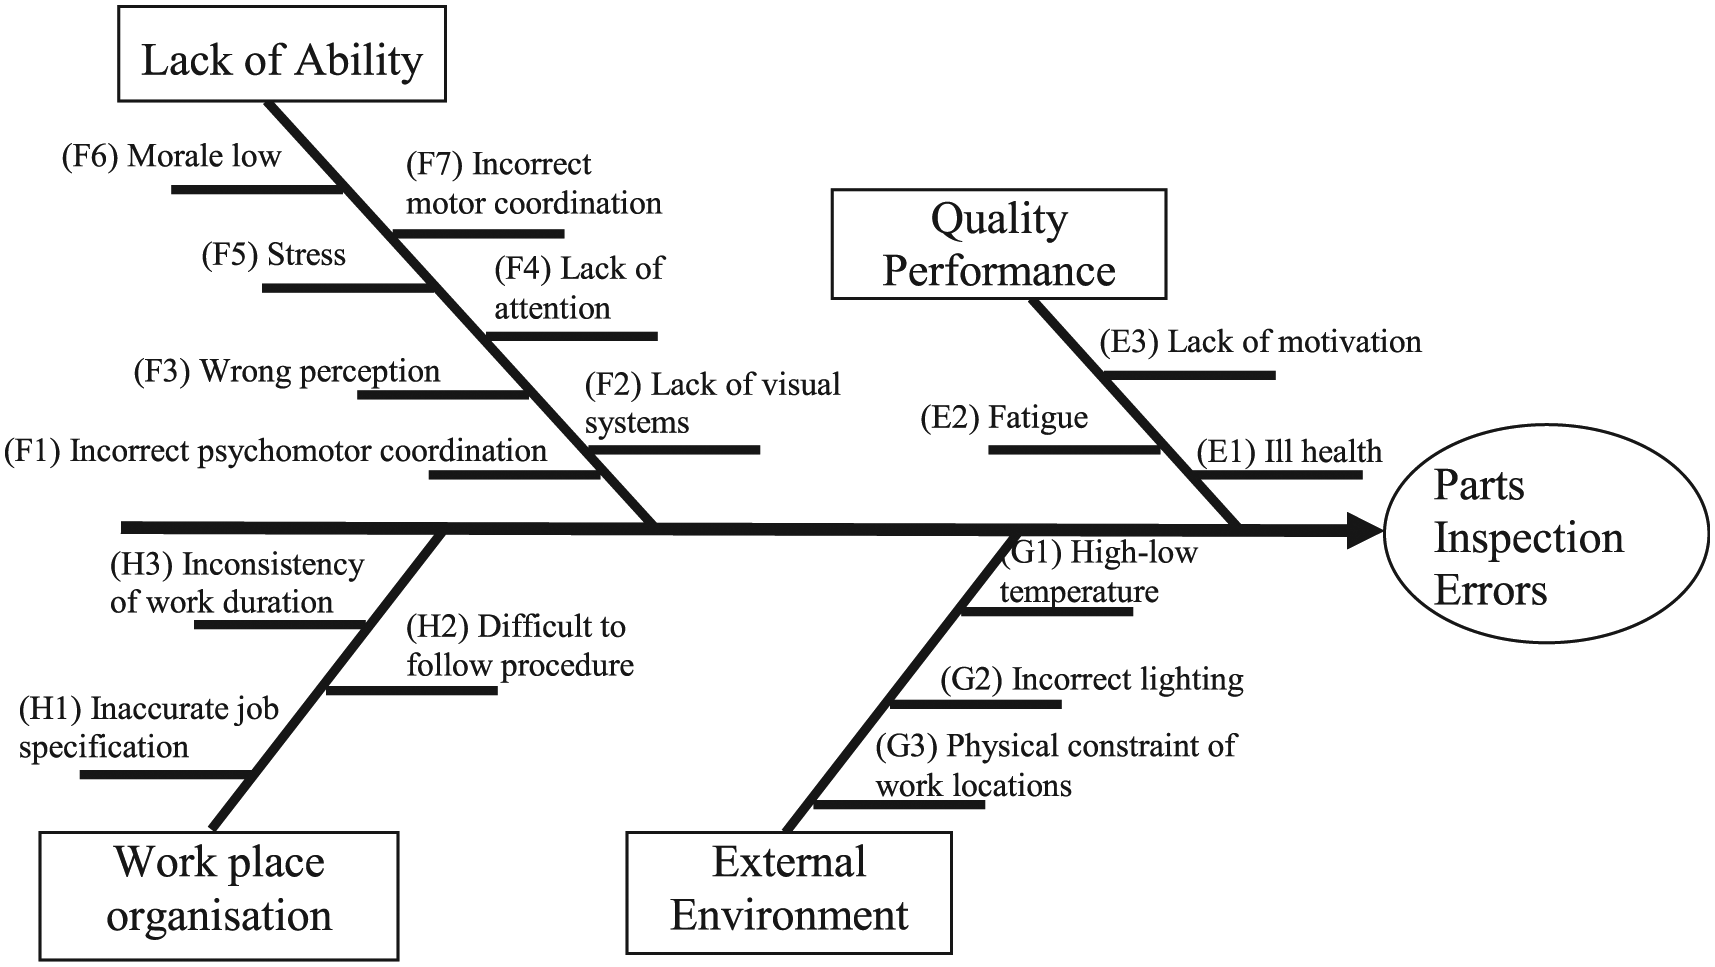
Cause–effect diagram for part inspection errors.
Human error is considered due to general workmanship compliance error in workplace. The defect of hole elongation happened on both holes’ entry or exit according to geometric dimensioning and tolerance, the terms of hole angularity, hole concentricity, and circularity of hole used to determine the hole elongation. The hole sizes were mutilated due to human error in drilling operation as recorded in systems. The RPN of each cause is computed in Table 6.
FMEA of part inspection errors.
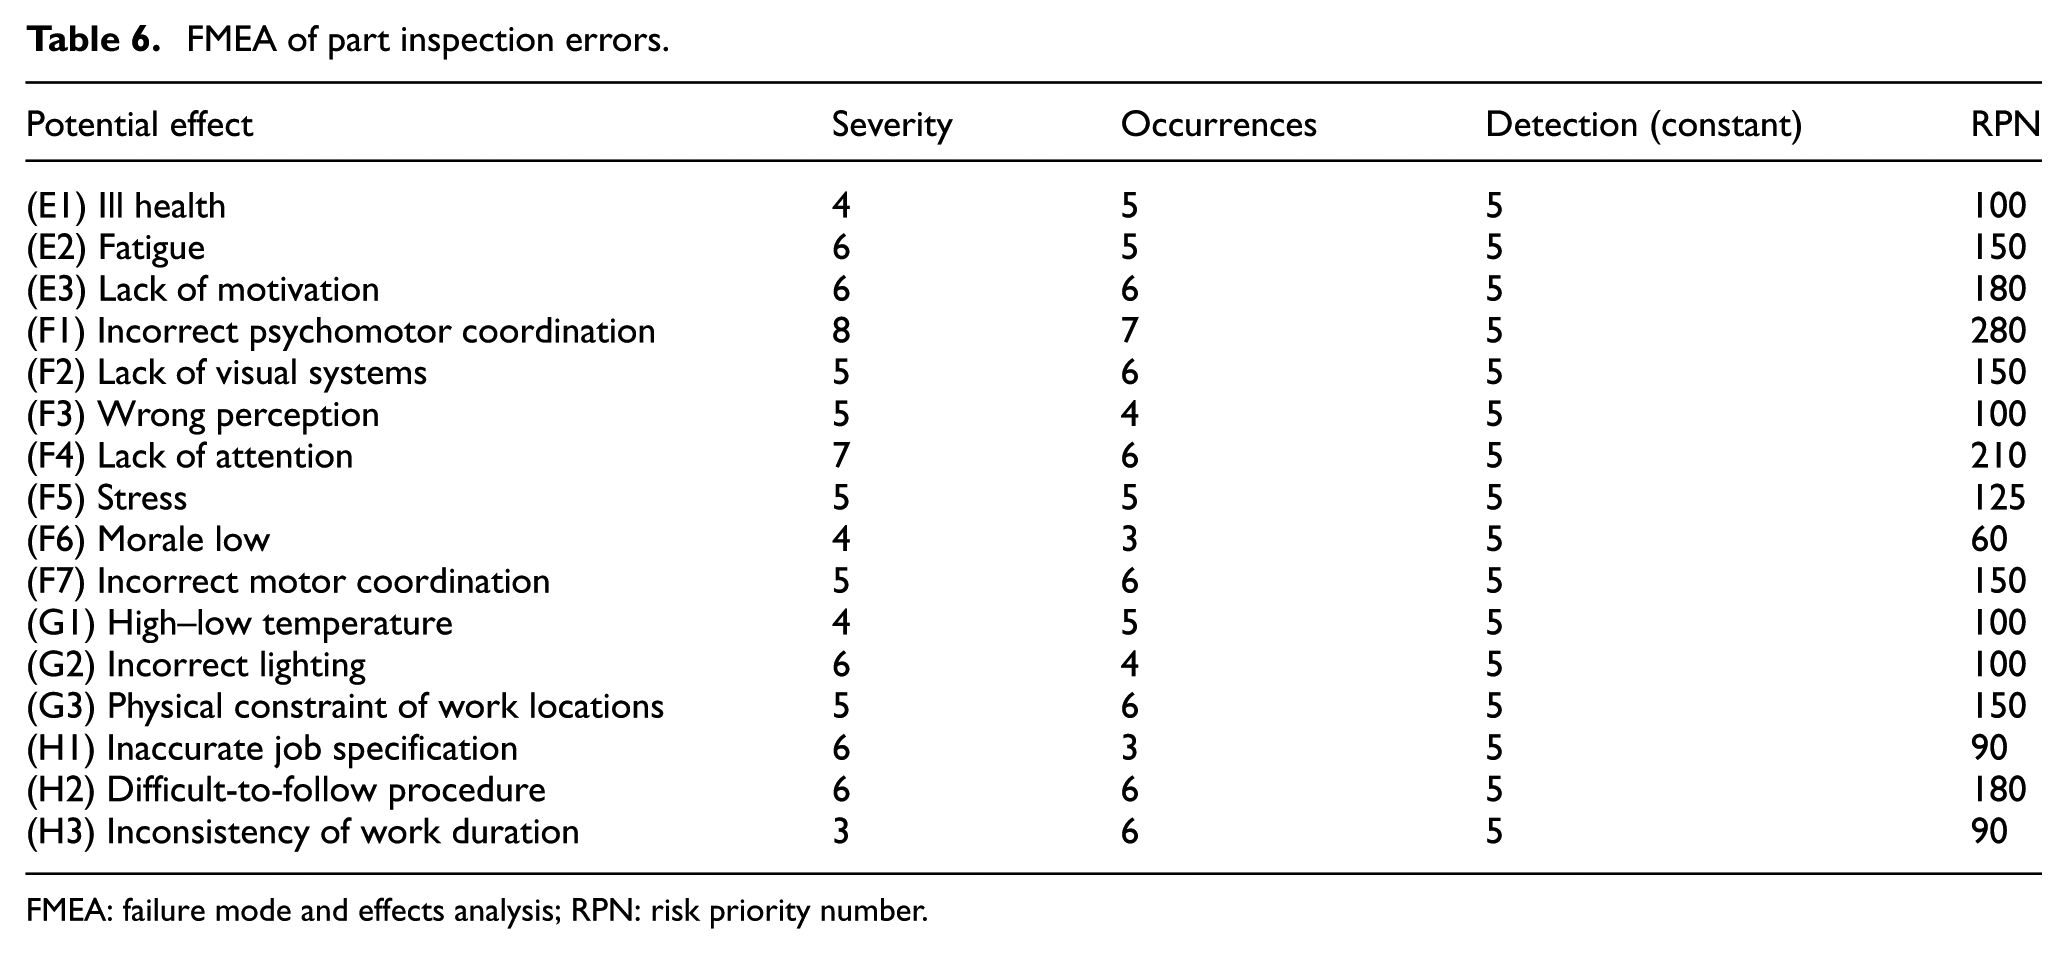
FMEA: failure mode and effects analysis; RPN: risk priority number.
The highest potential failure causes (RPN 150 or above) are selected to develop the probabilities using AHP methodology in the same way as in Table 5. In this case, causes E2, E3, F1, F2, F4, F7, G3, and H2 are considered. Similar to the other two failure modes, the fault tree for determining the operational risk for part inspection errors can then be developed as shown in Figure 7.
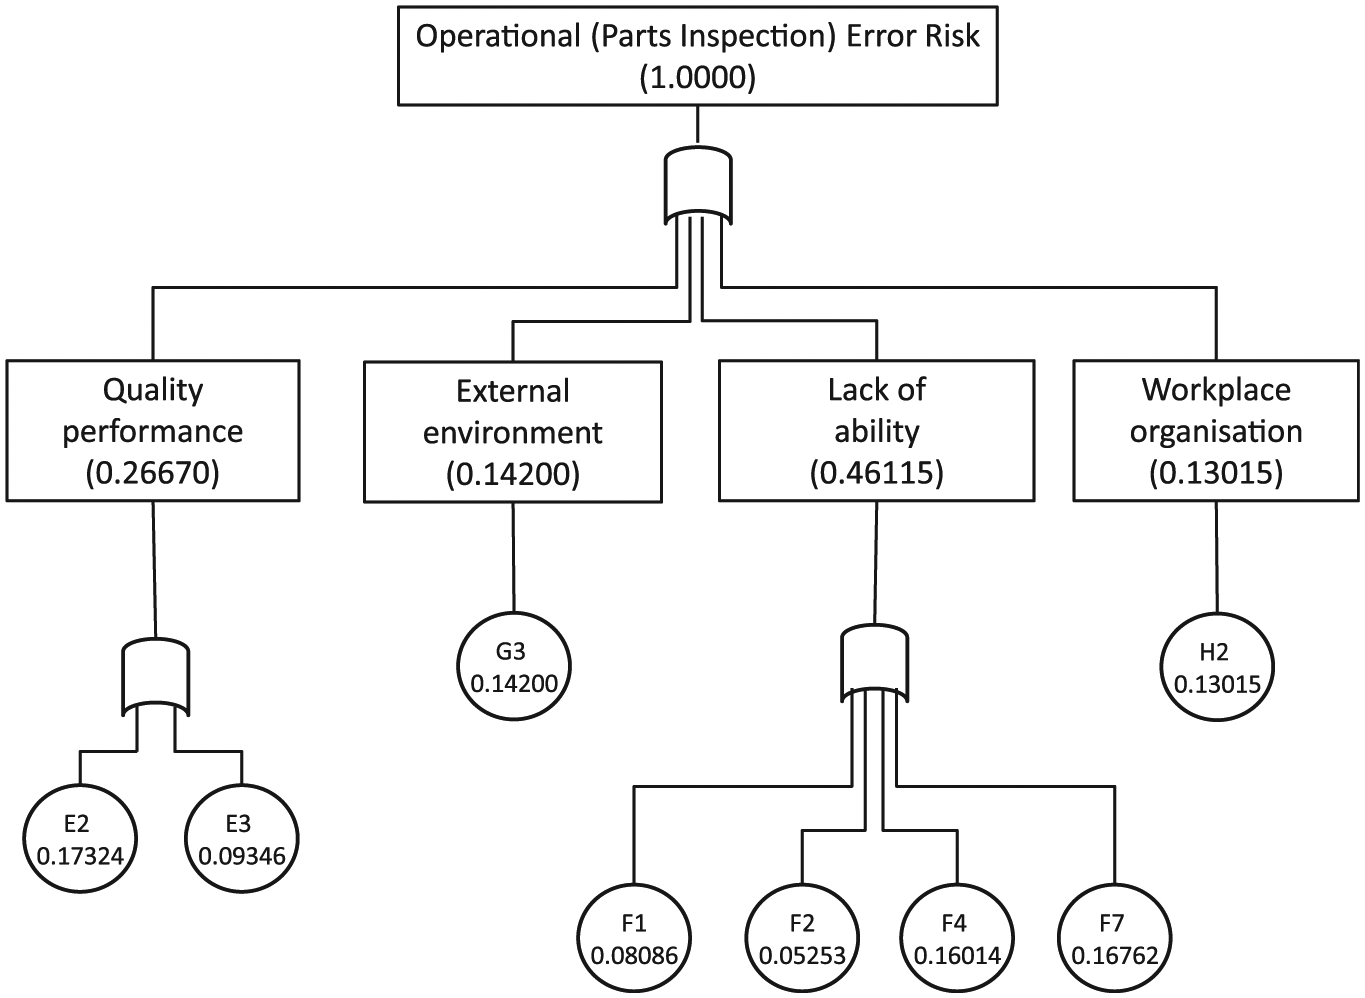
Fault tree of part inspection errors.
Combining results
The overall cost estimation for the prioritized modes of failure can be estimated by combining the probabilities of failures with the recorded COPQs as shown in Table 7. The risk costs are computed by multiplying the categorized costs with the probabilities of failures. The actions to be taken will be designed for the prioritized causes.
Risk action priority.
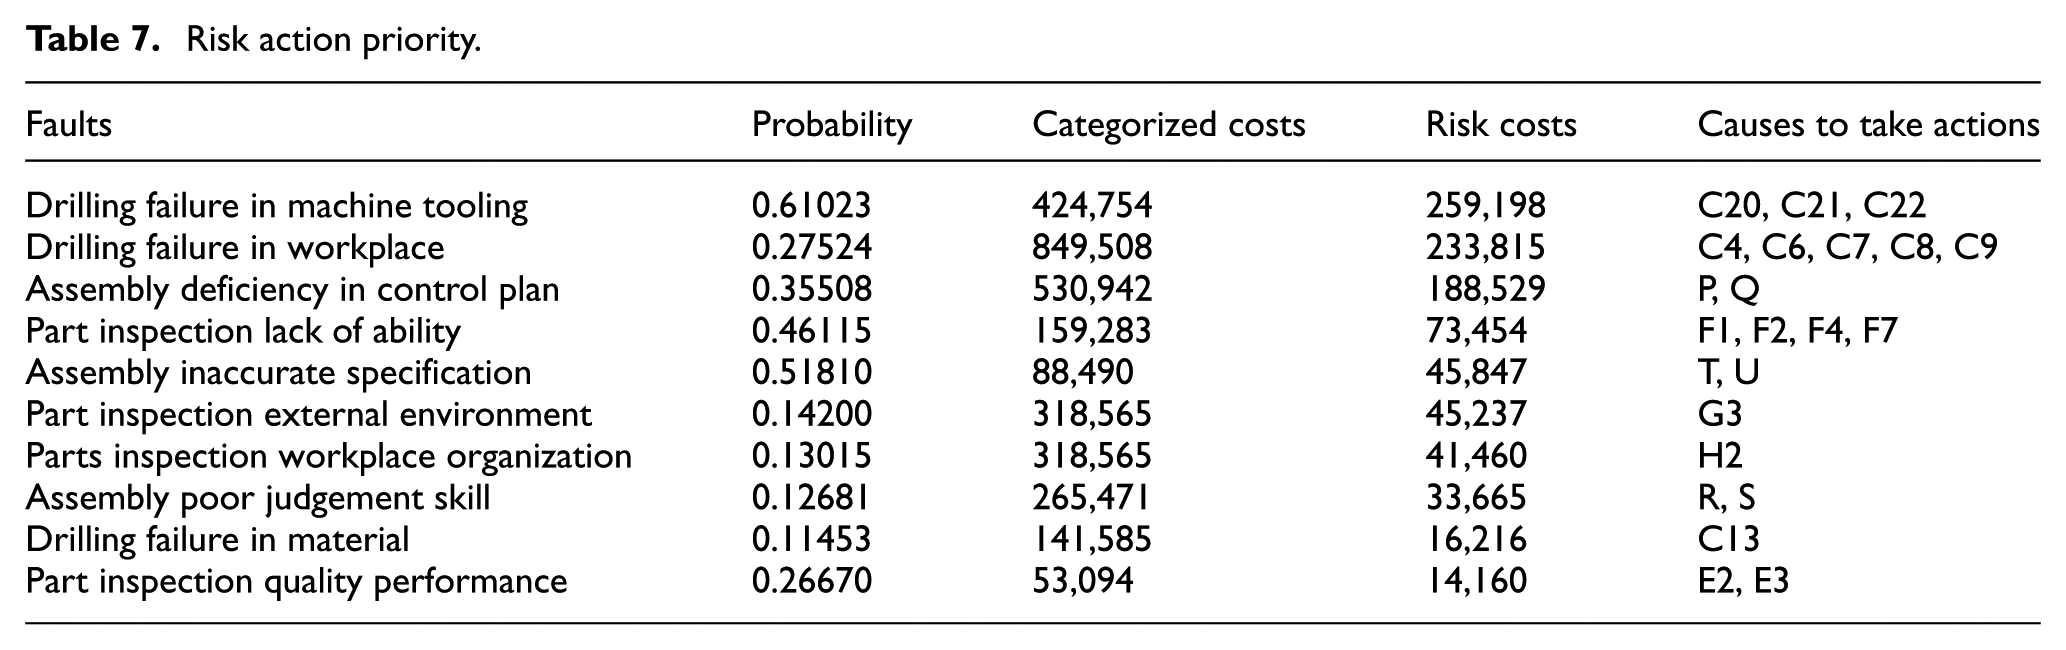
Based on Table 7, the risk action priority can be used as benchmark to reduce the consequences toward low level to avoid catastrophic events. In order to justify the risk avoidance, risk acceptance, and procedural control, a risk plan can be assigned to the respective risk owner on operational level to take action. For example, to mitigate the top fault “drilling failure in machine tooling” which can be generated by causes C20, C21, and C22, remedial actions can be taken specific to these causes. Causes C20 (“incorrect speed”) and C21 (“incorrect feed rate”) can be avoided by better operation instructions. Cause C22 (“thrust force too high”) can be removed by an active force control mechanism to be used in conjunction with the drill. Similarly, decisions on actions to mitigate other causes with lower priorities can be made wherever applicable.
Although the case study is specific to CFRP assembly process, the method presented in this article is based on a number of generic reliability analysis tools. It is therefore possible to apply the same method to other types of manufacturing processes. However, the application of FMEA, fault tree, and AHP techniques to non-assembly operations may need adjustment according to the nature of the manufacturing process being assessed. Further research for generalization would be necessary.
Conclusion
Risk planning involves the thoughtful development, implementation, and monitoring of appropriate risk-response strategies. Risk planning is interactive and includes description and scheduling of activities and processes to be assessed (identify, mitigate, monitor, and document the risk associated) within an operation. A multiple failure mode assessment was discussed and illustrated as a means of quality cost–risk estimation for organization’s subcomponent failures and its potential basic events. The study has established a new method to provide a priority list of actions for operation management to overview the route of quality improvement for internal failure cost mitigation.
This study concludes that application of reliability tools can be applied at the operational level to mitigate cost–risk estimation rather than normal options for equipment reliability or for complex studies. The quality ranking model is based on internal failure cost and can be fraternally assimilated within quality and risk management for continuous improvement. This method allows the production manager to focus on holistic risk management approach that minimizes the risks of all major operations leading to the final production outcome.
Footnotes
Declaration of conflicting interests
The author(s) declared no potential conflicts of interest with respect to the research, authorship, and/or publication of this article.
Funding
The author(s) received no financial support for the research, authorship, and/or publication of this article.