
Abstract
The liquified natural gas (LNG) is currently considered an attractive marine fuel in the short- to medium-terms that can lead to the reduction of the shipping industry carbon emissions. LNG fuelled ocean-going ships have been designed by employing either low-pressure or high-pressure fuel systems. This study aims at enhancing the safety of a high-pressure fuel gas supply system (FGSS) designed for ocean-going LNG fuelled vessels. A model-based safety analysis is performed by employing the MADe™ software. The functional model of the baseline design of the investigated system is developed and subsequently employed to carry out the Failure Modes, Effects and Criticality Analysis (FMECA), as well as the quantitative Fault Tree Analysis (FTA). FMECA provided the risk priority number (RPN) for the identified system failure scenarios, the analysis of which leads to the identification of the FGSS critical components. The FTA results, which include the probabilities of the selected top events and appropriate importance metrics, are used for the FMECA results verification. This study results demonstrate that the FGSS critical components include the process valves responsible for supplying either LNG or natural gas to the gas treatment system and consumers respectively, as well as the pressure feedback controllers. Recommendations for design alterations pertain to the addition of pressure sensors and redundancy of the identified critical system components. The derived results demonstrate that impact of these design alterations on the calculated safety metrics are quite considerable, thus enhancing the safety of the baseline design. This study contributes to the safety analysis of FGGS and supports decisions for the designer and operator of LNG fuelled ships.
Keywords
Introduction
The use of Liquefied Natural Gas (LNG) as marine fuel introduces new challenges for the safe design and management of the LNG fuelled vessels. The pertinent safety challenges are associated with the flammability of the fuel and the development of explosible pockets in case of leakages,1–3,4 the inclusion of several new equipment types (required for treating the cryogenic fuel), the overall system complexity, as well as the heterogeneity and reliability of the system components.
The design of the LNG fuelled vessels is primarily guided by the International code of safety for ships using Gas and other low flashpoint Fuel (IGF code). 5 However, this guidance is prescriptive, which leaves leeway for improvement in certain areas of these systems safety. Several studies1–3 focused on estimating the leakages and fire risks in LNG systems. Rather few studies6,7 investigated the potential for safety enhancement of LNG systems. The alternative design of the LNG feeding systems was proposed in other studies.8,9 The reliability and availability assessment of the fuel gas supply system (FGSS) was based on methods, such as, Failure Mode, Effects, and Criticality Analysis (FMECA), 10 Bayesian Networks (BN) 11 and tools, such as, the MADe™ software. 12
FMECA is a ‘bottom-up’ method, meaning that the analysis begins at the lowest level of the system’s hierarchy, and through the knowledge of the system components failure mode, it proceeds up through the system’s hierarchy to determine the cause and effect of each failure mode on the system’s performance. 13 FMECA cannot simultaneously capture multiple failures and is associated with certain degree of subjectivity. 14 Quantitative Fault Tree Analysis (FTA) can mitigate these issues when combined with FMECA, as it is a ‘top-down’ approach that analyses the system in a multi-failure perspective. 15 These methods combination also reduces the degree of uncertainty, as FTA can be used to verify the FMECA results, thus contributing to the consolidation of the performed safety analysis findings. 15 Bayesian Networks is a robust probabilistic method of reasoning under uncertainty, which is employed in several applications for safety-critical systems analysis. However, similarities between FTA and Bayesian networks exist, as Fault Trees can be transformed into Bayesian Networks by following a set of rules. 16 This study employs FMECA and FTA to perform the safety analysis of the considered high-pressure fuel gas supply system (FGSS), as these methods are widely employed at industrial applications.
Model-based approaches for the systems’ safety are advantageous for systems with increased complexity, as the conventional FMECA spreadsheet analysis and the manual FTA are more cumbersome and time consuming. Functional models of complex systems greatly support the safety analysis and the identification of the investigated critical components, via the simulation of failure injections and the representation system response to these failures. Several model-based approaches and software tools to the safety analysis have been employed in previous safety analyses and pertinent studies. These include Hip-HOPS, 17 MADe, 18 COSSMOS, 19 COMPASS, 20 ADS-IDAC, 21 PyCATSHOO, 22 PTC Windchill 23 and many others. 24
Hip-HOPS 17 is based on the system model, which is enriched with failure data and employs a series of rules to move backwards from the top event to the basic events to generate the Fault Tree and the FMECA table. MADe 18 is similar in concept to Hip-HOPS, 17 however, it is based on the functional system model and also employs techniques to generate Fault Trees and FMECA tables. COSSMOS 19 provides the platform to develop the physical model for a system (based on differential and algebraic equations) and enrich it with faulty data. Hence, it can be computationally expensive and not so useful developing Fault Trees and FMECA tables. COMPASS 20 is based on model-checking techniques for Fault Tree development, thus it can be computationally expensive. ADS-IDAC 21 is more suitable for the analysis of human-machine interactions. PyCATSHOO 22 employs Monte Carlo simulations, which can be very expensive computationally. PTC Windchill 23 is a software tool for Fault Tree generation with limited automation support. MADe™ compared to the other model-based tools offers built-in libraries for the mechanical systems components and failure modes to facilitate the safety analysis. Additionally, it offers a user-friendly interface and allows for relatively quick and effective generation of Fault Trees and FMECA tables based on the developed and functional and failure models. In this respect, MADe™ has been selected for use in this study.
Recent studies used the MADe™ software 18 for the safety analysis of marine systems, such as the lubrication oil system, 25 the fuel oil feeding system, 26 as well as the low-pressure LNG storage and FGSS. 12 Other model-based safety approaches were employed for the case of a waste heat recovery system of an ocean-going vessel, 27 and for the fuel oil system of an offshore supply vessel28,29 However, studies focusing on model-based safety analysis for the marine and ship systems are limited, whereas studies considering the safety of high-pressure FGSS for LNG fuelled ships are not reported in the pertinent literature. The high-pressure FGSS (compared with the low-pressure FGSS) has different architecture, sub-systems and components.
Hence, this study aims at the safety analysis and design enhancement of a high-pressure FGSS based on existing Model-Based Safety Analysis tools. The novelty of the present study stems from: (a) the use of the model-based approaches combining functional modelling, failure modes analysis, faults injection, model-based FMECA and FTA for the safety analysis of a high-pressure fuel gas supply system (FGSS) for LNG fuelled ships; (b) the identification of critical components for the investigated FGSS, and; (c) the provision of recommendations for design alterations, the safety performance of which are assessed against the FGSS baseline design.
The remaining of this study is structured as follows. In Section 2, the investigated system details are provided. The methodology and the rationale behind various steps are described in Section 3. Section 4 includes the relevant input, whereas the results of the employed methodology are presented and discussed in Section 5. In Section 6, the main findings are summarised, and conclusions of the study are presented.
Investigated system
The system investigated in this study is the LNG fuel storage and natural gas supply system (fuel gas supply system (FGSS) henceforth) that is employed to supply the main and auxiliary machinery (natural gas consumers or consumers for brevity henceforth) of an LNG fuelled crude oil tanker having a size of 110,000 dwt. Only the main parts of this system are illustrated in Figure 1, as the system details are confidential. The ship natural gas consumers include the main engine, auxiliary engines, auxiliary boilers, and composite boilers. These consumers are responsible for the ship main operations, which include sailing, cargo heating, cargo unloading and at port. Two LNG type “C” tanks are used for storing LNG onboard and are responsible for supplying LNG to the gas treatment system. Boil-off gas (BOG) is a natural by-product of LNG and is continuously produced inside each tank; the BOG is also used to feed the consumers when required. Depending on the ship’s operating mode, the consumers can be served by two alternative paths when the stored LNG is used, whereas three alternative paths can be followed when the produced BOG is used. The investigated FGGS acts both as a high-pressure and low-pressure system to supply natural gas to the consumers at the required pressure.
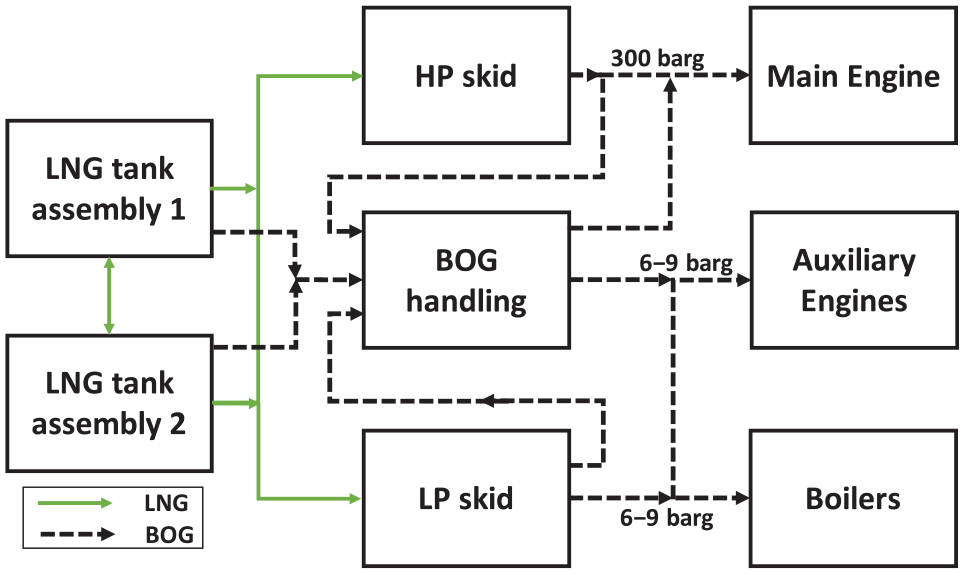
LNG & BOG pathways as provided by its designer.
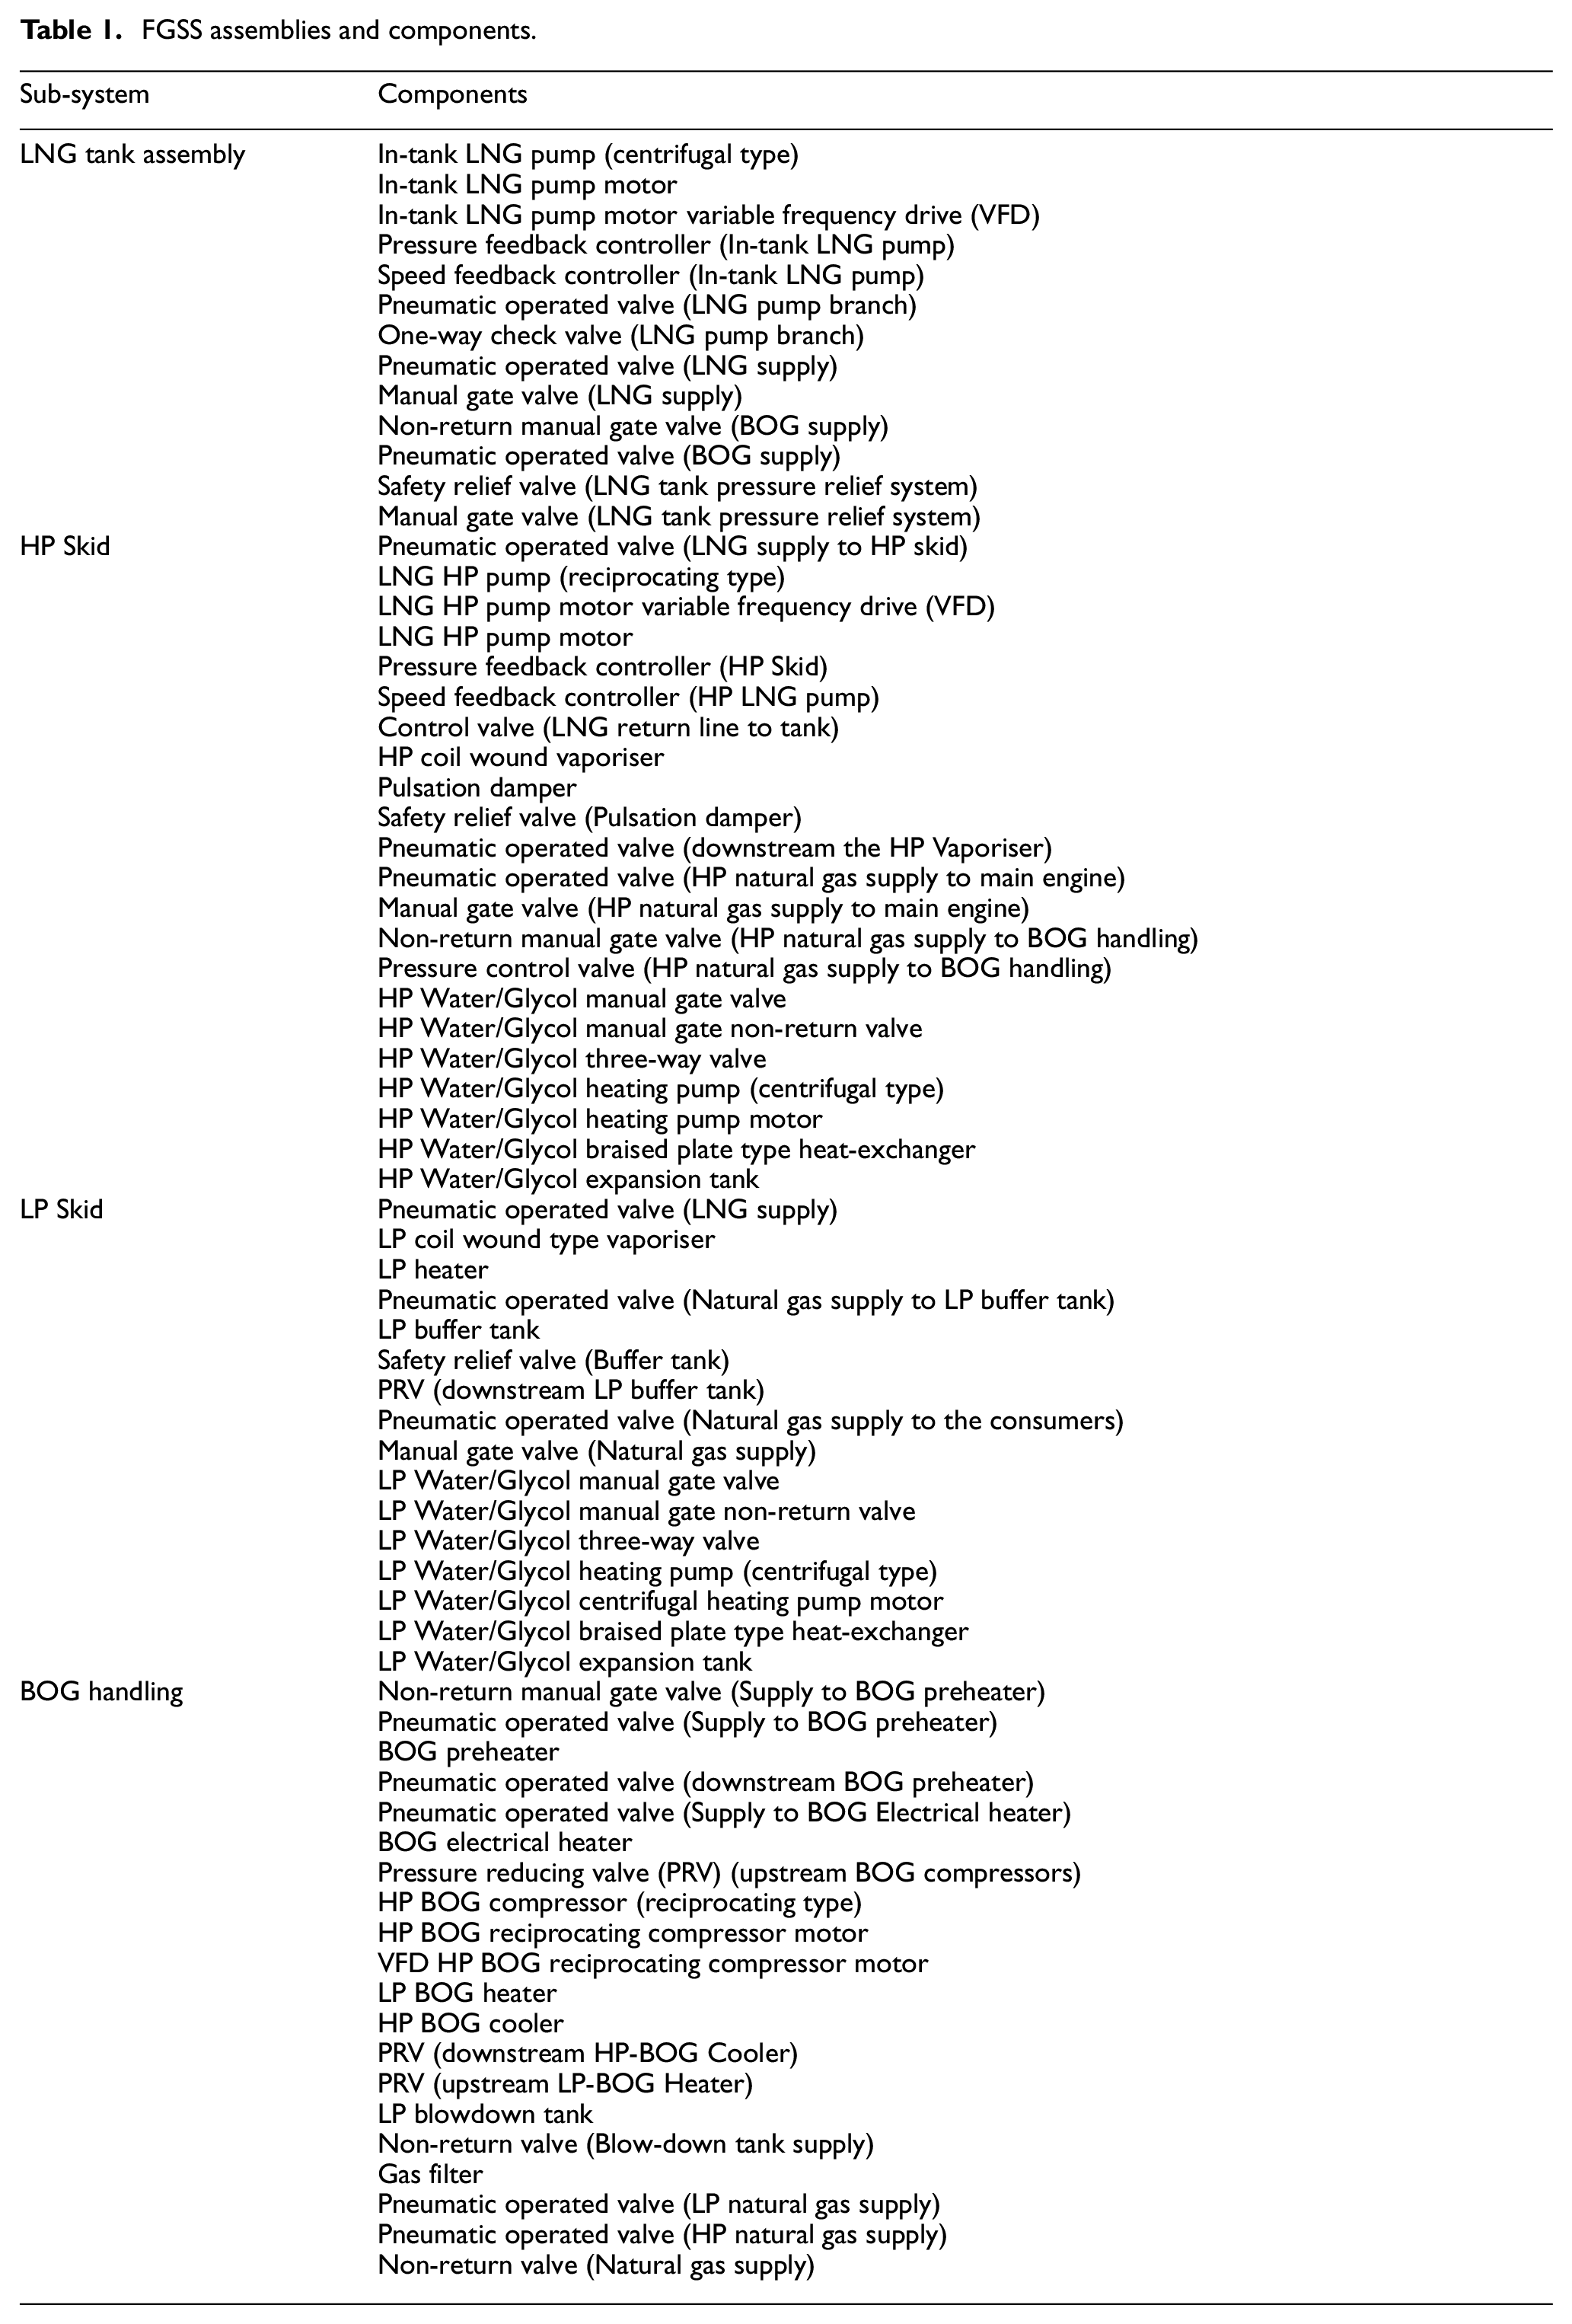
The system consists of the following main subsystems, which are also presented in Figure 1: (a) high-pressure (HP) skid that provides natural gas at a pressure of 300 barg to the ship main engine (ME); (b) low-pressure (LP) skid that provides natural gas at a pressure of 6−9 barg to auxiliary engines (AE) and boilers; (c) LNG storage tanks assemblies, and; (d) BOG handling unit. The components of each subsystem of the investigated system are listed in Table 1. The investigated FGSS was designed with sufficient level of redundancy to reduce downtime and risk, hence many of the system components (i.e., pumps, compressor, etc.) are duplicated. It must be noted that Table 1 does not provide each component number; a component may be present multiple times in each subsystem. The number of components responsible to deliver the gaseous fuel to the consumers is portrayed at a later stage in the system functional modelling.
FGSS assemblies and components.
Methods and tools
Software selection
This study employs the MADe™ software that provides the following advantages: (a) it facilitates the safety analysis of complex systems by simulating multiple simultaneous failure injections; (b) FMECA reports are generated and FTA are performed by employing the developed functional model, thus reducing the required time to carry out these activities, in comparison to the traditional spreadsheet and manual tools; (c) update of the functional model to capture changes of the system design are associated with lower processing time; (d) built-in libraries of mechanical components and failure modes are provided, which facilitates the development of the functional model.
Methodology overview
To carry out the safety analysis and design improvement of the investigated FGSS, the methodology presented in Figure 2 is followed. Step 1 includes the familiarisation with the system and the collection of all the required information to form a consolidated overview of the system operating profiles and system missions. Step 2 focuses on the functional modelling of the system in MADe™, where a functional representation of the system process is laid out. The developed model consists of components and subsystems that are interconnected with flow elements to mimic the system operation. This functional model is verified using random failure injections in Step 3. Step 4 includes the development of failure diagrams that graphically represent the series of events leading to the components failure. Output from Step 1 is used to enrich the failure diagrams with realistic failures occurring in the investigated FGSS. The developed failure diagrams are subsequently used in Step 5, where the FMECA tables are generated based on the functional model. The FMECA tables are then refined and enhanced to reflect the realistic operation of the investigated system and the risk priority number (RPN) for each failure mode is calculated. Step 6 employs FTA to develop fault trees (FTs) for representing top events and provide estimations for their probabilities of occurrence, thus leading to the verification of the FMECA results. Finally, Step 7 incudes the recommendations for design improvements based on the FMECA and FTA results and interacts with Step 6 to calculate the RPN and the quantitative FTA metrics for the proposed alternative system designs. The calculated safety metrics for the baseline and the revised systems are compared to conclude on the obtained systems’ safety enhancement.
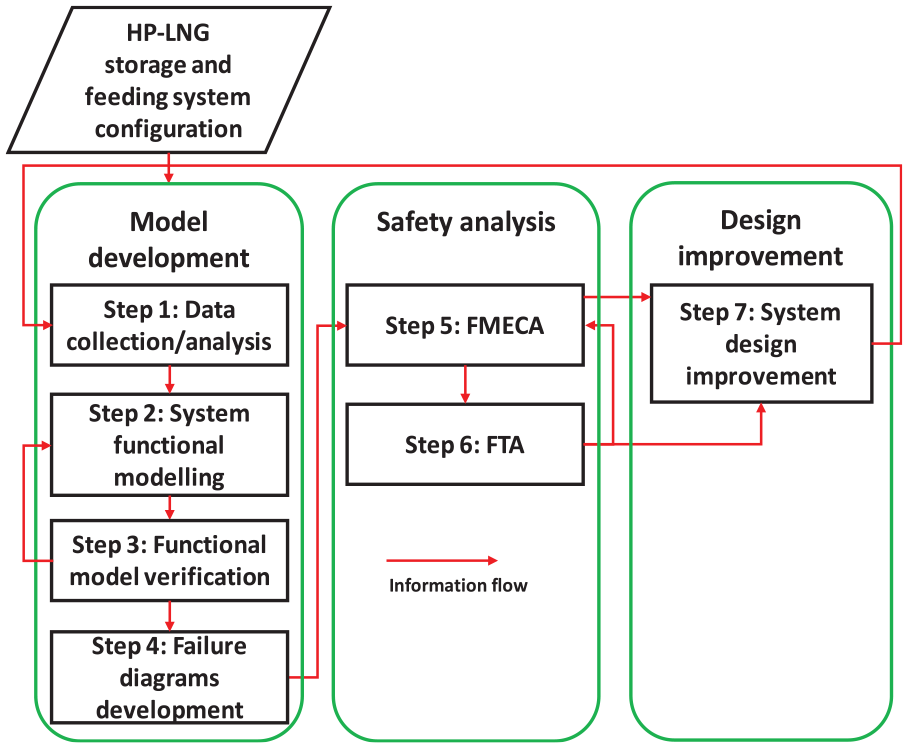
Methodology flowchart.
Step 1: Data collection and analysis
In this step, the components and interconnections required for the investigated high-pressure FGSS functional modelling are identified. The FGSS diagram provided by the system designer is thoroughly studied, so that its overall scope, operating philosophy and the processes flows are established. In addition, the system missions and operational phases as well as the systems components are identified. This system components are grouped to several categories as delineated in the following sections.
Typical component failure modes are identified through the MADe™ built-in libraries. Additionally, extensive literature review was employed to identify the most common failure modes taking place in LNG fuel systems and similar cryogenic environments. To identify the component failure rates (λ) required for the FMEA and FTA, several sources were reviewed including pertinent publications,10,11,30–34 reliability handbooks,14,35 and the OREDA reliability database; the latter is extensively employed in the offshore and marine industry.36,37
Step 2: System functional modelling
Using the information collected in Step 1, the functional model of the investigated system is developed in MADe™. This model includes all the system components and is based on the Fuzzy Cognitive Maps (FCM) approach. 18 FCMs are fuzzy-graph structures for representing casual reasoning, are was described in Kosko. 38 FCMs interconnects various elements whilst providing the interconnections polarity (positive or negative). The FCMs exhibit similarities with Bayesian Networks; however, they are not acyclic allowing for representation of circular interactions. The relationships between the elements are associated with either positive or negative signs (instead of the Bayesian rule employed in BNs). Subsequently, a diagnostic ‘What-if’ analysis is performed to establish the components dependencies and map the system response to random failure injections.
The FCM modelling of the investigated system is carried out at a conceptual level combining elements from the MADe™ software interface. These elements can be either single components (e.g. heat exchanger) or subsystems, which group a few or several components (e.g., Boil-off Gas (BOG) Handling, High-Pressure (HP) skid, etc.). These components/subsystems are then interconnected by using MADe™ built-in functions, which describe the operation of the system. Inflows and outflows are assigned to each function based on the respective subsystem/component. A causal relationship is also defined for each inflow and outflow, which can take a positive or negative value depending on the individual functionality and its effect on the system operating parameters. For instance, the causal relationship between the inlet LNG flow and outlet natural gas flow of the HP Vaporiser is positive, as the liquid inflow entering positively affects (increases) the vapour outflow. Each causal connection has a direction and a polarity. The direction of each connection represents the direction of the flow. The polarity indicates whether the relationship between the connected parameters is positive or negative, that is, directly, or inversely proportional. These interdependencies can be identified and analysed using failure simulations or failure injections.
Figure 3 depicts an example of the high-pressure (HP) vaporiser functional properties and their interconnections. The HP vaporiser mission is to change the LNG phase (from liquid to vapour) using a heating medium, which in this case is the Water Glycol (WG) mixture. The user must define the required functional properties of the modelled components; the pressure and temperature of working medium (NG liquid and vapour) were considered the properties of interest in this study. Additionally, the properties of the WG mixture include the flow rate and temperature of the respective fluid, as these are the main parameters that affect the delivered natural gas temperature. It is worth mentioning that more functions can be considered for some components, the operation of which is described by several types of flows. This can also be modelled in MADe™ as illustrated in Figure 3 for the case of the HP vaporiser, where two functions related with the LNG and WG solution inflows, respectively, were selected (‘Convert’ for the LNG inflow; ‘Regulate’ for the WG solution inflow).
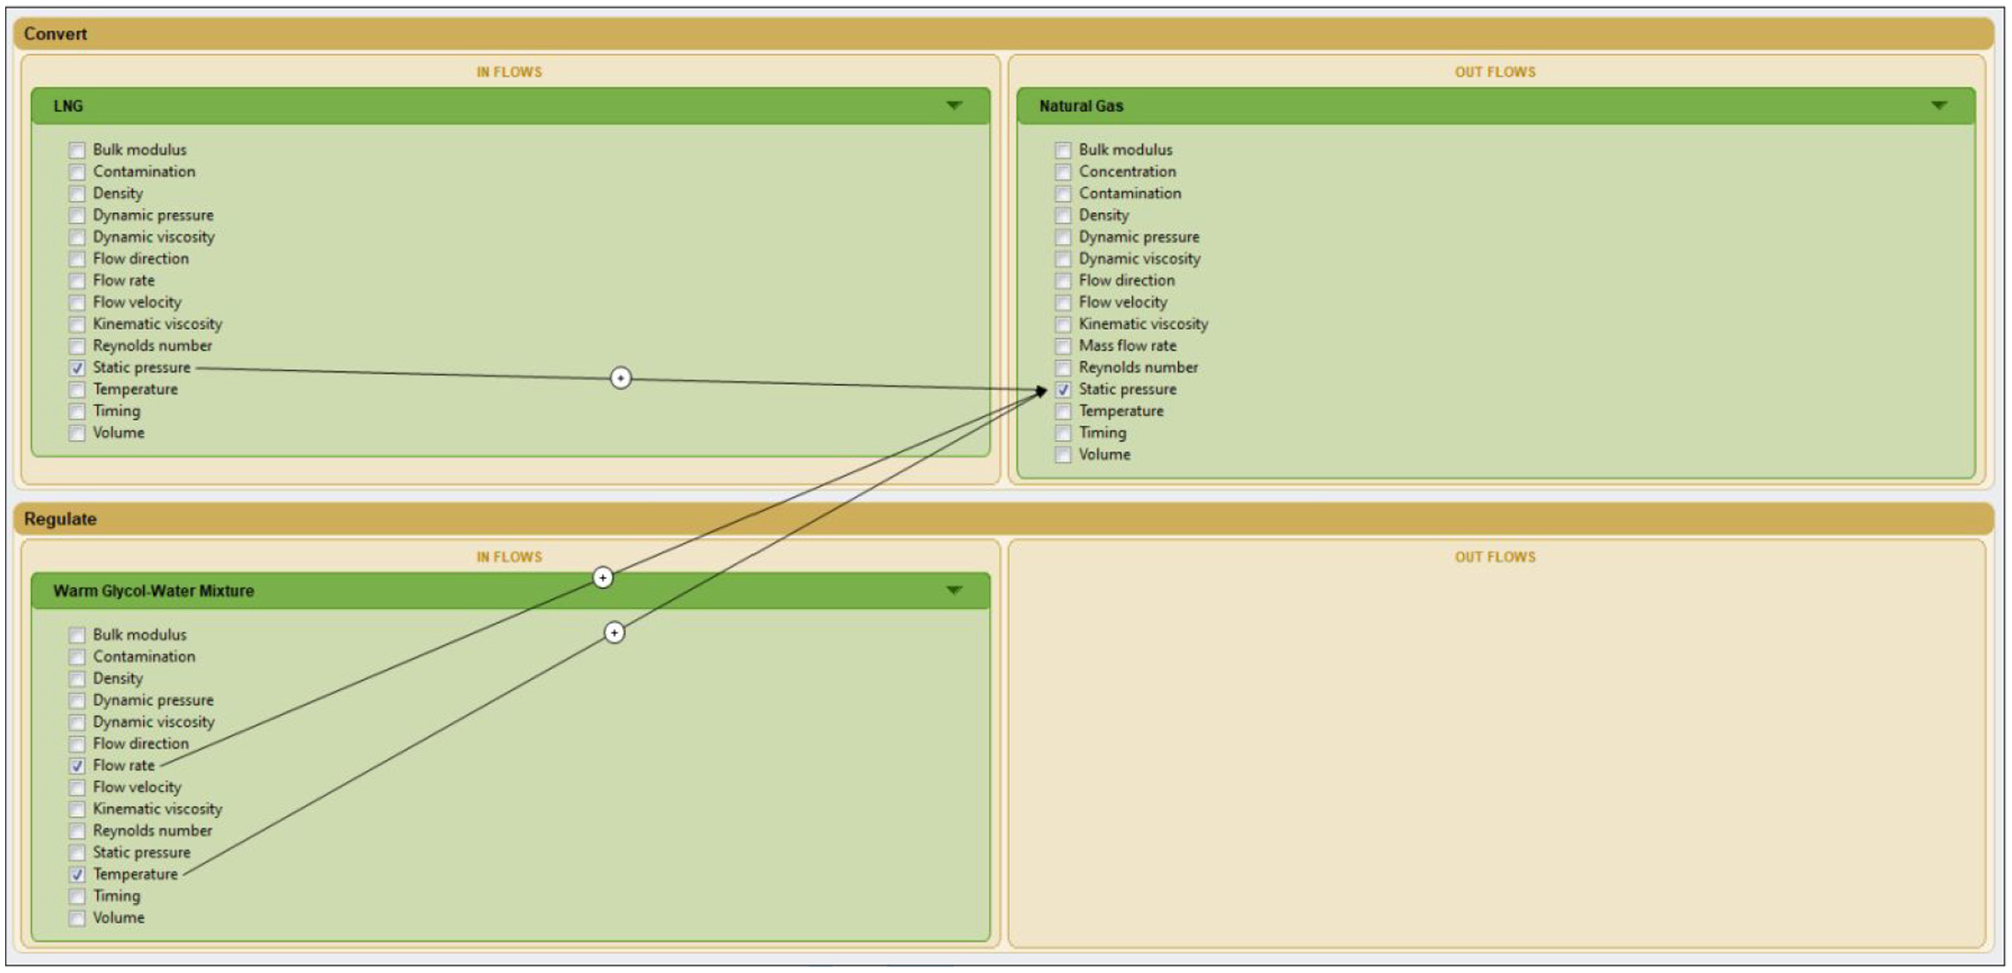
HP vaporiser functional properties.
Step 3: Functional model verification
Following the functional model development, a preliminary diagnostic analysis is performed that aims to reveal the system response to random failure injections. MADe™ provides the user the functionality to perform ‘What-if’ diagnostic simulations (which are qualitative), where failures are manually injected in the modelled components. By analysing the simulations results, it is revealed how the system reacts under failures and the degree of system readiness to them. Multiple failures can be studied simultaneously to identify the system response under extreme conditions. Moreover, through these tests the uniformity of the model is verified, that is, pressure/temperature drops across the system components of the model.
The injected failures cause a series of effects showcased as steps. A step table is then generated revealing all the affected components. The failure injections take place at the component level and consider the functions and functional properties that were defined in the developed system model. MADe™ can simulate ‘low’ or ‘high’ failures for each component that translate to unwanted events. The ‘low-output’ failure injections reflect the response of a components under either a leakage, blockage, or different malfunction, which may lead to inability to correctly regulate the fluid pressure or temperature, depending on the component.
Figure 4(a) depicts an example of a ‘low-data’ output failure injection imposed in the Pressure Feedback Control with ID 1.1 of the LNG tank assembly. Figure 4(b) displays the same failure propagation taking place in the subsystem of the LNG Submerged Pump Assembly with ID 1.1. The model simulates the effects of this failure on the other system components in the form of numbered steps. The immediately subsequent effect is on the LNG pump motor speed feedback control and is denoted with No. 2 in Figure 4(b). The end effect denoted with No. 11 in Figure 4(a) is a pressure drop or disruption of the natural gas supply.
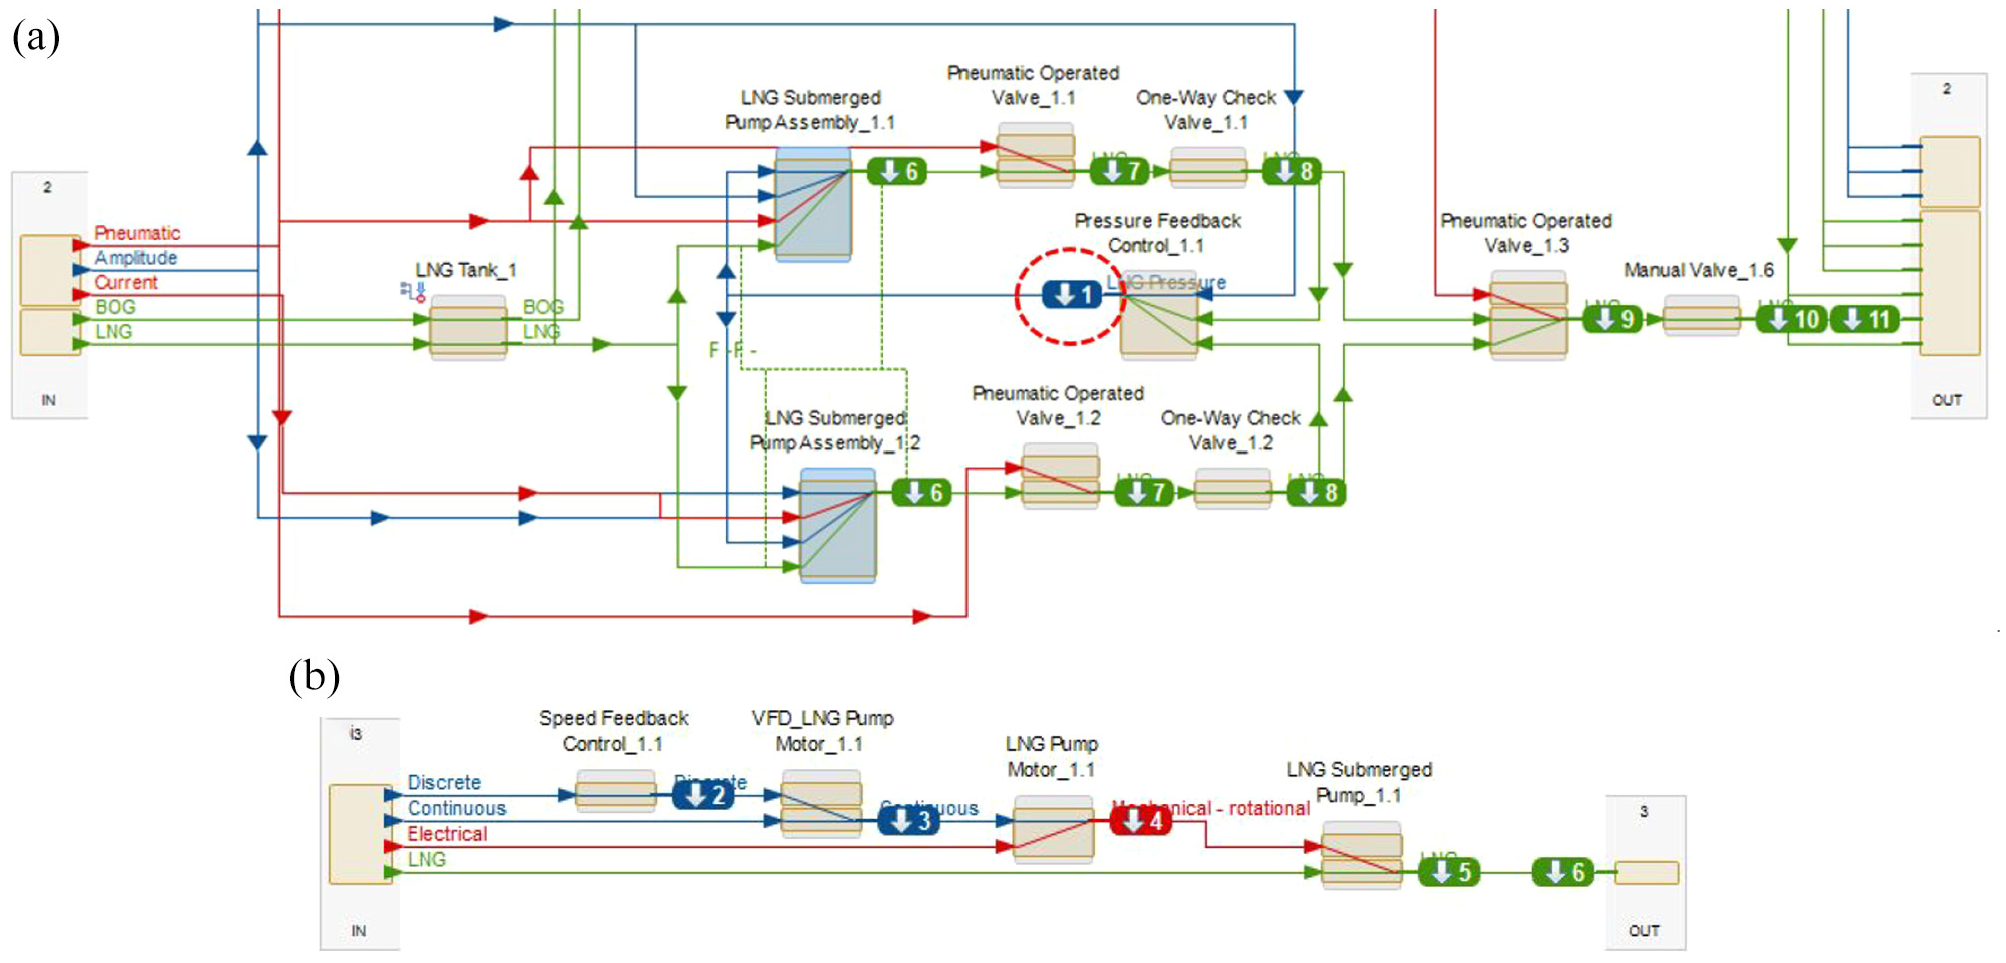
(a) low-Data Output Failure Injection and propagations on LNG tank assembly pressure feedback control with ID 1.1 and (b) propagation of Low-Data Output Failure Injection to LNG submerged pump assembly with ID 1.1.
Step 4: Failure diagrams development
The completion of the FGSS functional model leads to the initiation of the failure diagrams development. Failure diagrams map out the sequence of events leading to the component functional failure mode. These events include the series of mechanisms, causes, and faults, which ultimately lead to the failure of the component functionality. The available MADe™ failure propagation diagrams for standard components can be used, but user-specific failure propagation diagrams can be also developed.
The generated failure diagrams showcase the events leading to the component functional fault. Failure modes can either cause an increase or decrease of the component functional flow output, depending on the individual component. An example of the developed failure diagrams for the BOG compressor motor is depicted in Figure 5. According to this, all faults lead to the decrease in rotational velocity, which is translated to motor malfunction/failure.
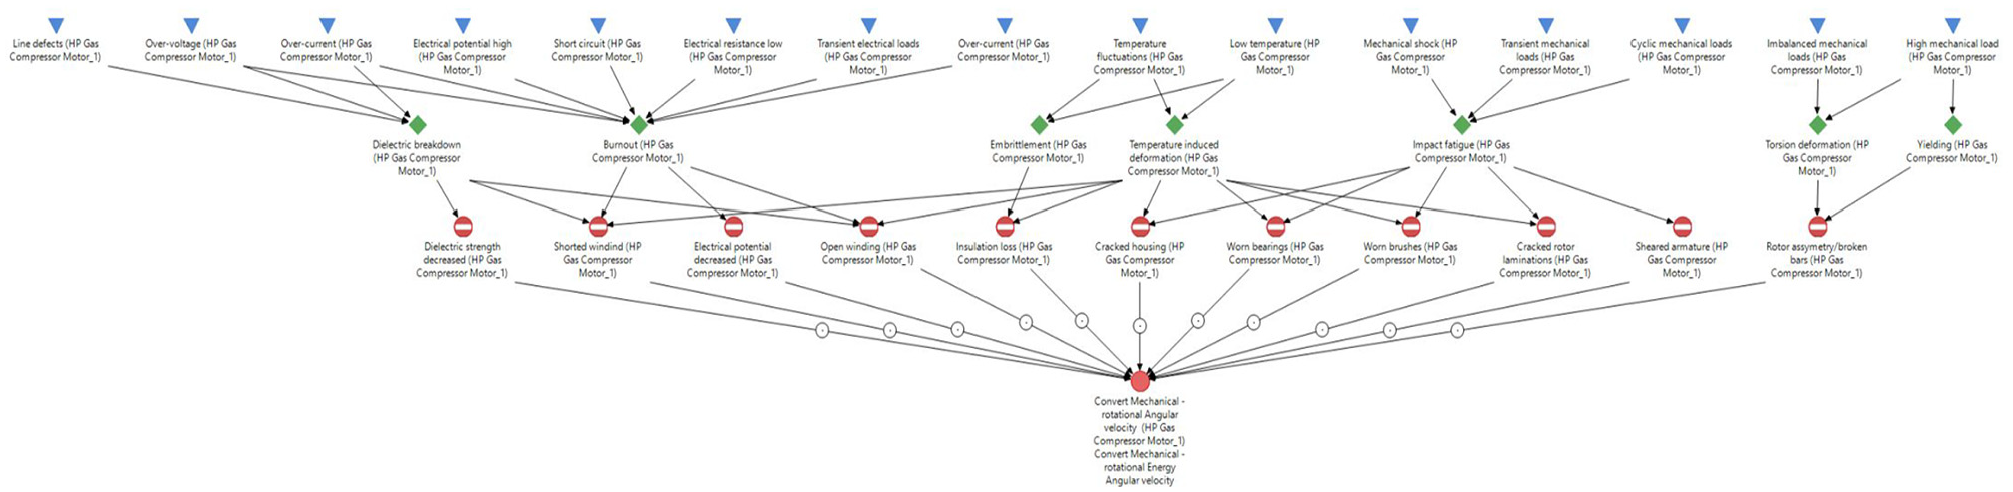
Failure diagram of BOG compressor motor in MADe™.
Step 5: FMECA development
In this study, FMECA is implemented with the support of MADe™ based on the developed functional model and failure diagrams. FMECA is generated by assigning to each component, a specific failure mode (for example, low natural gas temperature at the vaporiser outlet). Subsequently, a step table determines the propagation of the respective failure throughout the system based on the Fuzzy Cognitive Mapping functional model. The system critical components are identified through the FMECA table.
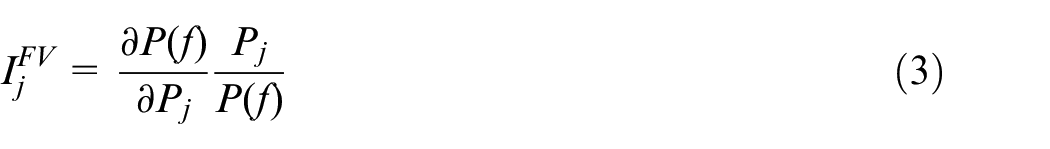
The Risk Priority Number (RPN) metric is employed to rank the components failure modes. 39 The RPN ranking is associated to the following advantages: (a) this metric is a well-established and widely acceptable in safety analysis; (b) its systematic and systemic nature is suitable for swift decision making on the system design alteration. 39 For each component’s failure mode, the RPN is evaluated from the multiplication of each failure mode occurrence (O), severity (S) and detectability (D), according to the following equation:

The values of occurrence (O) are derived based on the components failure rates (λ). The values of severity (S) and detectability (D) are estimated using the previous step results (findings from failure injections) and expert’s judgement. The rankings of ‘O’, ‘S’ and ‘D’ are based on the range 1−10, according to the scales reported in MIL-HDBK-338B. 14 FMECA studies 40 pertinent to marine systems were employed to adjust the RPN ranking criteria, when this was deemed necessary. Considering that the maximum values of ‘O’, ‘S’ and ‘D’ are equal to 10, the maximum RPN value is 1000.
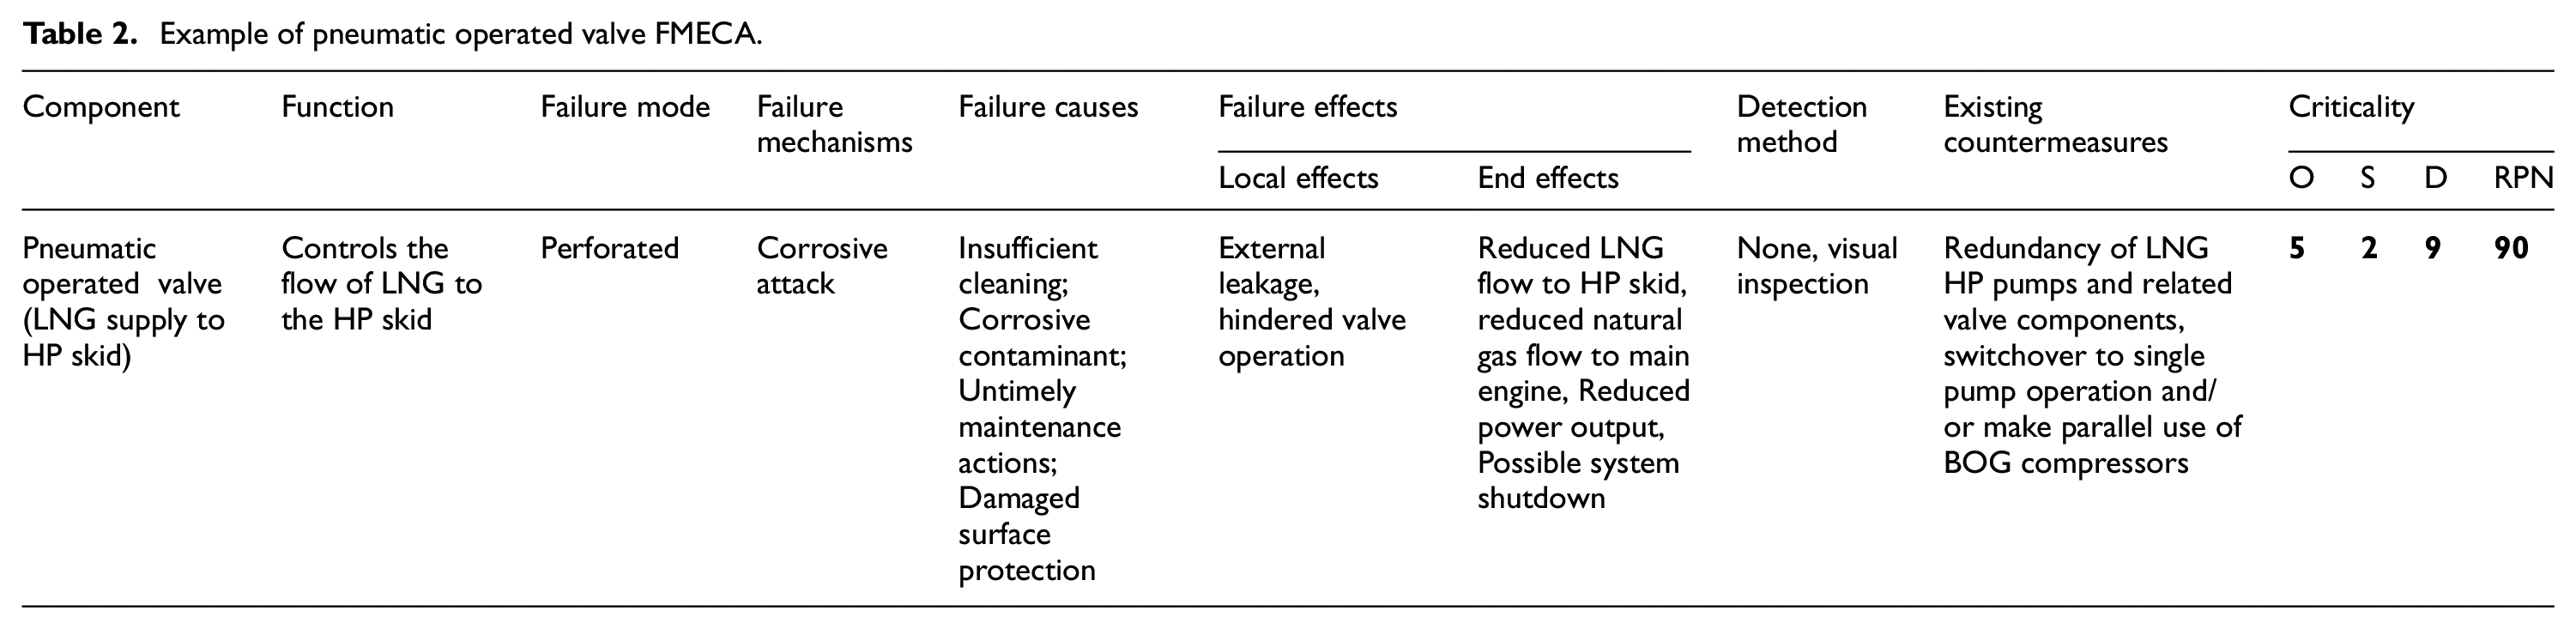
The user intervention is required to check and refine the FMECA tables, by adding information where required, for example, failure causes and effects. An example of the FMECA table regarding the pneumatic operated valve controlling the flow of LNG to the HP LNG pumps is provided in Table 2. It must be noted that two RPN values are calculated due to the presence of different failure severity categories.
Example of pneumatic operated valve FMECA.
Step 6: Fault Tree Analysis (FTA)
A Fault Tree (FT) uses the logical connections, which are graphically represented to describe intermediate or basic events connected by “OR” gates and “AND” gates, all leading to the top event. The top event is usually an undesired effect on the investigated system or a failure, and the FTA reveals the failure propagation that ultimately causes the top event occurrence. The modelled system Fault Trees are generated in MADe™ in an automatic way by employing the structure of the developed functional model including the faults (failure modes) defined in the failure diagrams as basic events, the system missions and the duration of each mission. The generated fault trees require refinement, up to an extent, to account for redundant and standby components, identical failures simultaneously occurring as well as other discrepancies between the model and the actual system.
The refined fault trees are used to calculate several safety metrics, in specific, the probabilities of the identified basic events and the top event P(f), which characterise the investigated system performance and thus, can be used to assess the safety performance of different system designs.
14
P(f) for the top and basic events are calculated by applying the specific calculation rules for the FT gates, employing the components failure rates as input. Furthermore, the Birnbaum (
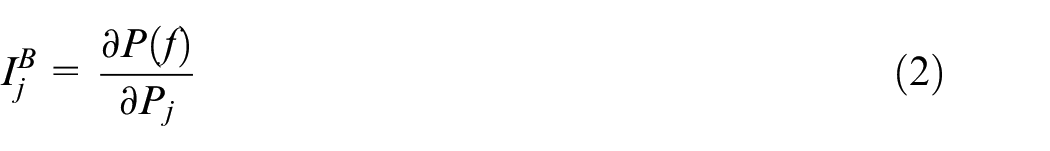
where
The FTA results are employed to verify the FMECA results, as the latter are linked with a certain degree of subjectivity. The importance metrics are also compared with the RPN derived by the performed FMECA to validate the corresponding findings. The probabilities of the top events and the RPN values are also employed to comparatively assess the safety performance of the investigated system proposed design alterations and quantify the obtained safety enhancement.
Step 7: System design improvement
Based on the FMECA and FTA results, design improvements are proposed to enhance the system safety performance and increase its availability. The following design alterations are investigated: (a) introducing additional redundancy for the identified critical components; (b) installing sensors in specific system locations; (c) modifying the system design by altering the architecture and interactions; (d) using additional other types of components; (e) combinations of (a) to (c). The addition of redundant components affects the severity of each failure, whereas the additions of sensors only affect the detectability of the failure. Thus, the latter were not accounted for in the FTA, but were included in the FMECA to calculate the RPN.
The functional model of the baseline system was modified to represent each alternative system design. Subsequently, the corresponding FTs are generated and refined, which are then employed to calculate the probabilities of the top events and the importance metrics for each alternative design. Furthermore, the FMECA tables were updated for the alternative designs, leading to the calculation of the RPN ranking. Finally, the calculated metrics (probabilities of the top events, importance metrics and RPN) are compared to assess the safety performance of the investigated system and its alternative designs, based on which, recommendations are proposed for the investigated design alterations.
Analysis input, assumptions and limitations
Input parameters
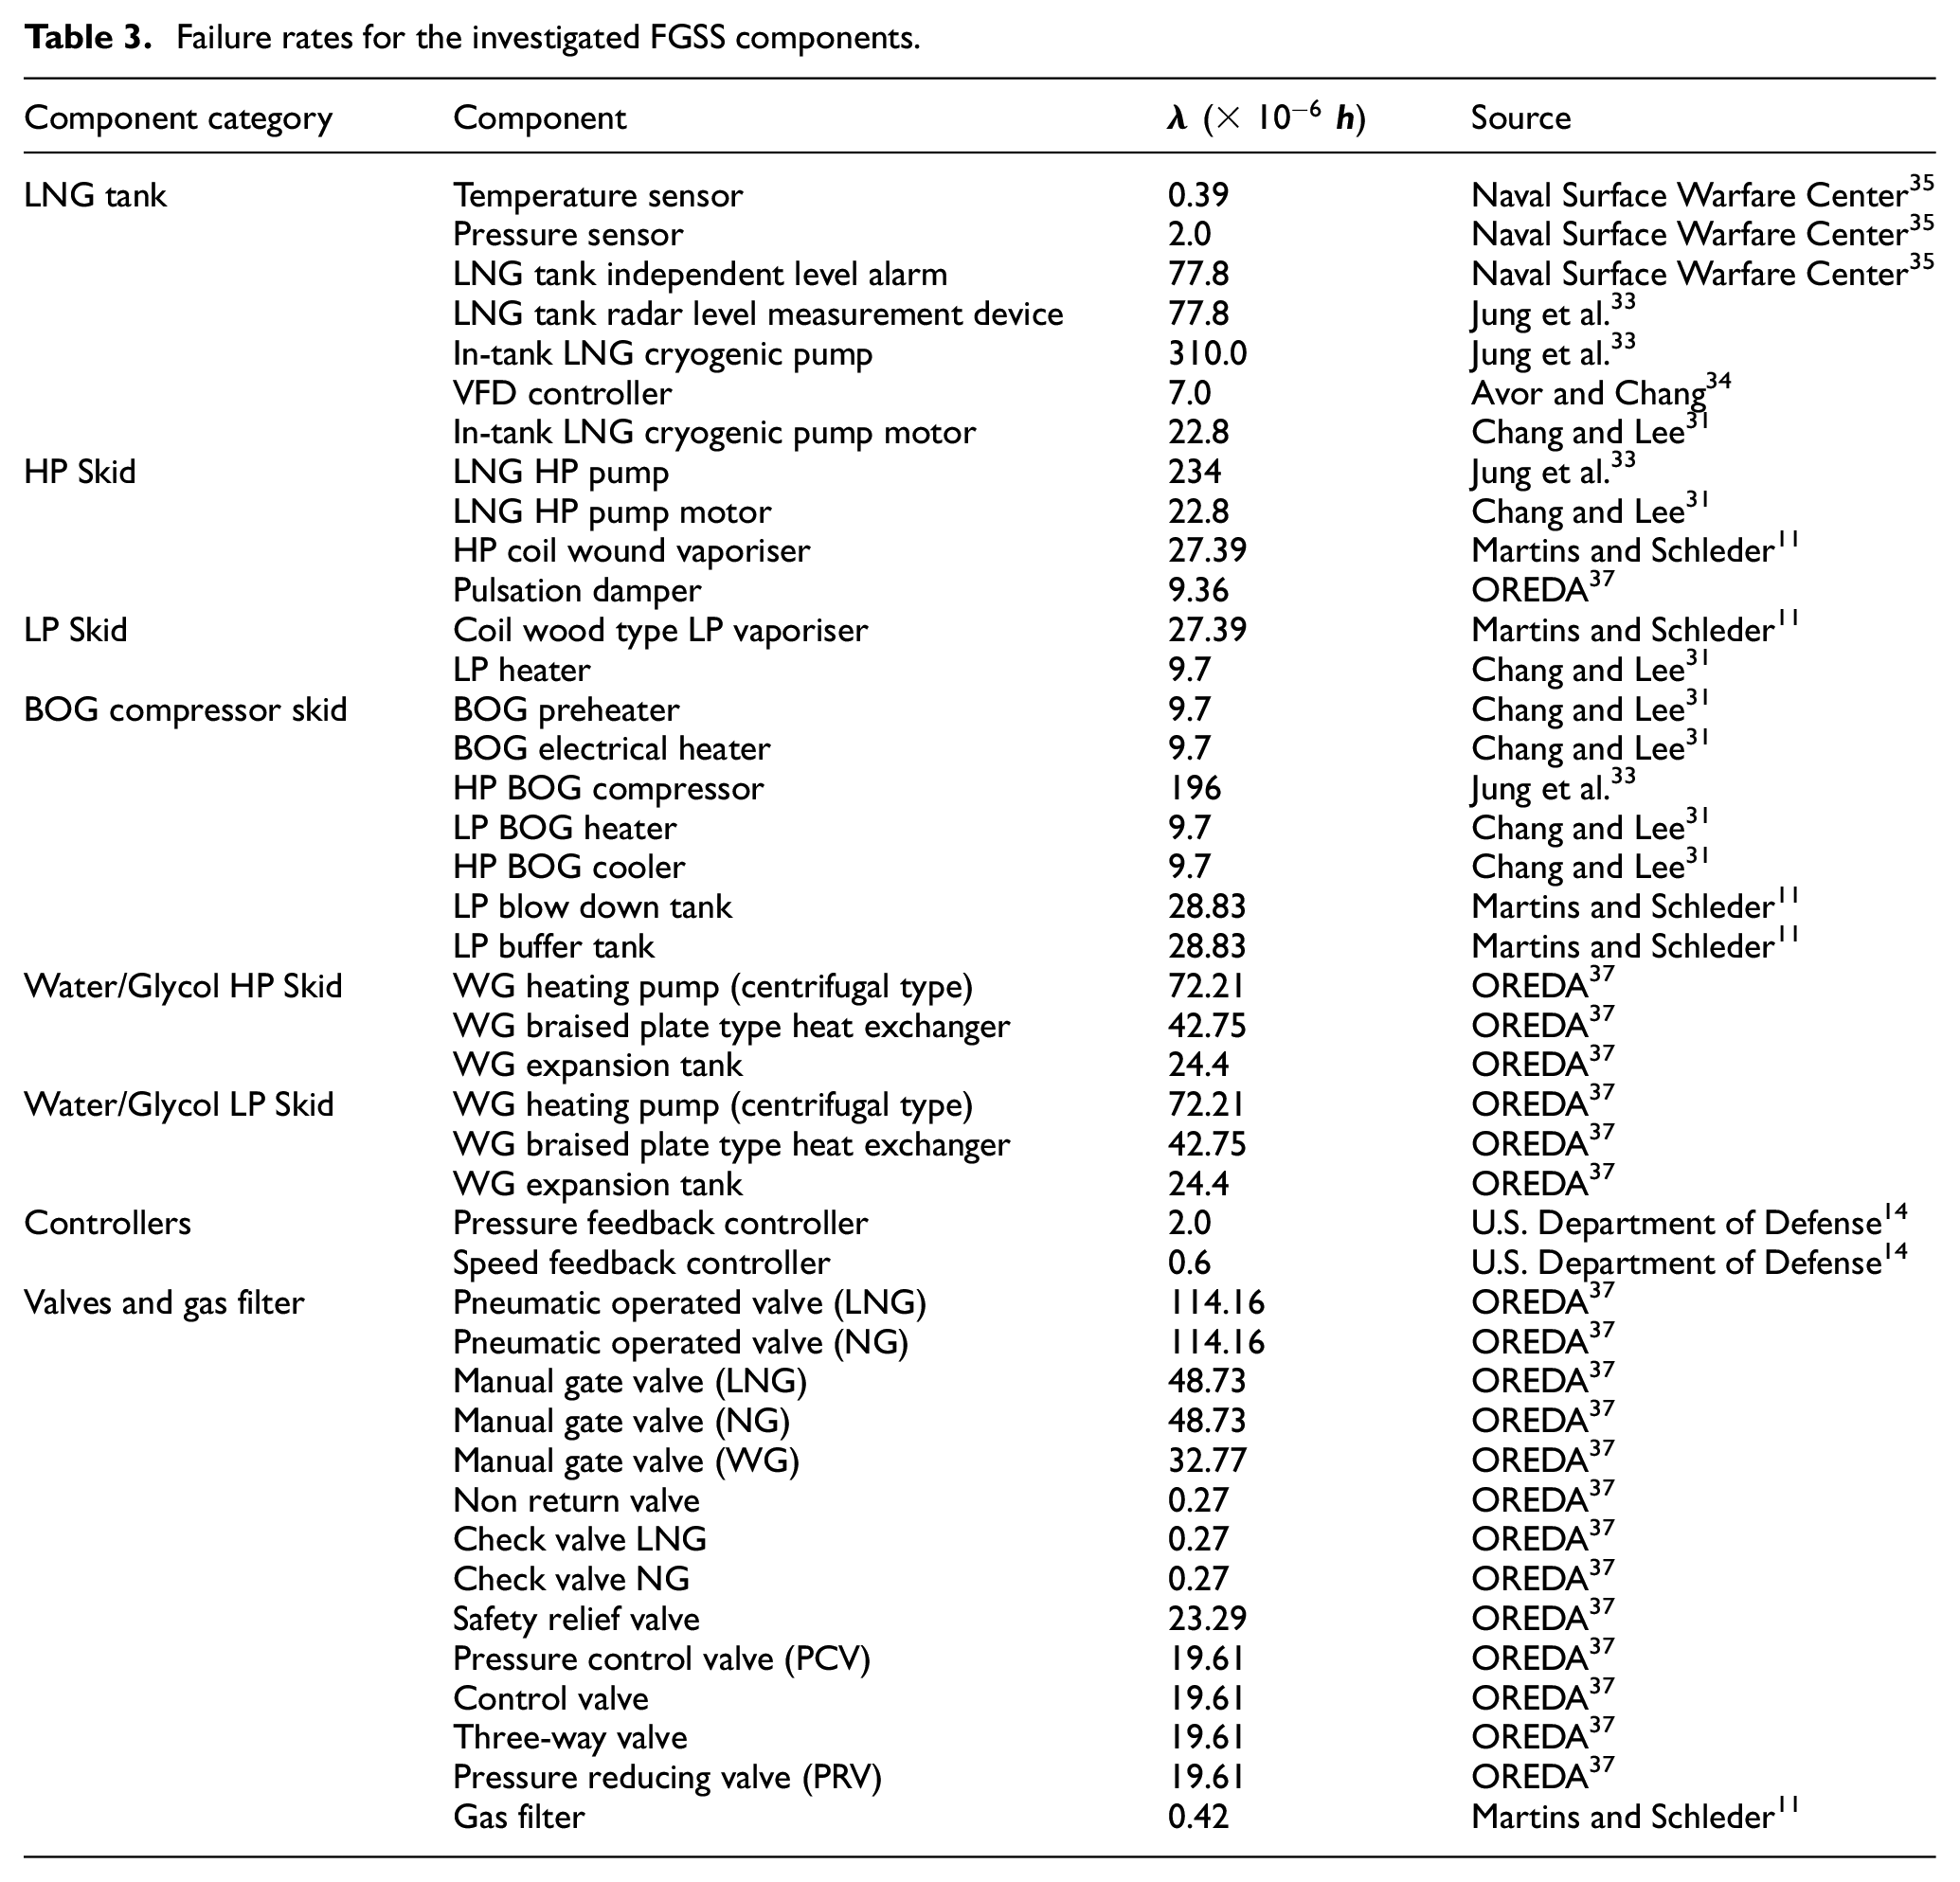
For carrying out the FMECA and the FTA of the investigated FGSS, the components failure rates are required. In this study, this data is identified by employing an extensive review of the published studies/reports. The employed herein failure rates along with the pertinent sources are provided in Table 3.
Failure rates for the investigated FGSS components.
Assumptions and limitations
Considering that the investigated LNG fuel feeding system is rather complex, it was necessary to limit the scope of the safety analysis by considering several general assumptions.
The following assumptions pertaining to the performed safety analysis scope are employed.
The LNG fuel system is studied in terms of its ability to supply natural gas to the consumers at the specified pressure and temperature.
Faults leading to gas leakages are not prioritised, as they are extensively covered in the most recent regulatory framework by the IGF code.
The present analysis focuses on hazards pertaining to the LNG fuel storage and feeding system design and operability, rather than human-related ones. This is done to maximise the investigated system availability by proposing design improvements that minimise risk and reduce the impact of potential failures.
Interactions with humans (undertaking the system operation and maintenance) are out of the scope of this study.
The external power sources, for example, the pneumatic or electrical power supply to the system components, are outside the analysis scope.
The control system failures (hardware and software) are not considered in this study.
The following assumptions pertain to the investigated system:
The LNG storage tank is designed to withstand a higher design pressure ensuring longer holding time as and pressure buffer during bunkering.
The BOG can be consumed by the ME, AE and the boilers ensuring sustainable BOG management at any point of time.
BOG supply to the ship ME ensures that the LNG tanks can be kept at a lower pressure prior to the ship entering the port or opearating at a mode that do not use the ME.
Pneumatic operated valves were considered as diaphragm valves for gas systems.
PCV, PRV, remote control valves and three-way valves were considered to be process control valves.
Non-return valves were considered check valves for gas systems.
Speed feedback controls were considered to employ switches working on the hall effect principle.
Pressure and temperature sensors monitoring the liquid and vapour flows are installed at the tank outlet, downstream the heat exchangers/vaporiser and upstream the consumers.
Accumulators and expansion tanks have pressure sensors.
Clogs, wear, and other component malfunctions can only be observed through a visual inspection or a disruption in natural gas supply to the consumers.
The following assumptions pertain to the performed analysis:
Due to the lack of relevant data, the occurrence likelihood is considered the same for all the failure modes of each system component.
An RPN threshold of 100 is employed to describe a safe system as proposed in Animah and Shafiee. 43 The system components exceeding the RPN threshold are flagged as critical.
As FMECA is linked with a certain degree of subjectivity, components with RPN ∈ [85,120] were carefully studied before marking them as non-critical or critical, respectively.
For simplicity reasons, one tank was modelled in MADe™ to capture the effects of the employed pumps and valves failures. Moreover, the LNG assembly is considered standalone, as it already contains redundant components, and the failure effects are ranked accordingly.
Valve failures can either cause a reduced or disrupted flow.
Vaporiser and heat exchanger failures can only lead to flow disruption.
The detectability of each failure mode is ranked based on the ability of the control system to capture all the hazardous scenarios that lead to system shutdown.
Sensors do not have self-diagnosing capabilities; therefore, a sensor failure will not be captured before the failure effects take place. Hence, these failures are hazardous and occur without warning, whilst the control system will detect them.
The respective probabilities of failure, P(f), are calculated by considering a time horizon of 1 hour, which was selected to simplify the calculations and facilitate the comparison of the derived results with corresponding data from the pertinent literature.
Most of the component functional properties employed in this study include the pressure and temperature of the working media (natural gas in liquid or vapour form). This implies that the system can be studied in terms of its ability to supply natural gas to the consumers at the correct pressure and temperature.
Results
Step 2: System functional modelling
The overview of the functional model developed in MADe™ for the investigated FGSS is depicted in Figure 6(a). This functional model includes the submodels of the identified subsystems, in specific, the LNG tank assembly, the HP skid, the LP skid and the BOG handling. To simplify the functional model of the complete system, only one LNG tank assembly was modelled. The developed model is presented in Figure 6(b), which also illustrates the assembly modelled components. The failure effects from a faulty component of the first LNG Tank can be employed to reflect the presence of the second LNG Tank.
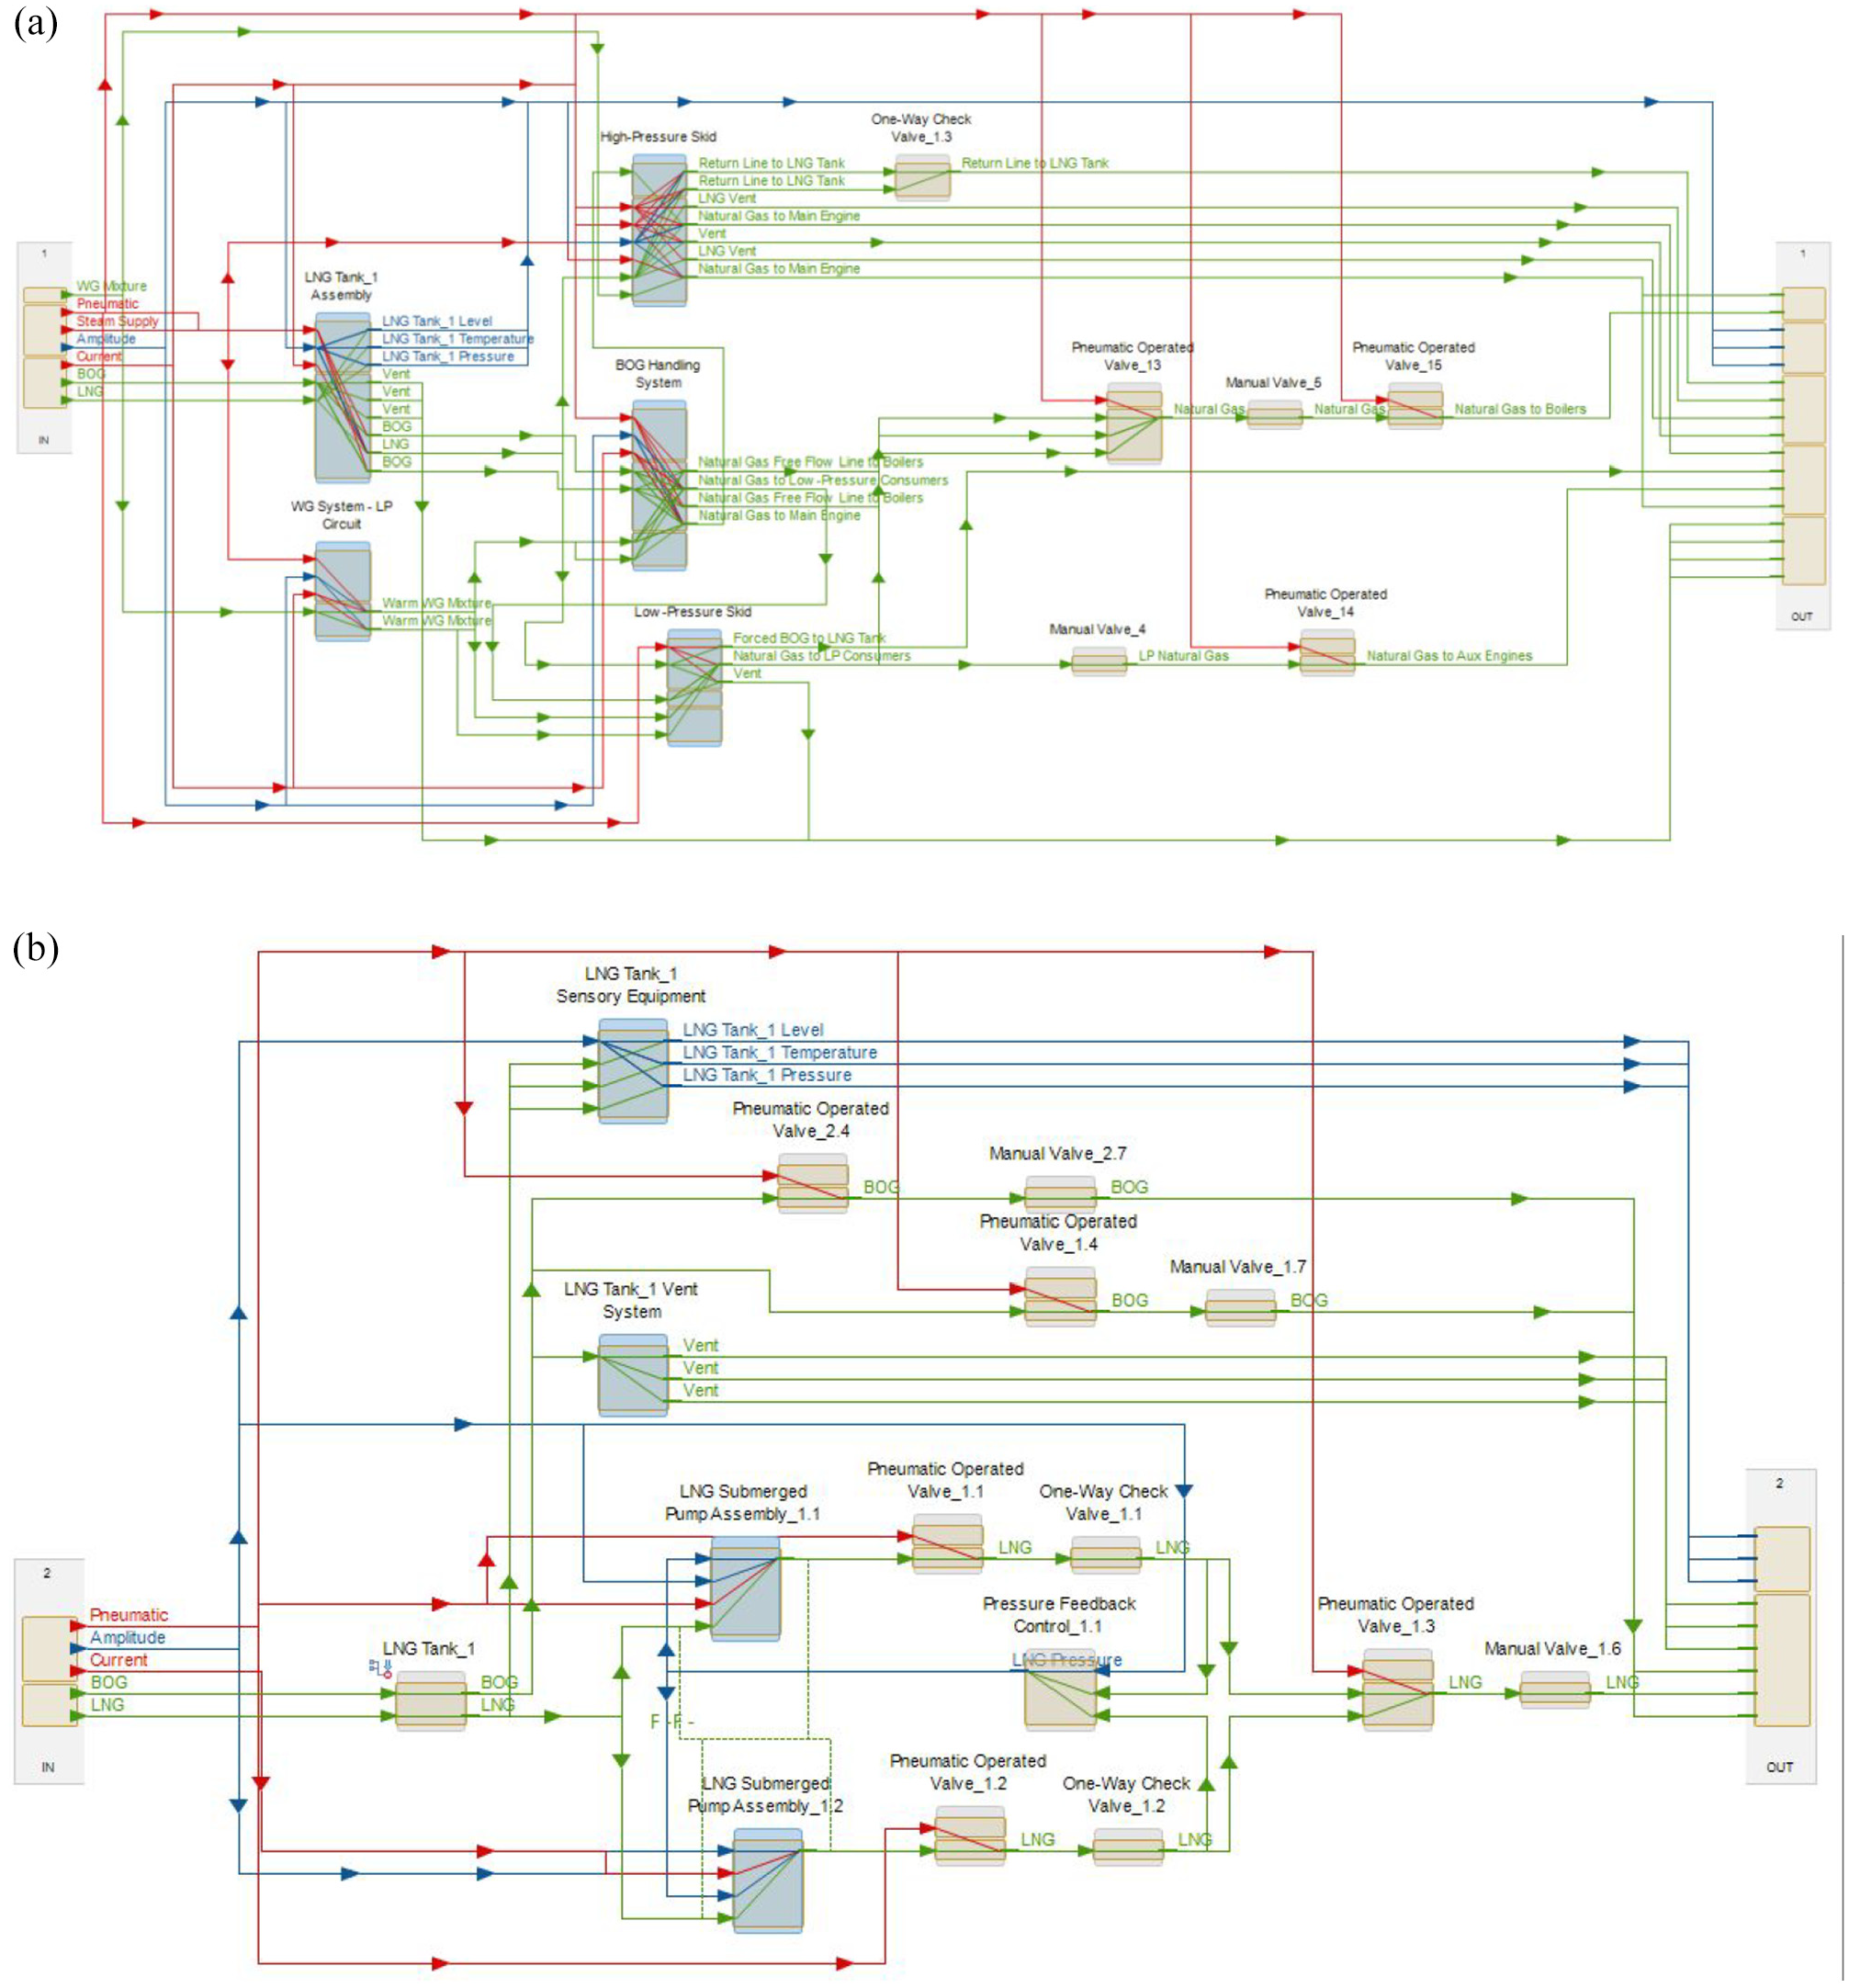
Investigated FGSS functional modelling in MADe™: (a) complete FGSS model and (b)LNG tank assembly subsystem model.
The showcased functional model includes blocks representing the subsystems (assemblies) as well as single components. The green lines represent transfer of material, the red lines denote transfer of energy, whereas the blue lines represent transfer of data. Data receivers transmit data to the receiving components (pump motors and valves) to control the transfer of the respective material. Worth mentioning is that the pneumatic operated valves were modelled as simple valves, where the flow is regulated via the introduction of compressed air from an external source. The external source (i.e., air supply system) was not studied, as it was out of the scope of the analysis. The air supply to the valve is depicted as the red lines leading to the respective valves.
Step 3: Functional model verification
Figure 7 illustrates the failure propagation table generated from the performed failures injection process. Multiple simulations (with various failure injections) were conducted in various system components and at different phases of this study, as a method to validate the results. Figure 7 depicts the propagation of the failure injection Low-Data Output on Pressure Feedback Control with ID 1.1 that takes place in the LNG Tank Assembly with ID 1. The symbol “i” denotes the simulation time step. Cells containing the value “−1” denote the time step and the affected component, which will exhibit the pressure reduction (due to the injected failure). For the performed simulations with different failures, it was concluded the developed functional model provides an accurate depiction of the investigated FGSS and that the involved redundancy functions as intended.
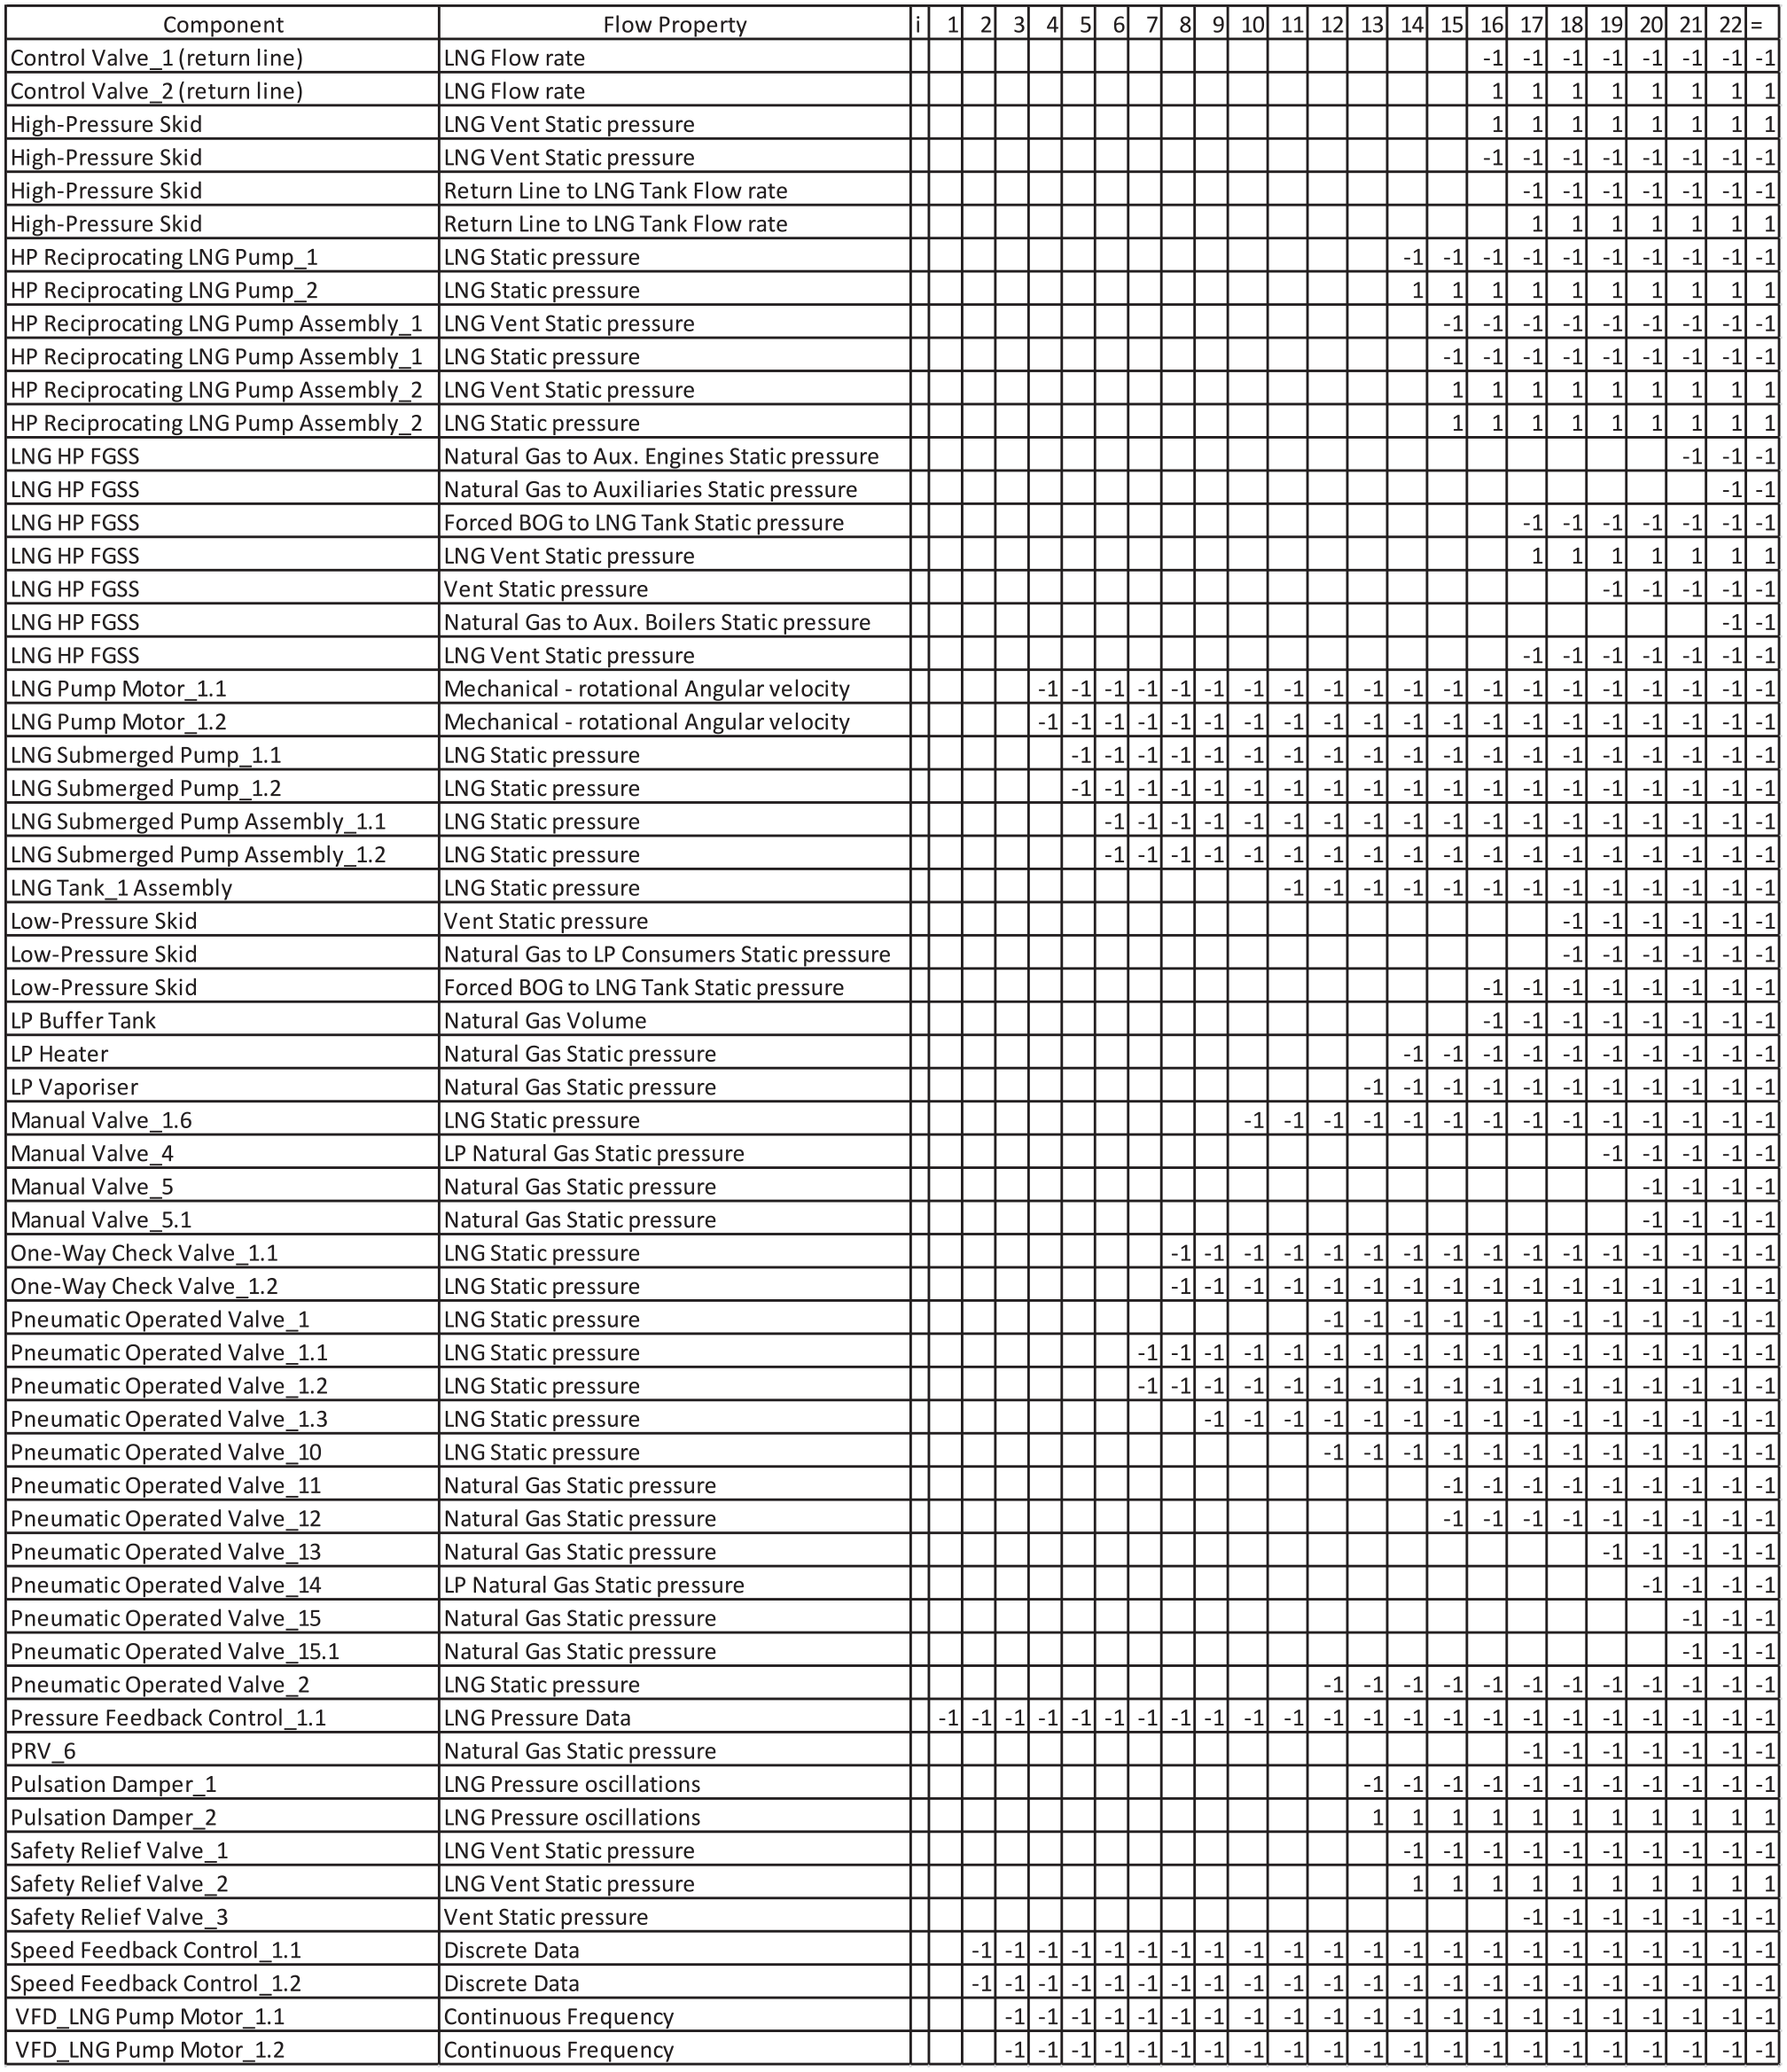
Propagation Table of Low-Data Output Failure Injection on LNG tank assembly pressure feedback control with ID 1.1.
Step 4: Failure diagrams development
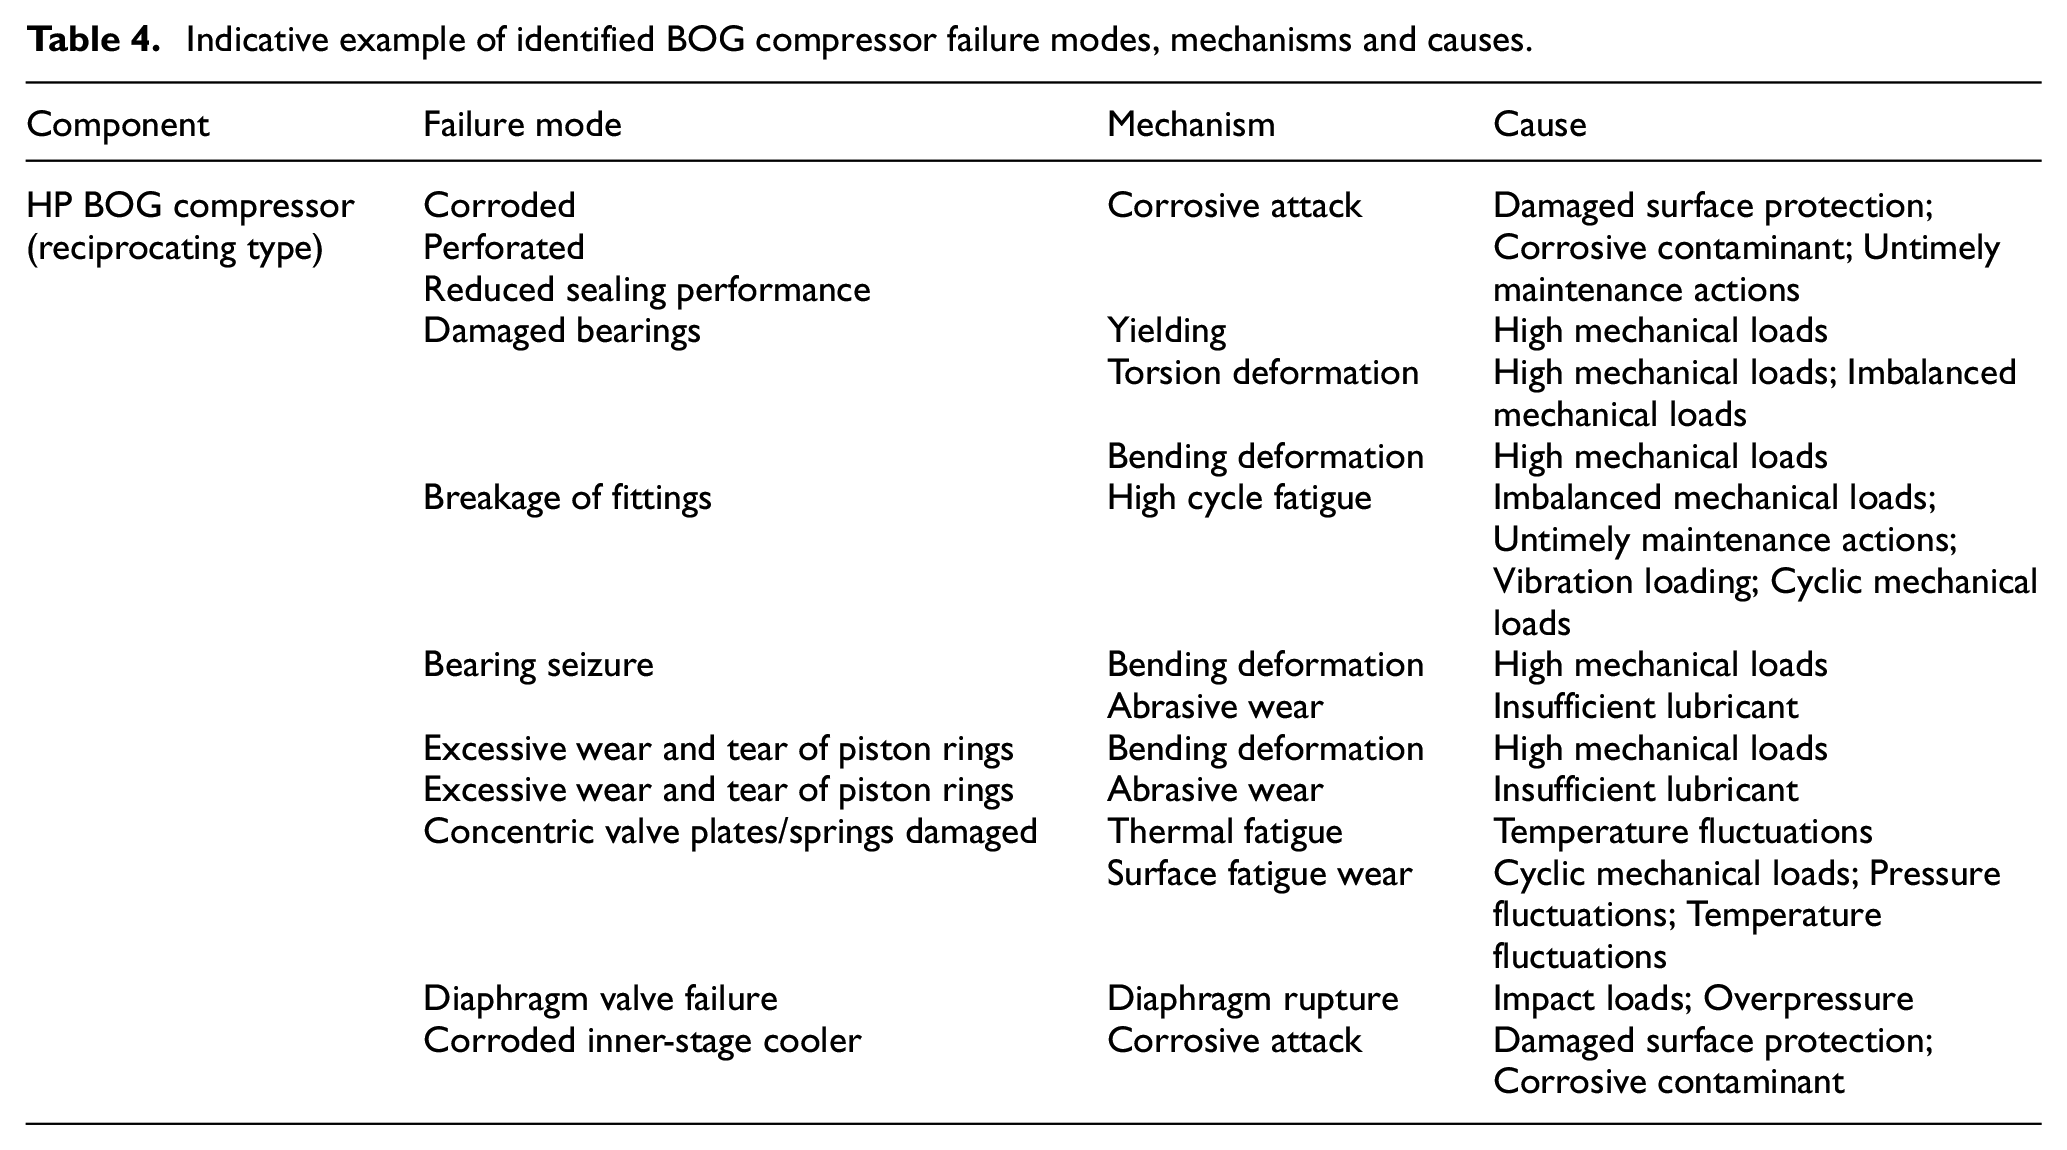
Failure diagrams were developed for 39 individual components and employed to represent identical components present in the system. More than 1200 individual failure paths were identified, excluding the redundant components. Table 4 provides the example for the BOG compressor failure modes, mechanisms and causes. Figure 8 illustrates the failure diagram for the LP BOG heater, whereas another example for the failure diagram of the BOG Compressor Motor was provided in Figure 5. The diagram of Figure 8 indicates that all the LP BOG heater faults lead to the unexpected decrease of the natural gas outflow temperature and pressure and consequently, the heater malfunction. It must be noted that the presented diagram indicates the “increase” of the LP BOG heater functions (in the bottom level), however these are connected to the respective failures with minus signs, thus, they result in decreasing the pressure and temperature.
Indicative example of identified BOG compressor failure modes, mechanisms and causes.
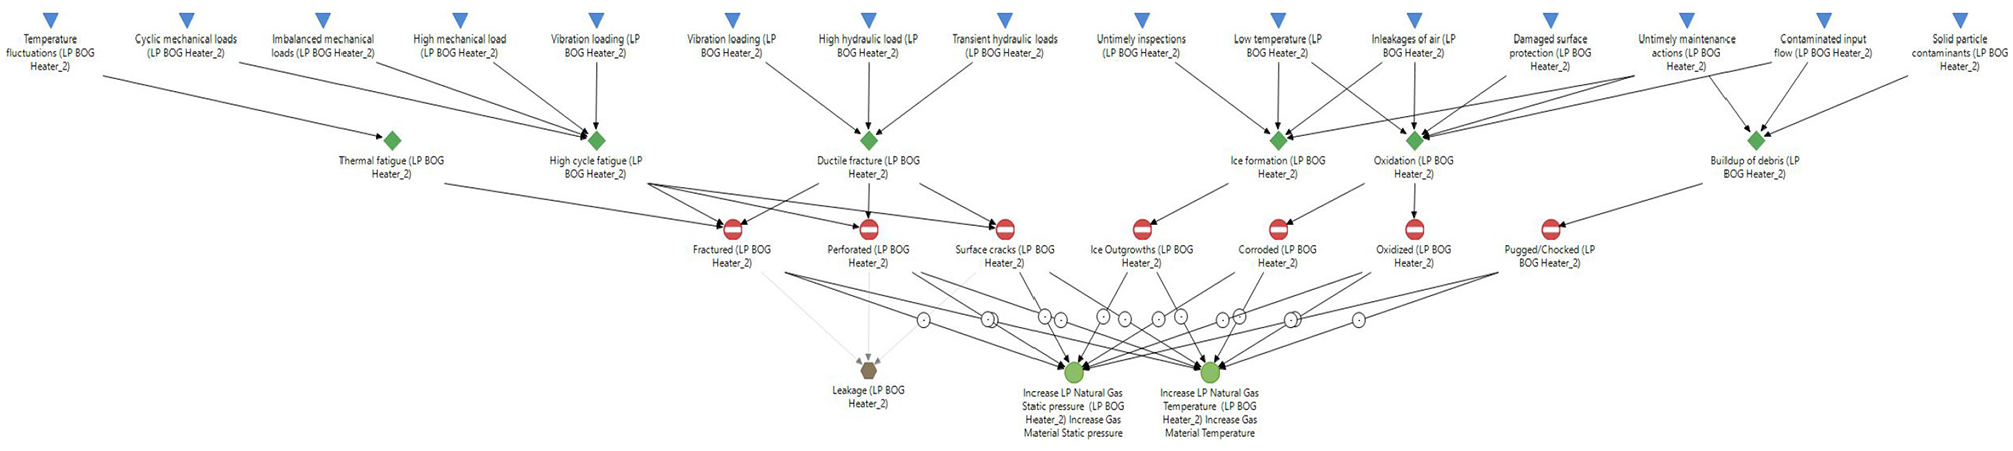
Failure diagram of the LP BOG heater in MADe™
Step 5: FMECA results
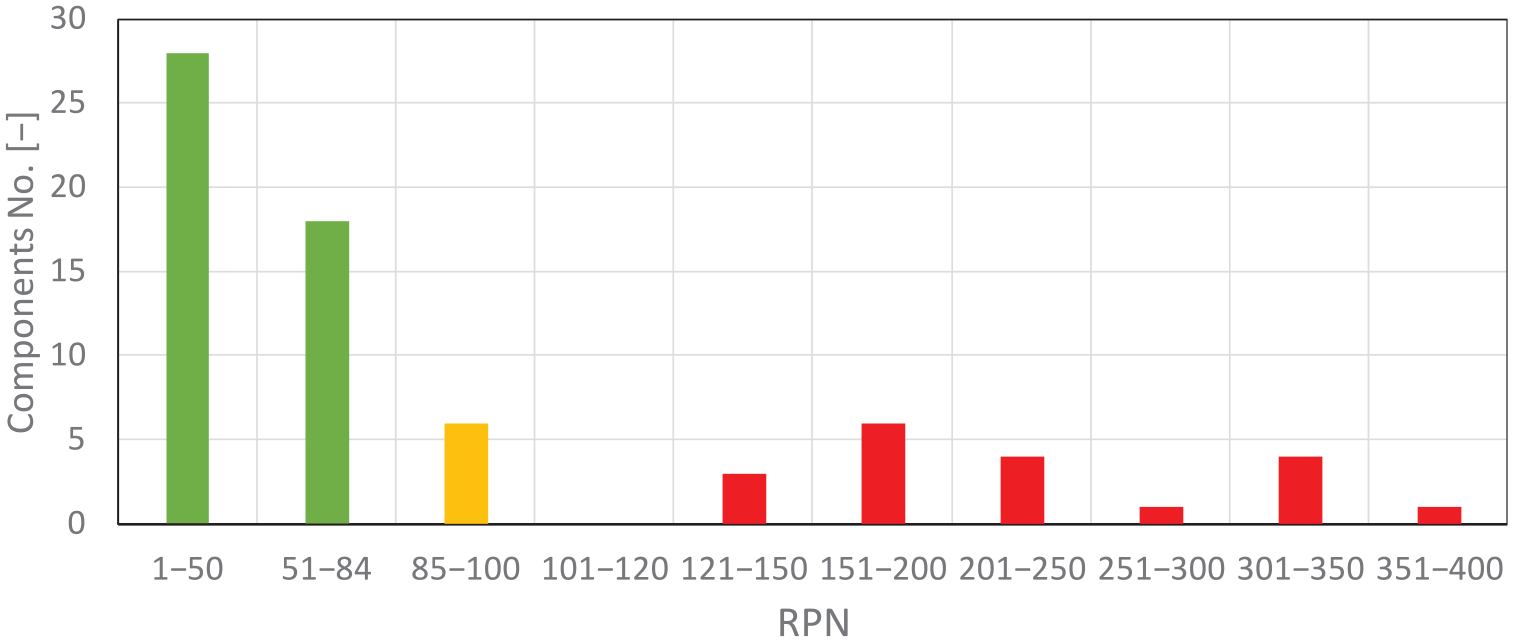
The critical components were identified through FMECA and were categorised according to the respective subsystem. Due to the sheer scale of the FMECA table and its confidential nature, the complete table is not included herein. Figure 9 presents the FMECA results in terms of components number against several RPN values ranges. Table 5 also provides part of the FMECA results in another format; the components that were found to be critical (RPN greater than 100) are illustrated with red colour, whereas the orange cells denote components with their RPN not exceeding 100, which however were selected for further investigation to address the FMECA results uncertainty (attributed to the FMECA subjectiveness).
FMECA RPN results−identified critical components.
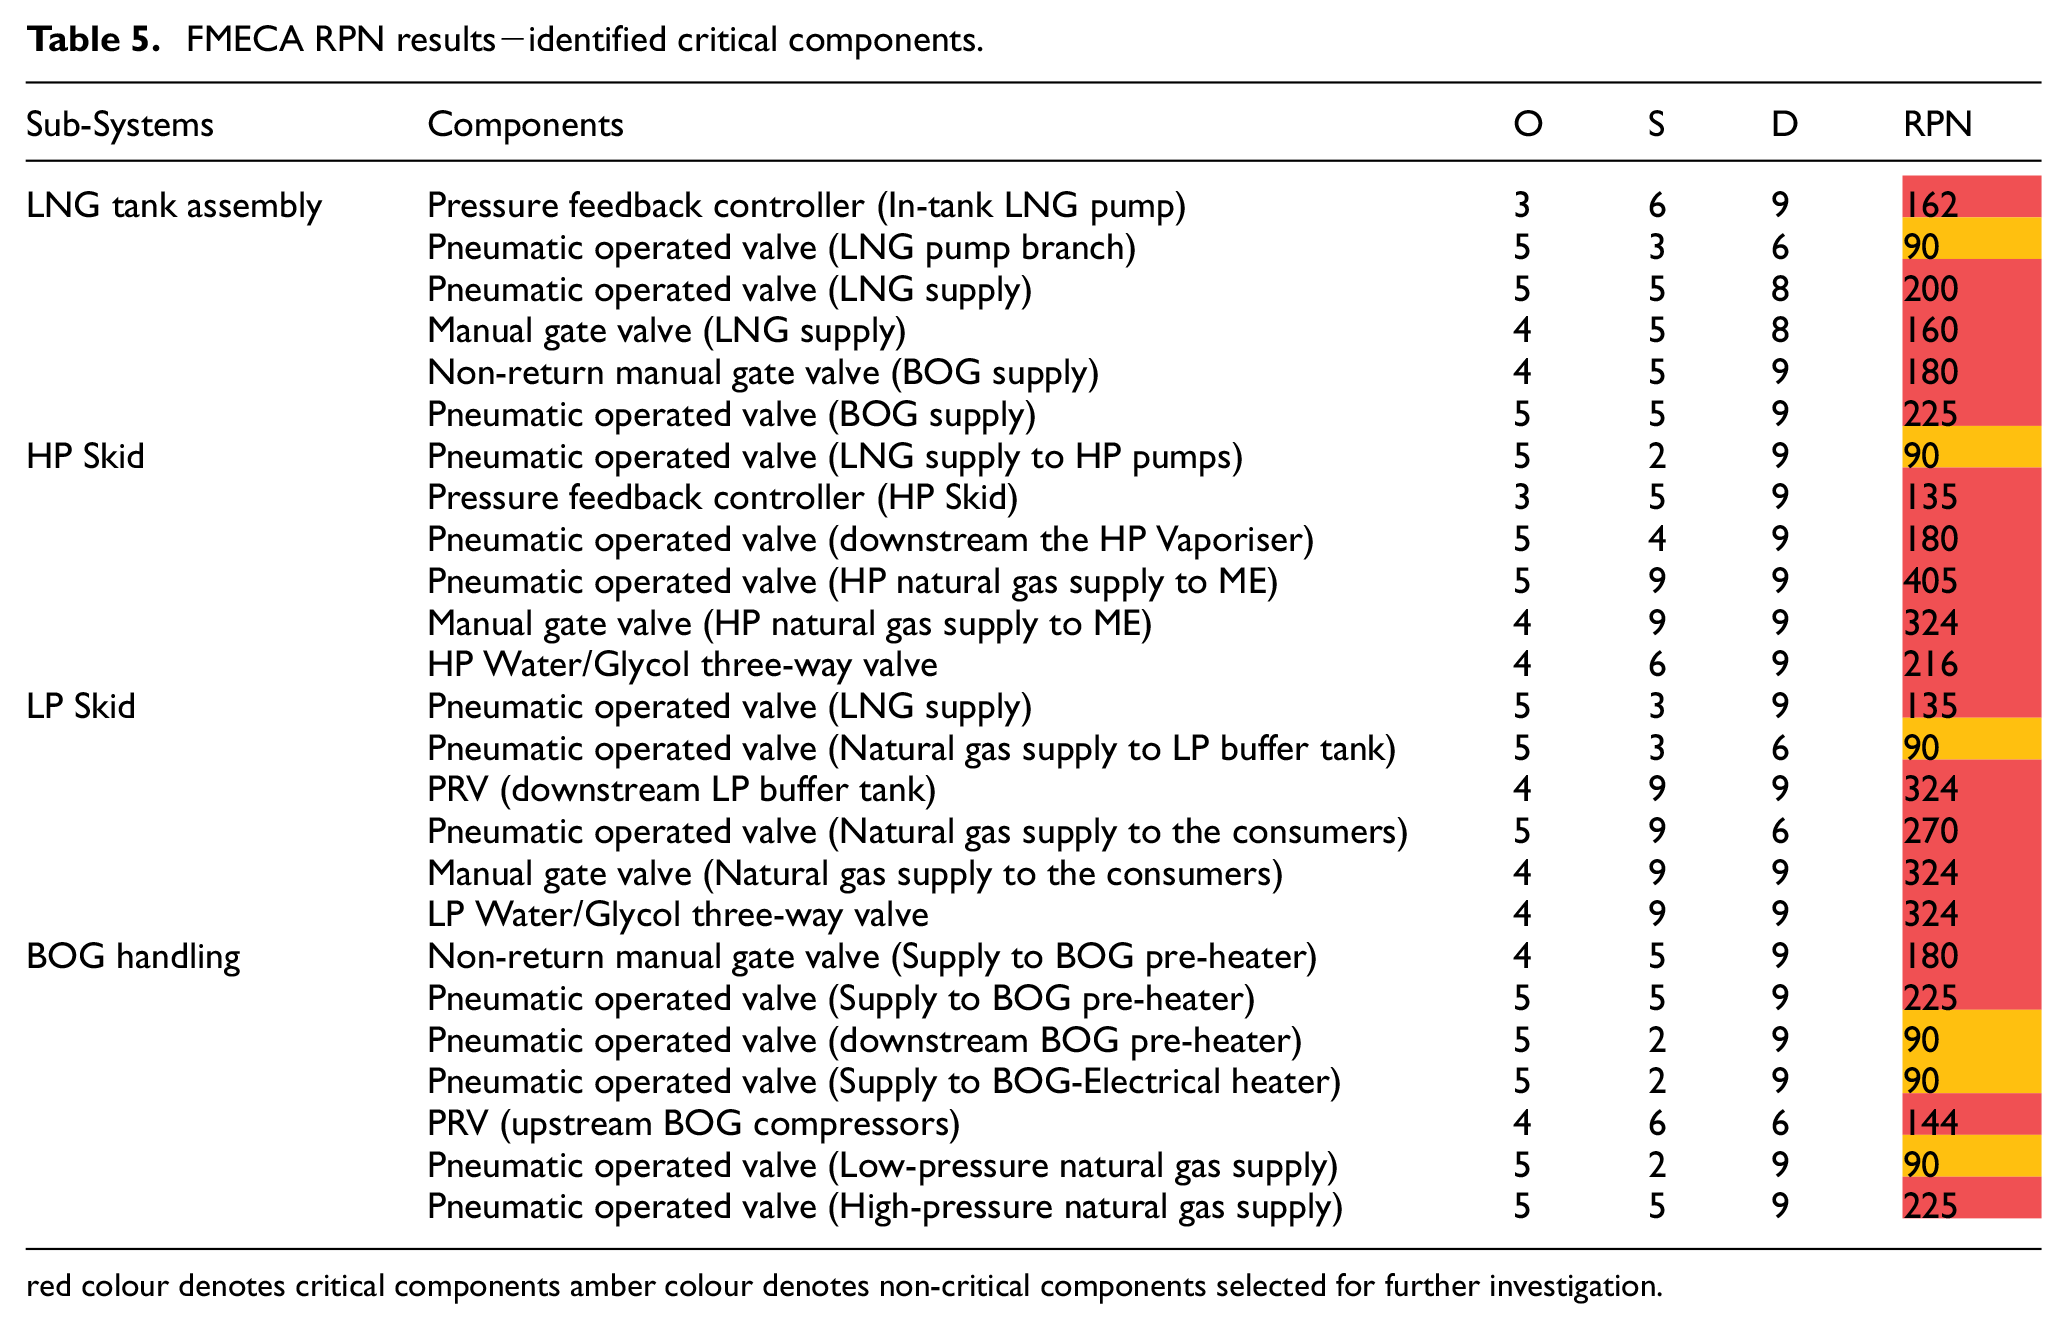
red colour denotes critical components amber colour denotes non-critical components selected for further investigation.
FMECA results.
The process valves and the pressure feedback controllers were identified as the most critical components. More specifically, these include the pneumatic and manual operated valves responsible for the supply of LNG and BOG as well as the components responsible for supplying gas to the consumers. Furthermore, the pressure feedback controllers for both the LNG tank assembly and the HP LNG pumps as well as the three-way valves for both the WG systems were found to be critical. The last identified critical components were the PRVs installed downstream the buffer tank and upstream the BOG compressors.
The pressure feedback controllers are critical due to the high severity of their failure and the high difficulty of the detection of these failures. A sensor erroneous measurement/signal can only be detected through the installation of redundant sensors or by using model-based observers for monitoring the system components. The cryogenic and non-cryogenic process valves are found to be critical due to their relatively high failure rate (attributed to the operating conditions as reported in Martins and Schleder 9 ) and high failure severity.
The derived results demonstrate that most of the components that lead to single-point failures are flagged as critical. Worth noting is that components with higher complexity and increased failure rates (e.g. the BOG compressors and LNG pumps) exhibit low criticality and risk, due to the increased redundancy in the investigated FGSS. In case of failure in most of the rotational equipment, a stand-by component is readily available to carry-over the required fluid supply.
Step 6: FTA results
Fault Trees were developed for the complete investigated FGSS to examine top events describing a holistic failure leading either to main engine or auxiliary systems shutdown. The following top events are considered: (a) disruption of the natural gas supply to the ship main engine; (b) disruption of the natural gas supply to the ship auxiliary engines, and; (c) disruption of the natural gas supply to the auxiliary boilers. These FTs were used to study the response of the system to failures when all the subsystems operate.
In addition, of fault trees for specific subsystems (HP skid, LP skid, BOG handling) were developed for the following top events: (a) disruption of the natural gas flow at the LP Skid; (b) disruption of the natural gas flow at the BOG handling assembly, and; (c) disruption of the natural gas flow at the HP Skid. This approach matches the FMECA, where the investigated FGSS is broken down to subsystems, and can be used to verify the impact of the failure effects in individual subsystems. The relative importance of the components is slightly different compared to the case considering the FTs for the entire system and reveals critical components that are not obscured by the presence of parallel subsystems.
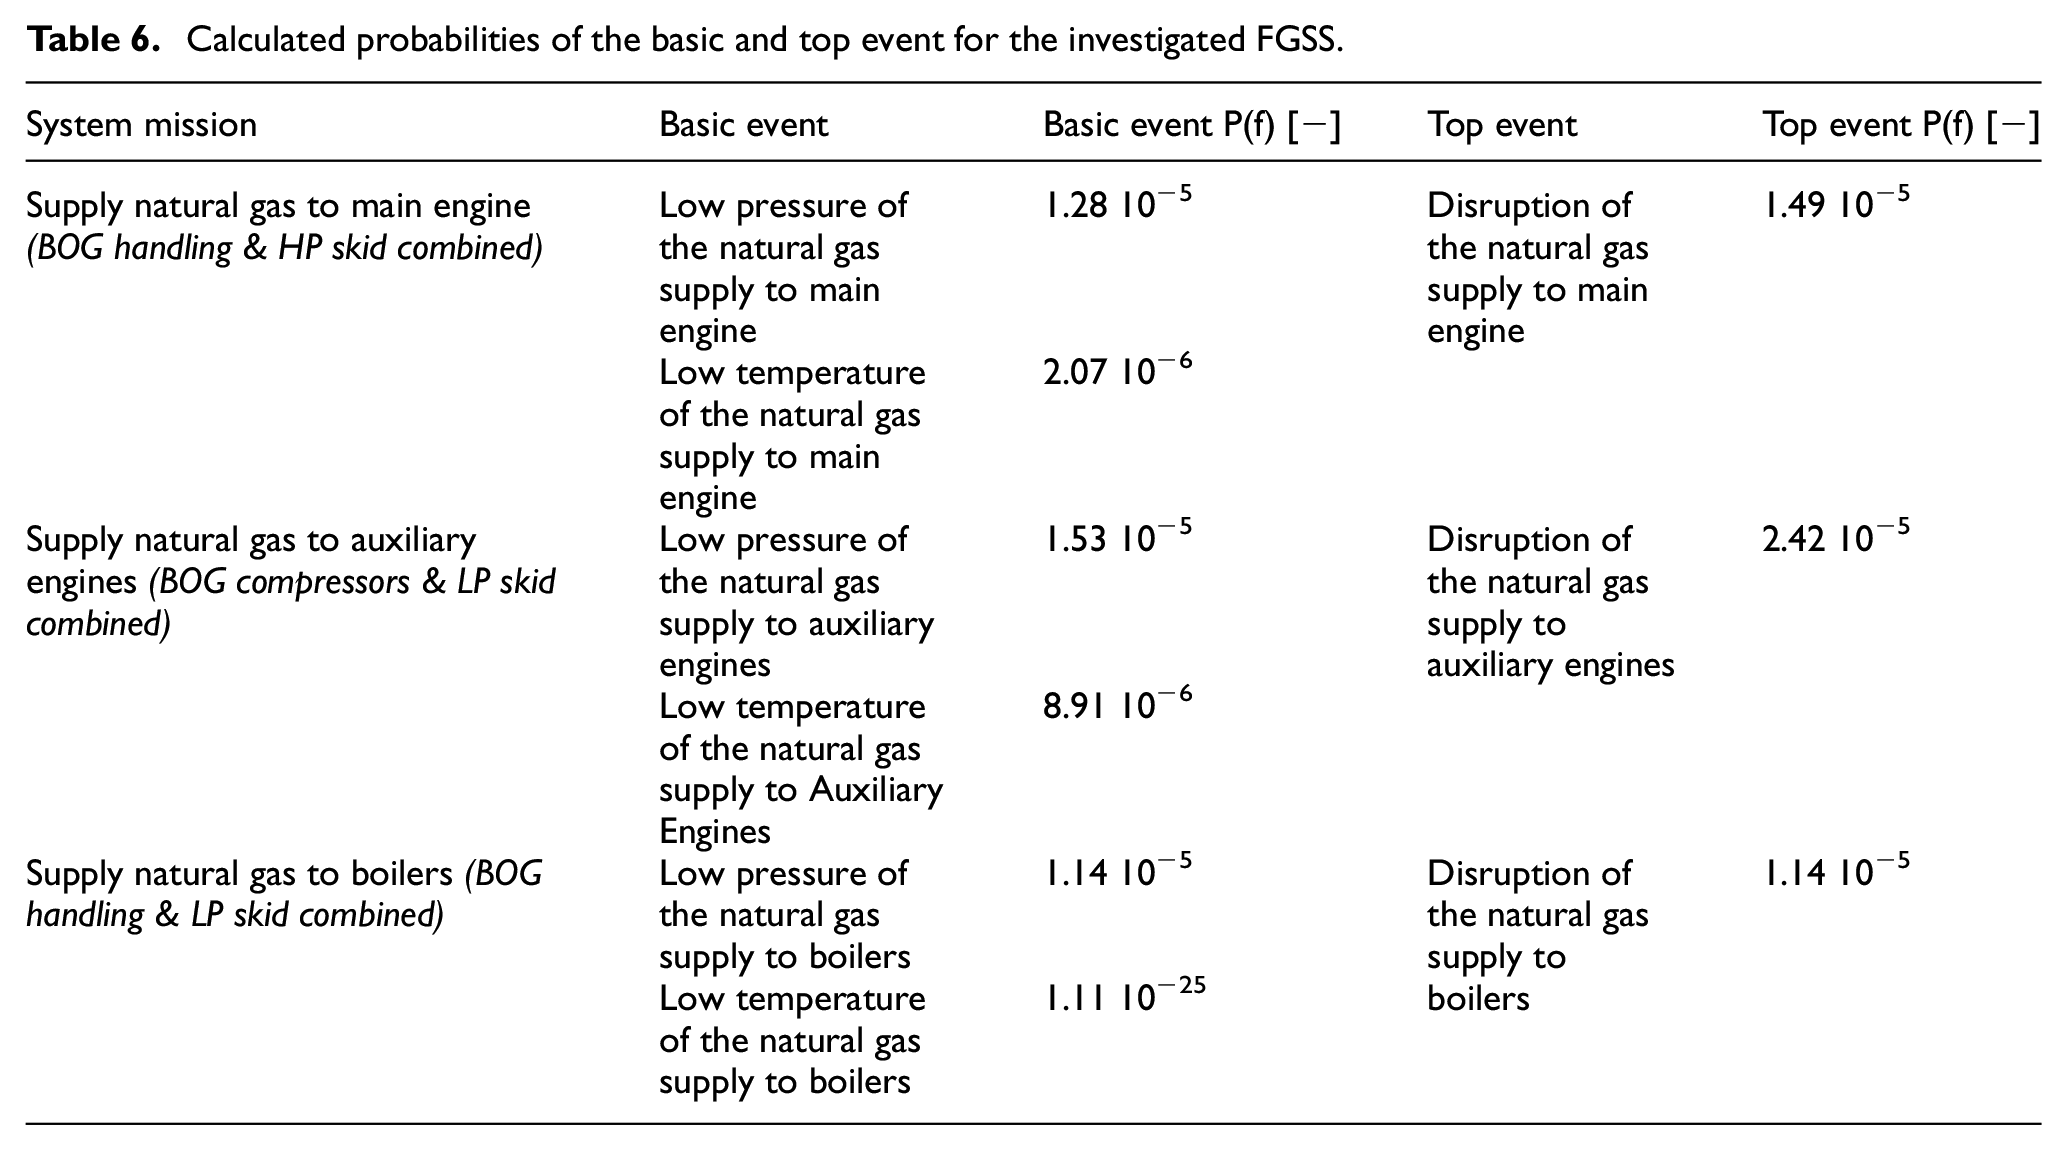
Figure 10 depicts the generated fault tree for the top event of the disruption of natural gas supply to main engine. To render this FT visualisation, ‘Transfer’ gates (denoted with triangular symbols) were used to represent FTs for the considered basic events. The disruption of natural gas supply to the ME is linked to either inadequate pressure or temperature of the natural gas supplies from the HP skid and the BOG handling system. The calculated probabilities of the considered basic events and the top events are presented in Table 6. It must be noted that these values only indicate the system response and can be used as reference for comparing alternative designs. It can be deduced from these results that the events pertaining to the temperature drop are less likely to occur compared to the ones pertaining to the pressure drop. The system components responsible for the LNG and NG pressure control include mostly valves and sensors, which indicates that such equipment is more susceptible to failures than components responsible for the temperature control (e.g., heat exchangers). Especially for the event of low temperature of the NG supply to boiler, the corresponding probability is seemingly insignificant, which is attributed to the high-level of redundancy and the existing alternative pathways to supply natural gas to the boilers. It is also deduced that the calculated probabilities for the HP branch (supplying gas to the main engine) and the LP branch (supplying gas to the auxiliary engines) are of the same order, however slightly higher values are calculated for the LP branch basic and top events. This is attributed to the design of each branch (failure rates of the respective components), as well as the slightly higher redundancy involved in the HP branch design. Lastly, the calculated probabilities values for the considered top events are in alignment with reported results from similar studies for conventional marine Diesel fuel feeding systems, which demonstrates that the investigated FGSS can satisfy the maritime industry requirements. 44
Calculated probabilities of the basic and top event for the investigated FGSS.
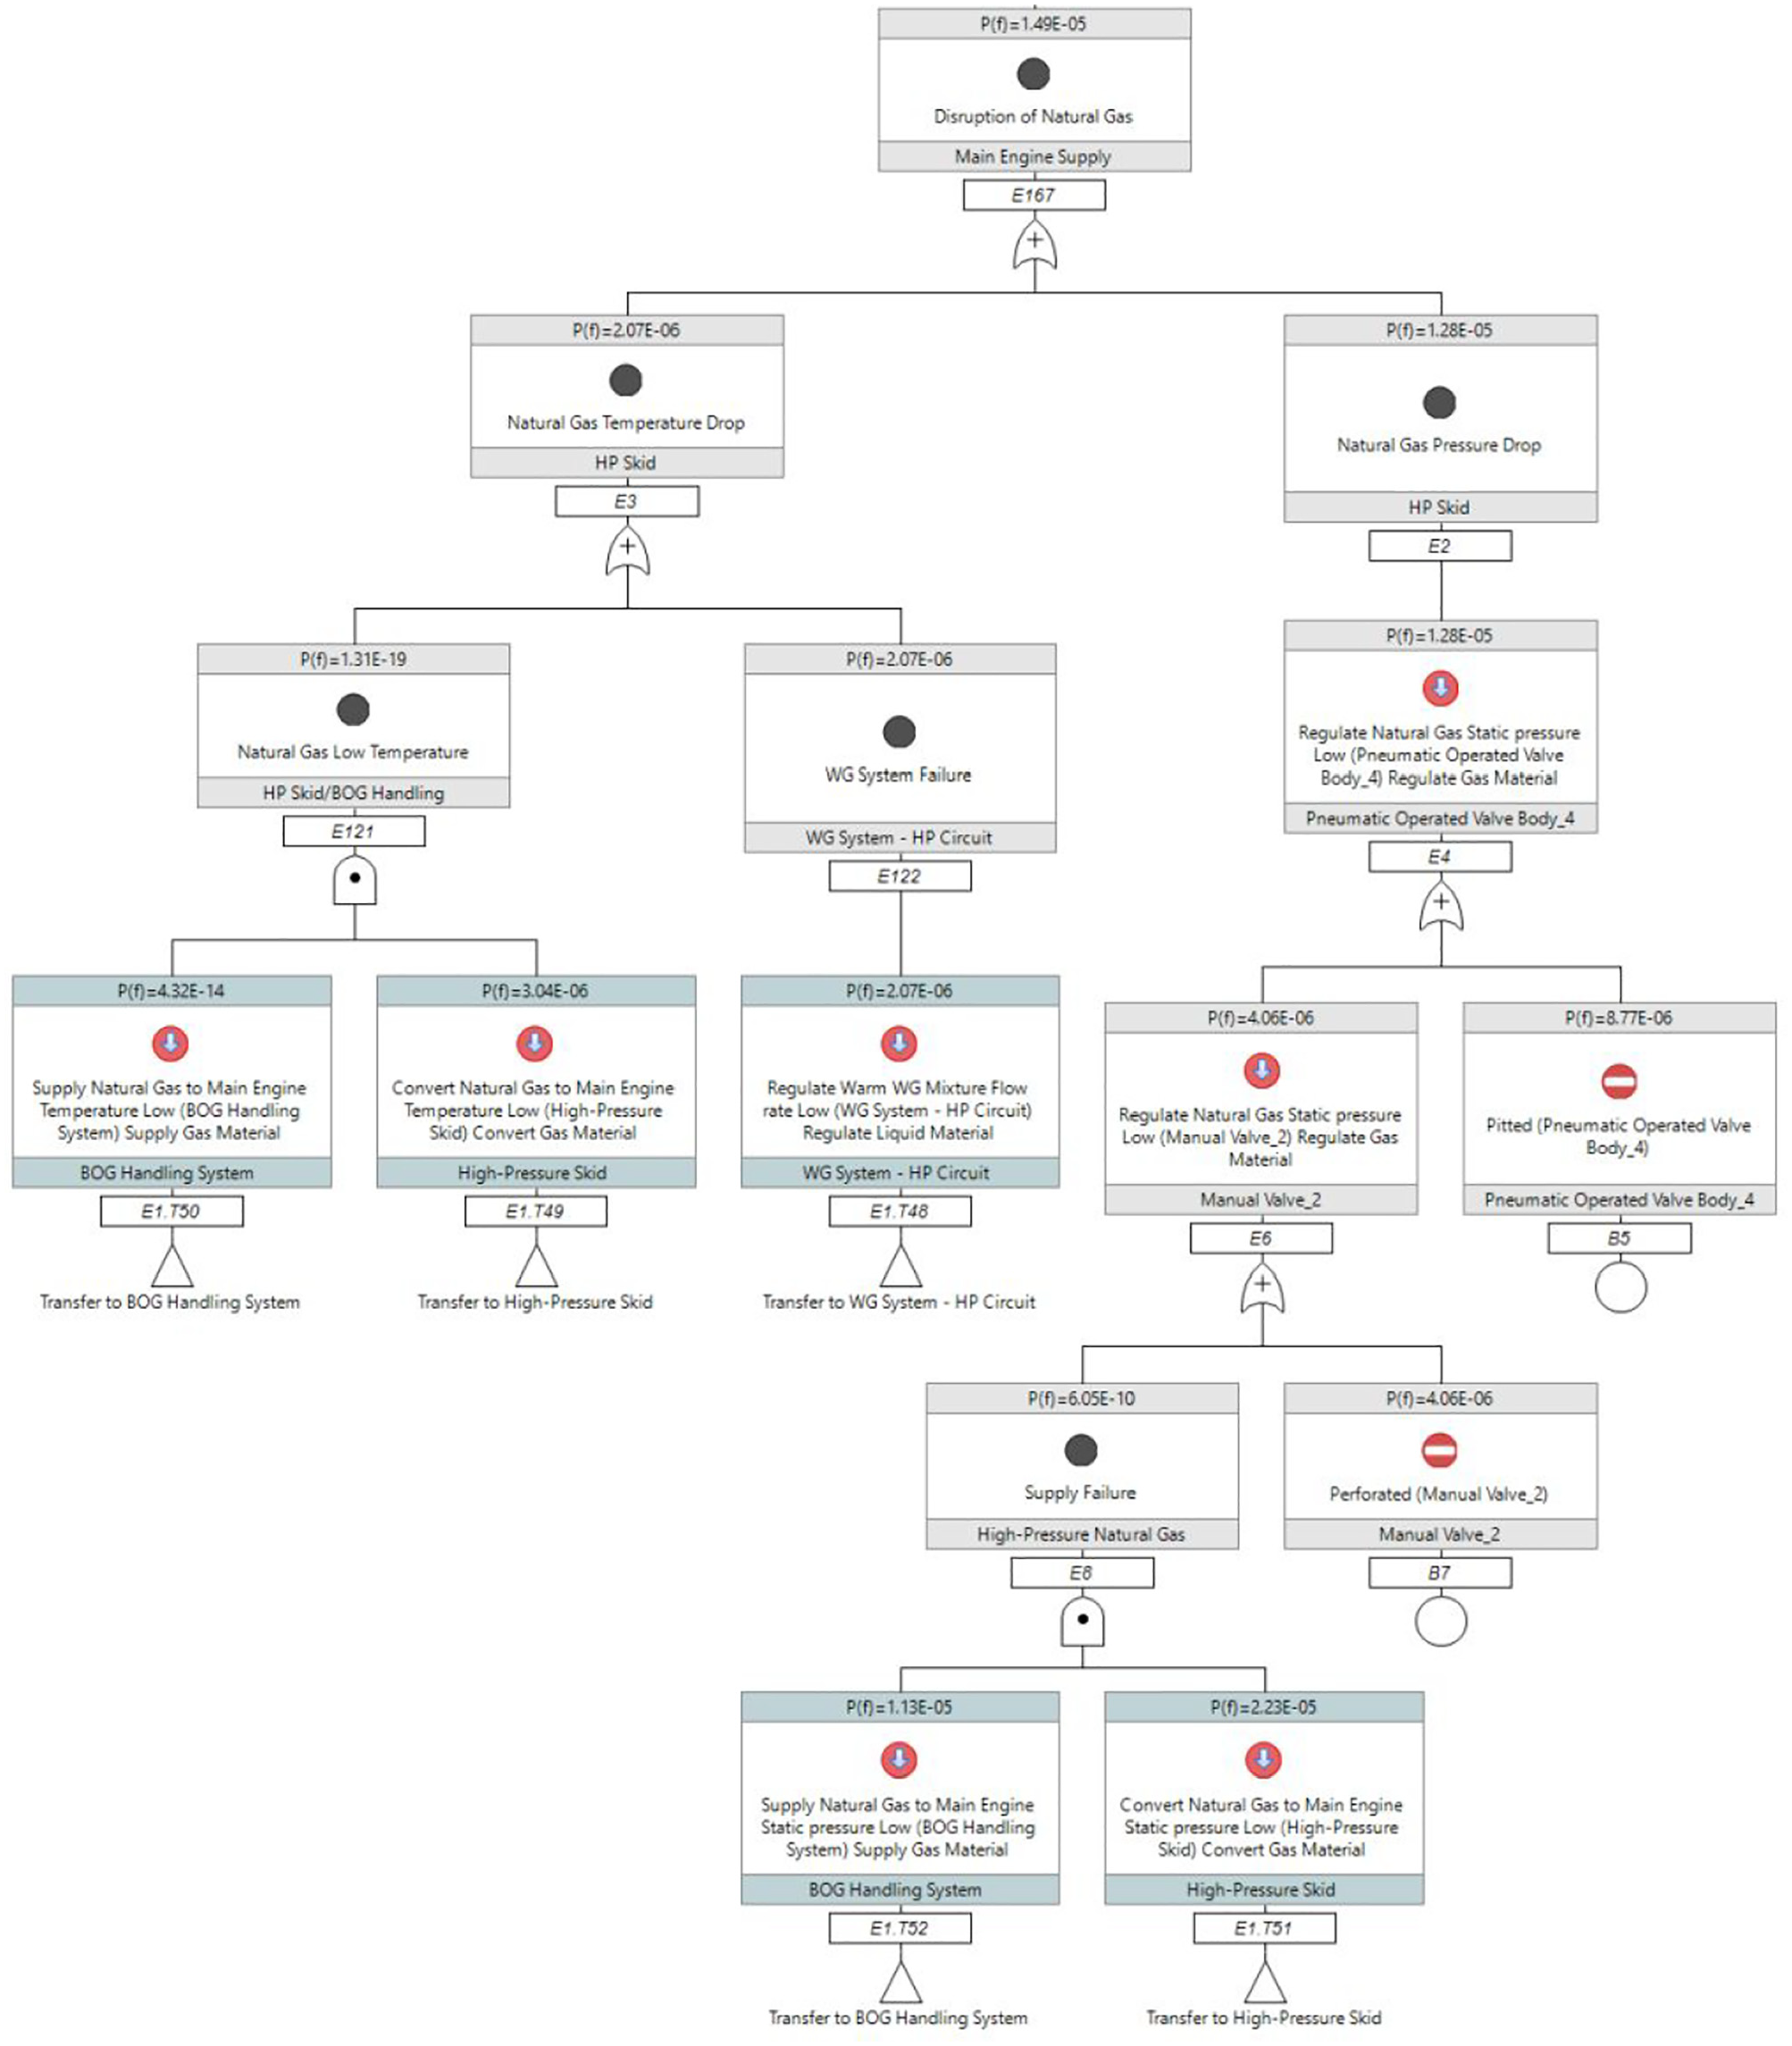
Developed fault tree for the top event “Main engine natural Gas supply disruption”.
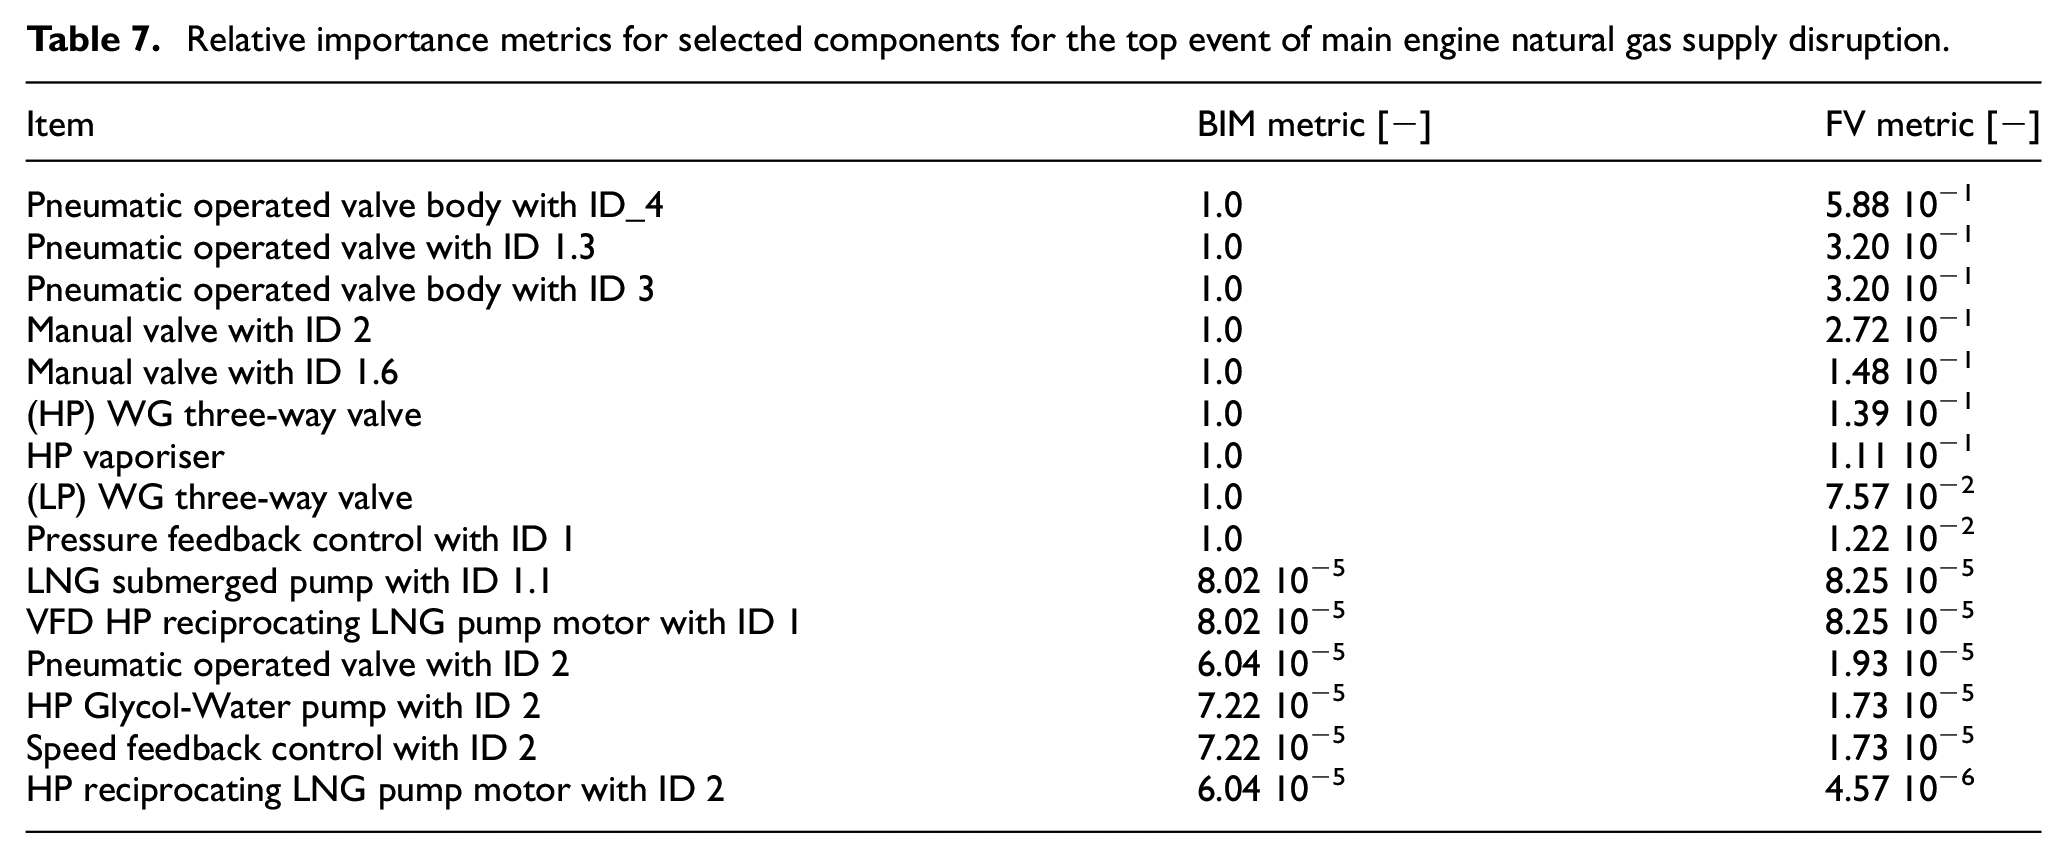
The calculated relative importance metrics from the FT of Figure 10 are presented in Table 7. These metrics reveal the components, that in case of failure, cause the system shut down (higher values denote more critical components). For the Birnbaum (BIM) metric, values equal to 1 denote components, the failure of which causes the system shut down (thus, indicating single point failures). The Birnbaum metric is more useful for quickly spotting problematic functional pathways and indicating locations in system where redundancy is required. The Fussell-Vesely (FV) metric also reveals the most critical components. The FV metric depicts those components whose reliability change will exercise a significant influence over the Fault Tree top event, and therefore, an improvement in failure rate for the component is required. It must be noted that these metrics are dimensionless and provide non prescriptive directions for potential design improvements. 45 The metrics for different components are compared with each other, and those with the highest value are specified as important, whilst their failure attracted more attention.
Relative importance metrics for selected components for the top event of main engine natural gas supply disruption.
The derived FMECA results were verified by cross checking the most critical components derived from both employed methods (Table 5, Table 7 and other information not presented herein for brevity). It can be deduced from this comparative assessment that the critical components identified by employing the relative importance metrics (from the FTA) match the critical components identified by using the RPN metric. These critical components mainly include process valves responsible for regulating the LNG and natural gas flow, as well as the pressure feedback controllers. Worth noting is that some components that were not identified as critical from the FMECA were found to have high relative importance from the FTA. This is because the FTA does not consider the Detectability of a failure, which is employed for calculating the RPN in the FMECA.
Step 7: System design improvements
The safety analysis results from Steps 5 and 6 revealed that the investigated HP FGSS system baseline design (as provided by the engine designer) demonstrates adequate safety performance, in terms of the calculated metrics. Several major components (pumps, compressors, etc.) were not found to be critical, which provided flexibility in terms of system operability, rendering major design changes unnecessary. This is attributed to the high-level of redundancy present in this FGSS design, with the provision of several critical components connected in parallel to address the cases of individual failures. As the existing regulatory framework (IGF code) provides provisions for addressing vapour and liquid gas leakages in the investigated FGSS, it is expected that the installed monitoring system will be prescriptive in terms of the locations and number of the required gas detectors. Hence, gas detectors are not investigated as a risk mitigation measure herein.
This study focuses on the process systems and feedback loops; emphasis was placed on the sensors and software-based detection methods,46,47 without altering the system design philosophy. Furthermore, redundancy of several key valves that found critical (from both FMECA and FTA) is investigated to reduce the downtime as well as to decrease severity in case of failures. More specifically, the following design alterations are put forward for further investigation of the resultant safety metrics: (a) parallel branches of pneumatic operated and manual gate valves prior to the consumers; (b) a parallel branch of the pressure reducing valve (PRV) downstream the LP buffer tank; (c) duplicate pressure feedback controllers both in HP skid and LNG tank; (d) a parallel three-way valve in the WG system serving the HP vaporiser; (e) pressure sensors after all critical components including (a) to (d), to facilitate the detection of pressure variations (used for diagnosing of system health status).
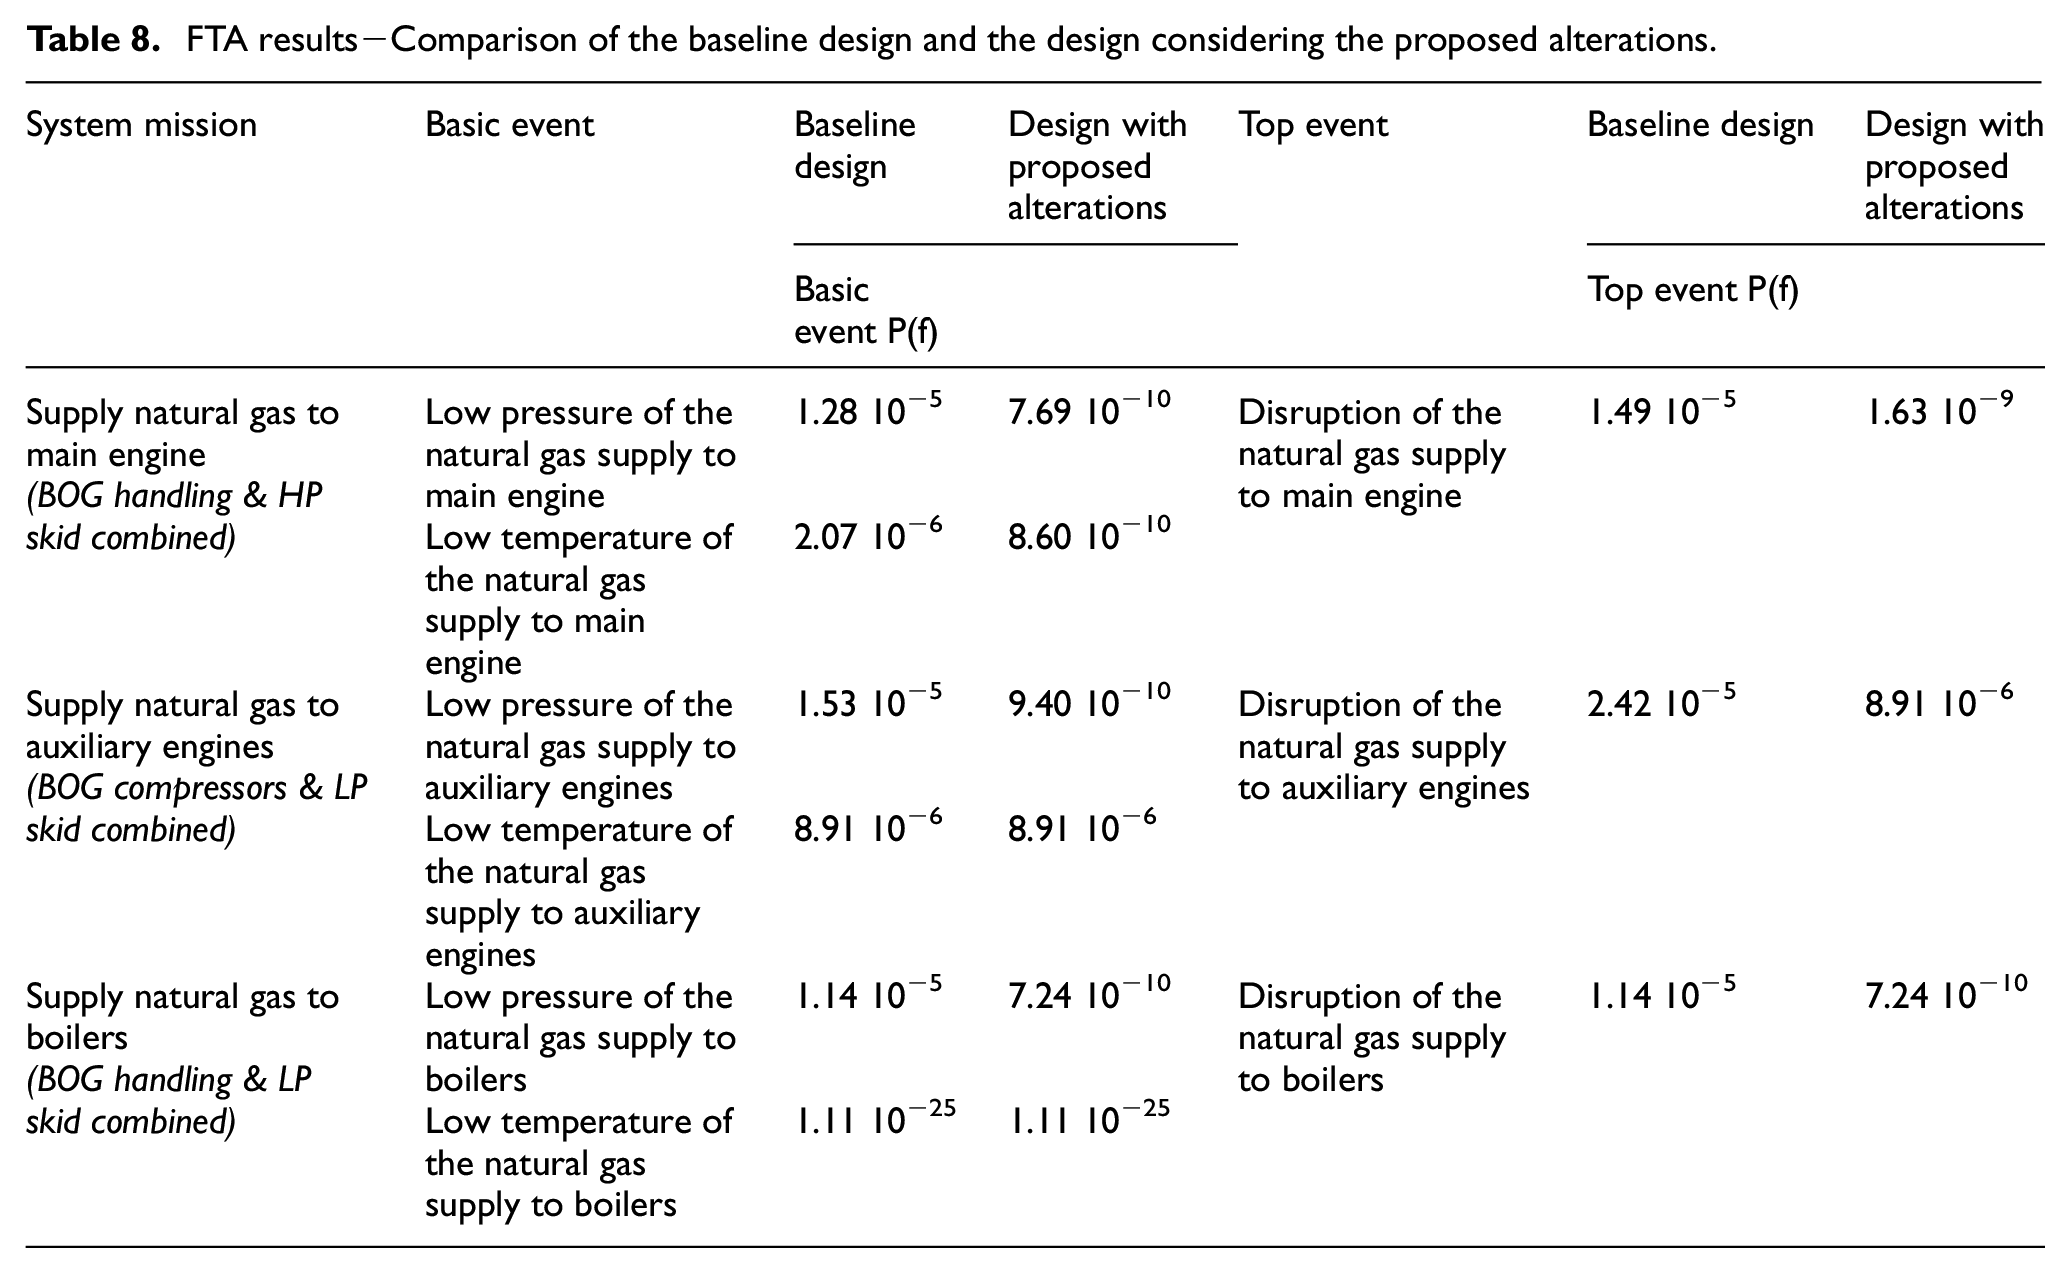
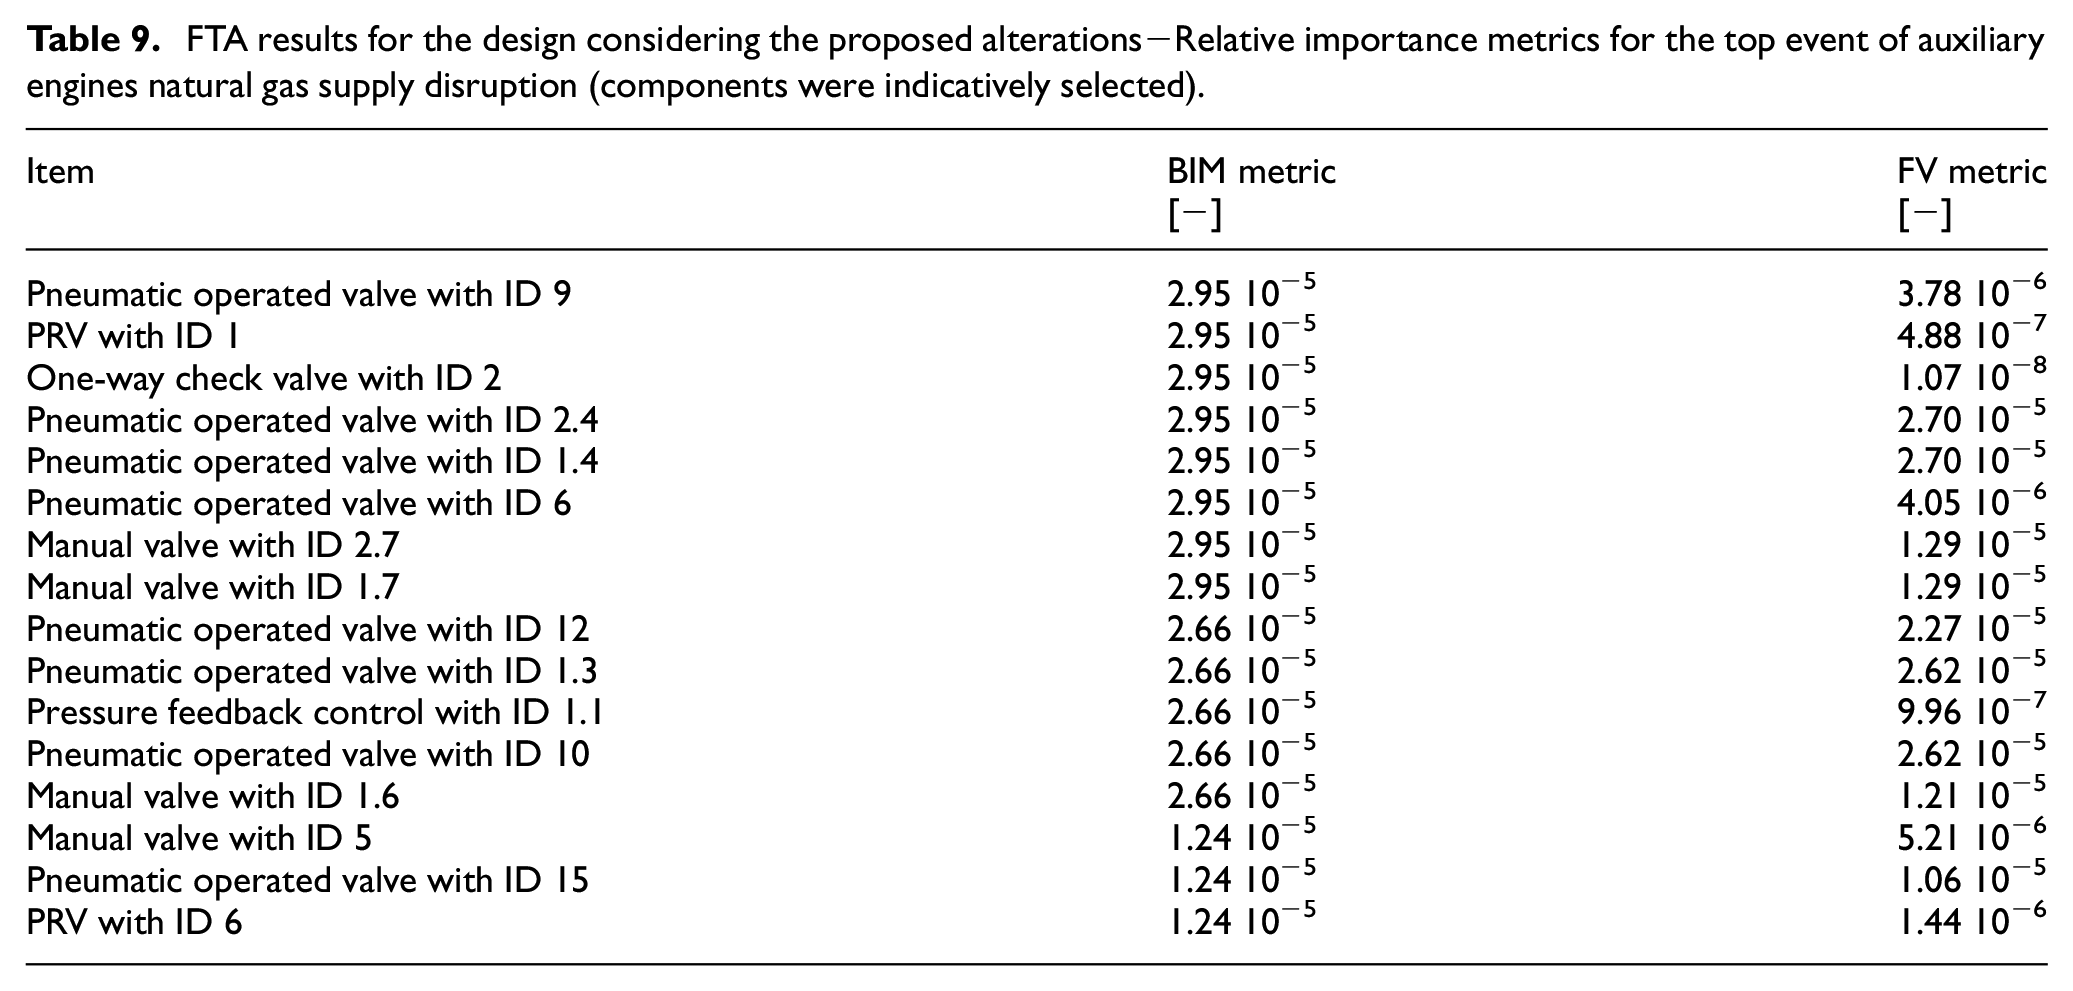
The developed functional model was updated to include the preceding design alterations and was employed to re-implement the FTA (considering the same basic and top events presented in Table 6). The FTA cannot consider the impact of the proposed additional pressure sensors that affect the system capability of detecting components failures. Therefore, FMECA was implemented for the revised system design considering all the proposed alteration (and the pressure sensors) to calculate RPN values. The derived FTA results along with the comparison for the baseline system design are presented in Table 8. Table 9 provides the derived importance metrics for the revised system design pertaining to the top event of the AEs natural gas supply disruption. Table 10 provides the RPN values for the revised system design and their comparison to the respective values obtained for the baseline design.
FTA results−Comparison of the baseline design and the design considering the proposed alterations.
FTA results for the design considering the proposed alterations−Relative importance metrics for the top event of auxiliary engines natural gas supply disruption (components were indicatively selected).
RPN values for the baseline design and the design with the proposed alterations.
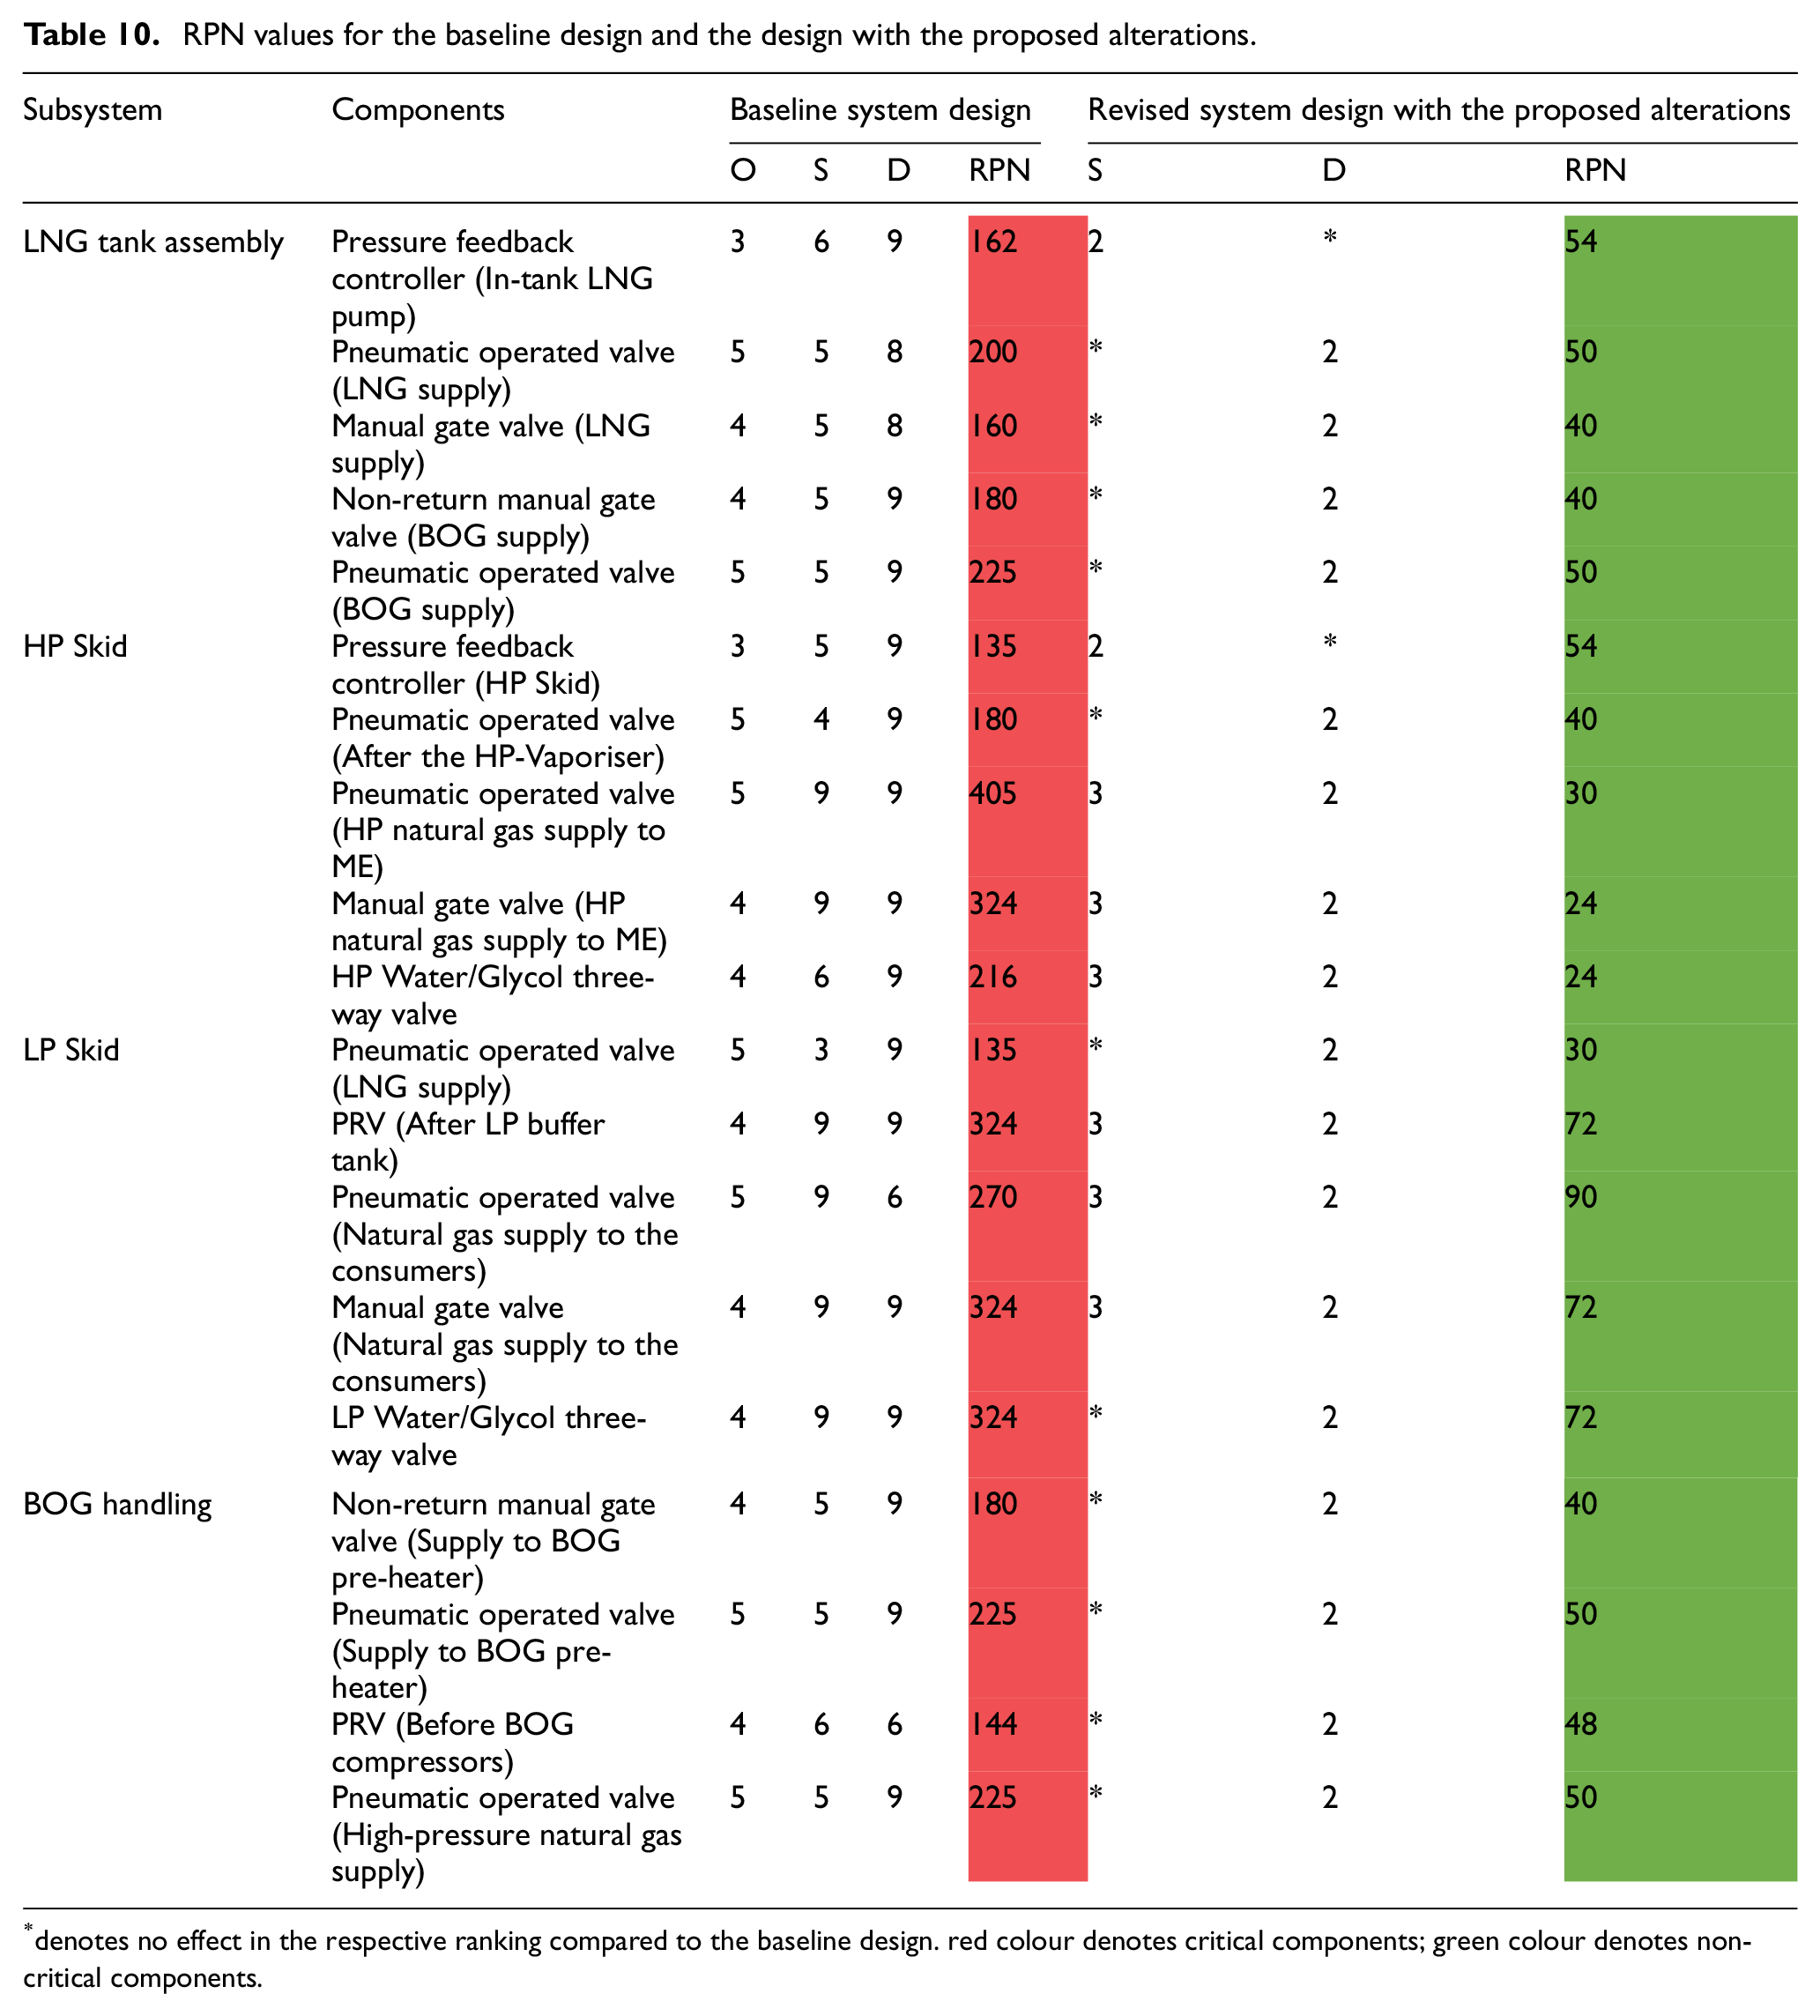
denotes no effect in the respective ranking compared to the baseline design. red colour denotes critical components; green colour denotes non-critical components.
As it is deduced from Table 8 results, a significant reduction in the probabilities of the top events pertaining to all the system missions are exhibited. In practical terms, this proves that the proposed system design alterations lead to an exponential reduction in the probability of the investigated FGSS shutdown. The derived Birnbaum and Fussell-Vesely relative importance metrics for the revised system design (Table 9) exhibit significantly lower values compared with the respective values for the baseline system (Table 7). This is attributed to the additional redundancy provided by the proposed design alterations, which eliminated single point failures, thus significantly increasing the investigated FGSS availability.
In the FMECA results (Table 10), the RPN is affected by changes in Detectability and in some cases Severity, due to the additional redundant components. The RPN values obtained for the revised FGSS design reveal the positive impact of the additional pressure sensors. All the RPN values are reduced below the threshold of 100, indicating that the system safety enhancement is considerable. It must be noted that the Occurrence remains the same for both baseline and revised system designs.
Discussion on the results and methodology
The results of the baseline system safety analysis (considering both the FMECA and FTA) are mostly aligned with the results of previous studies on LNG carrier systems 31 and shore regasification plants, 11 exhibiting similar criticality metrics, using similar failure rate inputs. According to Chang and Lee, 31 the most critical components were found to be the process control valves, which aligns with the current analysis findings. Some discrepancies were observed between the findings of this and previous studies, which is attributed to the increased complexity of the investigated FGSS as well as its design with relatively high redundancy. More specifically, components that would be otherwise critical (e.g., BOG compressors, LNG pumps) were found within the accepted safety metrics limits (RPN < 100). The derived top events probabilities for the FGSS baseline design are in line with respective metrics calculated for conventional Diesel fuel feeding systems, 44 indicating the high maturity of the design, when compared with other conventional fuels systems.
The employed methodology proved to be useful and effective. The available libraries in MADe™ facilitated the application of the performed analysis. The FMECA tables and Fault Trees were developed automatically from the relevant system functional models with minor adjustments. The methodology supported the system safety enhancement, and the derived improved design safety metrics were compared to the respective ones of the baseline system.
The control system failures (hardware and software) were not considered in this study, which indicates that some failure scenarios were ignored. Several assumptions were made regarding the occurrence, severity, and detectability of failure modes. The OREDA database and relevant publications were employed to identify the system components failure rates, which are used to calculate the RPN. The variety of employed sources is associated at a certain degree with the uncertainty in the derived results. As OREDA was developed by employing offshore assets data, the use of such information for the case of ship systems/components is an important limitation. Nonetheless, these limitations provide directions for future research.
Conclusions
This study applied a methodology for the ships systems quantitative model-based safety analysis, which combines the system functional modelling, the failure propagation analysis, FMECA, and FTA. This methodology was implemented to investigate the safety performance of the high-pressure LNG fuel storage and feeding system and led to recommendations for design improvements of the investigated system baseline design to enhance its safety.
The main findings of this study are summarised as follows.
The system functional modelling substantially contributed to the better understanding of the system components interactions and their impact on the overall system safety.
The FMECA led to the identification of failure modes and the RPN calculation, which resulted in the classification of the system critical components and the specification of the most critical failure events.
The FTA allowed for the quantitative safety metrics evaluation providing calculations for the top and basic events probabilities as well as Birnbaum and Fussell-Vesely relative importance metrics.
The developed methodology effectively supported the quantitative safety analysis and the design of safe marine systems. In the design phase, emphasis must be placed on the critical system components, sensors, and control equipment.
The most critical components (in terms of the RPN) of the investigated FGSS were found to be the process valves (pneumatic operated valves, manual gate valves, pressure reducing valves and three-way valves) and the pressure feedback controllers.
Quantitative FTA validated the FMECA results, although some minor discrepancies were observed.
The performed safety analysis results for the investigated FGSS baseline design are associated with the high level of redundancy in the system design.
The recommendations for design improvements focused on reducing the criticality of pressure-related components (process valves, feedback controllers), due to their higher probabilities of failures compared to temperature related ones.
The implementation of redundancy in the process valves on the system branches controlling the natural gas flow to the consumers, led to a considerable reduction of the FGSS top events probabilities.
The additional pressure sensors in all critical components reduced the detectability of failures and respective RPN to non-critical level.
It must be noted that attention must be placed on the quality of the data obtained from the pertinent literature, as it greatly influences the safety analysis results. As the LNG technology is relatively recent, data discrepancies or unavailability must be compensated using reasonable and justifiable assumptions. Lastly, the analysis can be further expanded in future studies via the development of an intelligent health monitoring, prognostics and health management system employing digital twins and data driven models. Employing digital twins and machine learning algorithms can be extremely beneficial for a more sophisticated safety analysis.
Supplemental Material
sj-pdf-1-pim-10.1177_14750902221078426 – Supplemental material for Safety analysis of a high-pressure fuel gas supply system for LNG fuelled vessels
Supplemental material, sj-pdf-1-pim-10.1177_14750902221078426 for Safety analysis of a high-pressure fuel gas supply system for LNG fuelled vessels by Konstantinos Milioulis, Victor Bolbot, Gerasimos Theotokatos, Evangelos Boulougouris, Paul Sayan, Kelvin Wen Yong Chio and Wei Siang Lim in Proceedings of the Institution of Mechanical Engineers, Part M: Journal of Engineering for the Maritime Environment
Footnotes
Authors’ Note
Victor Bolbot is now affiliated to Department of Mechanical Engineering, School of Engineering, Aalto University, Finland.
Declaration of conflicting interests
The author(s) declared no potential conflicts of interest with respect to the research, authorship, and/or publication of this article.
Funding
The author(s) disclosed receipt of the following financial support for the research, authorship, and/or publication of this article: This study was carried out in the framework of a project funded by Zicom Pte Ltd. The authors affiliated with the MSRC greatly acknowledge the funding from DNV AS and RCCL for the MSRC establishment and operation. The opinions expressed herein are those of the authors and should not be construed to reflect the views of DNV AS, RCCL, and Zicom.
Supplemental material
Supplemental material for this article is available online.
References
Supplementary Material
Please find the following supplemental material available below.
For Open Access articles published under a Creative Commons License, all supplemental material carries the same license as the article it is associated with.
For non-Open Access articles published, all supplemental material carries a non-exclusive license, and permission requests for re-use of supplemental material or any part of supplemental material shall be sent directly to the copyright owner as specified in the copyright notice associated with the article.