
Abstract
Traditionally, in the automotive industry, the risk posed by failures in manufacturing is based on the conventional process failure mode and effect analysis. The market changes, as well as limited financial resources dedicated to business improvement, induce the need for employment of advanced management tools. The rating of failures is derived from the research using the suggested fuzzy classification method based on the Pareto analysis. It is assumed that the classification criterion should be determined as the product of the overall product choice and the risk priority numbers given by applying the traditional process failure mode and effect analysis. All the uncertainties that exist in the problem under consideration are represented by linguistic expressions that are modeled on the interval type-2 triangular fuzzy numbers. The overall product choice is based on a fuzzy analytical hierarchy process with interval type-2 triangular fuzzy numbers. The execution of management initiatives based on the priority of failures can result in the improvement of the manufacturing process and overall business efficiency. The proposed model is tested using real-life data from a single vehicle manufacturer operating in the Western Balkans and representing a part of a global automotive supply chain.
Keywords
Introduction
The automotive industry represents one of the largest economic sectors in terms of revenue in the world. To remain competitive within the dynamic global market, automotive industry manufacturers must be prepared to meet the three main key drivers of competitiveness: the product of the right quality, reasonable prices, and on-time delivery. The literature encompassing the criteria relevance during the car purchase indicates that reliability plays the most important role to customers. 1 In order to satisfy this customer demand, the manufacturer must ensure that the product is failure-free throughout the entire production process.
Occurrence of a failure is a very significant problem for the quality management in each industry. Many industries have whole concepts for failure prevention/correction during the manufacturing process. During the last decades, production processes, techniques, tools, and methods have been developed to prevent/correct failures. One of the tools widely used in many industries is failure mode and effect analysis (FMEA). 2 The type of this analysis specialized for the production/manufacturing process is called process FMEA or PFMEA. This analysis is widely used in the automotive industry as it is considered a standard for the automotive industry—IATF16949. 3 In the actual version of the standard for the automotive industry, FMEA was mentioned 18 times. The appearance of FMEA in the standard for the automotive industry supports the relevance of FMEA in the future.
Industry 4.0 is putting pressure on companies to centralize and digitalize everything in order to satisfy key value drivers in the company. 4 It can be noticed that there is a clear need for digitalization and centralization of PFMEA. In compliance with the stated, there is also a need for automatized and software solutions for FMEA. 5 All of the stated support centralization and systemization of every product and process as well as failures (with all following data) which appear during the manufacturing. It can be noticed that all identified failures can be divided into two groups: (1) obligatory failures and (2) non-obligatory failures. In the automotive industry, the obligatory failures are those failures whose risk priority numbers (RPNs) are over 100 and their severity, occurrence, or detection indices are over 8 (Automotive Industry Action Group (AIAG)). 6 These obligatory failures must be eliminated, or their impact must be significantly decreased no matter how much cost these activities induce.
Respecting the zero-defect principle defined in total quality management concept, all non-obligatory failures should be improved. It is almost impossible to enhance all non-obligatory failures at the same time, keeping in mind the definitive resources regarding the implementation costs of improvement measures. The motivation for this research comes from the fact that there are no research papers that deal with the issue of decreasing the level of risks induced by non-obligatory failures.
According to the results of the best practice in automotive industry, it can be said that the priority of the non-obligatory failures depends on the calculated RPNs and the overall product preference where these failures occur. The overall product preference can be determined with respect to many criteria. The relative importance of criteria and product preference under each criterion are assessed by the decision makers who use the linguistic expressions rather than precise numbers. The development of the fuzzy sets theory7,8 has enabled that the linguistic expressions to be presented via mathematical formulations. The literature review indicates that a significant number of papers were uncertain and imprecise terms are represented using type-1 fuzzy sets.9,10 These fuzzy numbers are not suitable for situations in which precise membership functions are difficult or impossible to specify for linguistic concepts. 11 The type-2 fuzzy sets have been introduced by Zadeh, 12 whose membership function is also fuzzy. In particular, the interval type-2 fuzzy numbers might play a role in enhancing decision-making process.13,14 Determining the overall product preference according to the selected criteria may be based on fuzzy analytical hierarchy process (FAHP) with the interval type 2 fuzzy numbers.15,16
Determining the priority of non-obligatory failures can be stated as an optimization task. In the literature, there are many proposed optimization methods such as Pareto analysis and genetic algorithm (GA).17,18 In practice, ABC method which is based on Pareto analysis19–22 is one of the commonly used strategies for classifying different items into classes (applicable to the classification of non-obligatory failures, too). In this article, a new fuzzy classification method based on Pareto analysis is proposed.
The wider objective of this research may be interpreted as an integration of the different methods embracing (a) calculation RPNs of non-obligatory failures using the conventional FMEA; (b) determination of overall product preference by FAHP with interval type-2 triangular fuzzy numbers (IT2TFNs); and (c) classification of non-obligatory failures using the extended ABC method.
Theoretical background with problem overview
PFMEA is an inductive method with a bottom-up approach specialized for failure identification and prevention/correction during the manufacturing process in the automotive industry. Conduction of the PFMEA for the automotive industry is defined in AIAG manual called “potential FMEA.” 6 This manual was drafted by Ford, General Motors, and Chrysler. The active version of this manual is fourth version, drafted in 2008. This is a traditional PFMEA framework for the automotive industry and all improvements/ enhancements related to PFMEA for the automotive industry should be adopted into this manual.
Centralized FMEAs could make one whole layer for the risk prioritization according to the highest RPN. Centralization of the all data makes RPN of different FMEAs easier to search. Non-obligatory failures are supposed to be checked in profitability terms so the total costs caused by failure minus total costs of the improvement solution should be positive. After profitability checking, 23 the available budget for possible improvements should be checked (if any). These non-obligatory failures which may occur at different products may have the exact same value of RPNs so they have the same priority. In practice, the problem may appear because product value is not involved in the risk prioritization process, and it should be taken in account. This may lead to serious decision-making problems to PFMEA team and wrong decisions may lead to non-profitable investments.
For example, it may happen that “Product 1” is manufactured with failures A, B, and C, respectively, with RPN values 72, 46, and 25, while “Product 2” is manufactured with failures X, Y, and Z, respectively, with values 86, 56, and 35. At the same time, the value of the “Product 1” is three times more important than the value of the “Product 2.” However, according to the RPN values, the failures related to the “Product 2” should be prioritized even if product 1 is more important than product 2.
The overall preference of the analyzed products, according to the selected criteria, is considered in the existing literature by combining Pareto with FMEA in order to prioritize the identified risks.24,25 This research is exceeding the traditional PFMEA framework for the automotive industry. If only the Pareto analysis is applied, the products will be separated into two groups: one group where fewer products provide the most value for the company and another group of products which provide less value to the company.
In the literature, many papers can be found where the item’s preference is determined by FAHP with IT2TFNs. 26 The employment of IT2TFNs significantly decreases the complexity of calculation but the preciseness of the solution is not compromised. Many authors suggest application of Buckley’s method 27 for handling of the uncertainties in FAHP. Until now, there are no critics of this approach, so it is a justification to be employed in research by many authors, so it is also used in this study.
The classification is performed by respecting only one integrated criterion (analogy to conventional ABC) which is multiplication of the two uncertain criteria: demand frequency and costs whose values are modeled by type-1 TFNs. 20 It is worth mentioning that the ABC classification may be based on the fuzzy rule approach. 22 The problem of the suppliers’ classification may be solved with respect to three criteria. 21 The relative importance of criteria and their values are modeled by TFNs. The classification criterion values were calculated as Euclidian distance between weighted normalized criteria values and referent points. The calculated distance values are sorted in the descending series.
In the papers referred to, the classification of the treated items is performed according to the defined rules: items of class A represent about 5%–10% of the total number of items, approximately next 15% of items correspond to group B and the rest of the items belong to group C. In a similar way, the classification of non-obligatory failures which are treated in the scope of this research is performed.
The variances between the proposed model compared with the existing models are explained further. In respect to the best practice of the automotive industry, it can be said that when defining management initiatives, the management strictly cares about the customer satisfaction while respecting their importance. Using the existing methods that can be found in the literature, the priority of management initiative may be determined, without having the importance of customers taken into consideration. But, the application of the existing methods may not yield the results which are always applicable in practice. The application of the proposed model sets the priority of management initiatives that correspond to the FMEA team’s decision-making approach.
Evaluation framework
The evaluation framework for the prioritization of the management initiatives is proposed in Figure 1.
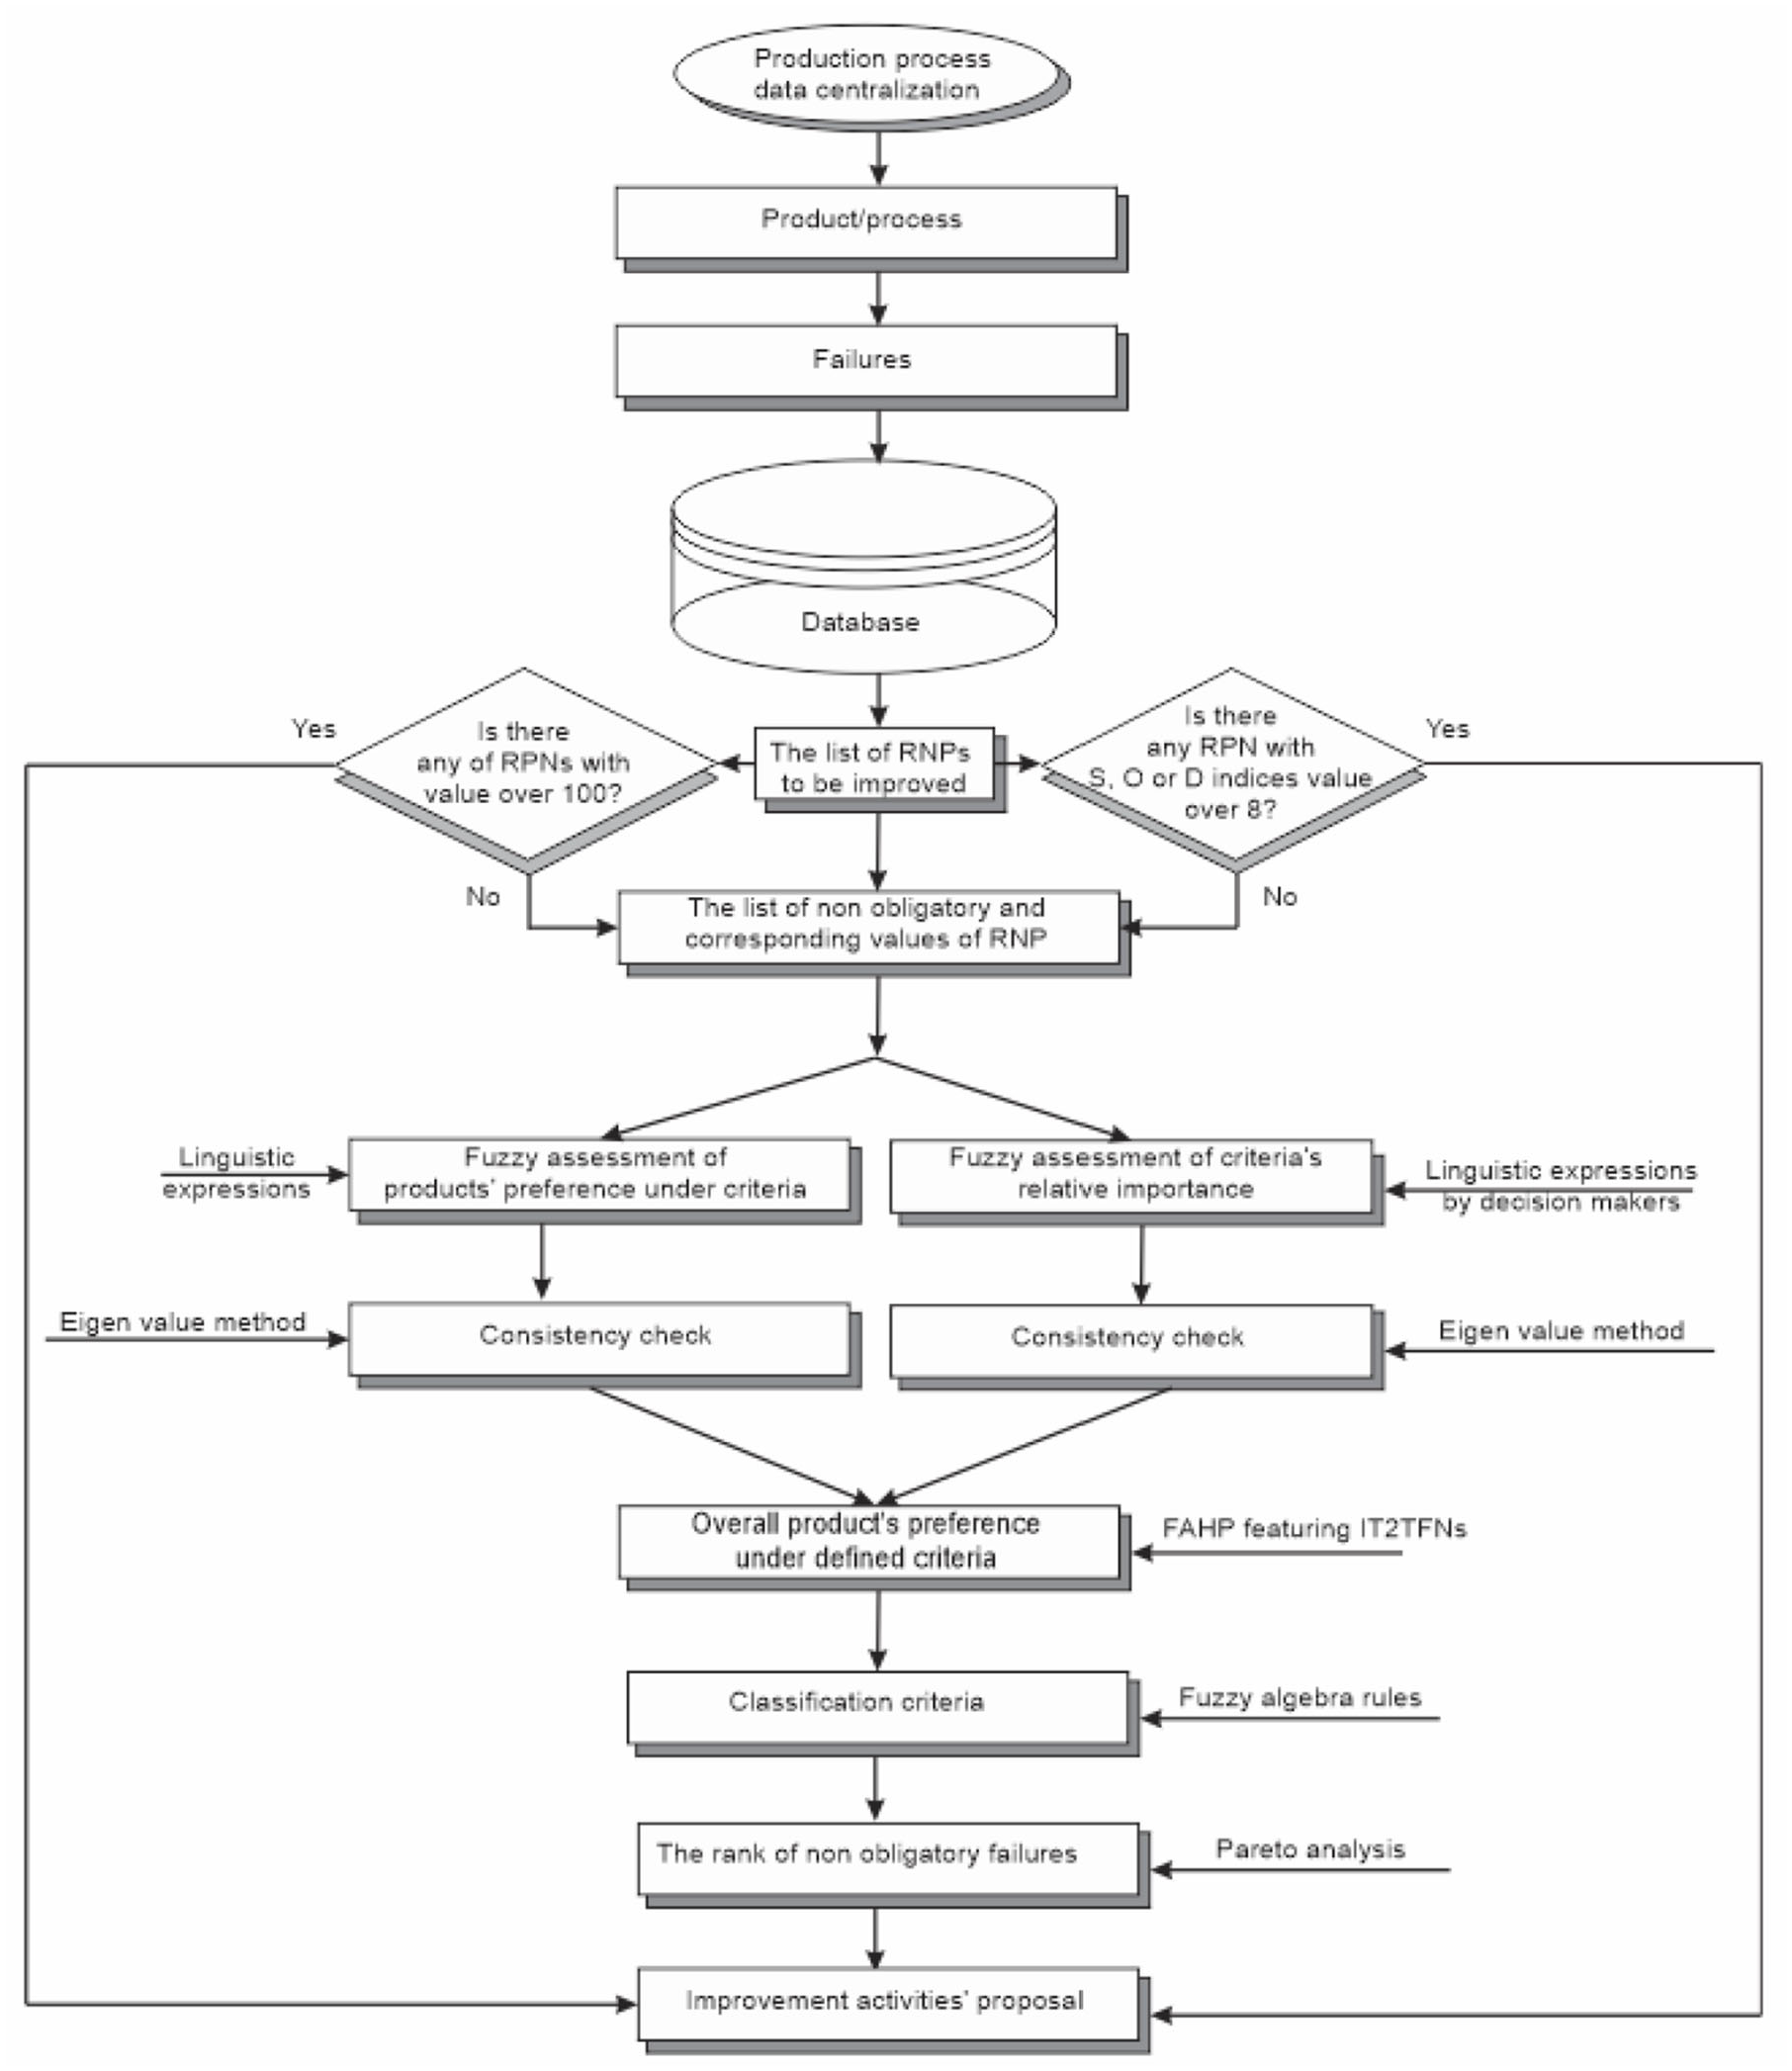
Flowchart of the failures’ ranking and improvement activities proposal.
Step 1. Generally, the products that are manufactured in each automotive company are implemented in a variety of vehicle types (final products). Each product may be manufactured with failure that is described in the centralized database.
Step 2. In the automotive industry, PFMEA team classifies failures in two different groups: (1) obligatory failures (according to the defined rules of conventional PFMEA) and (2) non-obligatory failures.
Step 3. Final products are formally presented by a set of indices π = {1, …, p, …, P}. Total amount of final products is marked as P and p, p = 1, …, P is final product index.
Step 4. The overall preference of final products is different for FMEA team at the level of each enterprise. Determining the overall preference of the treated final products is assessed by enterprise management team with respect to many criteria and their relative importance. The number and the type of criteria, according to which the preference of the final product is determined, are defined by the decision makers according to their experience and defined business objectives. These criteria can presented formally with the set of indices
Step 5. At the level of each product, PFMEA team should determine non-obligatory failures which formally may be presented by the set
Step 6. Fuzzy rating of the relative importance of criteria and preference of the final products under each treated criterion are performed by the management team. They use pre-defined linguistic expressions which are modeled by IT2TFNs. The overall preference of the treated vehicle types,
Step 7. The classification criterion values of each non-obligatory failure
Step 8. The priority of the improvement measures that should be conducted in order to eliminate non-obligatory failures corresponds to the classification results.
Methodology
This section presents the methodology used for the overall product’s preference respecting all presented criteria and the classification of non-obligatory failures.
Fuzzy algebra rules with IT2 fuzzy sets
Some basic definitions related to the fuzzy algebra rules of the IT2TFNs are presented. 28
Let us assume two IT2TFNs,
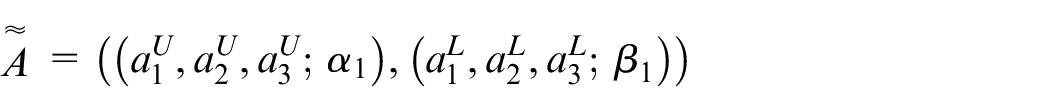
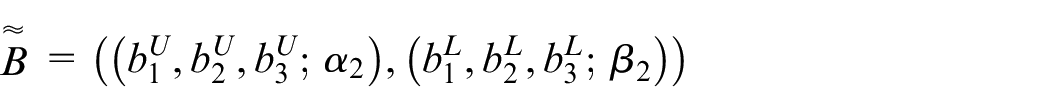
where
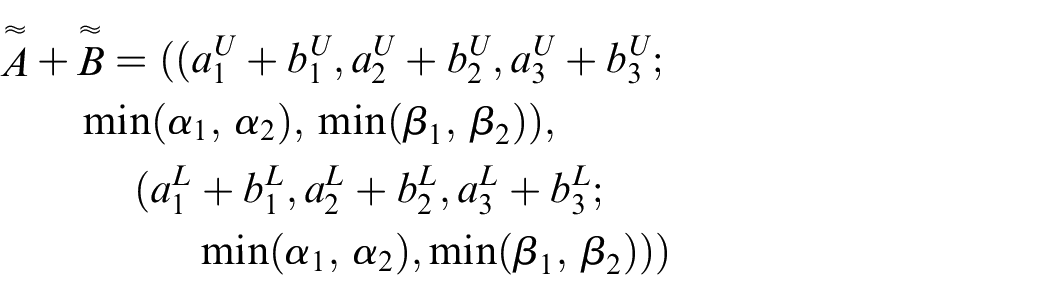
The arithmetic operations are introduced:
The addition operation, which is denoted as
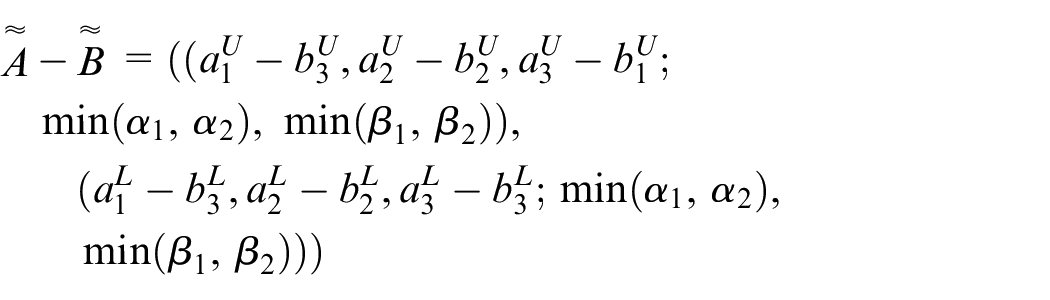
The subtraction operation, which is denoted as,
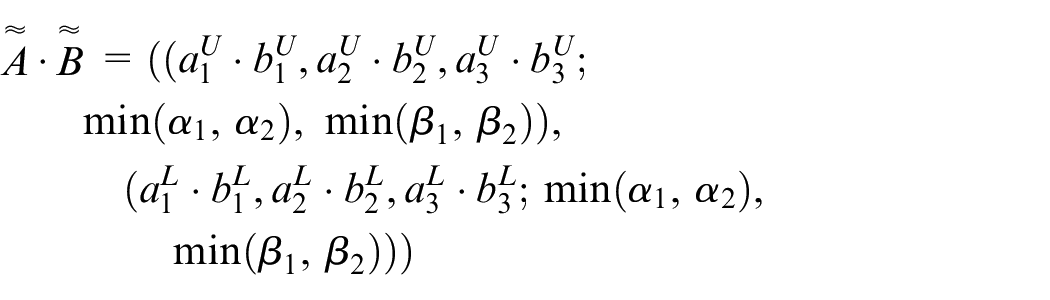
The multiplication operation, which is denoted as,
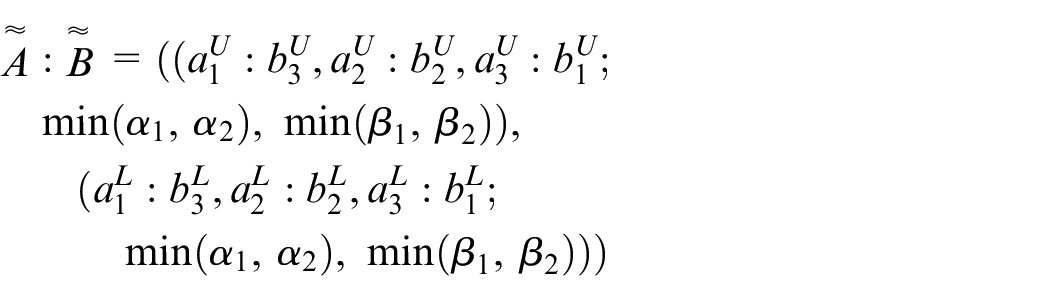
The division, which is denoted as,
c
Let us IT2TFN,
Determining the overall product’s preference
Within the scope of the research, it is decided that using five pre-defined linguistic expressions, the decision makers can precisely articulate their assessments. These linguistic terms and corresponding IT2TFNs are
Very low importance/preference (VL)—((1, 1, 5.5; 1), (1, 1, 5; 0.75)).
Low importance/preference (L)—((1, 3, 7; 1), (1.5, 3, 6.5; 0.75)).
Medium importance/preference (M)—((2, 6, 8; 1), (2.5, 6, 7.5; 0.75)).
High importance/preference (H)—((3, 7, 9; 1), (3.5. 7, 8.5; 0.75)).
Very high importance/preference (VH)—((4.5, 9, 9; 1), (5, 9, 9; 0.75)).
The domains for each of IT2TFNs are defined on the standard measurement scale. 29
The value 1, that is, 9, determines that relative importance of a criterion k is the smallest according to the product
In a similar way, the preference of the product p in relation to the product
It is known that the decision makers may make some mistakes while performing assessments. It is necessary to determine how these mistakes impact the correctness of the solution. In this article, the consistency check is performed in the following way: (1) the elements of the fuzzy pair-wise comparison matrices are mapped into scalar values using the defuzzification procedure; 26 in this way, the pair-wise comparison matrices are given, (2) consistency coefficient (consistency index (CI)) is calculated according to the procedure from literature, and (3) if CI is less or equal 0.1, it can be stated that the relative importance of the considered criteria and product’s preference under each criterion are precisely assessed. Otherwise, the fuzzy pair-wise comparison matrices must be constructed again by the decision makers.
The vector of overall product’s preference is obtained using FAHP with IT2TFNs. 26
The proposed procedure is realized through the following steps:
Step 1. Setting of fuzzy pair-wise comparison matrices of the relative importance of criteria,
It should be mentioned that if the decision maker considers that the relative importance of criterion
Step 2. Transformation of the fuzzy pair-wise comparison matrices,
Step 3. Checking the consistency of matrices,
Step 4. Determination of the vector weights for the considered criteria,
where
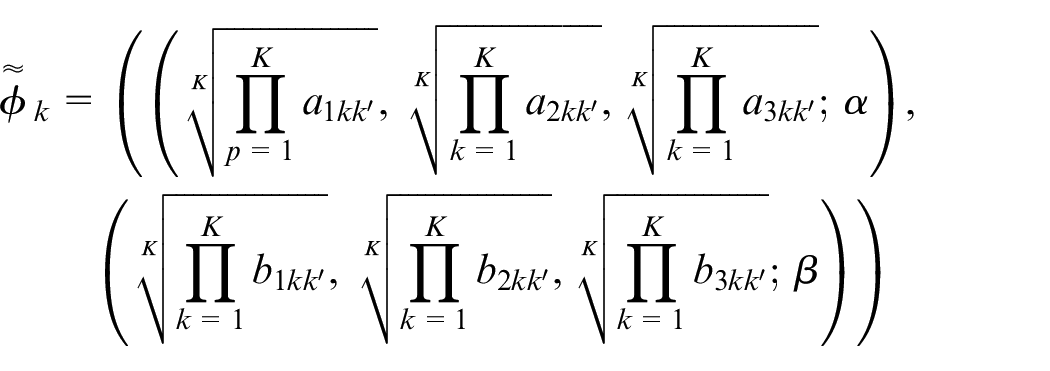
Criterion weight k, k = 1, .., K is described by IT2TFN,
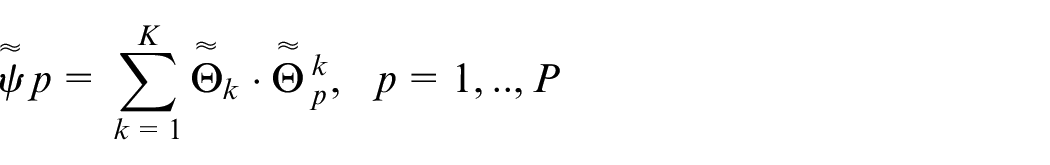
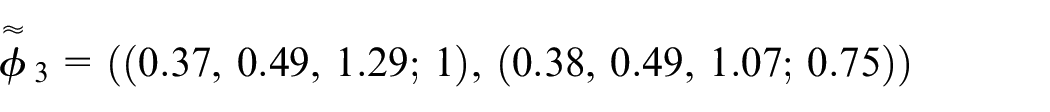
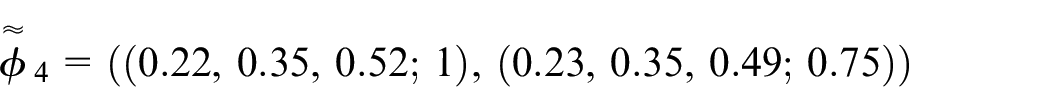
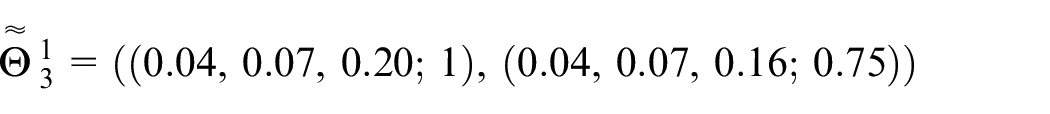
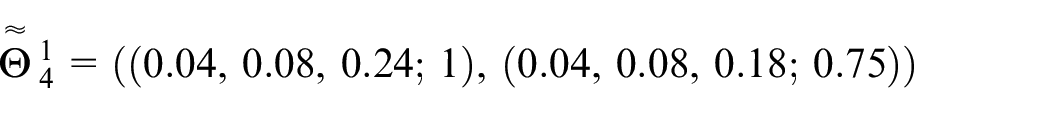
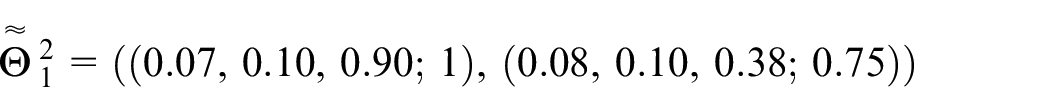
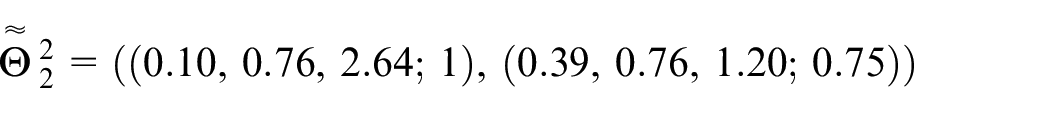
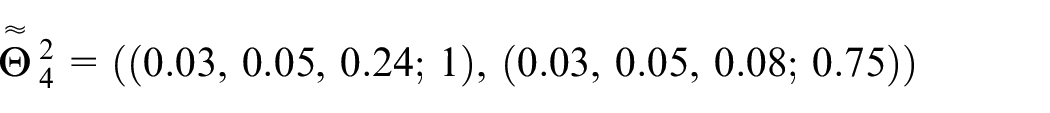
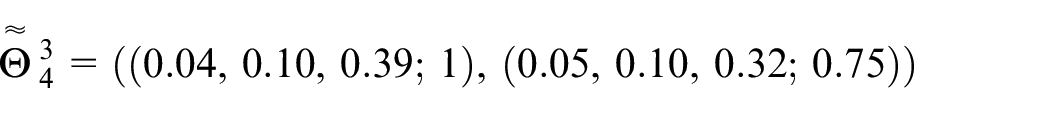
Similarly, the vector of the product’s preference under each criterion k,
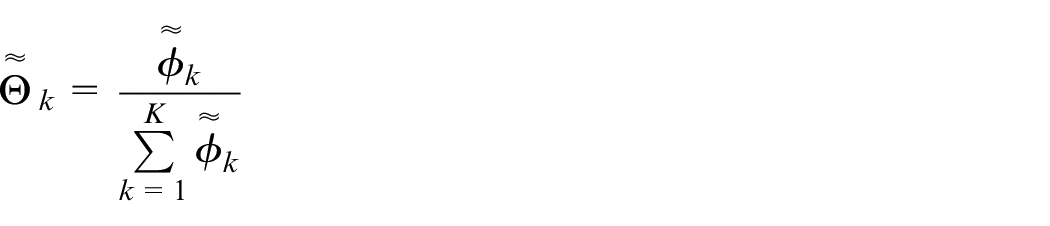
Step 5. The vector of the overall product’s preference respecting all presented criteria and its weights
Classification of non-obligatory failures
For the purpose of the classification of the non-obligatory failures, fuzzy ABC method is proposed which can be realized through the following steps:
Step 1. Calculating of RPN value for each non-obligatory failure i at the level of the final product p,
Step 2. The classification criterion values of non-obligatory failures can be calculated as
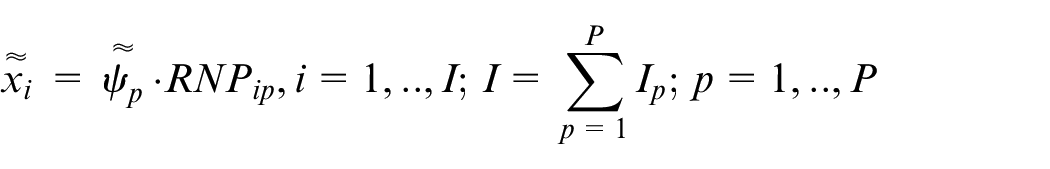
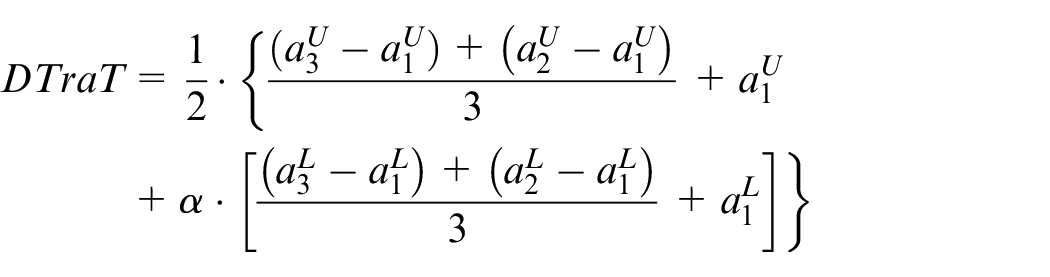
Step 3. The crisp value of classification criterion,
Step 4. The values
Step 5. The calculated values
Step 6. Non-obligatory failures that are not classified neither into class A nor into class C form class B.
Step 7. Measures which are undertaken first are the ones leading to the elimination of the group A mistakes. The order corresponds to the obtained classification results of non-obligatory failures from this group.
The case study
For the case study realization, one automotive industry, that is, small and medium enterprises (SME), which is a supplier in the automotive global supply chain from the Western Balkans has been chosen. The SME is producing electronic circuit boards and cables for automobiles. This company is equipped with International Automotive Task Force (IATF) 16949 standard 3 for the automotive industry; therefore, the use of PFMEA is obligatory. This company has many products which are manufactured for different automotive companies.
For this case study, four products are selected randomly by the strategic management team: MFQ30 standard, MSM6B, product denoted as 629 341, and product denoted as 627 161. Each of the products is manufactured for different companies.
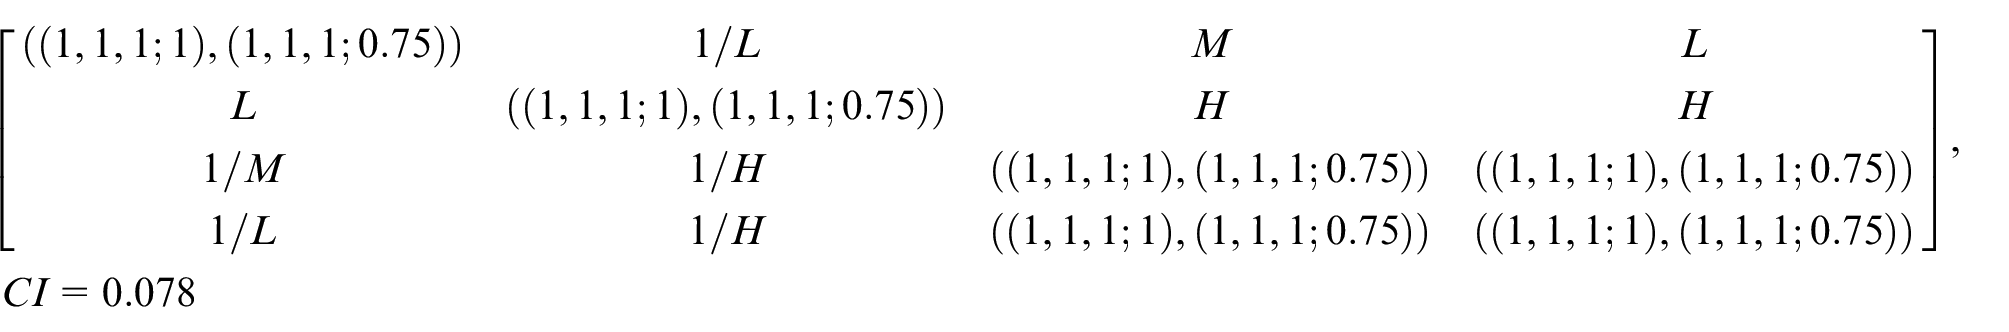
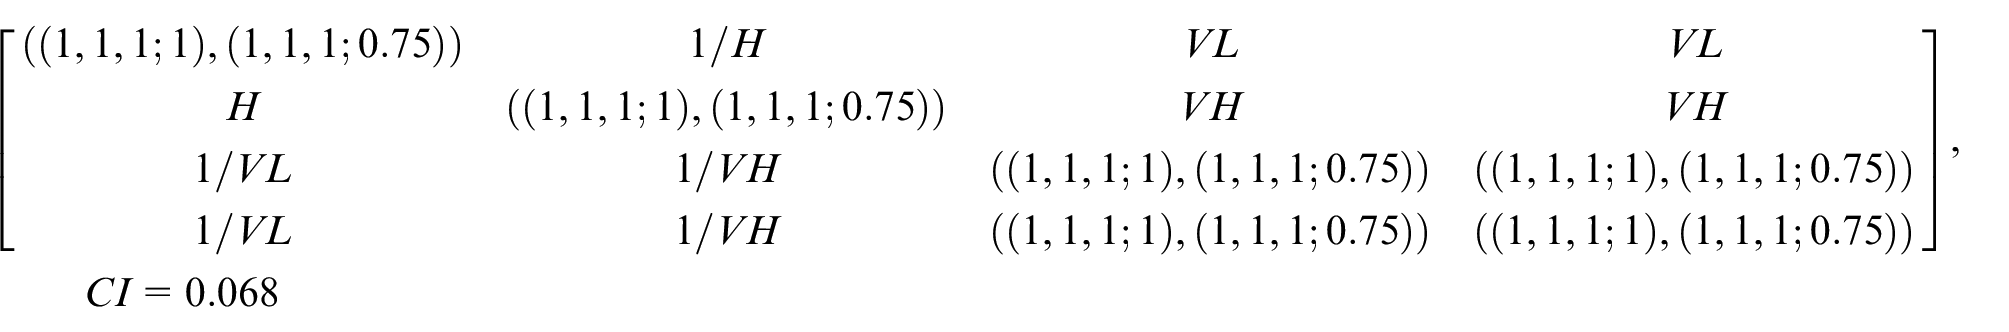
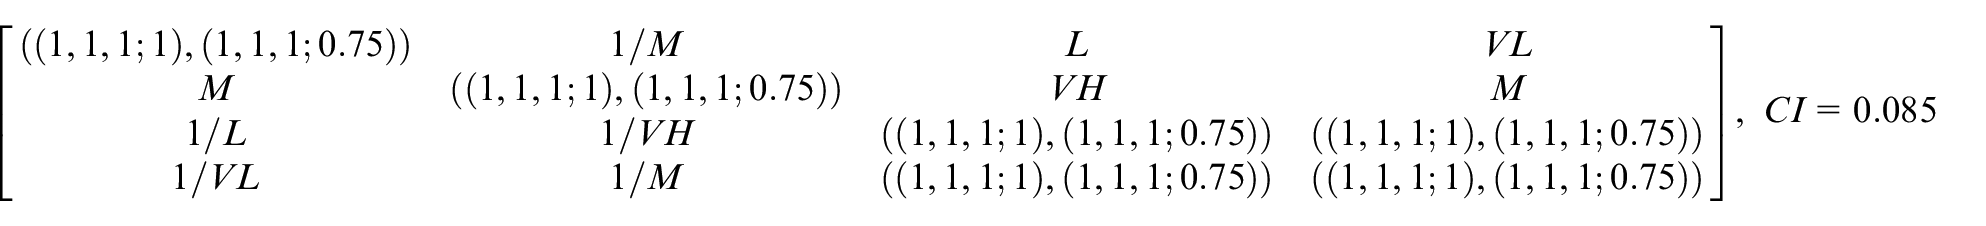
The fuzzy pair-wise comparison matrix of the relative importance of criteria according to which the importance of the product is assessed as
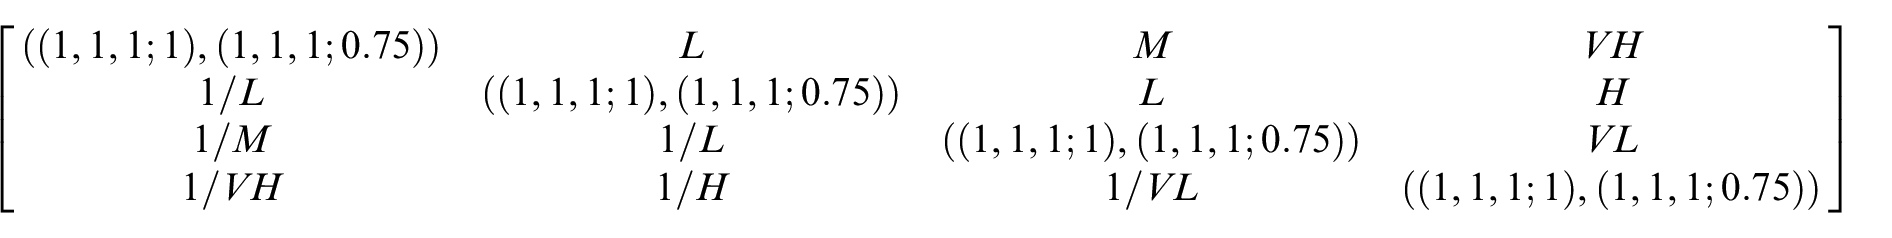
The pair-wise comparison matrix of the relative importance of criteria is obtained using the proposed procedure (step 2 of the proposed Algorithm in section “Determining the overall product’s preference”)
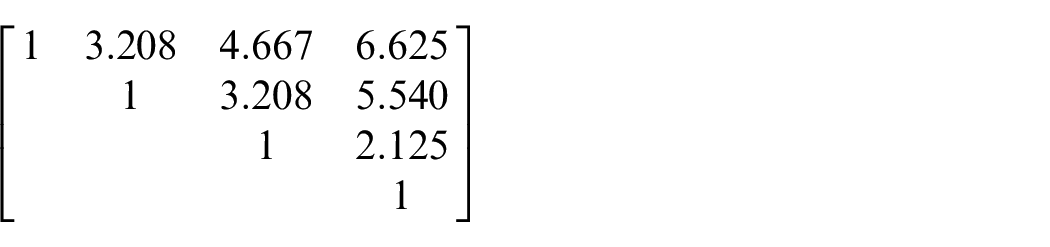
Value of the CI is calculated according to the procedure (step 3 of the proposed Algorithm in section “Fuzzy algebra rules with IT2 fuzzy sets”), so that, CI = 0.1. It can be assumed that the estimations of the decision maker are sufficiently precise.
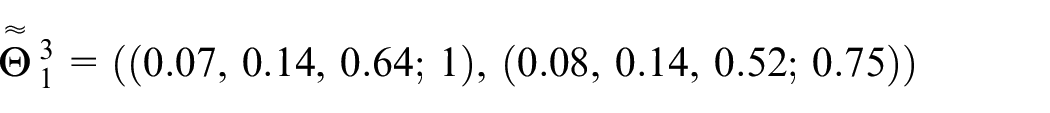
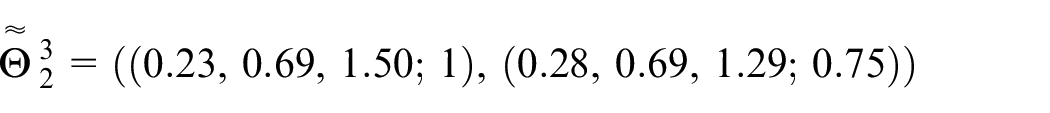
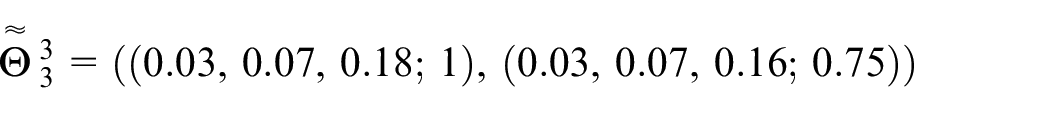
Using step 4 of section “Determining the overall product’s preference,” the criteria weights are calculated. The proposed procedure is illustrated
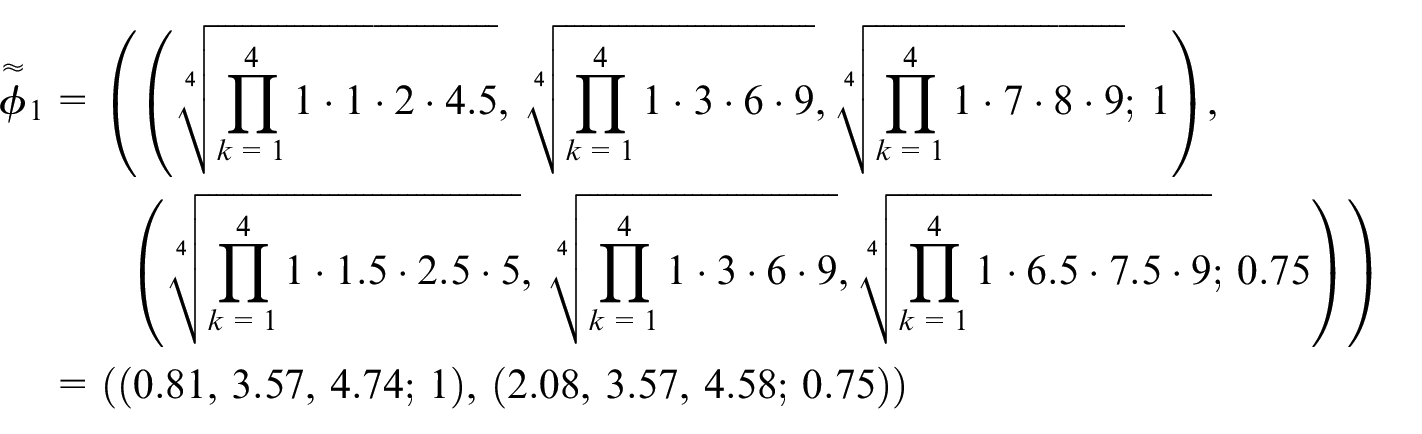
In a similar manner
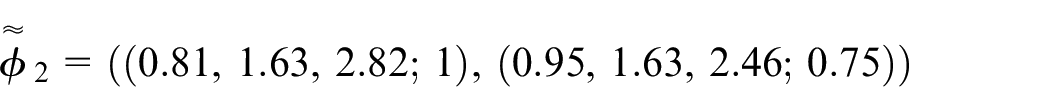
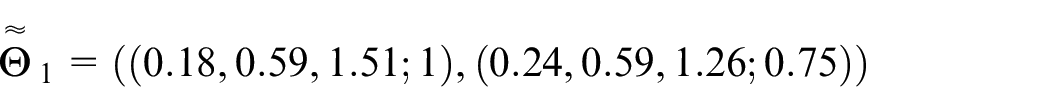
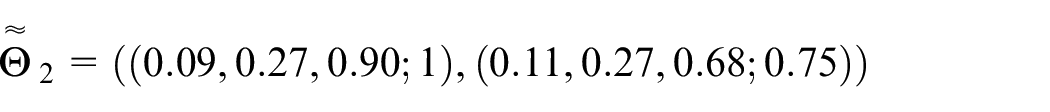
The criteria weights are obtained
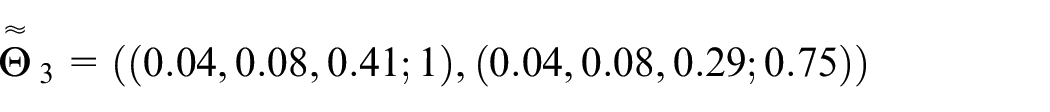
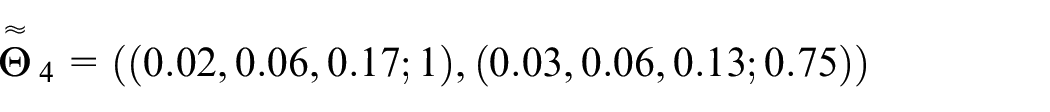
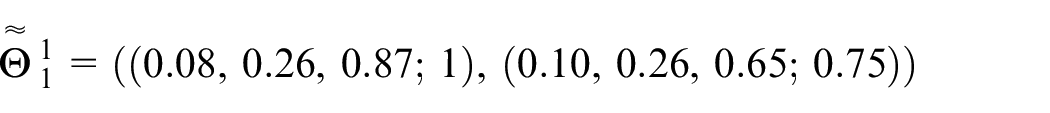
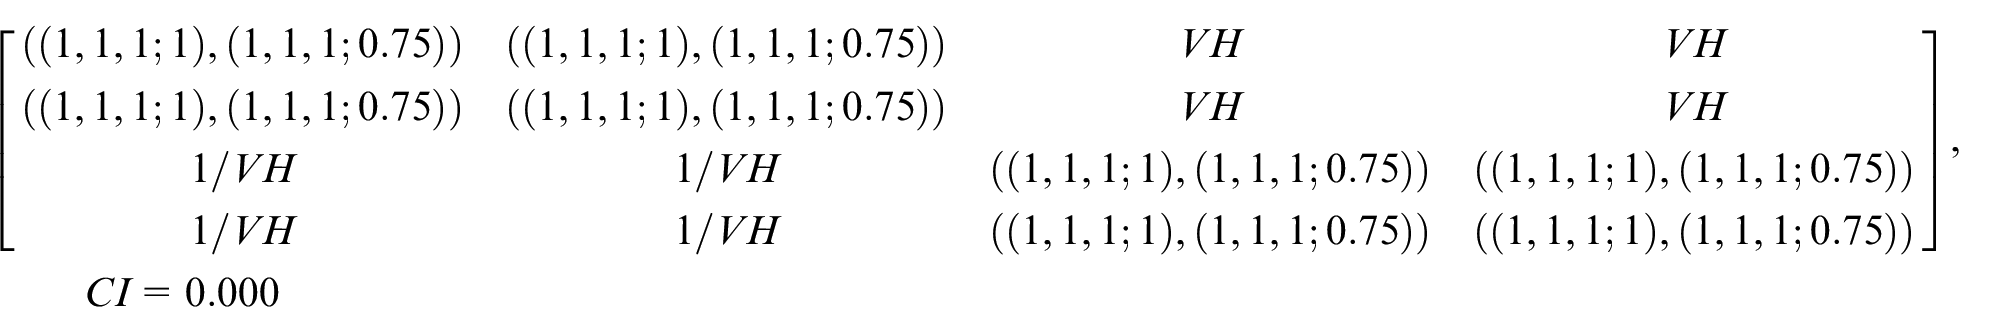
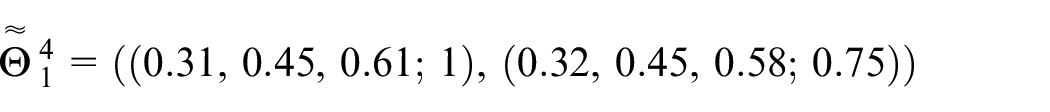
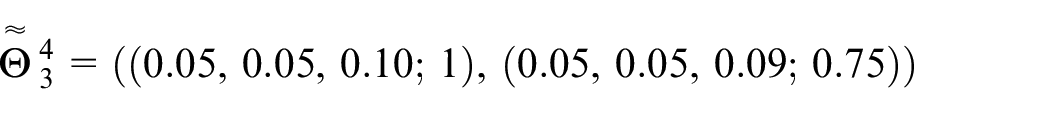
Fuzzy pair-wise comparison matrices are assessed and the vectors of the product’s preference under considered criteria are as follows:
Criterion customer (k = 1)
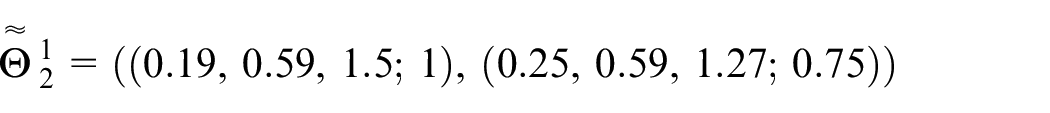
Criterion profit (k = 2)
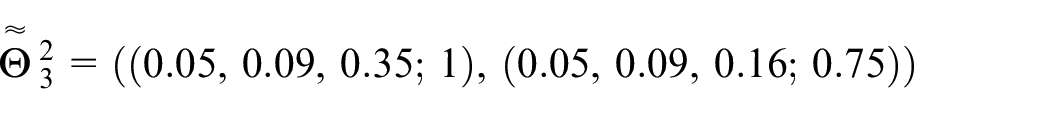
Criterion quantities (k = 3)
Criterion realization complexity (k = 4)

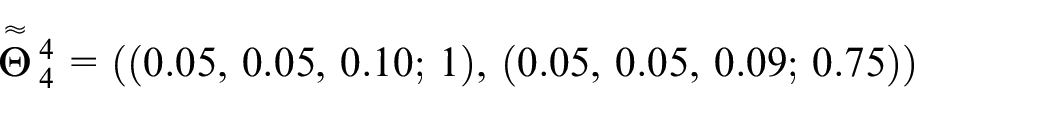
The overall product’s preference that may be produced with the identified failures may be calculated according to step 5 of section “Determining the overall product’s preference”
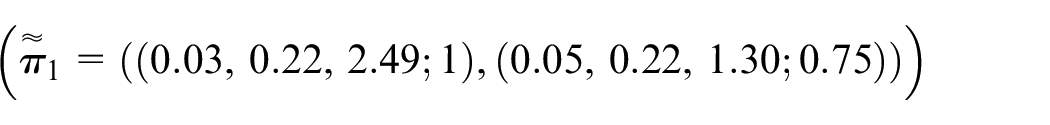


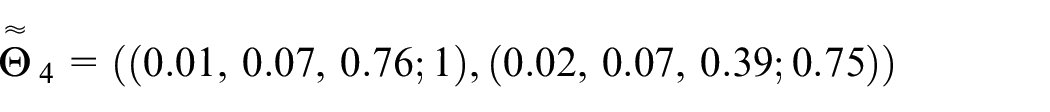
In the scope of conventional procedure, it may be stated that all these failures have equal significance for the PFMEA team. By respecting the suggested method, these failures have been adjoined with the following values of the classification criteria: 39.158, 88.495, 11.418, and 11.955, respectively. It is obvious that failures with the same RPN values have different significance for the PFMEA team.
The failures adjoined to the class A, which have the greatest significance for the PFMEA team are those whose RPN value is 84 and 96. These failures consist of almost 30% of the total number of non-obligatory failures which occurred in the treated products. In practice, taking measures promptly with a goal to fix or eliminate the analyzed failures is almost impossible due to the limitations in terms of human and financial resources. The results of good practice indicate that RPN values are not the only criterion according to which failures should be fixed or eliminated. In compliance with that, the model of non-obligatory failures’ classification criteria does not describe the real situation in best way.
Interpretation of the results and discussion
The results of classification criteria of non-obligatory failures are presented in Tables 1–4, since four different products are analyzed. The tables indicate the rank obtained by the traditional procedure taking in account just RPN and by applying the model proposed in this research. The obtained results are presented at the level of each final product inside a company. It may be concluded that presenting results in this way enables the FMEA team to analyze data in a clear manner in order to propose the necessary actions promptly.
Rank of final product
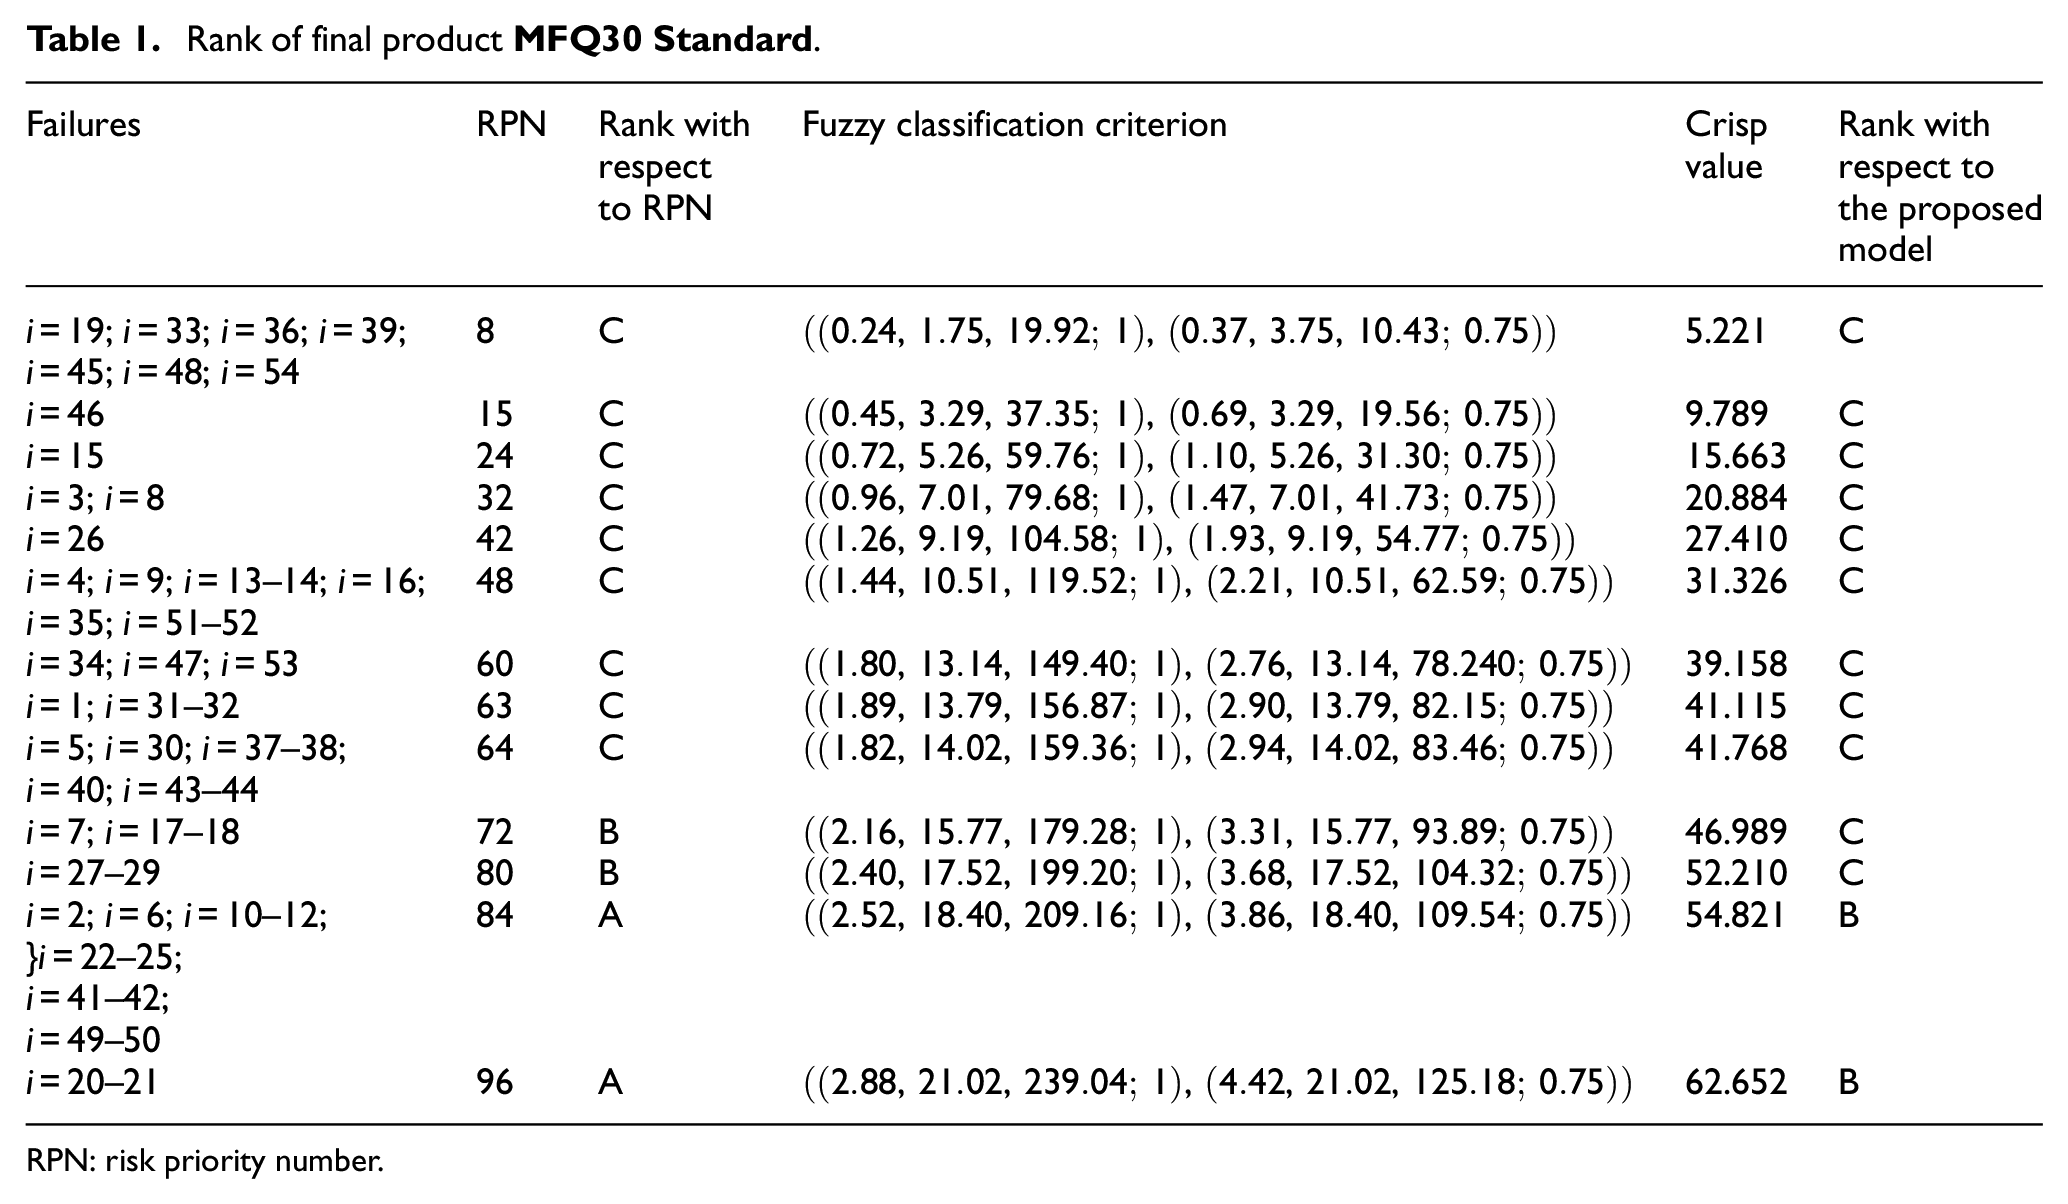
RPN: risk priority number.
Rank of final product
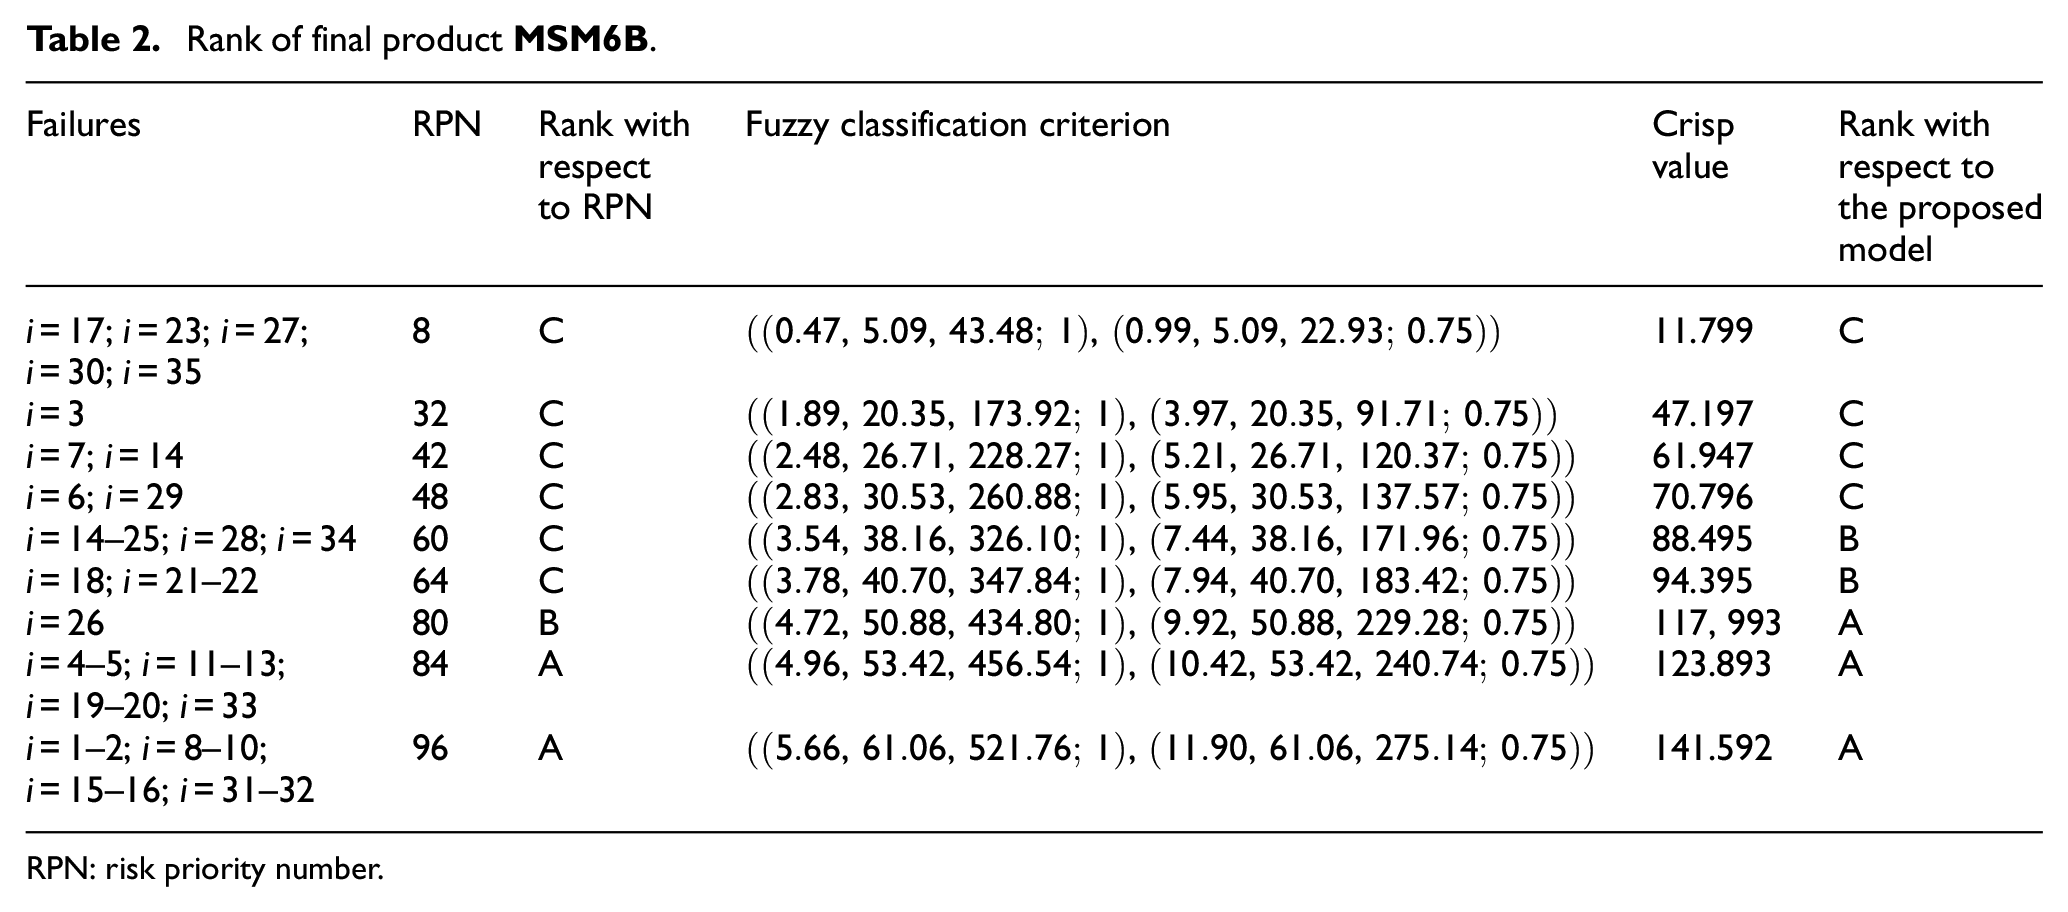
RPN: risk priority number.
Rank of final product
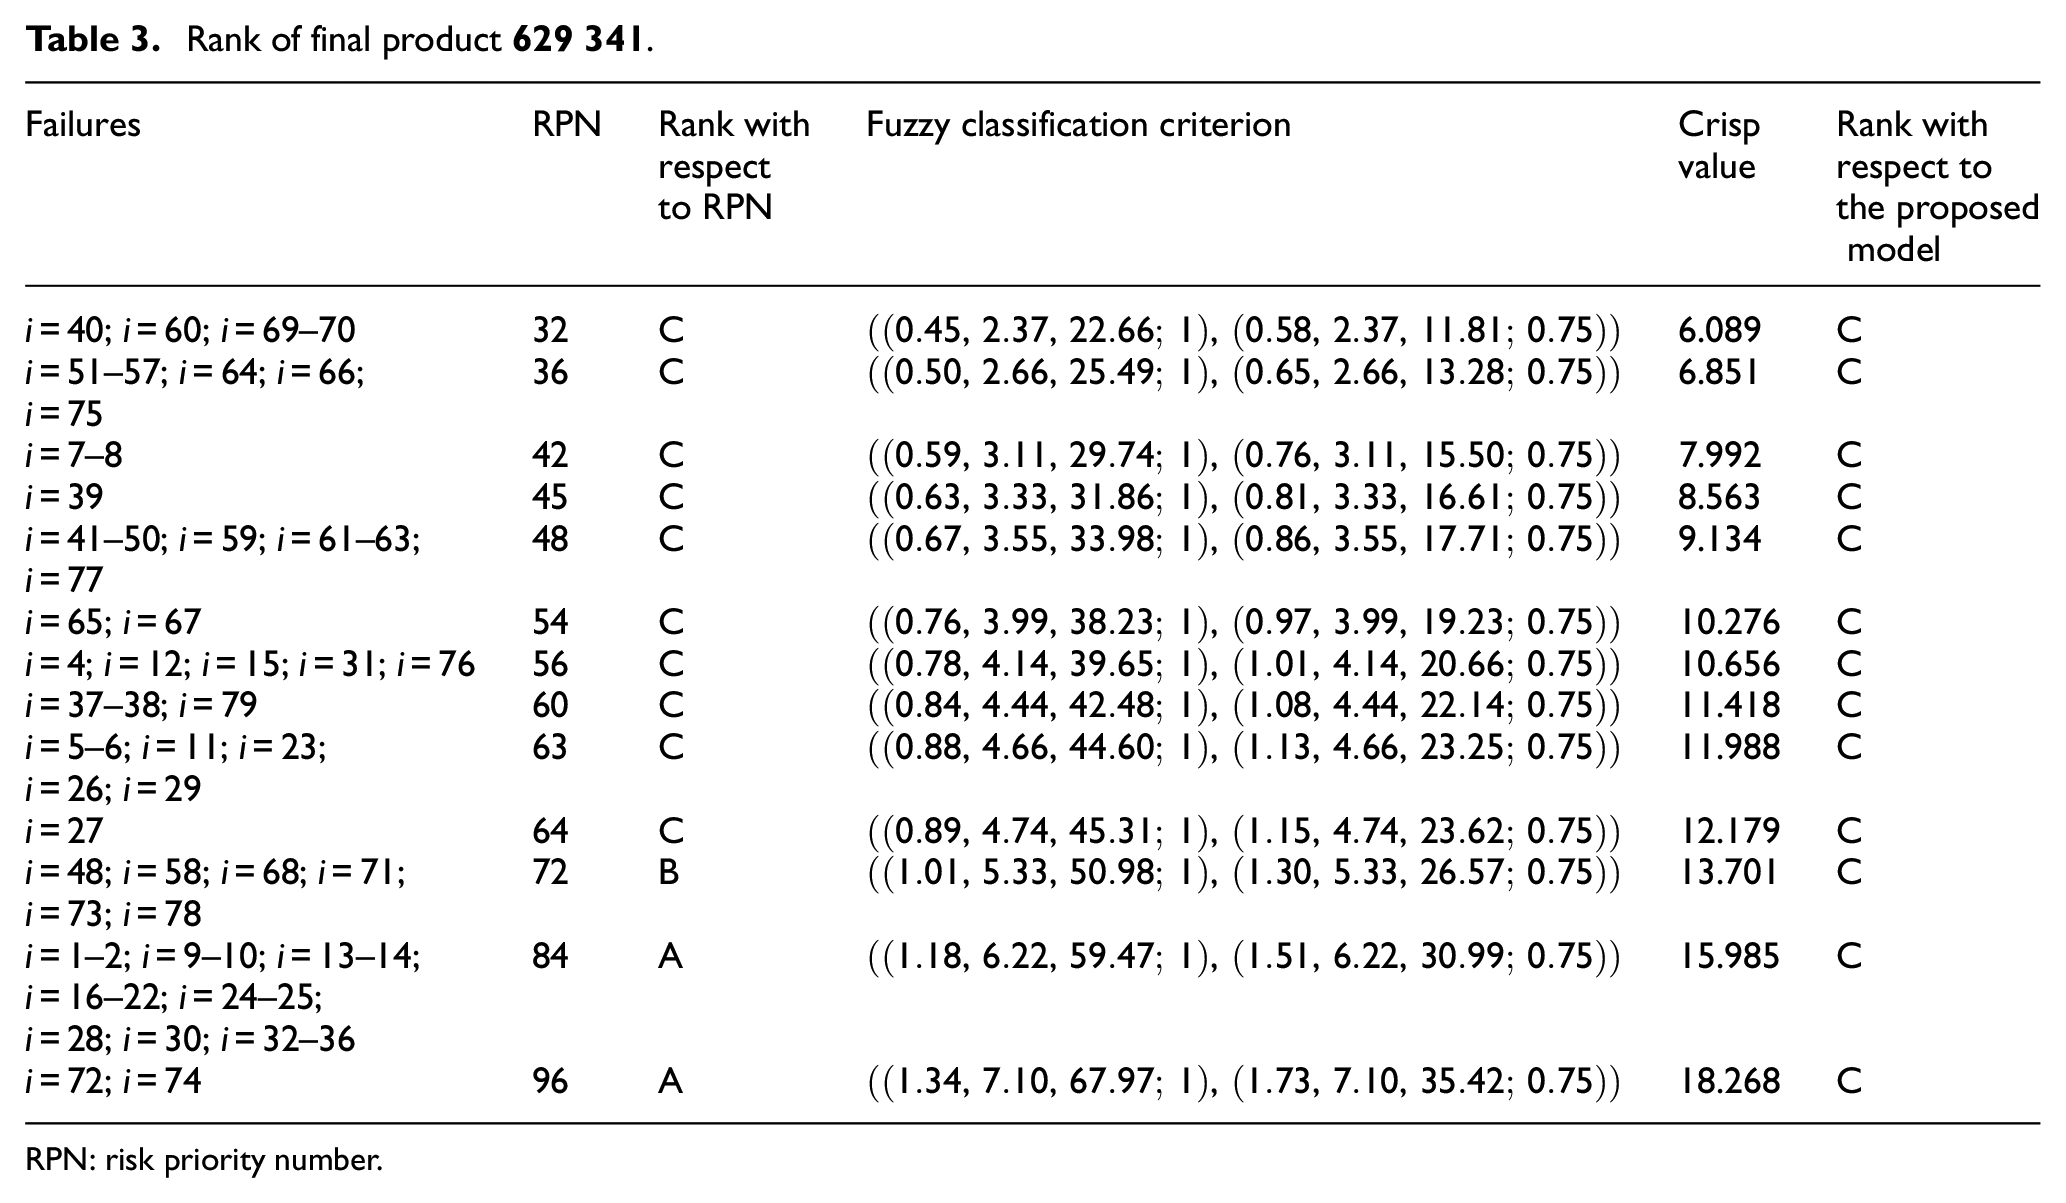
RPN: risk priority number.
Rank of final product
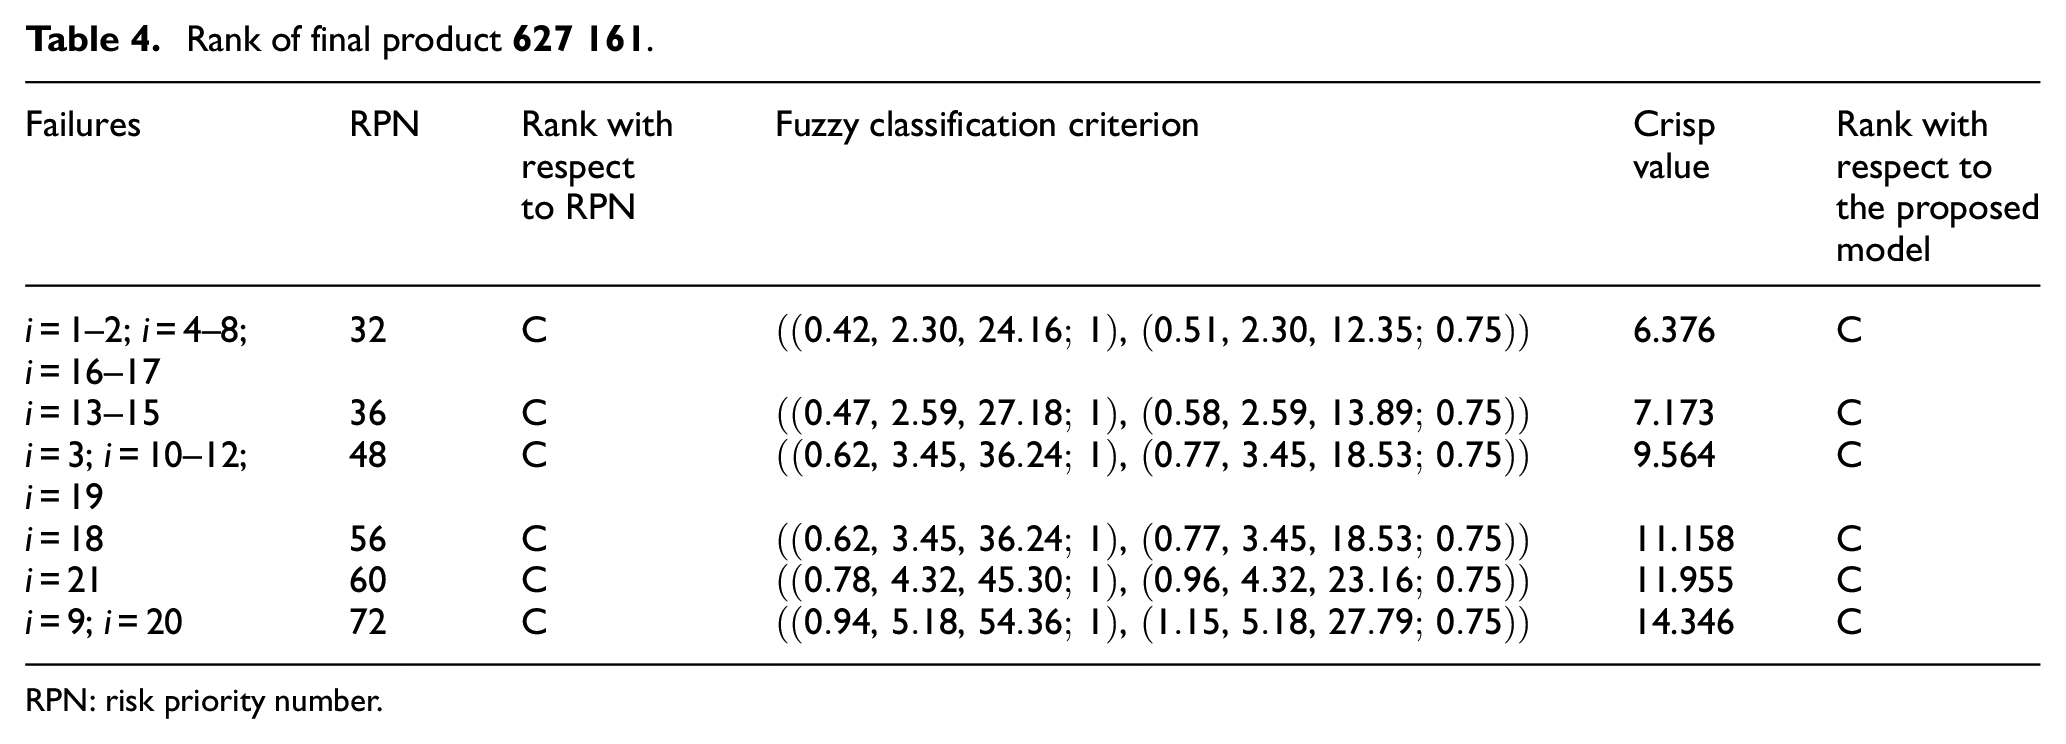
RPN: risk priority number.
By respecting the results obtained by applying the suggested model, it may be concluded that failures classified as group A are component failure, component with false value, wrong orientation of the component, mechanically damaged component, component failure on printed circuit board (PCB), use of false temperature profile, wrong temperature and speed, too much solder on solder joint, incorrect solder joint, not enough solder on solder joint, no function, skipped the final control, not sensing wrong orientated element, not sensing short circuit, wrong data on product, wrong products in the box, mixed products in the box, and quantity is false. The PFMEA team determines the actions that should lead to the reduction or elimination of the failures belonging to group A. In this way, product quality enhancement can be realized in a relatively short period of time while at the same time increasing customer satisfaction that has the utmost importance, which is further propagated to increase the competitiveness of the considered company over long time period. The obtained result is very important, given the fact that the PFMEA team has a limited amount of money that it can spend on product quality improvement activities.
Conclusion
The trends of the global market constantly introduce new demands for change in supply chains. In this way, their entities strive for enhanced effectiveness and elimination of failures. Wider business goals and mandatory demands of different standards in the automotive industry have emerged, and different risk management tools and approaches must be continuously applied within the global automotive supply chains. This research investigates the possibility for risk management activities’ improvement in the scope of failure prioritization at a PFMEA in the automotive industry.
The main contribution of the article may be structured through the following components: (1) the data centralization regarding potential failures in the production process at the enterprise level; (2) the global product preference is determined taking in account multiple-criteria decision-making (MCDA) where all uncertainties are handled by fuzzy sets theory; and (3) the rank of non-obligatory failures is determined in compliance with the value of RPN and the global product preference.
The impreciseness and uncertainties in the relative importance of the criteria and the preference of the products regarding each selected criterion are modeled by IT2TFNs. The elements of the pair-wise comparison matrices are representative scalars obtained by the application of the defuzzification method. 26 The consistency check of the decision makers’ assessment is performed by application of the Eigen vector method. The overall preference of the product is determined by application of the FAHP with IT2TFNs.
The practical implications of the research go in favor of the real situation in enterprises, since the decisions regarding improvement are not solely brought by considering only RPN. It is common sense to conclude that some products and their respected failures may have more significant impact to the overall enterprise business activities. The mathematical model presented in this article supports critical thinking and provides base for effective decision-making process.
Some limitations of the proposed model are (1) subjectivity in criteria selection which are further used to assess the preference of the final products, (2) subjectivity in the assessment of input data based on which the rank of final products and rank of non-obligatory failures are obtained, and (3) requirement for increased complexity of computation.
Future research should include (1) the selection of method which should be implemented at the level of each non-obligatory failure and (2) the development of user-friendly software tool corresponding to the proposed model.
Footnotes
Acknowledgements
This work has been fully supported by the Unity Through Knowledge Fund (UKF), 1C My First Collaboration Grant, under the project 11/17 Development of integrative procedure for management of production and service improvement process.
Declaration of conflicting interests
The author(s) declared no potential conflicts of interest with respect to the research, authorship, and/or publication of this article.
Funding
The author(s) received no financial support for the research, authorship, and/or publication of this article.