
Abstract
The lubricating oil systems are essential for ensuring the safe and reliable operation of the cruise ships power plants as demonstrated by recent incidents. The aim of this study is to investigate the safety enhancement of a cruise ship lubricating oil system by employing safety, reliability, availability and diagnosability analyses, which are based on the system functional modelling implemented in the MADe™ software. The safety analysis is implemented by combining a Failure Modes, Effects and Criticality Analysis and the systems functional Fault Tree Analysis. Subsequently, Reliability Block Diagrams are employed to estimate the system reliability and availability metrics. The MADe™ toolbox for determining sensors locations is employed for a more advanced diagnostic system development. A number of design modifications are proposed and the alternative configurations reliability metrics are estimated. The derived results demonstrate that the suction strainer and the lubricating oil pump are the most critical system components. Seven additional sensors are proposed to enhance the original system design. Compared with the original system design, the investigated alternative designs exhibit significantly lower probabilities of failure and higher values of availability.
Keywords
Introduction
According to the European Maritime Safety Agency, the injuries on passenger ships are more frequent in total number than on other ships. 1 Other findings from the same study demonstrate that a number of incidences have occurred in the engine room area. 1 At the same time, the engine room and its systems is quintessential for the ship operation as it supports critical ship functions. Any serious damage or failure in this area may lead to disastrous effects, jeopardising the health and safety of the passengers, crew and cargo. Consequently, the necessary safety precautions and corrective measures in the engine room are imperative to control and prevent potential accidents.
According to International Safety Management Code, 2 each operating company is responsible for the identification of the systems and components, the failure of which may cause hazardous implications. Safe Return to Port regulations are in place for passenger and cruise ships aiming at ensuring the availability of the ship critical systems after flooding/fire event. 3 In addition, a number of previous research studies focused on the reliability and safety analysis of marine systems. Banks et al. 4 applied Failure Modes and Effects Analysis (FMEA) method to the diesel engine for the development of relevant diagnostic systems. Lazakis et al. 5 used FMEA and Fault Tree Analysis (FTA) for main engine to develop predictive maintenance algorithms. Cicek et al. 6 used the FMEA for the ship fuel oil system safety analysis identifying the potential failure modes and developing a risk-based preventive maintenance planning. Similarly, Faturachman et al. 7 examined the possible failure modes and effects of the likely failures occurring in the fuel oil system of a marine diesel engine by using the FMEA method. Nwaoha et al. 8 used the Formal Safety Assessment framework in combination with fuzzy sets theory for safety analysis of LNG containment system. Ta et al. 9 employed the FTA technique to evaluate the reliability of the marine propulsion system. Allal et al. 10 investigated the reliability of the sea water central cooling system whilst Allal et al. 11 focused on enhancing the main engine lubricating oil system to ensure the safe operation of an autonomous ship using the FTA and FMEA methods. Komal et al. 12 implemented a fuzzy reliability analysis for dual-fuel steam turbine mechanical propulsion conventional system of Liquefied Natural Gas carriers, using FTA for system modelling. Chang et al. 13 investigated the reliability of different propulsion systems using FTA and FMEA. Cicek and Celik 14 used FMEA to analyse crankcase explosions of main engine on ships. Rokseth et al.15,16 used the System-Theoretic Process Analysis for the power system safety analysis. Bolbot et al. 17 developed and used a combinatorial approach for the exhaust gas scrubber system safety analysis. Niculita et al. 18 employed the Maintenance Aware Design environment (MADe) software tool for the fault detection and the diagnosis system development of a ship main engine fuel oil system. Lampe et al. 19 employed a model-based approach for assessing the waste heat recovery systems onboard ships, based on the energy efficiency, dependability and cost-effectiveness criteria. Pai and Prabhu Gaonkar 20 used an extension of the fuzzy sets for the safety analysis of a ship main engine fuel oil system. Asuquo et al. 21 used fuzzy sets for dynamic risk assessment of oil wetted gearbox. The influence of maintenance 4.0 on the human error probability was investigated using the Ship Operation Human Reliability Analysis method by Kandemir and Çelik 22 for ship auxiliary engines. The same method was employed to investigate the probabilities of maintenance error for crankshaft overhaul procedures in Bicen et al. 23 and for heavy fuel oil purifier overhaul in Kandemir et al. 24
Failures in the lubricating oil systems constitute potential causal factors leading to the ship propulsion loss, as demonstrated by recent blackout incident, on-board the cruise ship ‘Viking Sky’. 25 Furthermore, the lubricating oil system failures have been classified as the most frequent causes for insurance claims followed by incorrect maintenance and repairs and poor fuel management. 26 The implications of a lubricating oil system failure on passenger/cruise ships can be even more severe than for cargo ships considering the significant number of passengers and crew. 27 Hence, it is a crucial system for the passenger/cruise ships safety, and therefore needs to be meticulously analysed in terms of safety, reliability and availability.
Therefore, the aim of this research is to investigate the safety enhancement of a cruise ship lubricating oil system by employing functional modelling to support the safety and reliability analyses. The novelty of the present research study includes: (a) the use of model-based approach for a cruise ship Lubricating oil system safety enhancement; (b) the safety and reliability and availability analyses of the Lubricating oil system using the MADe™ software; (c) the recommendation of alternative system configurations and their comparative assessment with the baseline design configuration; (d) selection of sensors locations that can be used for the future development of a diagnostic system.
The remaining of this article is organised as follows. The proposed methodology is described in Section 2. In Section 3, a lubricating oil system description from a specific cruise ship is provided. The derived results are provided and discussed in Section 4. Lastly, the study conclusions are summarised in Section 5.
Methodology
Methodology overview and rationale
The MADe™ software 28 has been selected as the tool for the proposed methodology in this study for the Model-Based safety analysis due to the following reasons: (a) it allows for generating safety analysis results based on the system model much faster than using the traditional methods, 28 (b) it incorporates automated implementation of the traditional FMECA, FTA and Reliability Block Diagrams (RBDs), (c) it includes a library with the various components failure modes, which allows for more rigorous safety analysis, (d) it supports the development of diagnostic tools for the investigated system by proposing sensors locations.
FMECA and FTA are well established safety methods. FMECA is an inductive method, where each component failure impact on the system safety is independently assessed. 28 Whilst FMECA application allows for the identification of critical physical failures and ensuring that all the components failure modes are assessed, FMECA cannot capture multi-point failures. 29 For analysing multiple failures simultaneously, FTA is more suitable.29,30 However, functional FTA is implemented in MADe™ on qualitative level and redundancy in components in this Fault Tree is not properly addressed. It is also widely acknowledged that usually, but not always, reliability drives safety. When the machinery has a high level of reliability and operates smoothly, then the probability of occurrence of incidents reduces dramatically. Reliability block diagrams (RBDs) is a simple and effective way of modelling the system success/failure logic and estimating reliability 31 ; for this reason, RBDs are used in this study.
The adopted methodology to accomplish this study aim is presented in the flowchart shown in Figure 1 and consists of the following steps. In Step 1, based on the system description, the relevant data is acquired including the failure modes and the failure rates for the system components. Based on the system description, the system functional modelling is carried out in MADe™ (Step 2). This model is enriched with failure modes and diagrams in Step 3 using information from Step 1. In Step 4, a Functional Fault Tree is developed and verified; if necessary the functional model is manually modified. FMECA with the MADe™ support is conducted in Step 5. In Step 6, RBDs are automatically developed and used to estimate the reliability and availability metrics. Based on the results of Steps 5 and 6, Step 7 includes the system modification and enhancement by increasing the critical components redundancy and selecting locations for sensors, whilst the improvement in the revised system reliability is verified.
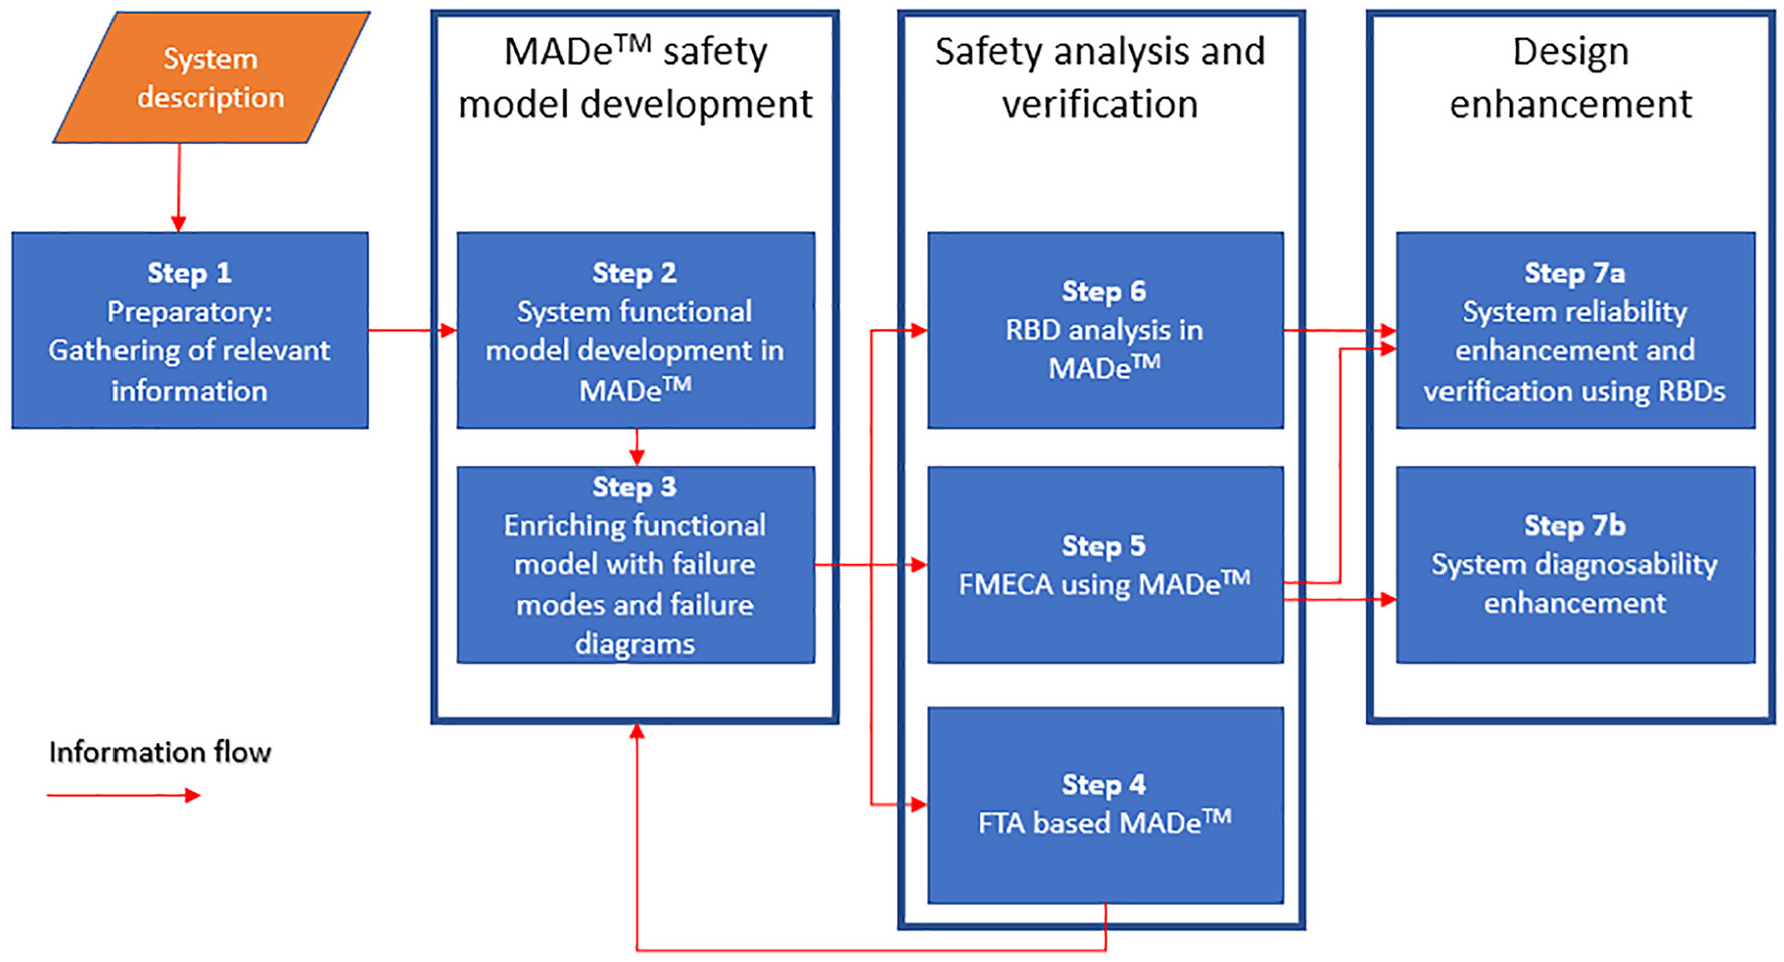
Methodology description flow chart.
Step 1: Preparatory step
For the facilitation of the safety analysis process and the criticality analysis in FMECA, the acquisition of relevant information for the investigated ship system is of great importance. The most significant and useful data to be collected is the single line diagram of the investigated system and engine room arrangement. Moreover, maintenance reports and work orders obtained from the Planned Maintenance System (PMS) are valuable for identifying the failures with the highest frequencies. The PMS is a system that is used for planning and monitoring machinery equipment overhauling and maintenance, based on manufacturers and class recommended time intervals. 32 It is also used as a database for recording service work orders as well as maintenance and failure data. 32
During the preparatory step, the failure rates, failure modes and failure modes probability for each system component and their distribution are also identified based on this information and the relevant literature.33,34 More specifically, adhering to exponential failure distribution, the failure rates and Mean Time to Repair (MTTR) of the machinery components are derived by calculating the quotient of the number of failures divided by the overall running hours. If such data is not available through accurate information in PMS, then other databases such as OREDA 34 are employed. The failure modes probability values are estimated using the long-term experience of the technical superintendents and crew on board, who during dedicated session provide these numbers. The Mean Time To Repair (MTTR) is also estimated using either OREDA or information provided by technical superintendents.
Step 2: Functional modelling
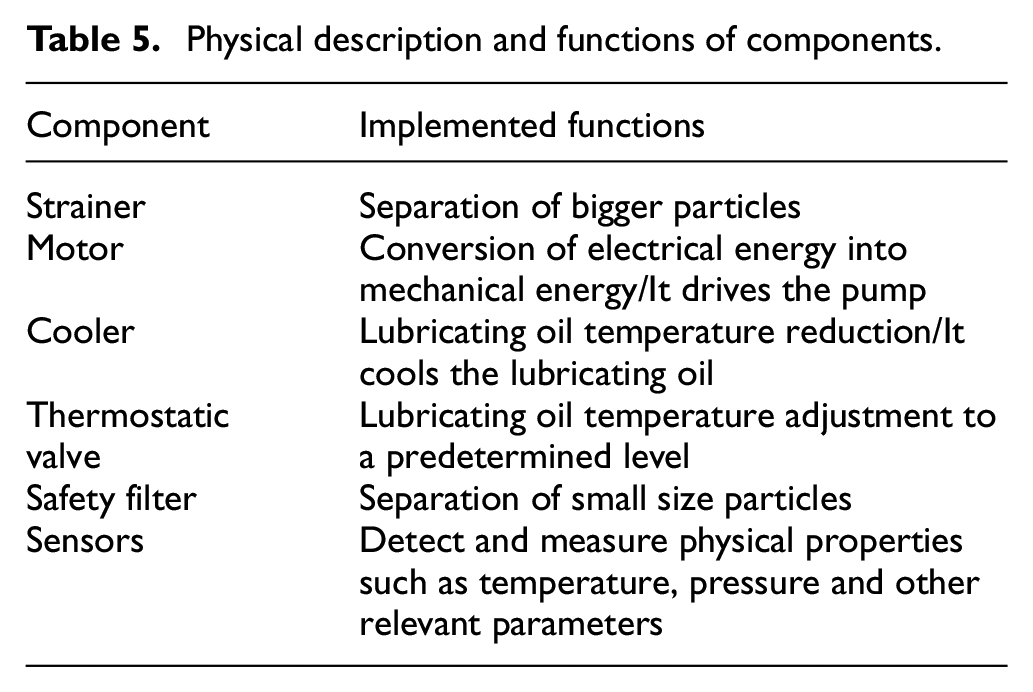
For the system functional modelling, the Functional Block Diagrams (FBD) are used by converting the simplified line diagram into a series of functional blocks in the MADe™ software. The system is then divided in subsystems and the components related to each subsystem are grouped together based on their operation. The function, the input and the output flows of the components are identified and used for interconnecting the various components and subsystems. Throughout the modelling phase, the functions and flow characteristics of the components are selected. For example, the function of the cooler is to cool (the lubricating oil), and its associated flow characteristics are the temperature, static pressure and flow rate of the lubricating oil, which must be kept at a predetermined level.
To ensure the correct selection of functions and flows, all the components are examined thoroughly, and all the physical properties involved in their operation are identified. The whole functionality and response of the system are dependent on the proper completion of the previous task. If various flow characteristics affect the operation of a component, for example, flow rate, pressure, temperature, then the most dominant ones that govern the functionality of the system must be chosen. The most dominant parameters are selected if they are affecting directly the system safety because the change in their value will cause an immediate safety alarm or will cause a system shutdown or will cause other dependent systems shutdown. So, the parameters affecting the system performance on long-term are not considered as critical.
Additionally, considering that the input and output properties of some components are different, the addition of internal causal connections has been imperative to account for these changes. These connections can either have positive or negative polarity, depending on whether the relationship between the monitored parameters is directly or inversely proportional. Figure 2 demonstrates the function of the pump motor, which is to convert the voltage to angular velocity by also considering the generic data value, and the positive causal relationships between the properties.
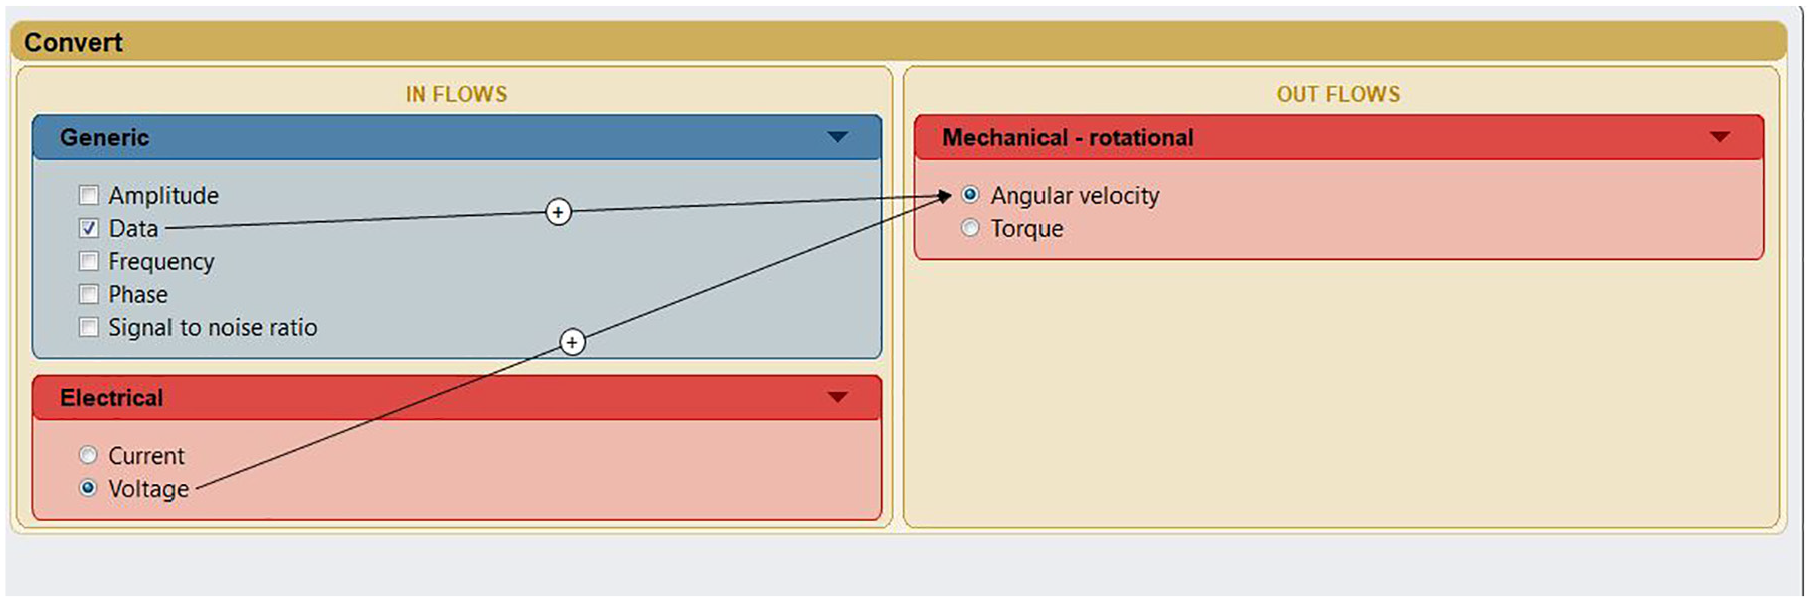
Functions, flows and causal connections of an electic motor.
Although the functional modelling is achieved through interlinking the working medium (lubricating oil) properties, for example, temperature, and by contemplating the physical phenomena occurring, for example, energy transformation, it should be emphasised that the model captures the components functionality and does not model the actual transformation in detail, for example, using first principles equations.
Step 3: Enriching functional model with failure modes and diagrams and simulations
Step 3 involves the examination of all the failure root causes that might lead to a system malfunction. The MADe™ software uses failure diagrams to account for these failure modes. A set of failure causes, mechanisms and faults are used for the failure diagram generation. The failure causes are placed at the top of the failure diagrams. A series of failure causes are connected with an ‘OR’ gate, indicating that one of these causes can lead to the failure mechanism. Subsequently, the failure mechanism is linked with the related faults, also used as failure modes. Lastly, the failure modes are connected with the flow properties in a proportional or inversely proportional manner, depending on the polarity of the causal relationship. This is necessary to depict how each failure mode will affect the functional model behaviour. An example of the failure diagram is schematically depicted in Figure 3.
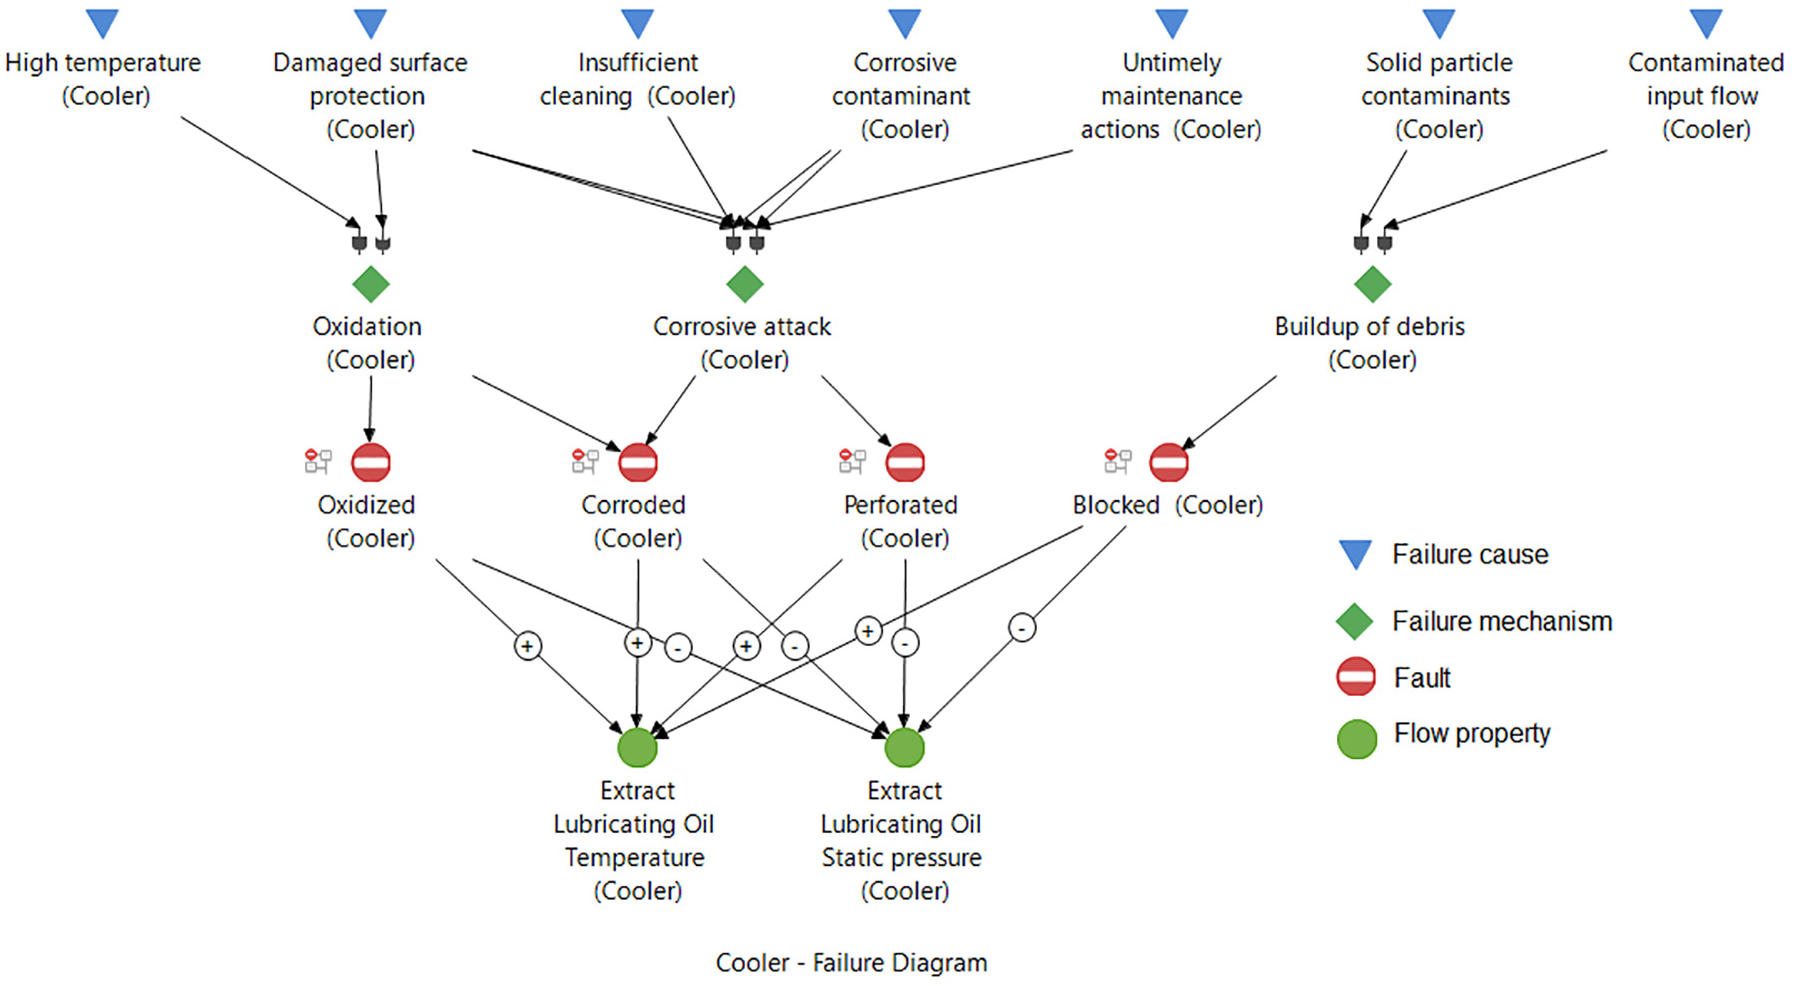
Failure causes and mechanisms.
Step 4: Functional FTA
Following the generation of the failure diagrams for all the system components at the previous step, a Functional FTA is performed as part of the safety analysis. The Fault Tree (FT) is automatically generated by MADe™ by analysing all the functional dependencies that have been defined in the functional model. The FTs, along with the failures simulations are critically reviewed and are used for verifying the developed model as per MADe™ guidance. In this way, the accuracy of the results in other steps is ensured.
Step 5: FMECA based on model simulations
Following the model verification using Fault Tree, the failure simulations are carried out. The functional connections between the components as well as the developed model functional failures, which have been previously defined, are processed by MADe™ using the ‘Fuzzy Cognitive Map’ (FCM) 35 method. A matrix containing the causal connections between the input and output flow properties is automatically generated in MADe™ and is utilised for the ‘failure propagation’ simulation. The reasoning behind this technique is that any component can be used in the simulation process by injecting a deliberate failure, through altering the functional flow behaviour. The consequences of this failure are then reflected in the final system response.
The safety analysis is conducted for the investigated system using the FMECA. The risk priority number and the criticality analysis based on MIL-STD-1629A 36 are widely used in the industry; however, the latter approach is adopted herein due to the required data availability.
The values of failure mode ratios and failure effect probabilities are used for the calculation of the failure mode criticality number

where
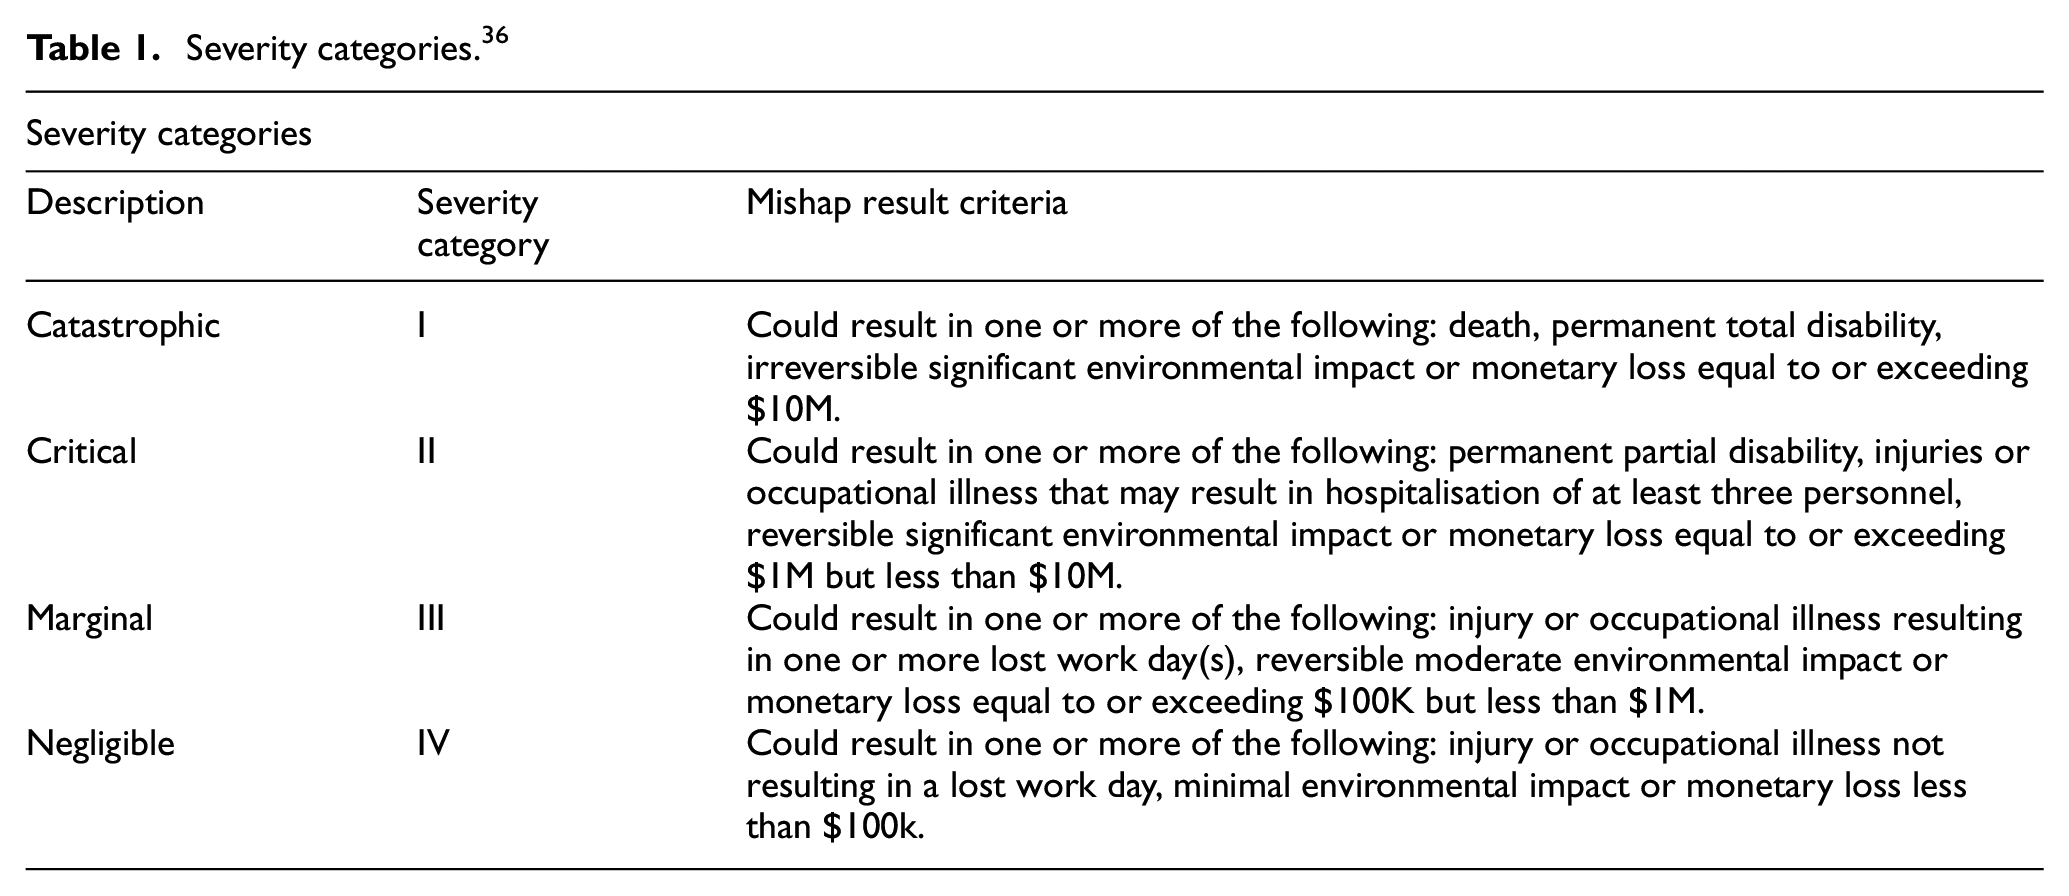
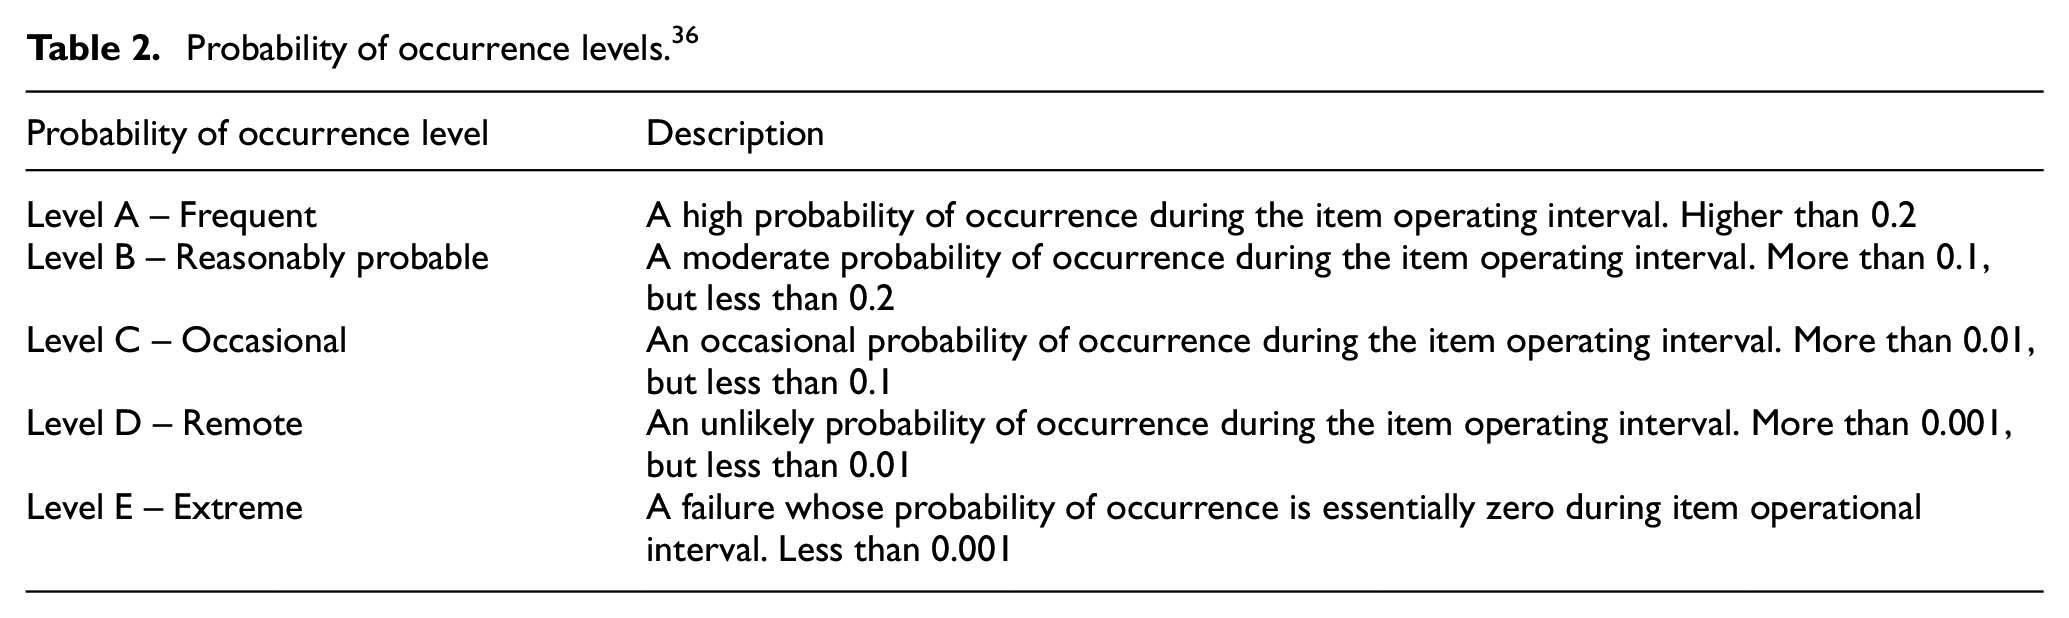
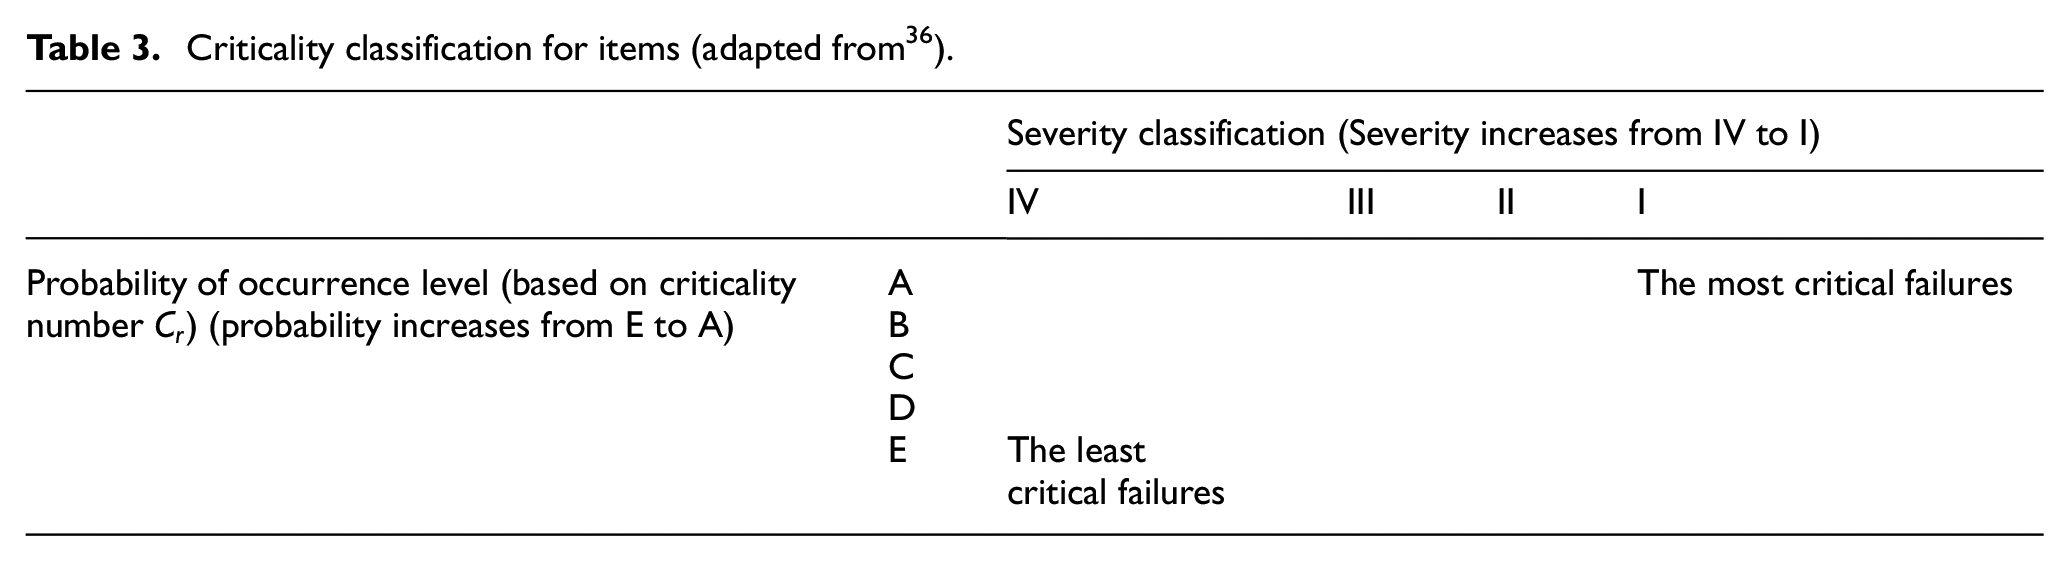
The severity for each failure is determined according to the categories presented in Table 1. The ranking of the system components based on their criticality value was used as a factor for prioritising the reliability improvement of the components. The employed probabilities of occurrence levels are based on MIL-STD-1629 36 and are presented in Table 2. The criticality of each system component is defined using the classification presented in Table 3.
Severity categories. 36
Probability of occurrence levels. 36
Criticality classification for items (adapted from 36 ).
Step 6: RBD Analysis
The analysis of system reliability is supported by the development of the respective RBDs, which portray the system as a set of ‘black boxes’. 38 The reliability values assigned for each block are automatically calculated by the MADe™ software, depending on the group selection, for example, Series, Parallel and the associated values of failure rates and time of each component. The most common reliability groups used for the construction of the RBDs are the ‘Series’ and the ‘Cold Standby Redundancy’ groups. The former ones are used in the cases where all the blocks must be functional to achieve normal operation, whereas the latter ones are used where redundant components are present. The ‘Parallel’, the ‘Complex’ and the ‘K/N Redundancy’ groups can also be used, depending on the configuration of each system. The RBDs development enables the calculation of the Probability of Failure (P(f)) and the Reliability Importance (RI) metrics. P(f) express the unreliability of the components, whereas the RI of each component denotes the impact of the component on the overall reliability of the system. RBDs are also developed for the investigated systems alternative configurations specified in Step 7.
For the facilitation of the reliability and availability analyses, the following assumptions are made:
The failure rates, which have been acquired in previous steps and used for the reliability and availability analyses, are exponentially distributed;
The maintenance of the machinery begins immediately after a failure;
The crew has the technical expertise and the required tools to perform maintenance tasks;
The stand-by components cannot fail in the idle condition and they possess identical constant failure rates as the main components;
The two middle assumptions indicate that the maintenance intervals are not affected by the management decisions, thus the delay and turnaround time can be set to 0.
Equations (3) and (4) 39 are used for the calculation of the reliability and operational availability values. These equations are in line with the assumption that components’ failures follow exponential distributions, and that the delay time and turnaround time are equal to 0.

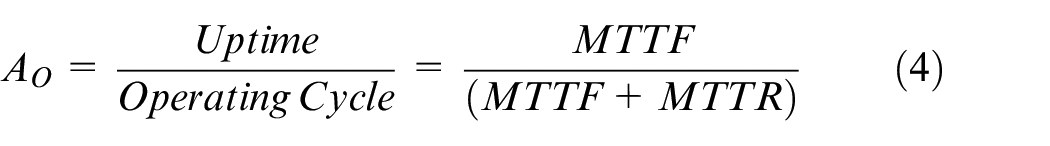
where MTTF is mean time to failure, MTTR is mean time to repair,
Reliability importance (RI) is also used for the identification of critical components. It is estimated as 39 :
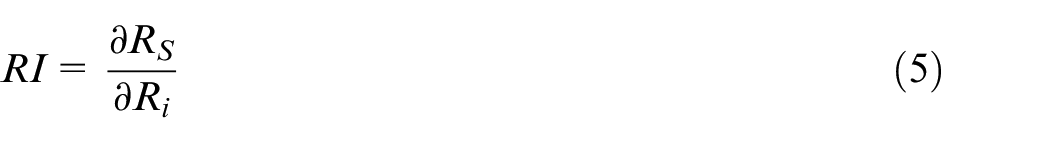
Where
Step 7: Design enhancement
The investigated system design enhancement aims to increase the reliability and diagnosability of the system.
System reliability improvement
To increase the system reliability during the design phase, the following two approaches can be used: the fault avoidance and the fault tolerance approaches. The first approach employs the usage of high quality and reliability materials for eluding failures. However, this approach is not trustworthy enough to be applied in this study, as it cannot protect against random and design failures. This study employs the second method, which is extensively adopted by the aerospace 40 and automotive 41 industries, as it can cover a broader range of failure modes, 42 primarily through reliability increase.
Once all the different system design changes are modelled, a revised RBD analysis is performed for each enhanced system configuration. The purpose of this analysis is to compare the enhanced system configurations reliability metrics with the ones of the baseline configuration.
System diagnosability enhancement
A sensor set diagnostic analysis is performed in order to optimise the coverage for faults and failures of the existing system in the diagnostic system. Firstly, the location of the built-in sensors is collected from the ship engine room drawings. Thereafter, an automated sensor set diagnostic analysis is initiated by defining the critical failure modes and components to be used in MADe™. A propagation table is used in combination with a genetic algorithm for the generation of sensor sets which satisfy the coverage needs of the system. After numerous iterations and analyses are completed, the desired sensors set with the minimum number of sensed test points is derived. Based on the system critical components identified through FMECA, the additional sensor locations are selected. These sensors along with their corresponding flow properties, are then modelled as information input points for the diagnostic system.
Case study
System description
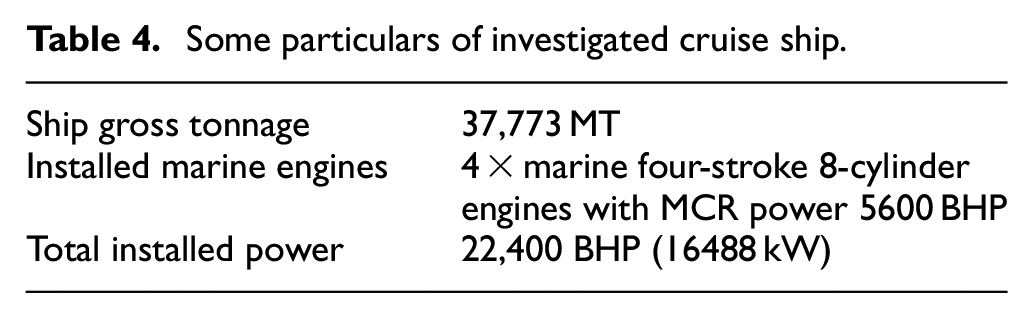
An anonymous cruise ship lubricating oil system depicted in Figure 4 was selected for the analysis in this case study. Some of the ship particulars are provided in Table 4. Table 5 provides the physical description and the functions of some of the system components. The investigated ship was designed with only one engine room space, which is not compliant with the safe return to port regulations. The ship power plant includes four main diesel engines with individual lubricating systems for each one.
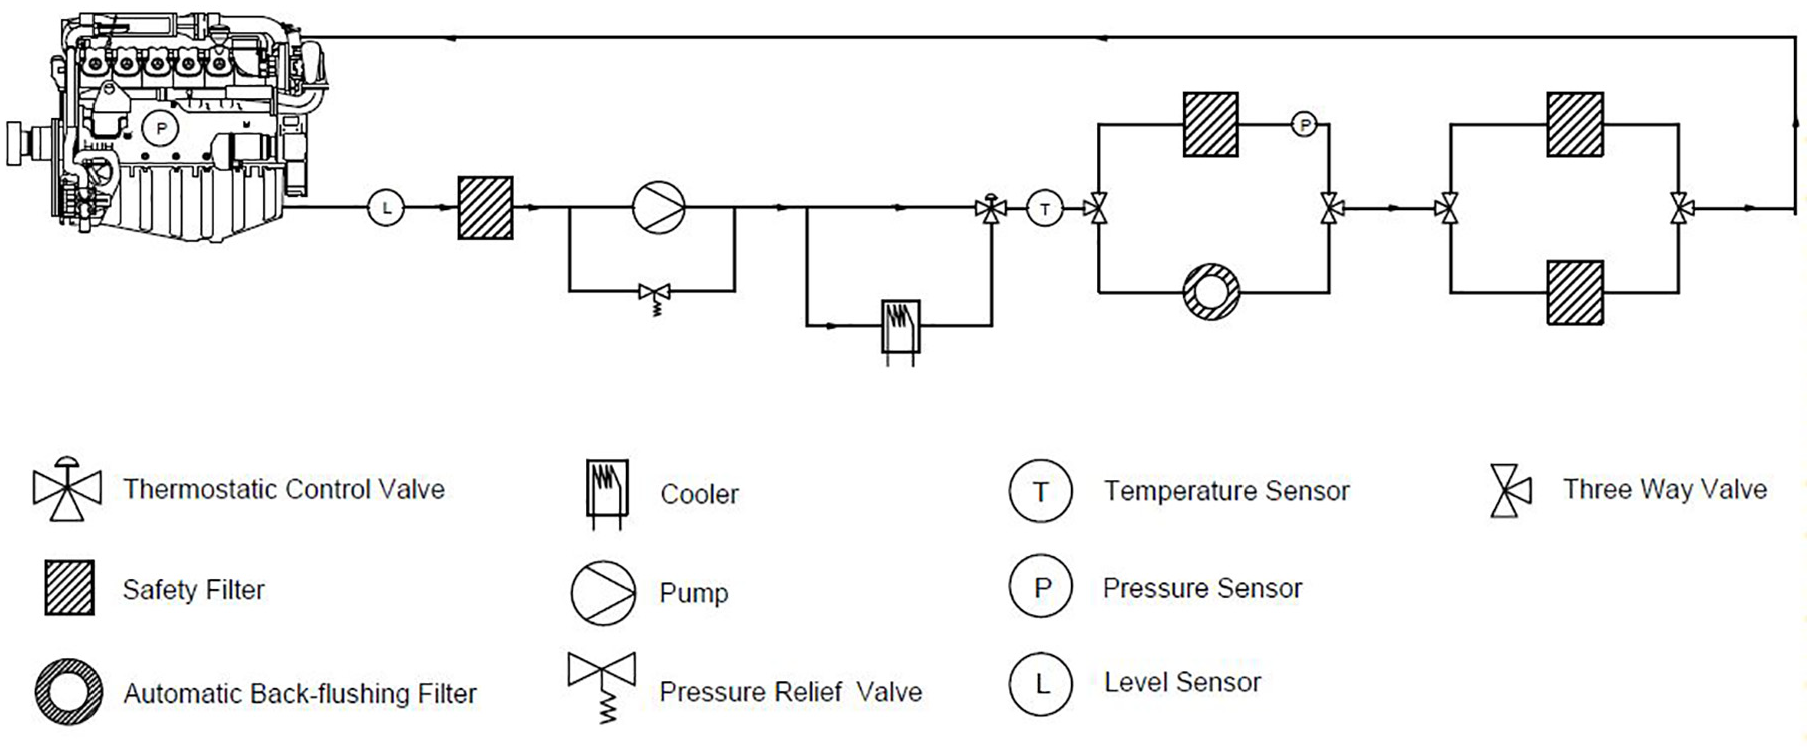
Simplified line diagram of lubricating oil system.
Some particulars of investigated cruise ship.
Physical description and functions of components.
The lubricating oil system for each engine includes the following components: storage tanks, butterfly valves, ball valves, automatic regulating valves, pressure gauges, thermometers, sounding pipes, filters, flexible connections, piping, lubricating oil coolers, lubricating oil pumps, suction strainers, filters and transfer pumps. Four sensors are currently installed, and their types and locations are as follows: (1) a level sensor is located in the sump tank providing information on the lubricating oil level (alarm is generated for low level values), (2) a temperature sensor is placed after the thermostatic control valve for ensuring that the cooling subsystem functions properly, (3) a pressure sensor is situated after the manual filter for measuring the LO pressure and (4) a pressure sensor is mounted in the diesel engine for gauging the incoming LO pressure. These sensors are interconnected with the engine monitoring and control system; they are used as means for transmitting alarms to the engine control room, activating the stand-by pump in case of low pressure and reducing the engine load or even shutting down the diesel engine at emergency situations.
The lubricating oil is transferred from the storage tanks to the main engine sump tank via a transfer pump. The lubricating oil is pumped from the sump tank by the means of the lubricating oil system pump flowing through the suction strainer, the pump, the cooler, the filtering assembly, which consists of an automatic back-flushing filter and a safety duplex filter, until it finally enters the main engine (typically at a pressure around 5 bar and a temperature around 42°C). Once the lubricating oil is circulated inside the main engine, having lubricated and cleaned the internal moving engine parts, it is drained back to the sump tank.
Analysis input
The input data used for this analysis was the operating time (t), the failure rates (λ), the failure mode ratios (α), the failure effect probabilities (β) and the severity values of the equipment. The operating time of the whole system was set to 13 h, the maximum time needed for the cruise ship to travel from one destination to another.
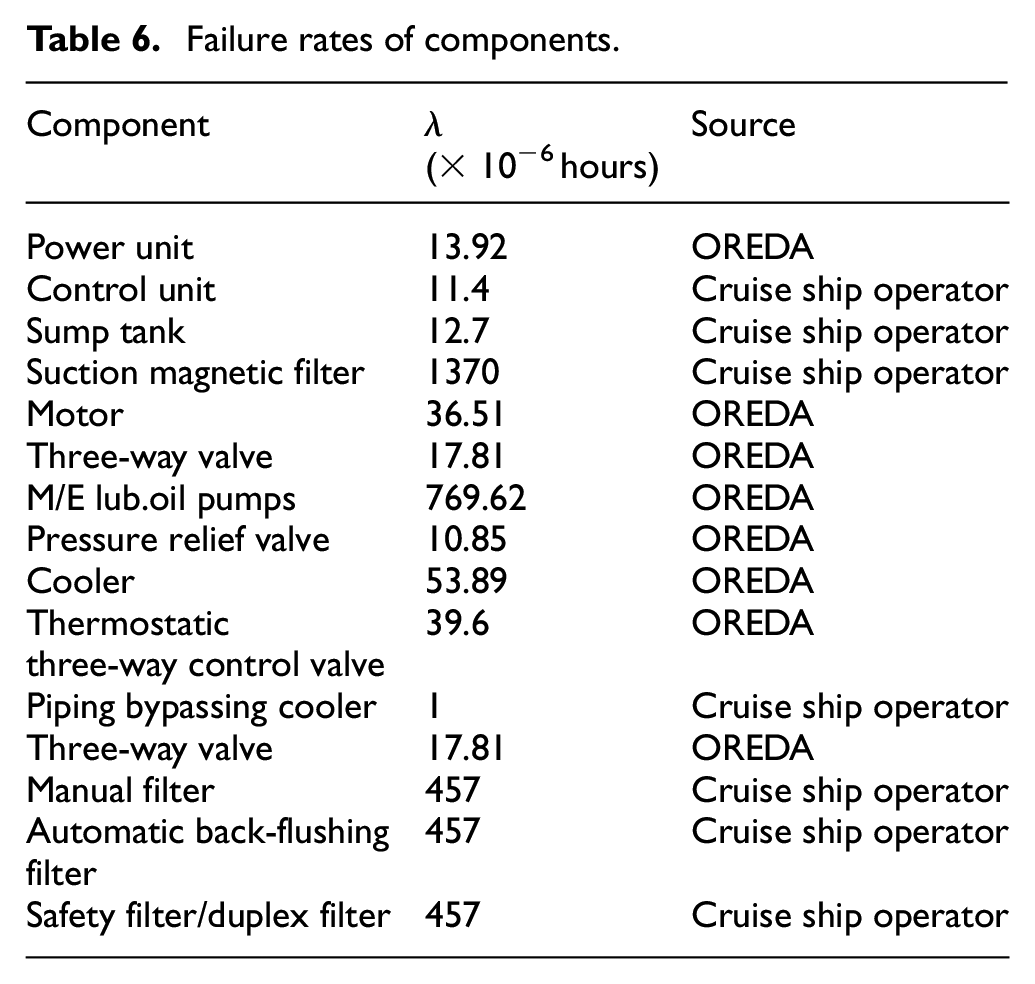
As far as the failure rates are concerned, it was assumed that they were collected during the ‘useful life’ phase of the components and that they were related to random failures, that is, the middle region of the bathtub curve. The failure rates were obtained both from the statistical reliability handbooks and by analysing the cruise ship operator historical data. Table 6 illustrates the failure rates of the several components along with their corresponding source. Additionally, the failure mode ratios and the failure effect probabilities were exclusively acquired from the cruise ship operating company, based on previous failure records over 7 years of ship operation and the experience of the on-board marine engineers.
Failure rates of components.
Study assumptions/limitations
For analysis purposes the following assumptions are considered:
Interactions with humans, such as human errors leading to lubricating oil system shut down, are out of the scope of this study.
It is assumed that the maintenance is implemented according to maintenance manuals and there is no variation in maintenance quality attributed to the skills of the relevant personnel, so average time to repair values can be used.
It is assummed that components follow exponential probability distribution for failure rate.
It is assumed that there is no delay time and no turnaround time during maintenance.
The potential software failure modes for the controllers are excluded from the analysis.
System decomposition ends at subsystems and components level. The components parts failure modes are considered at respective component level.
Some components of minor importance, such as the piping, are excluded from the block diagram as their reliability values do not significantly contribute to the overall reliability of the system.
An additional limitation is the use of OREDA database as a complementary source of failure rates.
The sensors failure rates are not considered in the reliability analysis, as the system is expected to be operational even if sensors fail.
Results and discussion
Step 2: Functional modelling
The most important properties of the lubricating oil system are the temperature and the pressure of the lubricating oil entering the diesel engine, as in cases where they exceed specific thresholds, the system will first generate an alarm and will subsequently shutdown. For this reason, the selection of the functional interdependencies between the components was performed by contemplating the linkage of these two properties along the system. Composition, solids, metal traces are also important properties; but they are studied along with other properties (metal traces) or excluded from analysis (solids, composition) as their monitoring is achieved by testing the lubricating oil.
Following the approach described in Section 2.3, the functions and flows of the system components are modelled. Figures 5 to 7 outline the functional interrelationships of the cooling, filtering and pumping subsystems, respectively. The blue lines represent the data transmission throughout the system, the green lines represent the flow of properties of the lubricating oil, for example, contamination, static pressure, temperature, flow rate and most of the red lines represent the supply of electrical voltage to the various components. For the pumping subsystem, the red line leaving the motor represents the angular velocity provided to the pump.
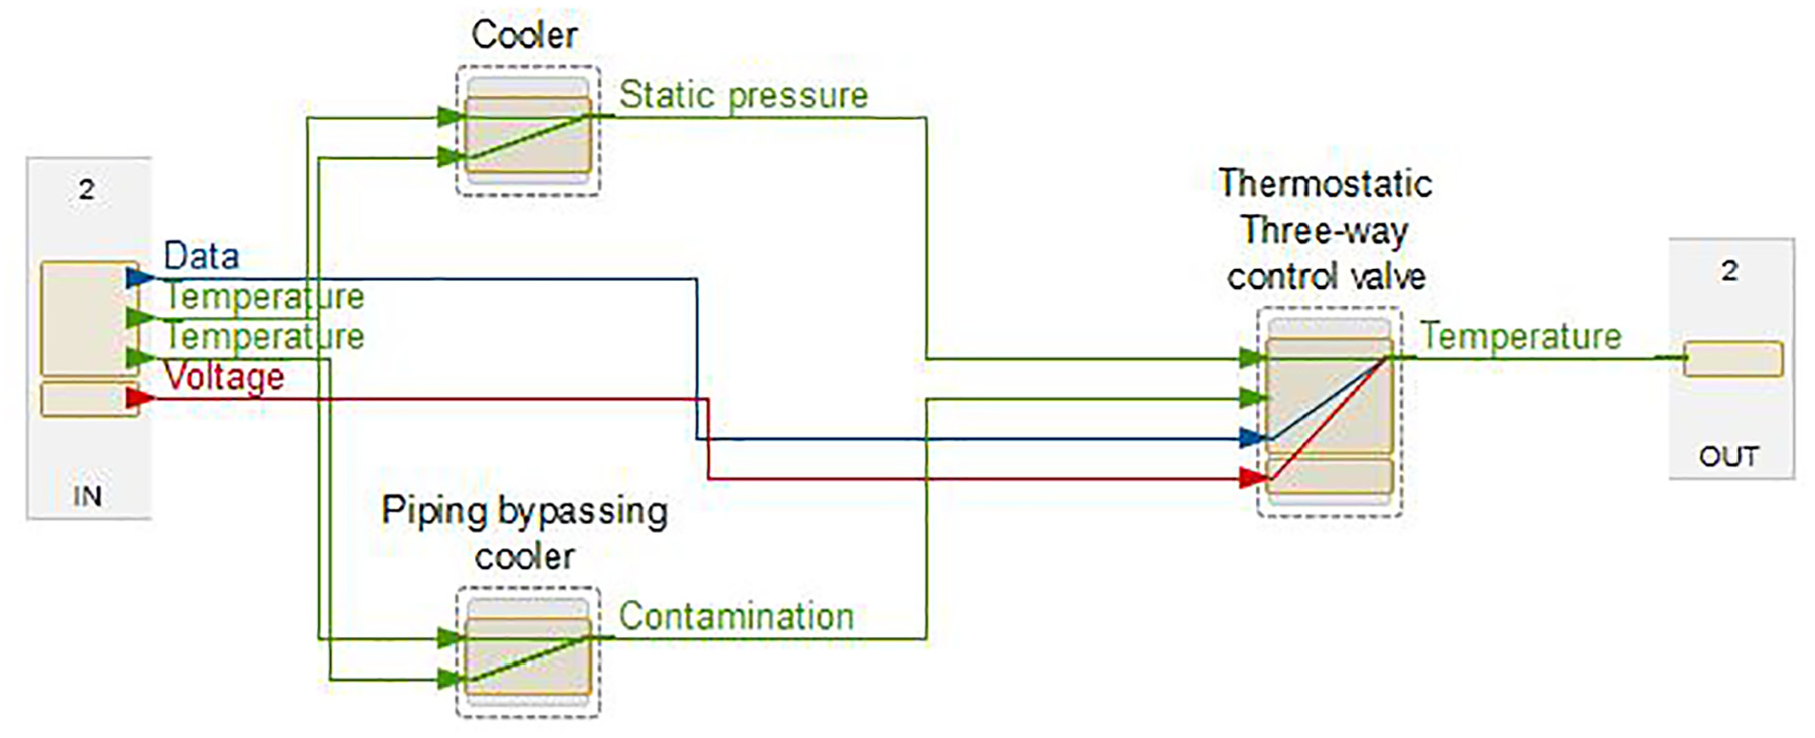
Cooling subsystem functional representation.
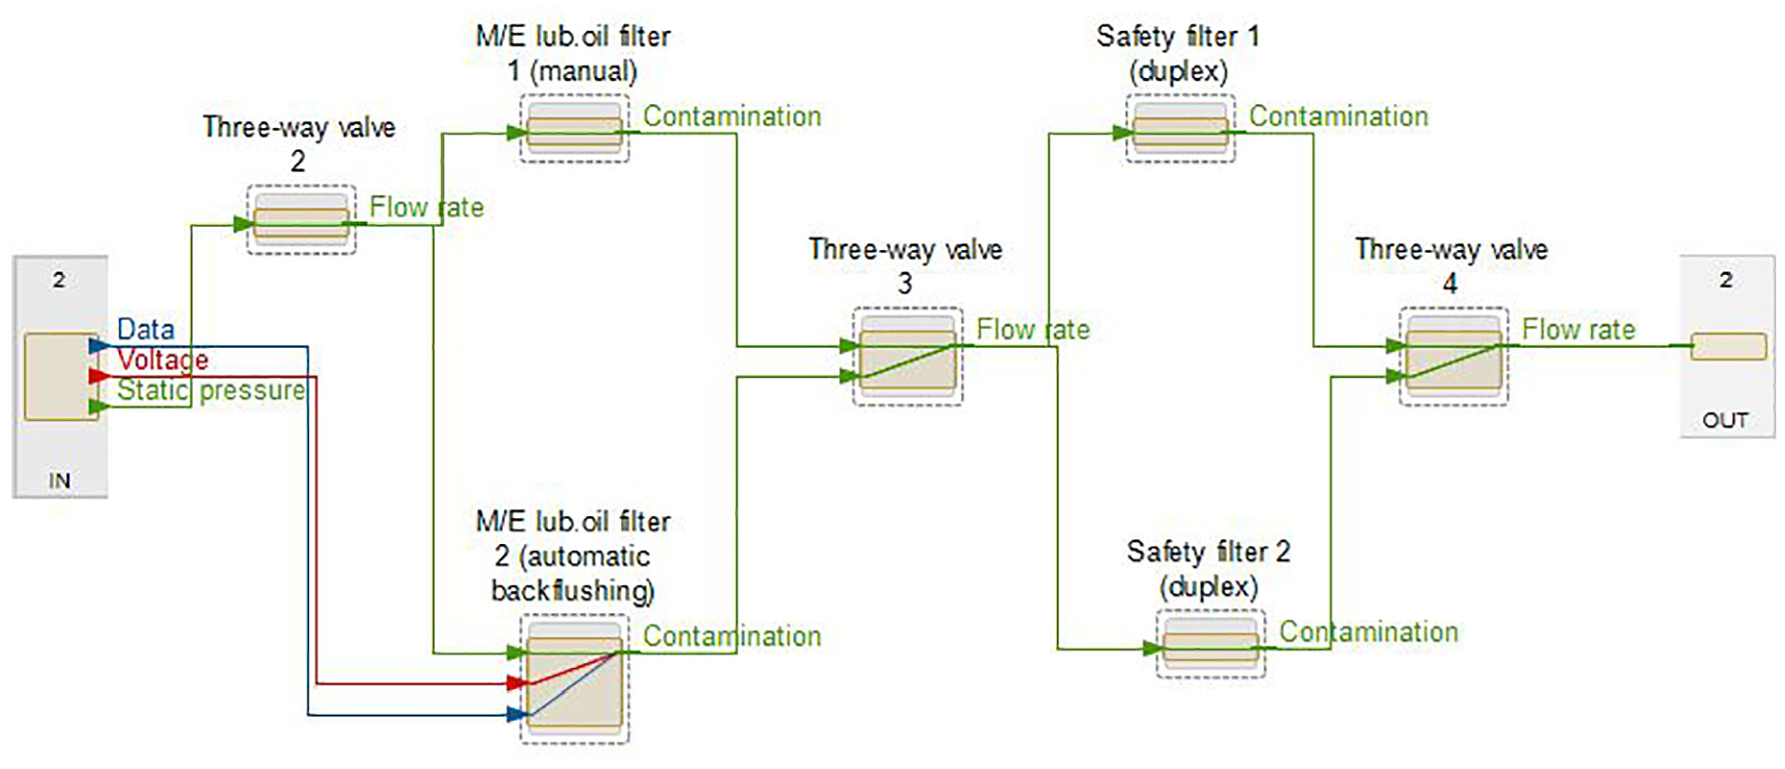
Filtering subsystem functional representation.
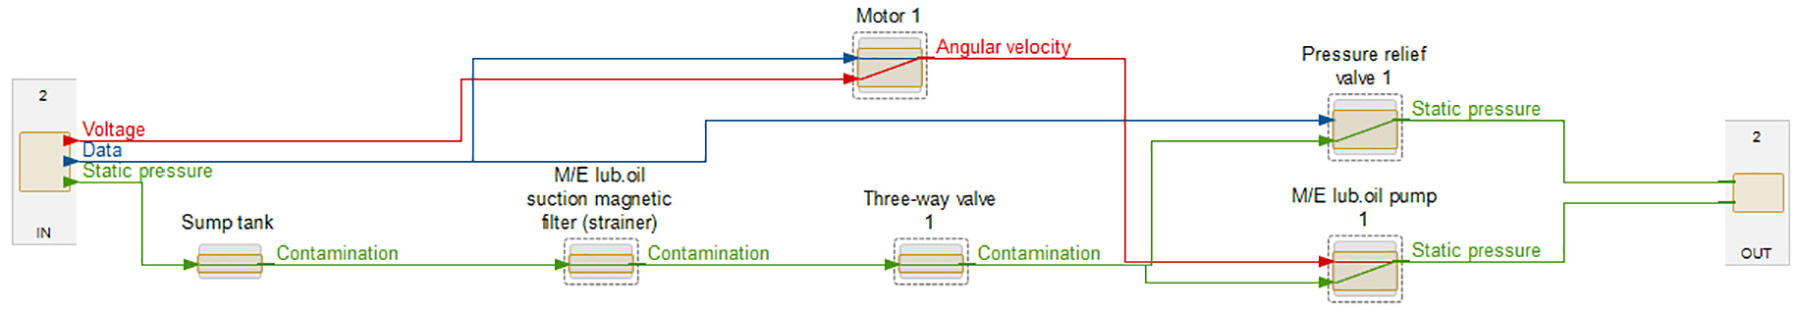
Pumping subsystem functional representation.
The system was divided in three subsystems, the pumping, the cooling and the filtering subsystems. Moreover, the power and control units were included in this model as they are valuable components, providing the required power and signals to the system correspondingly. The components related to each subsystem were grouped together based on their operation. The ‘IN’ and ‘OUT’ blocks, depicted in Figures 5 to 7, represent the gateways for interconnecting the systems with different Level of Indenture. Accounting for the inversely proportional relationship of the temperature and the flow rate, the thermostatic valve was modelled by adding a negative polarity connection between the two properties. Figure 8 illustrates the functional representation of the whole system, consisting of the power unit, the control unit, the pumping, cooling and filtering subsystems and the diesel engine.
Investigated LO system functional representation.
Step 3: Enriching functional model with failure modes and diagrams and simulations
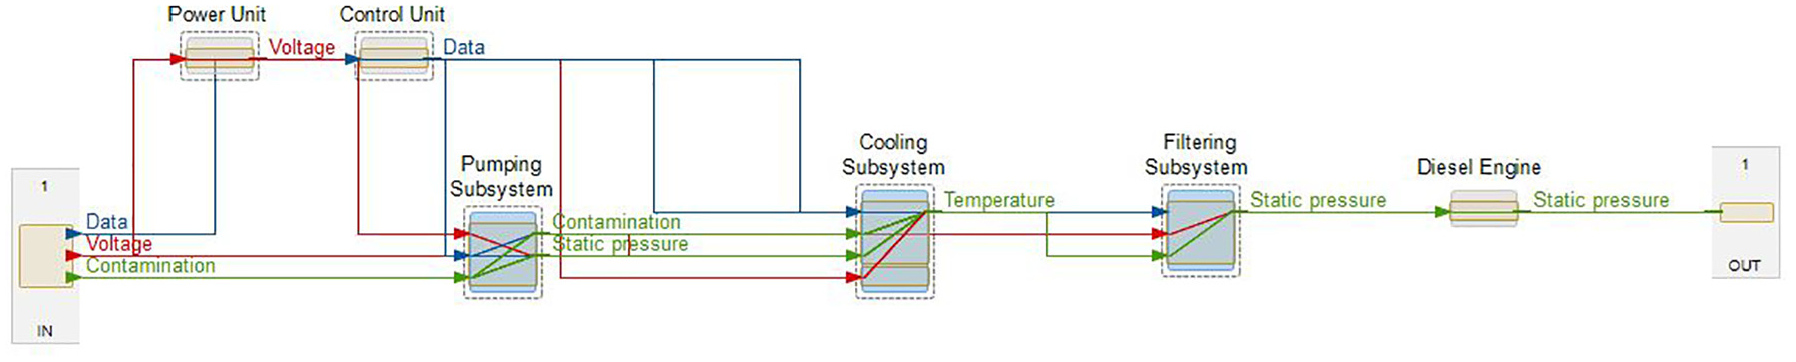
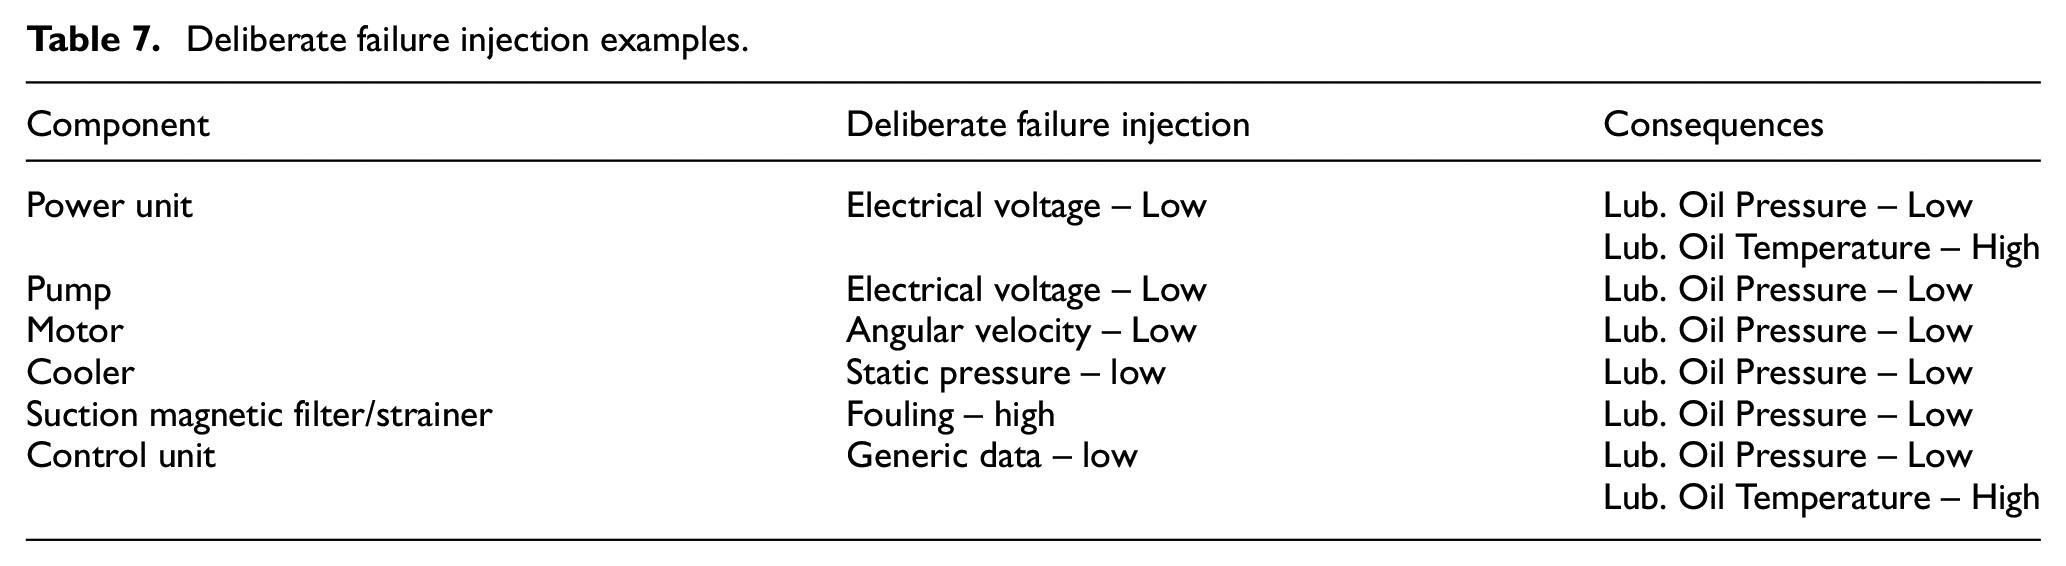
Figure 9 shows a deliberate failure injection in the power unit, realised by supplying low electrical voltage to the power unit. It is apparent that a drop in the electrical voltage has severe consequences for the system. Firstly, the static pressure along the system decreases due to the unavailability of the pump motor to function properly. Secondly, a potential increase in the lubricating oil temperature occurs, as the thermostatic three-way control valve no longer operates satisfactorily. Table 7 shows some additional examples of deliberate failure injection along with the equivalent consequences to the lubricating oil system. The identified failure modes are presented in Table 8 together with FMECA results.
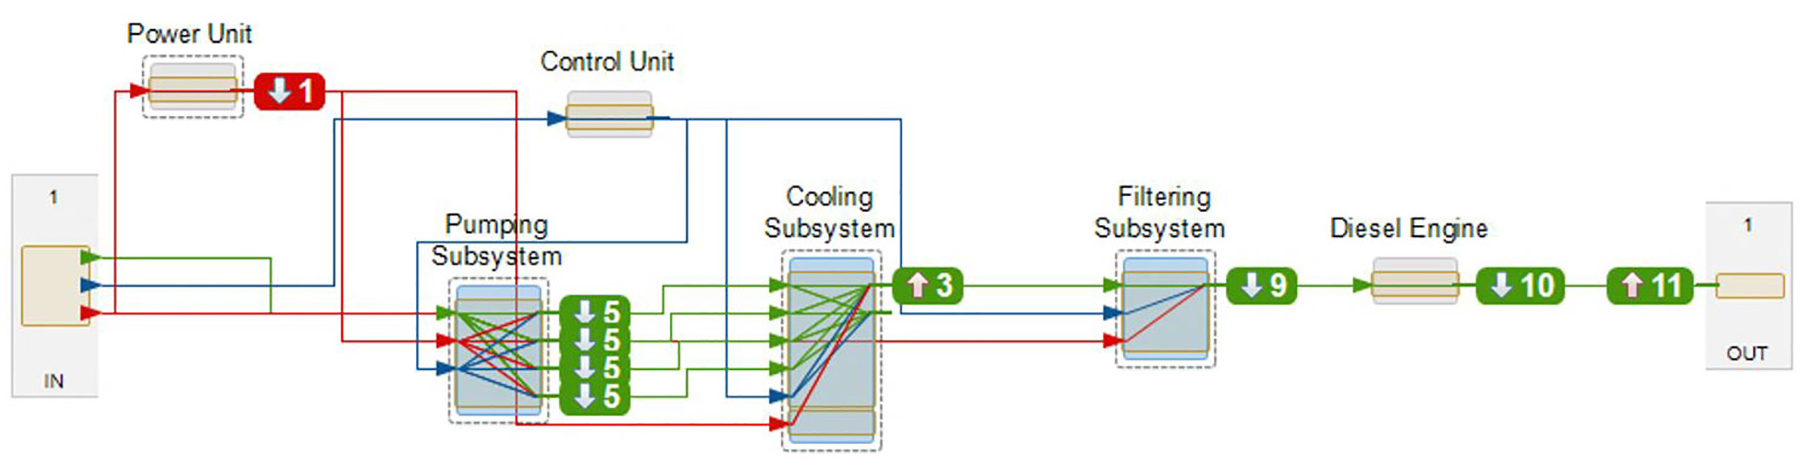
Failure propagation within the system.
Deliberate failure injection examples.
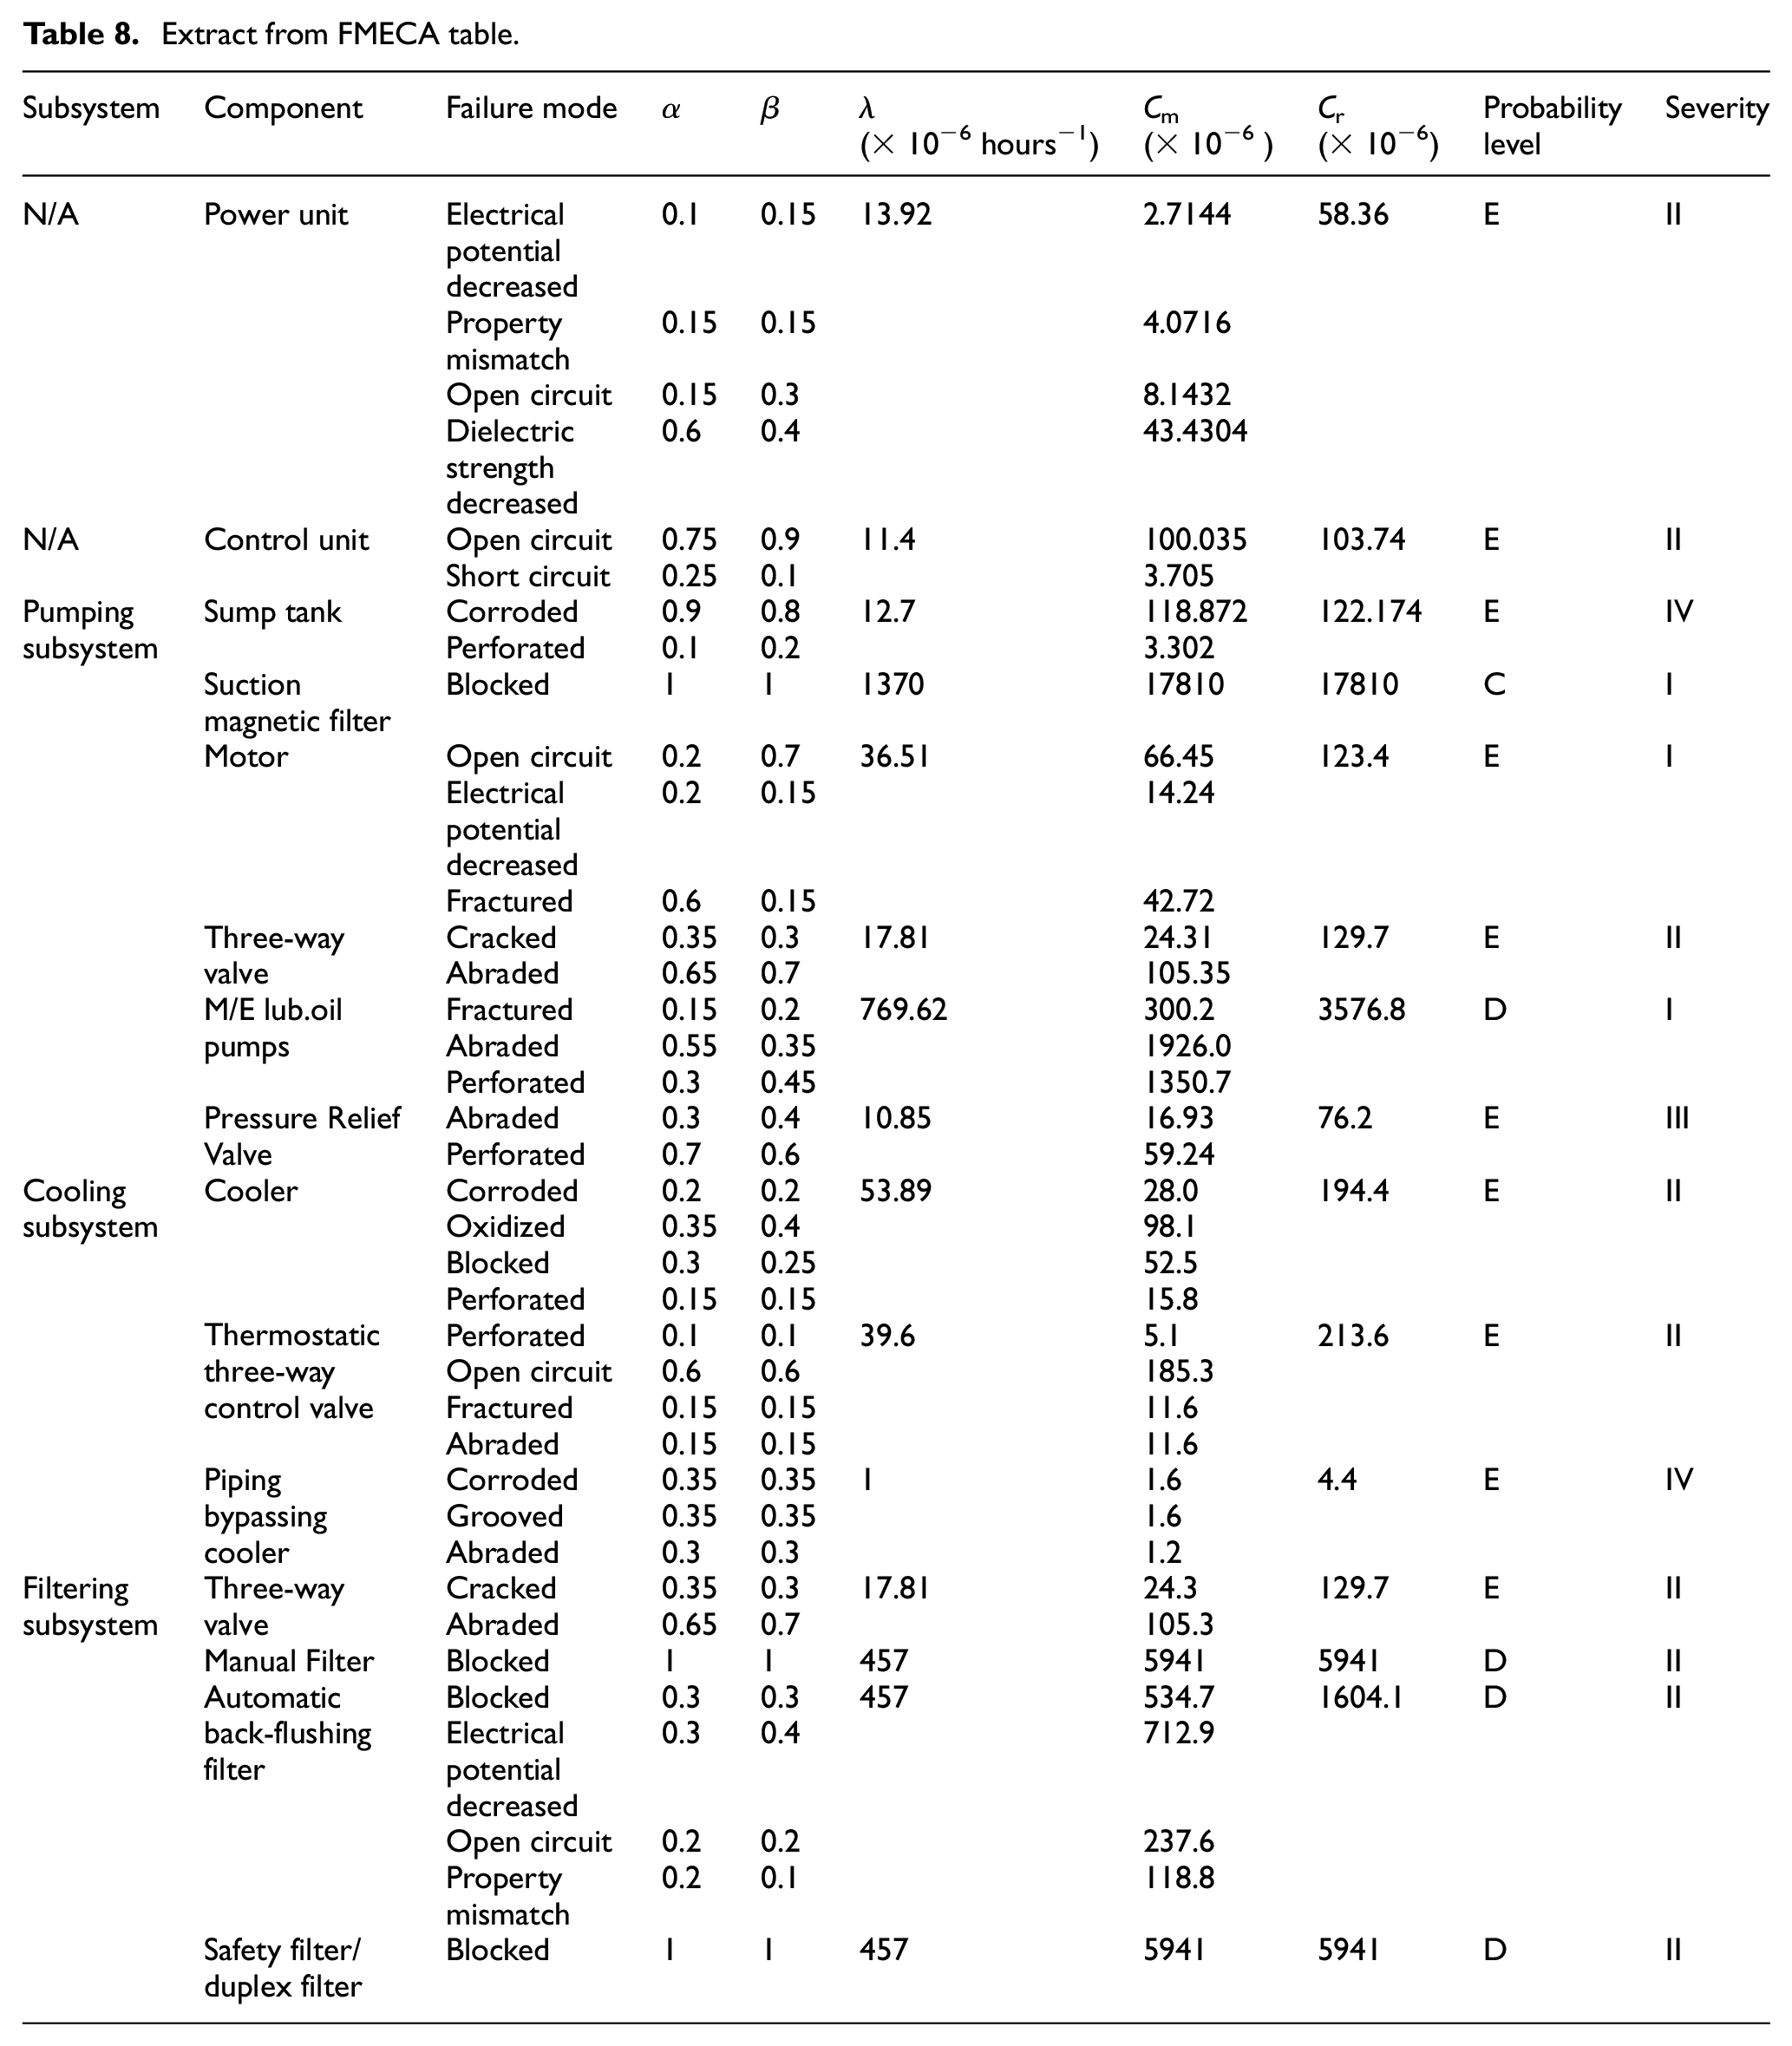
Extract from FMECA table.
Step 4: Functional FTA
As discussed in Section 4.1, the top events highly relevant for the investigated LO system are the ‘Low Lubricating Oil Pressure’ and the ‘High Lubricating Oil Temperature’ events, as they lead to automatic engine shutdown. Figure 10 displays a Fault Tree for the ‘Low Lubricating Oil Pressure’ top event. The FTA results significantly contributed to the validation of the system model, as the Fault Tree structure revealed that the developed model required some minor changes. The minor changes which were implemented were the adjustment of the flow properties for each component and the interconnections between the components in order to accurately represent the system’s actual behaviour/operation.
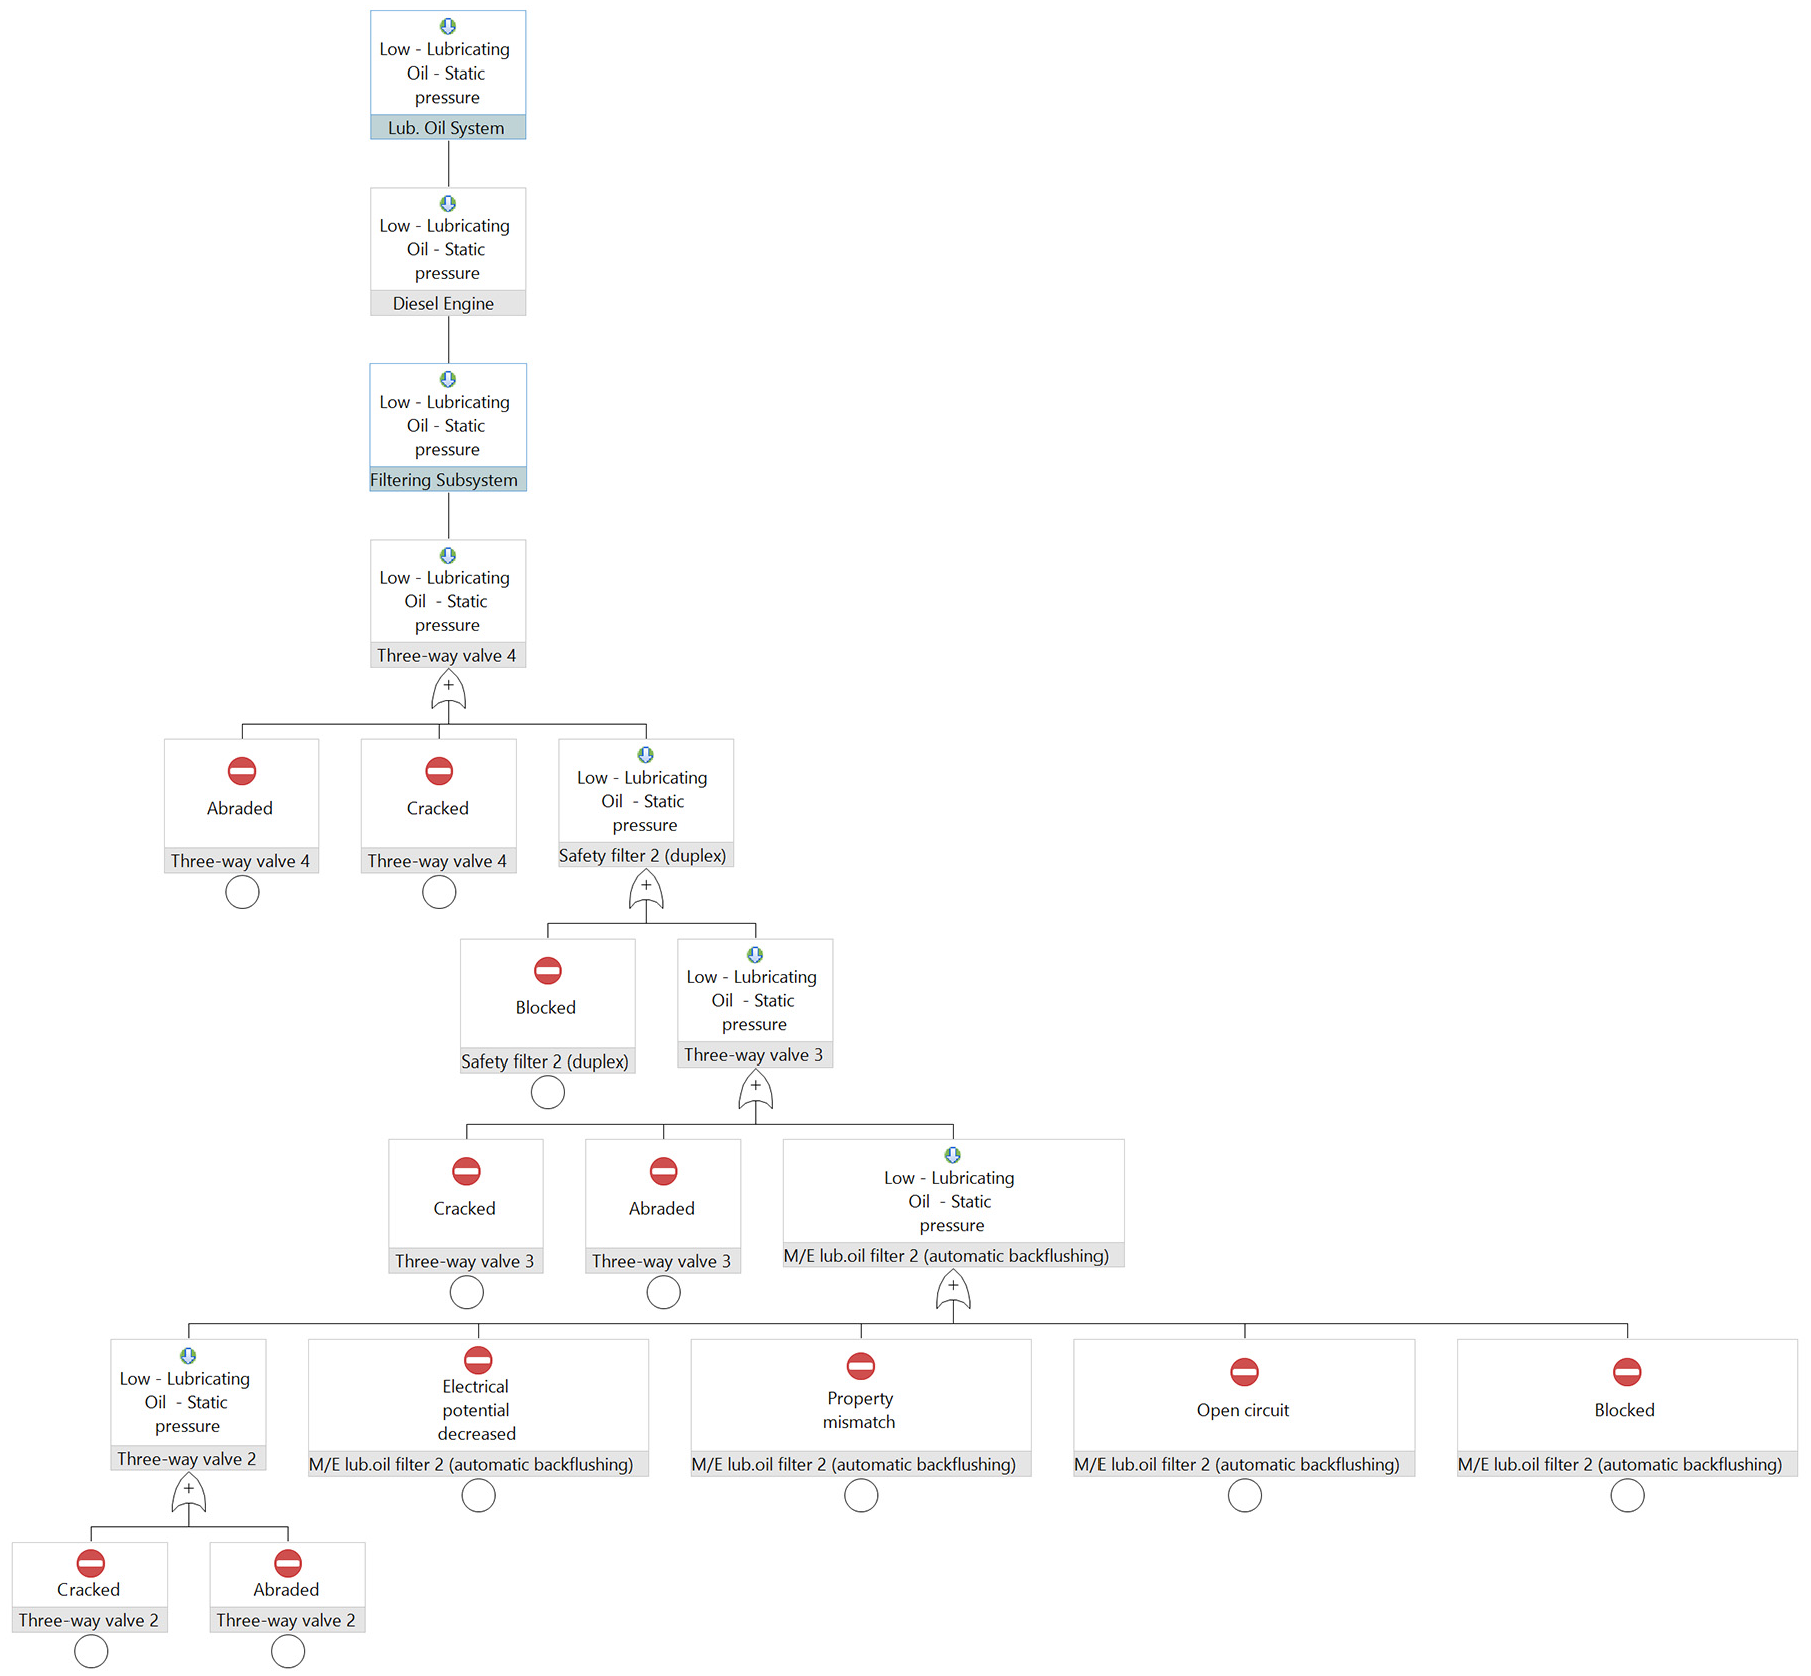
Functional FTA for ‘low lubricating oil static pressure’, event.
Step 5: FMECA based on model simulations
The FMECA report generated by MADe™ supported the identification of the most critical components of the investigated lubricating oil system. According to the failure analysis derived from MADe, the four causes being responsible for the highest percentage of failures within the system are the solid particle contaminants, the insufficient cleaning, the insufficient lubricant and the abrasive wear. Only a short extract from FMECA table in provided in Table 8 due to space limitations.
As it can be observed, the majority of failures have extremely low probability level (Level E), with some exceptions, such as the magnetic suction strainer, filters and lubricating oil pumps. Whilst the C m depends on the failure rates, the failure modes and their effect, which in turn depends on the input failure data, this is not the same for consequences. More specifically, the suction strainer, lubricating oil pump and motor failures were assigned the highest level of severity, since their failure will incur significant damages to the engines or ships. For the magnetic suction strainer failure, big metallic particles entering into the engine will cause significant damages. In case of the lubricating oil pumps/motor failure, the lubricating oil flow will considerably be reduced, leading to the main engine cylinders abrasion, severe damages or shutting down of the main engine with potential safety implications on the ship. The safety filters as well as the manual and automatic back-flushing filters are assigned lower severity than the suction strainer and lubricating oil pump failures, due to the redundancy existing in the system design, lower effects on the pressure in case of their blockage and availability of monitoring systems. The cooler and the three-way control valves were assigned similar severity with the filters failures, since their failures can lead to the main engines shutdown, but the failure effect on the engines is reduced. The control unit and the power unit failures were also assigned lower severity due to the fact that these failures will lead to automatic alarm to the crew without significant disruption of the pump operation and impact on the components availability with lower severity, such as automatic back-flushing filter. The sump tank and pressure relief valves failure modes will lead to slight disruption in system operation, since the system can be operated in a degraded mode with reduced functionalities for some period of time.
Based on the above and the information presented in Table 8, the components with the highest criticality are the magnetic suction strainer (Severity = I, Probability = C) and the lubricating oil pump (Severity = I, Probability = D), followed by the filters (Severity = II, Probability = D) and the lubricating oil pump motor (Severity = I, Probability = E). The other components have low Probability (E) and lower severity (less than I). Therefore, the system design enhancement needs to focus on these components.
Step 6: RBD analysis
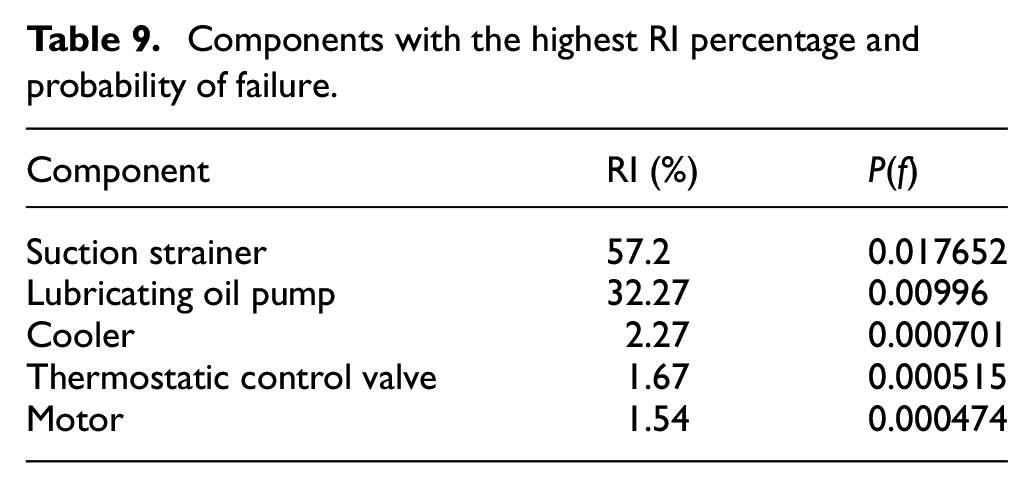
The generated RBDs using MADe™ are presented in Figure 11. Once the RBDs were developed in MADe™, the RBD analysis was automatically performed by the software, providing the reliability and availability values of all the components, subsystems and the whole system as well as their RI values. The components with the highest RI percentage and probability of failure (P(f)) are listed in Table 9. It is evident that the suction strainer and the lubricating oil pump have the highest RI percentage, which indicates that a probable failure of these components will have severe impact on the overall reliability of the system.
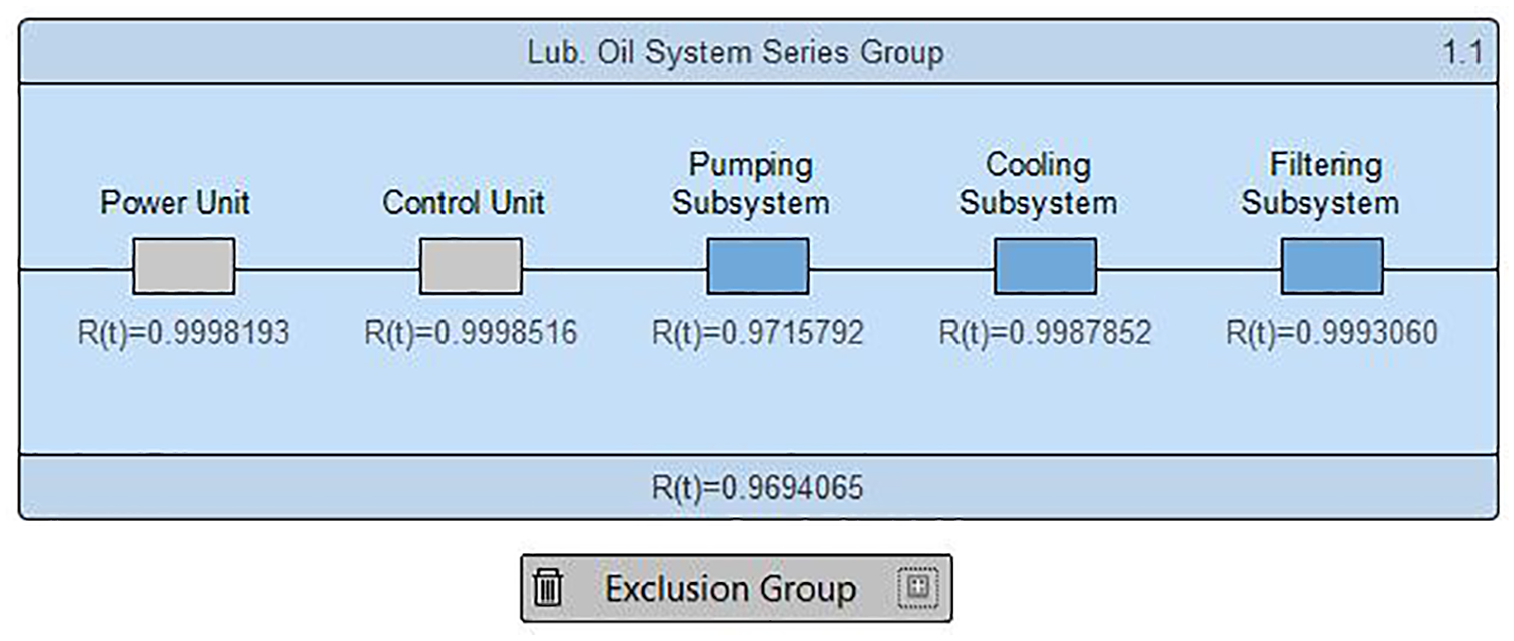
RBD of lubricating oil system.
Components with the highest RI percentage and probability of failure.
Step 7: System design enhancement
System reliability improvement
This section encompasses the modifications, which can be applied to the system, based on the identified critical components in previous steps results. The design enhancements were implemented considering three different options: (a) Original design modification, (b) New-built ship for which the Safe Return to Port regulations 3 are applicable and (c) system with high autonomy level. The first option aimed at the modification of the existing design, using the least possible cost, while achieving a significant increase in reliability, so focusing only on critical components. The second option mainly focused on the improvement of monitoring and the addition of redundant components. Lastly, the objectives for the third case were the augmentation of redundancy and automation at the highest level possible.
Figure 12 displays the lubricating oil systems of two diesel engines and the modifications that were introduced to the existing design in order to meet the above requirements. The orange, blue and green colours represent the modifications performed for the first, second and third options, respectively. Additionally, the sensors that were identified through the sensor set diagnostic analysis (described in Section 4.7) are illustrated.
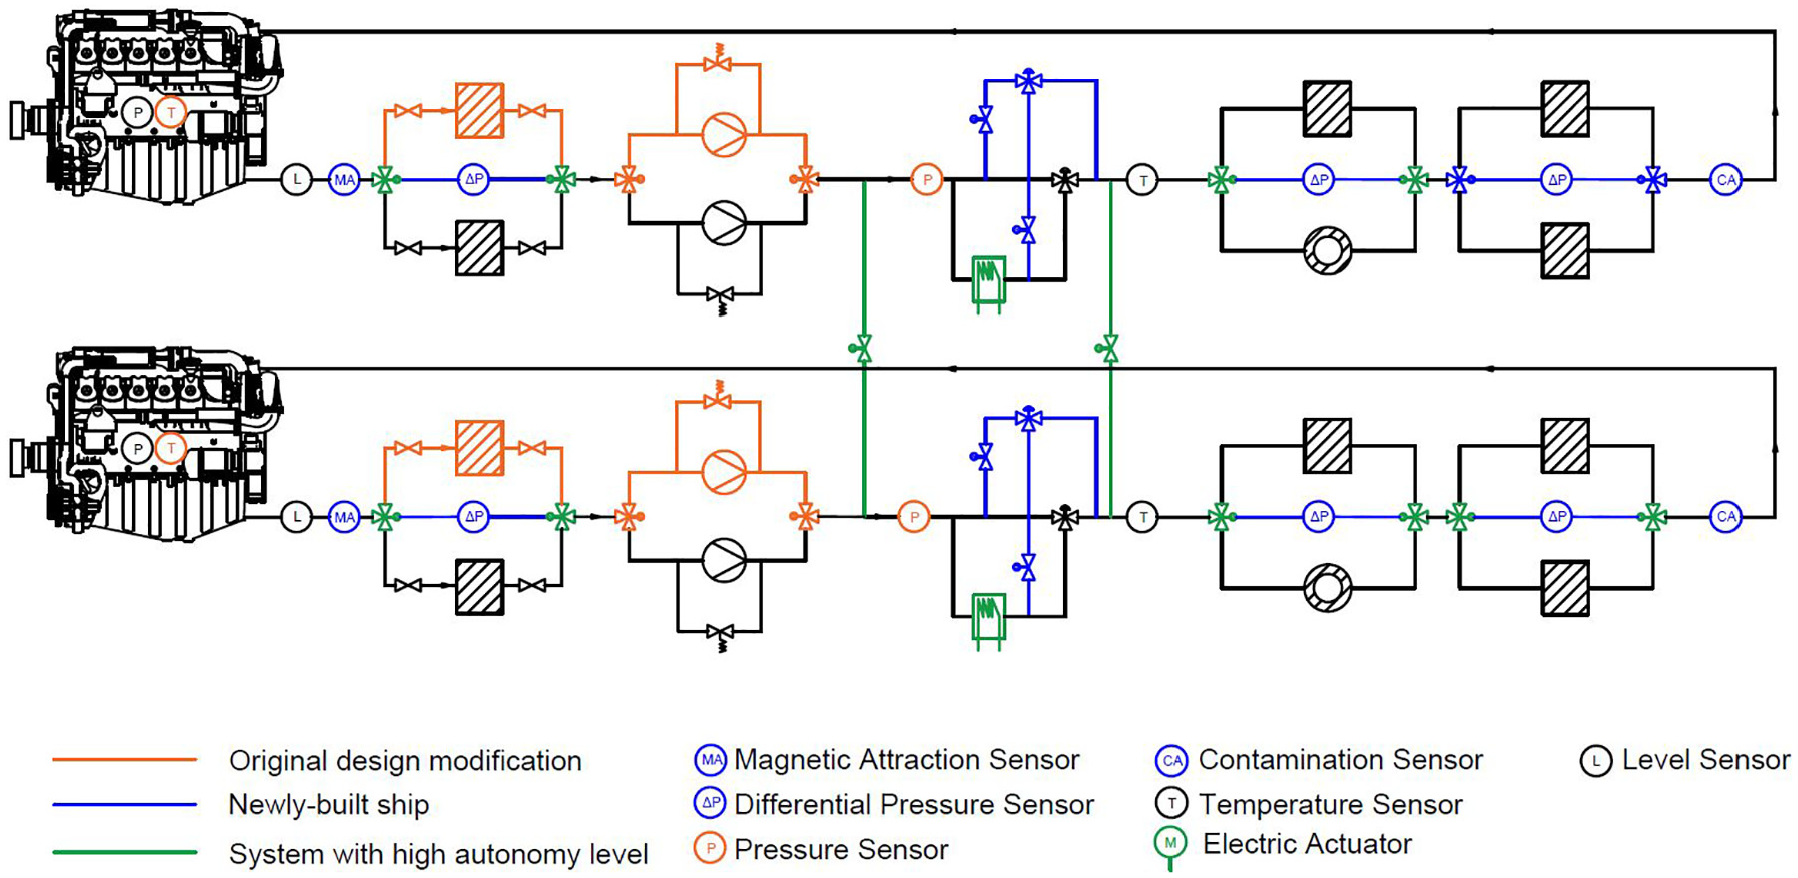
Alternative system configurations.
Throughout the safety assessment and the RBD analysis presented in the previous sections, it was found that the suction strainer and the lubricating oil pump exhibited high criticality numbers and reliability importance. Therefore, to diminish the grievous consequences for a potential failure of these components, the first system design alternative includes the addition of a redundant suction strainer with valves before and after the strainer, as well as a pump block with a pressure relief valve, two electric actuated three-way valves for the automatic start-up operation of the standby pump, one pressure sensor and one temperature sensor downstream the Lubricating Oil pump and at the diesel engine Lubricating Oil inlet.
The second design alternative is a more advanced version of the first one and it includes a redundant thermostatic three-way control valve, along with two electric actuated two-way valves for a remote operation, two electric actuated valves at the last filtering stage, differential pressure sensors in each filtering phase, a contamination sensor before the main engine and a magnetic attraction sensor after the sump tank. The application of Safe Return to Port regulations have limited effect here, as the two lubricating systems are considered to operate independently from each other.
The third design alternative includes all the modifications performed for the previous alternatives and additionally the electric actuated three-way valves in all the filtering stages, cross-connections before and after the cooler including electric actuated valves and coolers with higher capacities in order to accommodate both engine systems at the same time in case of a malfunction in one cooler.
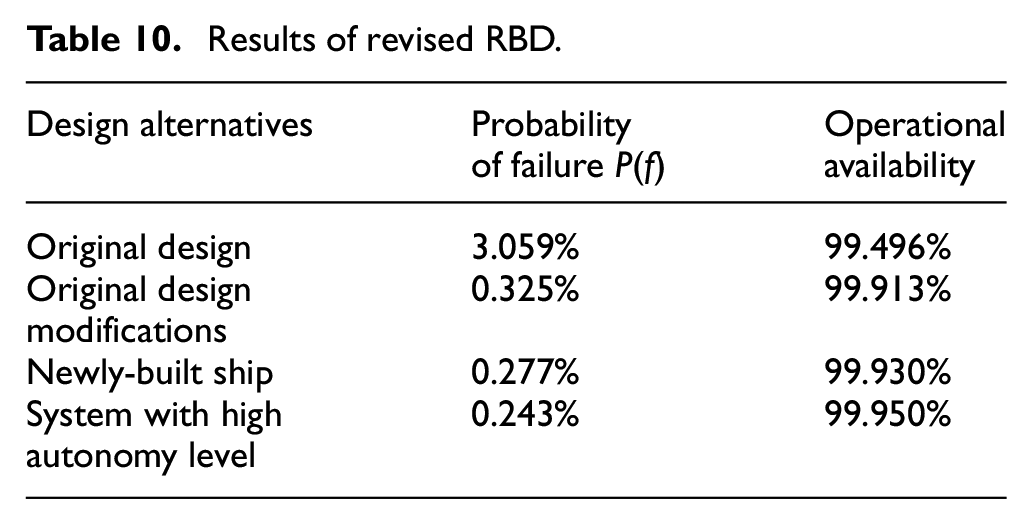
Following a similar approach with the one used for the development of the initial RBD, the RBDs for each design alternative were developed. Subsequently, the RBD analysis for all the considered design alternatives was conducted, the results of which are presented in Table 10. These results demonstrate that the probability of failure for the alternative system designs was reduced dramatically, while their operational availability was increased, predominantly due to the addition of redundant components. The results also demonstrate that few modifications, focusing on critical components are required to improve the reliability and availability, compared to original design.
Results of revised RBD.
System diagnosability enhancement
The initial set of sensors based on MADe™ recommendations consisted of 11 sensor points, including the four built-in sensors. The type and location of the seven additional sensors points are the following: a magnetic attraction sensor was installed in the sump tank to detect any metal particles in the LO, three differential pressure sensors were added in the strainer and filter locations for measuring the pressure difference before and after the filters, a pressure sensor was placed after the lubricating oil pump, a temperature sensor was installed in the diesel engine and a contamination sensor 43 was added before the diesel engine. The three additional sensors installed in the pumping subsystem and the inherent sensor in the sump tank are shown in Figure 13.
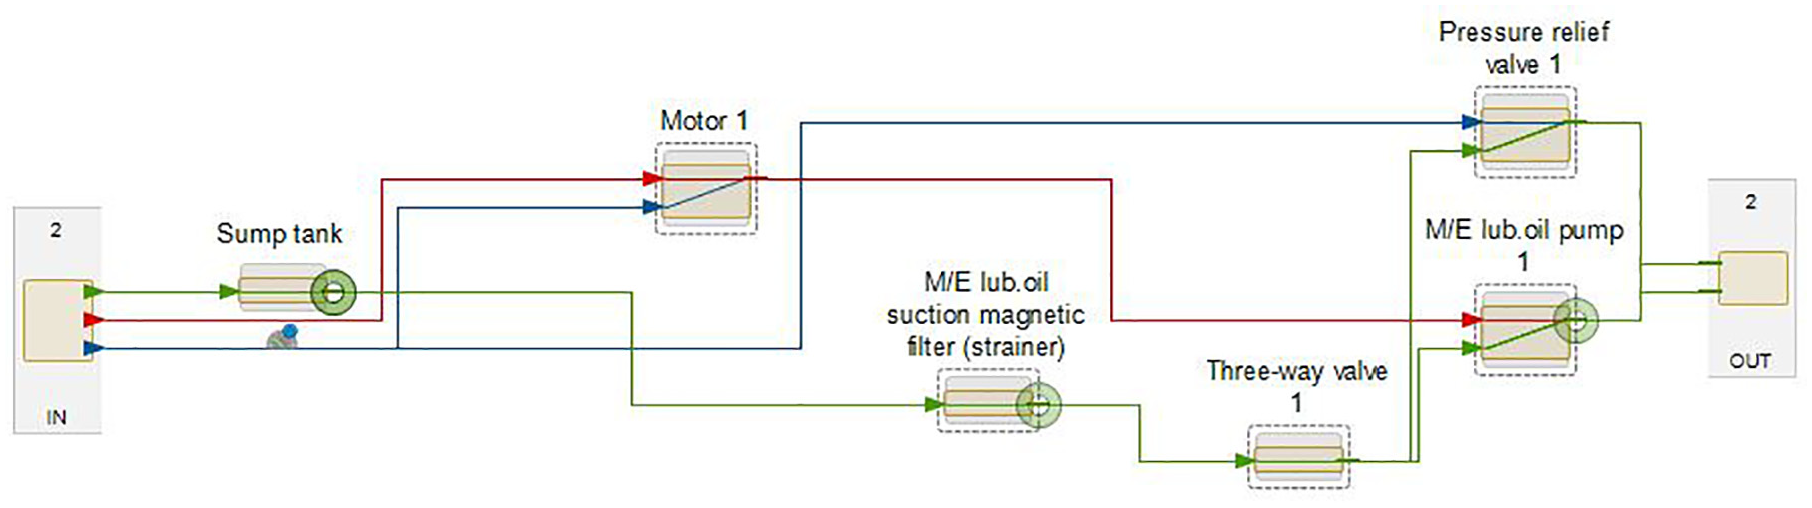
Sensors in pumping subsystem.
Discussion on the methodology
As it was demonstrated through application, the advantages of the selected methodology included the availability of the relevant components failure modes in the MADe™ software and interconnection with the system functional model. This facilitated the safety, reliability and availability investigation of the system and accelerated the analysis. In addition, various safety, reliability and availability metrics were estimated. This supported the identification of critical/important components and guided further design enhancement. As it was demonstrated, only few modifications were required to improve the investigated system reliability and availability.
The adopted methodology also allows for the future development of a diagnostic system for the lubricating oil system by selecting relevant sensors locations. Similar approach for selecting sensor locations can be applied to other piping systems, for example, fuel, LNG, ballast treatment, air conditioning systems. Therefore, the proposed approach can support the design and modification of similar systems aiming at their safety and reliability enhancement.
On the other hand, only the reliability metrics were estimated for the system using RBDs. The functional Fault Trees were used for the developed model validation and not for safety metrics estimation due to specific software limitations. Furthermore, only the explicit dependencies were incorporated in the modelling, as only the functional and not behavioural model describing potential reconfigurations were considered. A number of software failure modes, which could be found using other methods were not incorporated. Sensors failure modes and their effect on diagnostic system were also omitted in the present methodology due to software limitations. Uncertainty in the results analysis were not incorporated.
With respect to the results, the cost-effectiveness of the recommended design modifications has not been investigated, which is a limitation of this study. Furthermore, the use of OREDA database for the estimation of the components failure rates introduces further uncertainty, as this database was developed for systems/components of offshore assets (and not of ships). These limitations pose directions for further research.
Conclusions
In this study, a methodology was employed based on a model-based safety analysis approach to analyse and improve reliability, availability and safety of lubricating oil system on a cruise ship. FMECA was conducted and reliability and availability metrics were estimated for the original and enhanced alternative system configurations.
The main findings of this study are summarised as follows:
The use of the Model-Based approach supported and facilitated the analysis and design enhancement of the investigated lubricating oil system.
FMECA results indicated that the suction strainer and the lubricating oil pump are the most critical components followed by the filters and lubricating oil pump motor.
The suction strainer and the lubricating oil pump also exhibited the highest value of reliability importance.
The system reliability was significantly improved when lubricating oil pumps and suction strainers were added to system. Additional design changes led to an additional slight reliability improvement.
Seven additional sensors were added to improve the diagnosability of the original lubricating oil system.
However, the above recommendations need to be investigated together with cost-benefit analysis.
Limitations with respect to incorporation of software failure modes and system reconfiguration functions were identified.
The presented approach could be applied to any ship type and any power plant auxiliary system, which highlights the usefulness of this study. A future work could focus on implementing similar analysis on other power plant auxiliary systems. Additionally, a future work could consider cost in the design enhancement.
Footnotes
Appendix
Acknowledgements
The authors affiliated with the MSRC greatly acknowledge the funding from DNV and RCCL for the MSRC establishment and operation. The opinions expressed herein are those of the authors and should not be construed to reflect the views of DNV, RCCL or the acknowledged individuals and their associated organisations. Moreover, the use of MADe™ and software were crucial to this study and the authors greatly acknowledge the provision of the academic licenses by PHM Technology.
Declaration of conflicting interests
The author(s) declared no potential conflicts of interest with respect to the research, authorship, and/or publication of this article.
Funding
The author(s) received no financial support for the research, authorship, and/or publication of this article.