
Abstract
Delamination factor is one of the most important factors evaluating the surface integrity of carbon fiber–reinforced polymer laminates. The value of the delamination factor in edge trimming of carbon fiber–reinforced polymer laminates controlled the acceptance or rejection of the machined component. Therefore, using a reasonable and efficient approach to characterize the delamination region is very beneficial. However, the conventional delamination factor is a one-dimensional evaluation method, and hence, it cannot distinguish the delamination extent of carbon fiber–reinforced polymer laminates after edge trimming. The contribution of this work is to present a novel assessment approach to characterize the cutting-induced delamination using a milling cutter and compare it with the conventional delamination factor. The experimental results indicated that the delamination factor based on area assessment method is suitable to evaluate the delamination extent at the top layer after edge trimming.
Introduction
The application of carbon fiber–reinforced polymer (CFRP) composite laminates in aircraft, automotive and shipping industries is growing fast for their light weight and high strength.1,2 Although the CFRP component is usually produced in near-net-shape in the curing process, it is essential to undergo finishing operations for meeting the prescribed dimensional tolerances and surface quality. 3 The common finishing operation used in industry is edge trimming. 4
However, due to the brittle behavior and low interlaminar strength of CFRP composite structures, edge trimming of CFRP is prone to delamination on the surface layer. 5 The delamination has been classified in various types according to their appearances by Colligan and Ramulu, 6 and the most frequent delamination type was found to be uncut fibers. They also found that the delamination depends significantly on the fiber orientation at the top layer of CFRP laminates. Since the cutting-induced delamination can controll the acceptance or rejection of the expensive CFRP components.7,8 Hence, it is of considerable importance to reduce the delamination when milling of CFRP laminates in the industrial application.
The influence of the feed rate on delamination has been one of the primary focuses of investigation. Davim and Reis 9 and Pecat et al. 10 demonstrated that the delamination increases slightly with respect to feed rate, while the effect of spindle speed is not prominent. They also found that up-milling operation produces less delamination compared to down-milling operation regardless of the feed rate. 11 The feed rate can be determined by the feed per tooth, number of teeth and spindle speed. 12 Nonetheless, the effect of feed per tooth on the delamination extent has seldom been conducted. Besides, Karpat et al. 13 found that the delamination generation and the location of maximum tangential forces fall within the same range of fiber cutting angles. Recently, Hintze et al. 14 found that the cutting edge radius of tool has great influence on the delamination, and no delamination occurs when a sharp tool was adopted. Hosokawa et al. 15 applied the inclination milling method to reduce the tool wear and the delamination. Hence, the rational choice of the combination of processing and tool geometry parameters is important for reducing delamination.
In general, a quantitative evaluation of the delamination is required before investigating the effect of the processing and tool geometry parameters on the delamination extent along the machined edge. Gao and Kim 16 conducted a comparative study on destructive and non-destructive techniques for quantitative evaluation of impact damage in CFRP laminates. They concluded that the destructive inspection has a considerable drawback associated with the difficulty in accurately obtaining the region of the damage. Therefore, it is needed to establish a non-destructive inspection method that can be used to obtain the delamination region. Several methods have been established, such as scanner, 17 ultrasonic C-Scan, 18 X-radiography, 19 computerized tomography (CT), 20 tool maker’s microscopy 21 and scanning electron microscope (SEM). 22 In all these methods, the scanner is an accurate, inexpensive and simple technique to measure the delamination size. Moreover, the main goal of the method is to obtain the digital images representing the delamination region that can be further analyzed and measured for delamination size.
The average delamination depth, the equivalent length of uncut fibers, as well as delamination factor (defined as the quotient between the maximum delaminated depth and the width of cut) have been widely used to characterize the level of damage on the surface layer of CFRP laminates.23,24 Nevertheless, these evaluation criteria have a limitation in distinguishing the delamination extent. In addition, after the CFRP laminates were machined, the delamination presents an irregular shape, containing uncut fibers, long and fine cracks, as well as fiber pull-out along the machined edge. Hence, there is an urgent need to develop a new evaluation criterion, which can provide the necessary information on the extent of damage after edge trimming.
In this work, a quantitative evaluation approach of the delamination taking into account the area of the delamination was proposed, and an automated digital image subtraction technique was developed to characterize the damage area along the machined edge after edge trimming. In addition, a series of edge trimming tests with different milling parameters such as spindle speed and feed per tooth was performed. Finally, the delamination area under each parameters combination was recorded, and then compared with the conventional maximum delamination length. The experimental results confirmed that the area-based delamination assessment method is useful to evaluate the delamination extent after edge trimming of CFRP laminates.
Delamination in composites
Delamination mechanism
CFRP composites encounter various machining problems due to the presence of two or more dissimilar phases. Extensive studies have shown that the fiber orientation at the top layer of CFRP laminates has an important effect on the occurrence of delamination.25,26 For example, fiber pull-out is found in laminates with fiber orientation of 135°. Serious uncut fibers are found in laminates with fiber orientations of 45° and 90°. Attached fibers or cracks parallel to the machined edge are mainly found in laminates with fiber orientation of 0°.
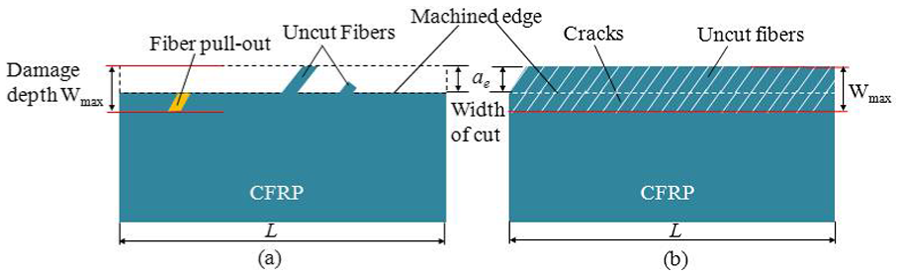
Figure 1 depicts the delamination mechanisms of trimming with a two-straight-flutes milling cutter on CFRP composites. The uncut fibers are a consequence of the surface layer fibers deflect perpendicular to the laminate plane without being broken, and these fibers will not flex back to their normal position after the cutting edge passed by. Normally, this phenomenon always occurred during edge trimming of CFRP laminates with top layer fiber orientations of 45° and 90° using a worn tool. A reduction in cutting edge radius can reduce this delamination type. The fiber pull-out is a consequence of the surface layer fibers bending in the laminate plane, which results in cracks propagation along the fiber axis, and these cracks are prone to extend beyond the machined edge. Thus, the fiber bending fracture occurs at the crack tip location.
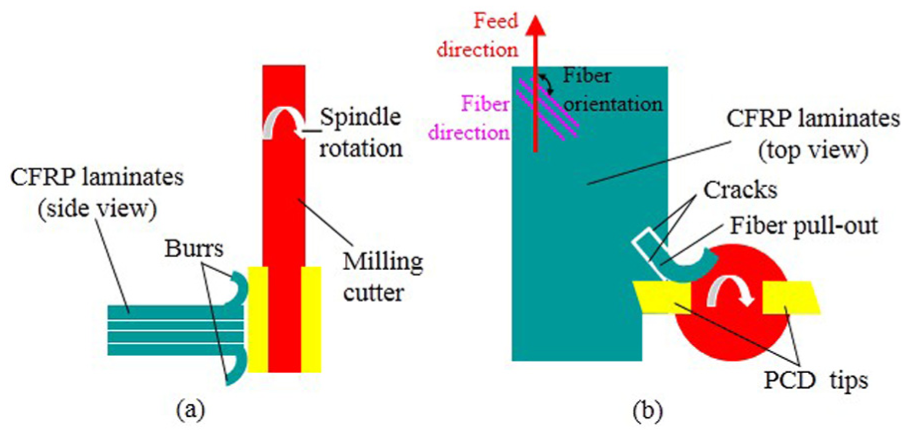
Delamination mechanisms: (a) uncut fibers and (b) fiber pull-out when edge trimming of CFRP laminates.
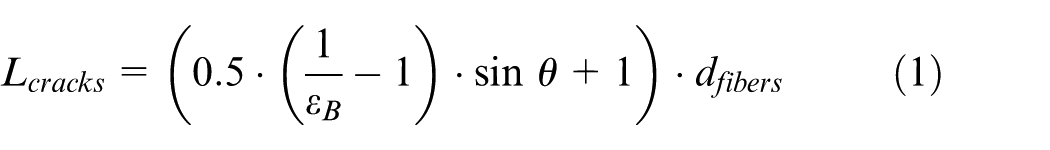
An analytical method based on elementary bending models during edge trimming of CFRP laminates has been employed to study the delamination mechanisms in depth by Hintze and Hartmann 27 The relation between the minimum length of the cracks propagate, the fiber orientation at the top layer and the ultimate tensile strain of fibers was derived.
When the fiber orientation (θ) lies in the range of 0°< θ < 90°, the relation was given by
When the fiber orientation (θ) lies in the range of 90° < θ < 180°, the relation was given by
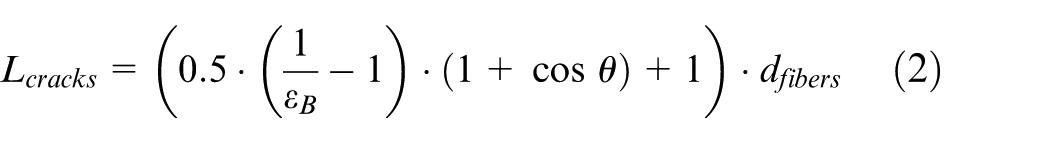
where Lcracks is the minimum length of the cracks tip from the machined edge. εB is the ultimate tensile strain during fiber bending. dfibers is the diameter of the fibers. θ is the fiber orientation at the top layer, which is defined as the angle measured clockwise with reference to the direction of feed motion of tool.
Delamination assessment
After edge trimming, it is important to establish the quantification criterion in order to calculate a factor that can numerically compare the delaminated region caused by the different cutting parameters and tool geometries. Some researchers have implemented a one-dimensional quantity-based criterion to assess the induced delamination. Hosokawa et al. 15 proposed an average length of uncut fibers to evaluate the extent of damage along the machined edge. Urban 11 and Sheikh-Ahmad et al. 12 presented an average depth of delamination along the machined edge of CFRP, which was calculated as the mathematical average of the delamination depths for all types of delamination occurring.
However, both average length of uncut fibers and average depth of delamination make no sense for the different widths of cut. Recently, Davim and Reis 9 and Erkan et al. 21 have suggested a delamination factor, Fd, and it was based on the maximum depth of damage zone and is given by
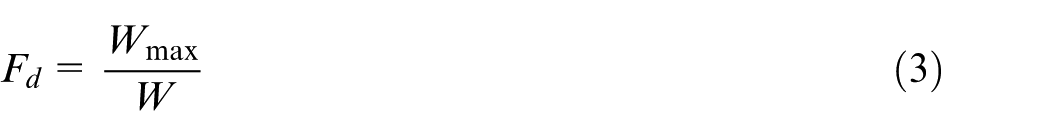
where Wmax and W denote the maximum depth of the observed delamination as shown in Figure 2 and width of cut in the same figure, respectively. It is worth mentioning that the width of cut (W) is equal to the radial cutting depth (ae) when the edge trimming operation is conducted.
Critical cases: (a) fewer fiber pull-out and uncut fibers and (b) uniform uncut fibers and cracks.
In addition, delamination on the surface layer always presents an irregular form and distribution after edge trimming. The uncut fibers, fiber pull-out and long and fine cracks occur usually along the machined edge. Therefore, merely one-dimensional damage information without considering the distribution of damage along the machined edge is not enough to better distinguish the delamination extent. Figure 2 shows two distinct delamination extents after edge trimming, but it can be clearly seen from that the delamination factors calculated according to equation (3) are exactly the same.
Therefore, a novel approach based on delamination area is proposed to evaluate the delamination extent. The value of this delamination factor (Fd-area) can be expressed as follows
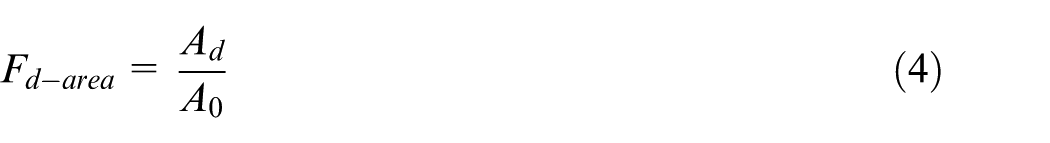
where Ad is the delamination area. A0 = ae × L, ae is the radial cutting depth and L is the length of machined edge.
Methodology used to obtain the damage area
Digital images are often used to analyze the damage extent of the machined specimens. 28 To characterize the damage area along the milled edge, an automated digital image subtraction technique was developed. The image subtraction is a method by subtracting the pre-trimming image from the post-trimming image so that the changes of the pre- and post-trimming images can be detected and measured. Before processing the images for damaged area calculation, the retro-reflective markers (as shown in Figure 3) were used. This step was executed to ensure the accuracy of overlapping alignment of pre-trimming images with post-trimming ones.
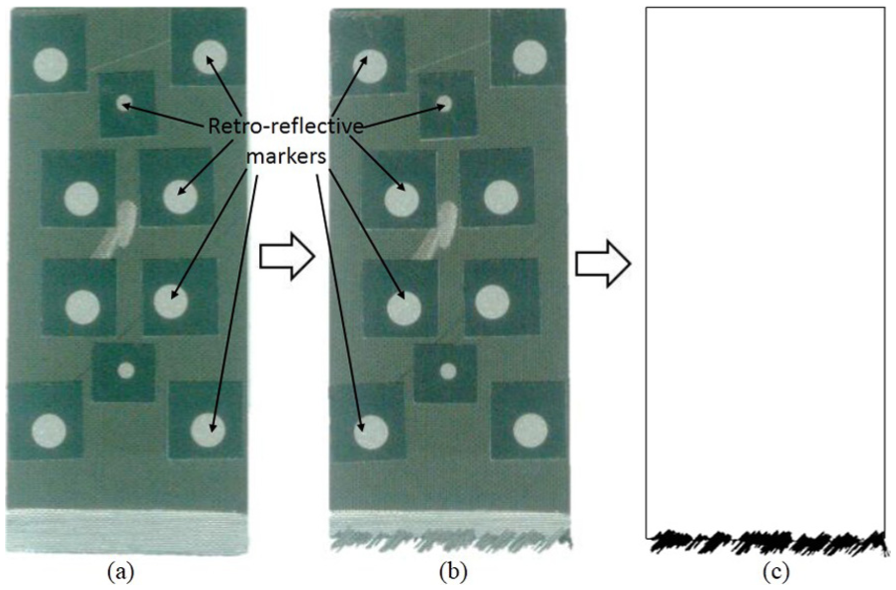
Image subtraction method to determine the damage zone final form: (a) pre-trimming, (b) post-trimming and (c) image after subtraction.
Then, the white paint was applied to the top layer of CFRP specimen on the machined side which generates a clear contrast that can help in the identification and measurement of the delamination area. Moreover, these painted specimens were placed in the air for at least 1 h. After that, a color flatbed scanner (Microtek ScanMaker 3860) was employed to obtain the pre- and post-trimming digital images. The scan resolution of 1200 ppi was used, and the CFRP specimen was placed directly on the glass plate of the scanner. A major advantage of the scanner over the other techniques is that all the data for two-dimensional imaging can be acquired simultaneously. A digital image can be considered as a matrix where columns and rows identify one point of the image, which corresponds to the lumens intensity in this point. 29
In the next step, the generated pre-trimming and posting-trimming images from scanner were analyzed in MATLAB software using methods of image subtraction (Appendix 1). Finally, the damage area was measured by subtracting the pre-trimming image from the post-trimming image and subsequently multiplying an area of unit pixel. To ensure the accuracy and precision of the measured damage area, the scanner was calibrated using a calibration target, which is most widely used in the camera calibration. 30 The calibration results show that the spatial resolution of this scanner is 4.6 × 10⁻⁴ mm2 per pixel. The digital image subtraction technique has a great advantage of reducing the dependence on the operator to measure the dimensions, thus increasing the results reliability. The processing sequence used is as follows (Appendix 2):
Read the pre-trimming image as well as the post-trimming image in MATLAB and then convert both true color images to grayscale intensity images.
Select retro-reflective markers on both images as the control points, respectively, and then register the post-trimming image and the pre-trimming image by means of the affine transformation (i.e. all points lying on a line initially still lie on the line after transformation and the midpoint of a line segment remains the midpoint after transformation).31,32
Manual selection of region of interest on the original images to reduce the computational effort and then subtracting the pre-trimming and post-trimming images in the region of interest to display only the cutting-induced delamination region.
Binarization of the image subtraction results using an Otsu’s method combined with the Heaviside step function.
Summing up the pixels within the associated damage region of the image subtraction results and subsequently multiplies an area of unit pixel.
The Heaviside step function with an alternative form can be written as
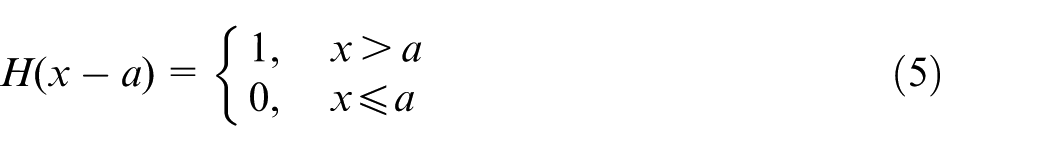
where a is a threshold to reduce a gray-level image to a binary image, x is the gray level in the damage region, the number 1 is a symbol of white pixel and the number 0 represents the black pixel.
A threshold level that is too small will cause surface texture of CFRP laminates to appear connected to the cutting-induced damage. While a threshold level that is too high will neglect some cutting-induced damage. In image processing, Otsu’s method is an unsupervised and nonparametric method of automatic threshold selection for picture segmentation so that maximize the separability of the resultant classes in gray levels. 33 However, comparison with the image subtraction results shows that the targeted result is contained by setting an adequate correction coefficient to correct Otsu’s method. This is mainly because the threshold level of the each machined edge is not a constant predetermined value. For this work, the 0.5–1 correction coefficient interval seems to be the closest interval that contains all of the image subtraction results.
Figure 3 illustrates the flow diagram of the image subtraction procedure. The digital image is subjected to the threshold filter to reduce the gray-level image to an image that has only two values for each pixel. The two colors used for the image are black and white; after that the logical NOT operation is used to transform the white pixel (i.e. the different region between pre- and post-trimming images) into black point. The binary image was then treated using Adobe Photoshop CS software (Adobe Systems Inc., USA) to delete the smaller areas caused by the surface texture of CFRP laminate from the image, leaving only the cutting-induced damage areas. Finally, the damage area can be measured by summing up the black pixels within the associated regions.
Experimental procedure
Experimental set-up
The edge trimming experiments for the present investigation are carried out on a three-axis high-speed computer numerical control (CNC) machining center (Mikron HSM 500). The machining center has a maximum spindle speed of 42,000 r/min and maximum feed rate of 42 m/min. In addition, the machining center was equipped with a dust extraction system used for the absorption of the dust produced during machining of CFRP.
Two-straight-flutes polycrystalline diamond (PCD) cutter recommended by the manufacturer SECO for edge trimming of CFRP composites was utilized in this research. 34 The milling cutter presents the following geometry: the diameters of the tools are 10 mm and PCD tips are brazed on the carbide tool body. The tool has two teeth with zero helix angle, 4° rake angle and 9° clearance angle. Machining operations on CFRP are commonly carried out under dry conditions to avoid the composite contamination with the cutting fluid.
Machining parameters and material
The composite material used for this investigation was made from a multidirectional CFRP panel (T800 carbon fiber impregnated with P2352 epoxy resin). The stacking sequence of the CFRP panel was [−45/0/45/90]5S,0,0,[90/45/0/−45]5S. The thickness of the composites was approximately 5.25 mm, and the fiber volume fraction was 60%. The CFRP specimen dimensions were 100 mm in length and 50 mm in width. The specimens were securely embedded into the fixation, which enabled to make sure that vibrations and displacement did not exist. Trimming operation was performed along the 50-mm side of the specimen.
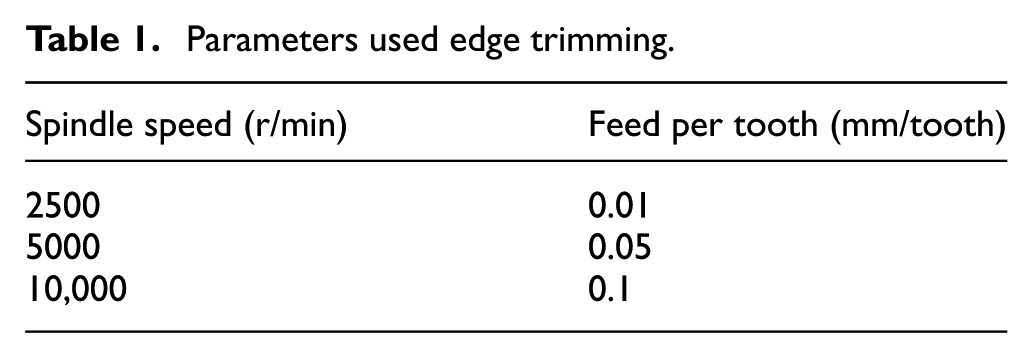
Machining configuration selected for this work was conventional up-milling. In this configuration, the tool rotation is identical to the linear movement of CFRP specimen. The machining parameters used in the trimming experiments are shown in Table 1. A radial cutting depth (25% of tool diameter) was maintained constant. The full-factorial design was applied to see how both the delamination factors vary with respect to each combination of spindle speed and feed per tooth. A new cutting edge was used for each test, and it was repeated once again, afterwards, the results of the two experiments were averaged.
Parameters used edge trimming.
Results and discussion
The experimental results show that the cutting-induced damage is essentially located at the surface ply, this is mainly because the lack of support for this ply on the laminate free side. Due to the zero helix angles of the cutter, composite at the top layer almost presents the same damage as the bottom ply. To evaluate the delamination extent at the top layer of the composite, the delamination factor (Fd-area) obtained from the proposed methodology is compared with the conventional delamination factor (Fd). The maximum depth of damage was determined by two farthest points along the machined edge.
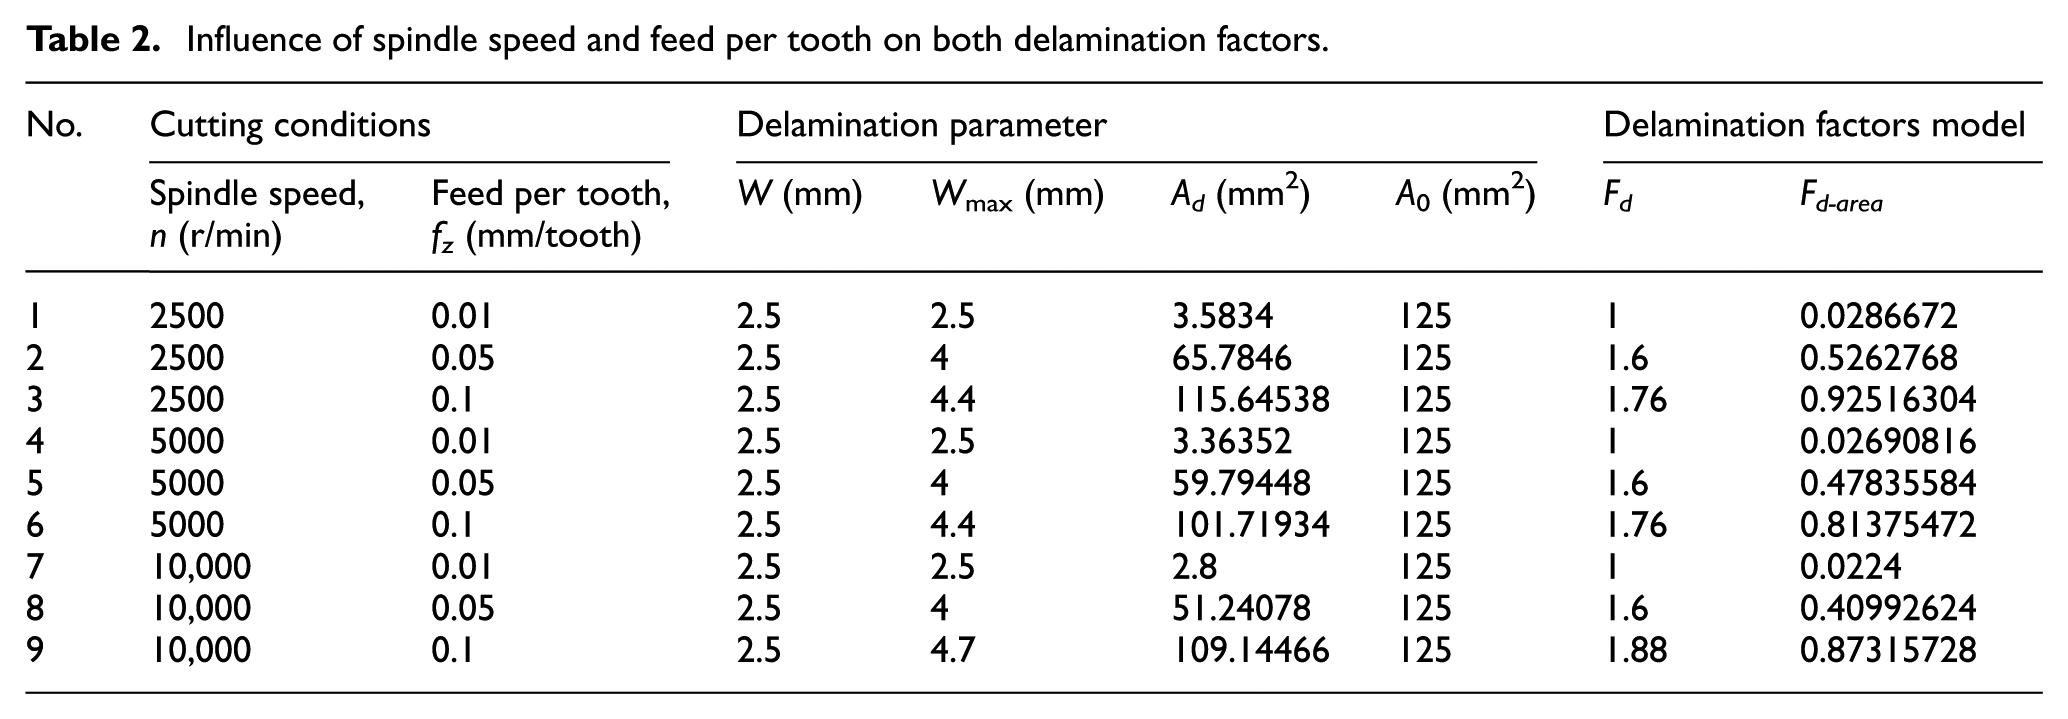
Table 2 shows the experimental results of the two delamination factors (Fd-area and Fd) obtained under the distinct cutting conditions. It can be seen from that the conventional delamination factor (Fd) makes no sense for discriminating the delamination extent between tests 1, 4 and 7, tests 3 and 6, as well as tests 2, 5 and 8. While the delamination factor (Fd-area) shows a better distinction of the delamination extent.
Influence of spindle speed and feed per tooth on both delamination factors.
Figures 4–12 show the images of delamination at the top layer of machined edge together with the corresponding curves comparing the two delamination factors. Observing the images of the delamination area in Figure 4, it is unable to identify the difference of these images. The surface appears to be smoother along the machined edge. Such facts result from the cutting mechanism of the CFRP composites. As the chip thickness is small, the load shears the fibers and the fiber fracture at the load position. 35 One can say that the spindle speed has little influence on the delamination area when edge trimming of CFRP with a constant feed per tooth of 0.01 mm/tooth.
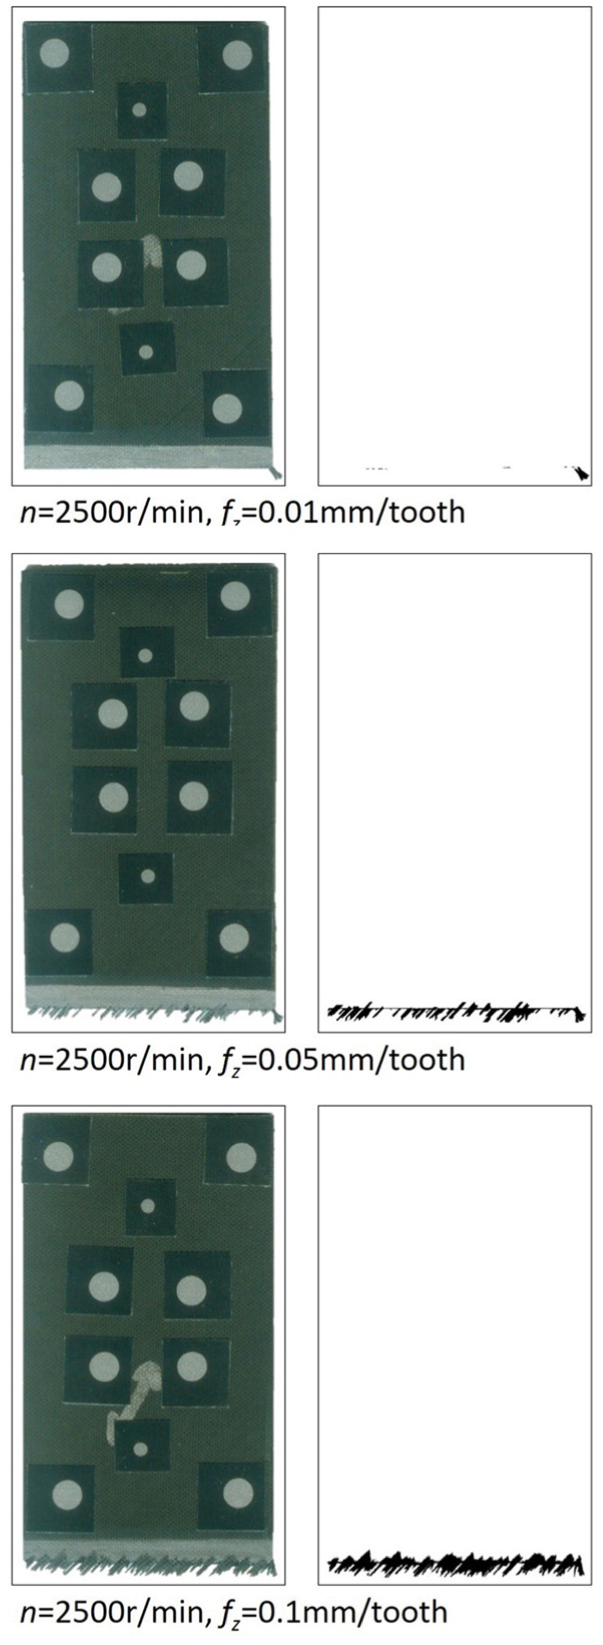
Captured and processed images at the top ply of CFRP for a feed per tooth of 0.01 mm/tooth.
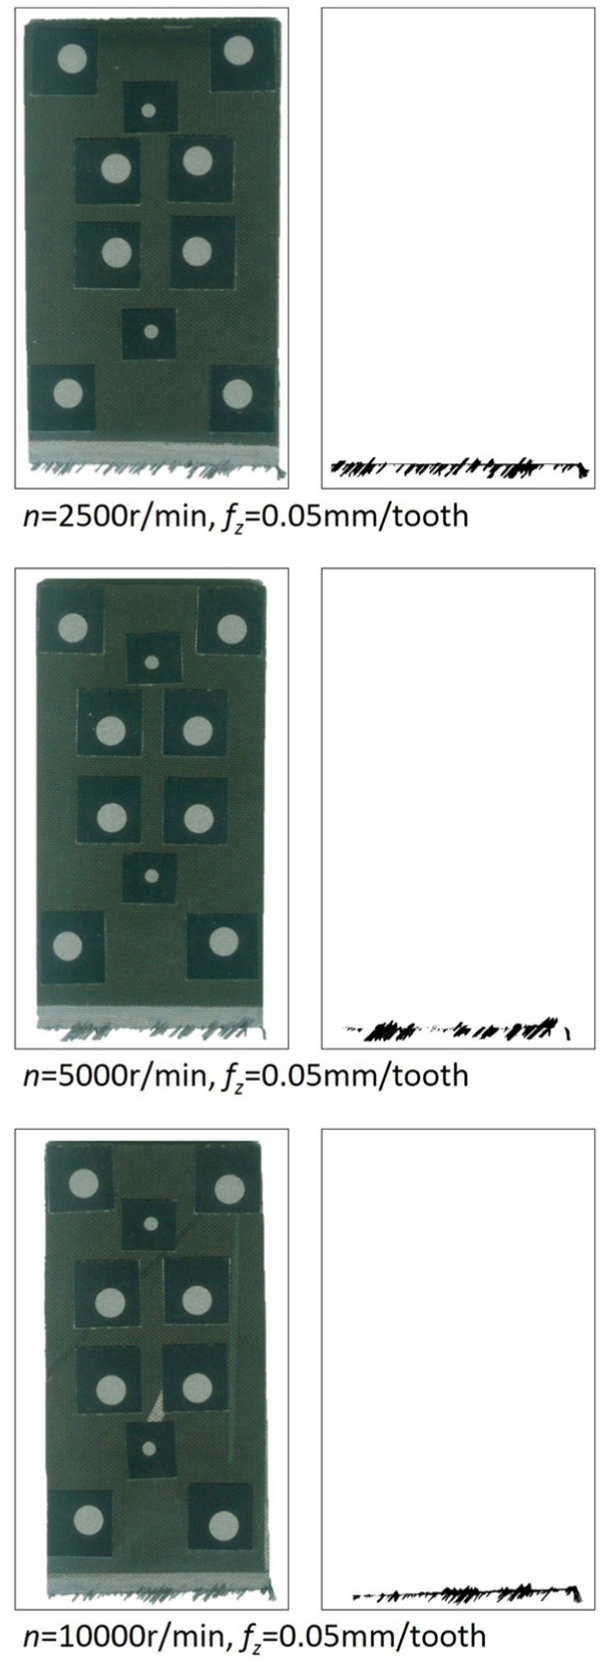
Captured and processed images at the top ply of CFRP for a feed per tooth of 0.05 mm/tooth.
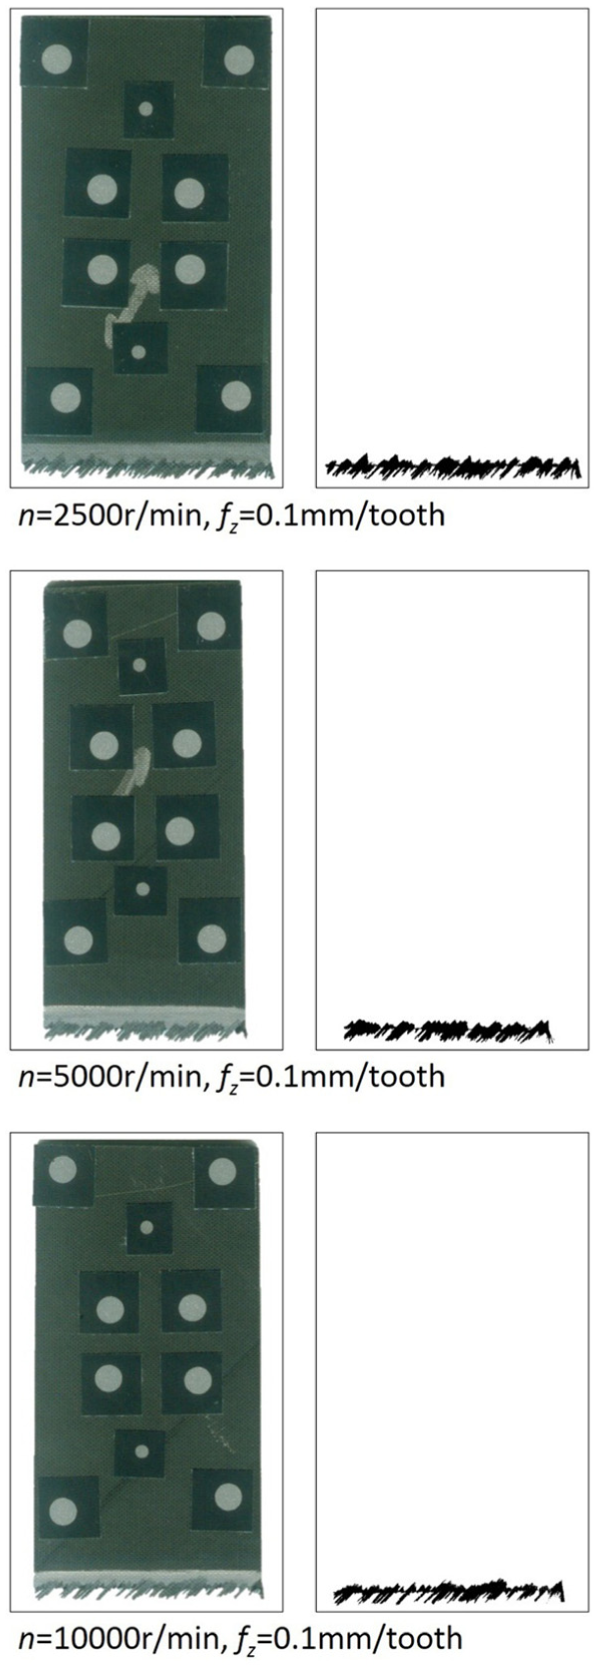
Captured and processed images at the top ply of CFRP for a feed per tooth of 0.1 mm/tooth.
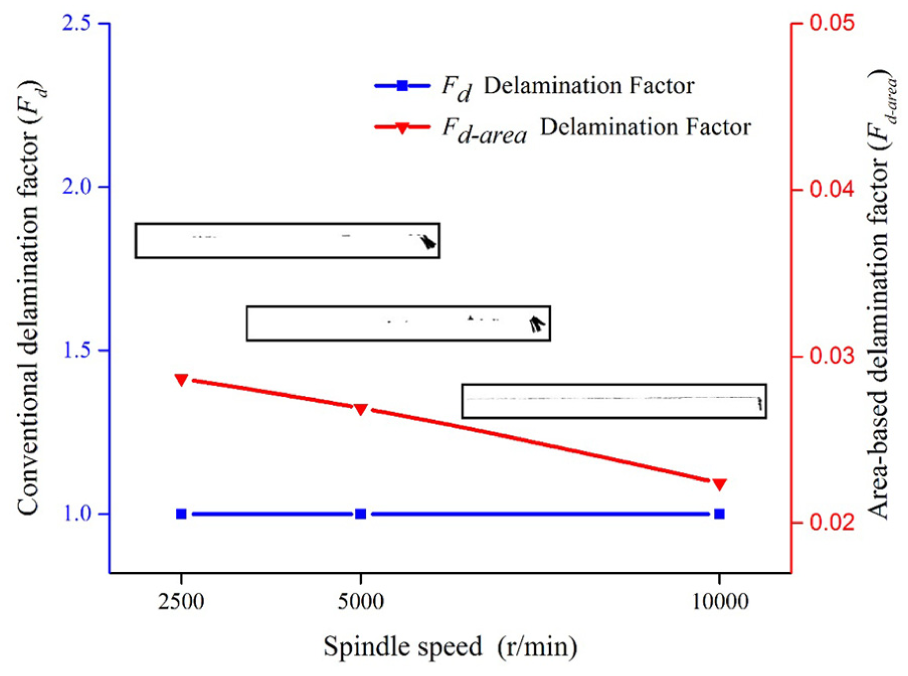
Effect of spindle speed on delamination factor for the feed per tooth of 0.01 mm/tooth.
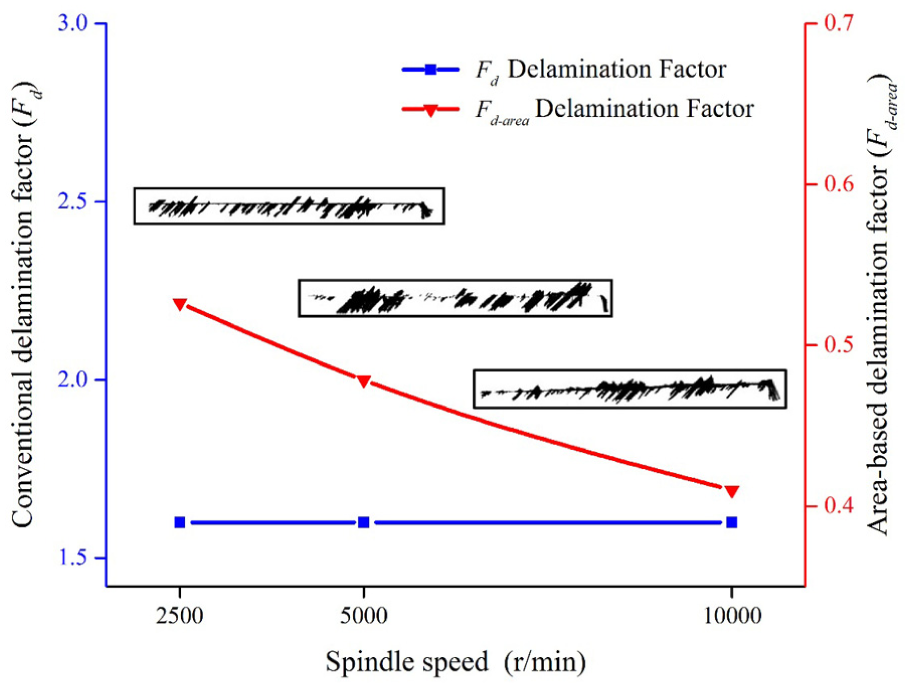
Effect of spindle speed on delamination factor for the feed per tooth of 0.05 mm/tooth.
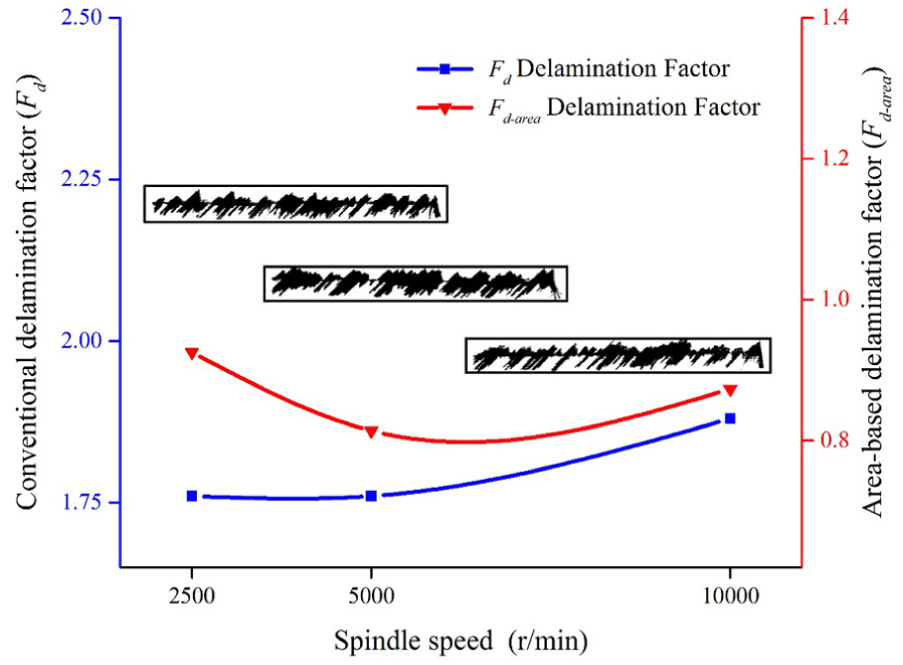
Effect of spindle speed on delamination factor for the feed per tooth of 0.1 mm/tooth.
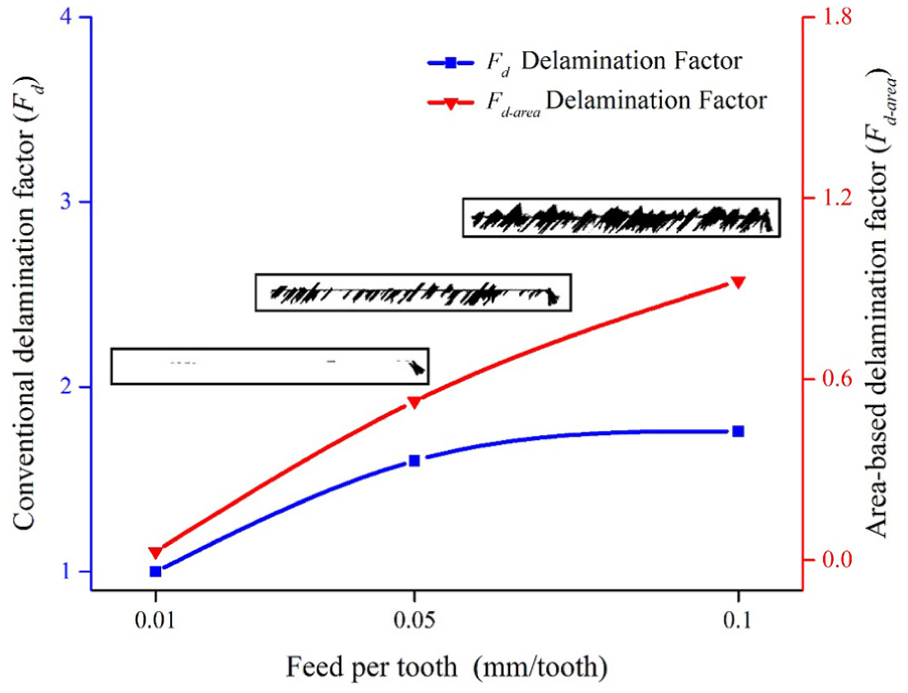
Effect of feed per tooth on delamination factor for the spindle speed of 2500 r/min.
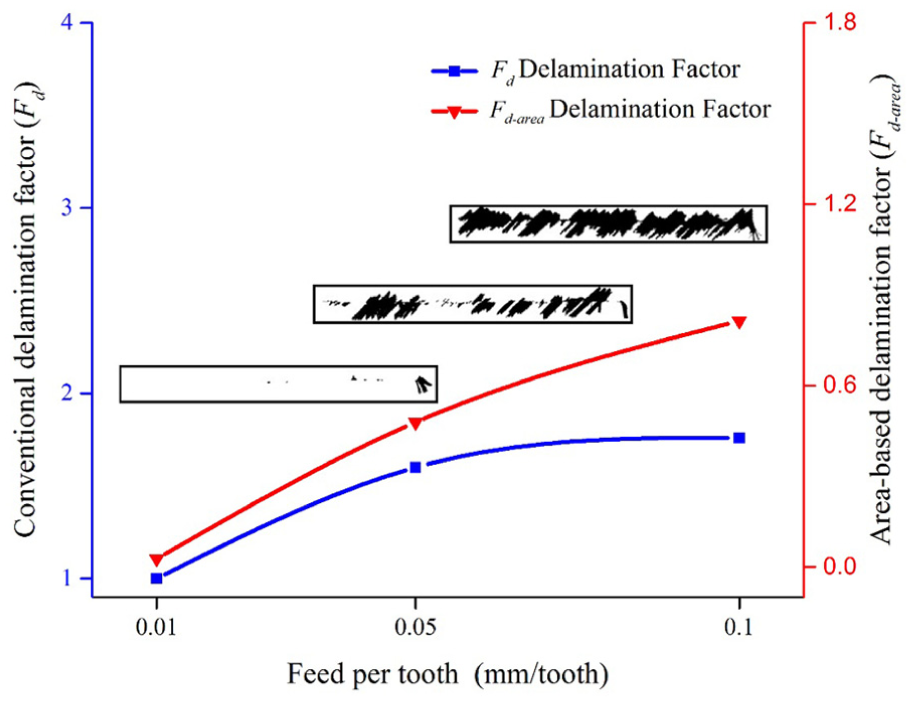
Effect of feed per tooth on delamination factor for the spindle speed of 5000 r/min.
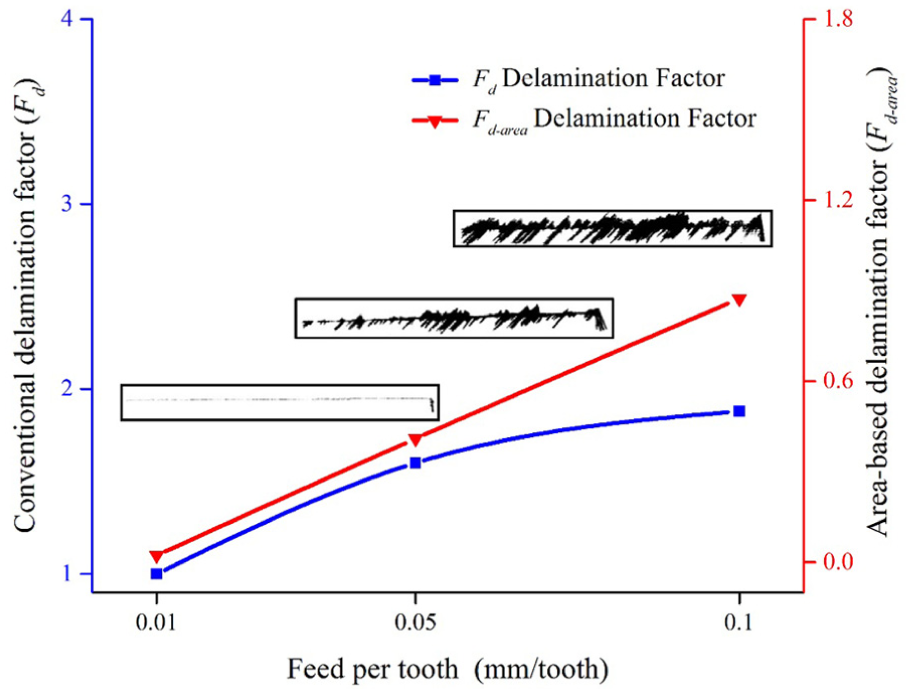
Effect of feed per tooth on delamination factor for the spindle speed of 10,000 r/min.
Figure 7 shows the effect of spindle speed on both of the delamination factors after edge trimming of CFRP laminates at a constant feed per tooth of 0.01 mm/tooth. It can be seen that the value of the conventional delamination factor (Fd) is a constant for different spindle speeds. While the proposed delamination factor (Fd-area) indicates that higher spindle speed is comparatively suitable for delamination reduction.
Figure 5 shows the images of the top layer under a constant feed per tooth of 0.05 mm/tooth and spindle speeds of 2500, 5000 and 10,000 r/min. In this case, the damage extends inward from the machined edge, and extensive damages in the form of irregular burrs are evident. One possible reason is that the tool has more liable to slip in this case, and in addition to shear, failure by tension is also involved, which results in the fibers fracture at different points along their length, finally leaving many uncut fibers as burrs. Figure 8 shows that delamination decreases as the spindle speed increases.
Figure 6 shows the effect of spindle speed at high feed per tooth of 0.1 mm/tooth. These conditions result in higher cutting forces due to removal of a thicker chip; thus, the images present a larger delamination area compared to the previous results. As shown in Figure 9, the delamination factors present a drastic increase at the spindle speed of 10,000 r/min. The possible reason is that the delamination is caused by thermo-mechanical loads. High spindle speed and feed per tooth generate a large amount of cutting heat at the same time, which in turn results in dramatic temperature rise. 36 When the temperature rise is higher than the glass transition temperature of the matrix phase, the supporting effect of the matrix on the surrounding fiber is reduced. Furthermore, this may lead to an increase in cracks extension into the material with less cutting force. Therefore, the abrupt increase in delamination area occurs in that case.
Figures 10–12 show the effect of feed per tooth on both conventional and proposed delamination factors after edge trimming of CFRP laminates when the spindle speed is changed. Independent of the spindle speed, a clear trend was found regarding the effect of feed per tooth. It was found that the delamination area is highly sensitive to feed per tooth variations. A rapid increase in the feed per tooth will cause significant delamination along the machined edge. This is due to the fact that the feed per tooth increases chip thickness when cutting speed is a constant. This increase in the chip thickness increases cutting forces, which results in increasing the delamination area. Thus, a choice of low feed per tooth is recommended to reduce delamination. Based on these results, optimum parameters for the minimum delamination are the spindle speed at 10,000 r/min and the feed per tooth at 0.01 mm/tooth.
Conclusion
Delamination is the major concern during machining of CFRP laminates. The existence of the delamination may reduce the structural integrity of CFRP laminates and results in poor assembly tolerance. In order to evaluate the delamination, a quantitative evaluation is required before optimizing the processing parameters. However, the conventional evaluation approach of the delamination does not take the distribution of damage into consideration. This article develops a new approach taking into account the damage area to evaluate the delamination extent after edge trimming of CFRP laminates. The following conclusions are drawn:
Delamination mainly occurred at the top layer and mostly presents an irregular shape and distribution. The trend is almost similar to that of area-based delamination factor (Fd-area) and conventional delamination factor (Fd). However, Fd-area had better discrimination of delamination extent compared to Fd.
The feed per tooth has higher influence on the delamination extent than the spindle speed. Delamination extent increased with an increase in feed per tooth. So, the feed per tooth should be kept as conservative as possible in order to avoid large delamination along the machined edge.
The area-based delamination factor (Fd-area) obtained through digital image subtraction has shown to be a better approach to evaluate the delamination extent after edge trimming of CFRP compared to the conventional one-dimensional delamination factor (Fd).
Footnotes
Appendix 1
MATLAB scripts
% Read the images
path=[‘C:\Users\Administrator\Desktop\’];
path_pre=[ path ‘1-pre.jpg’];
path_aft=[ path ‘1-post.jpg’];
image_pre=imread(path_pre);
image_pre=rgb2gray(image_pre);%covert the color images to grayscale image
image_aft=imread(path_aft);
image_aft=rgb2gray(image_aft);
% Coordinate position of the retro-reflective markers
num_Points=10;
Point_pre=zeros(num_Points,2);
Point_aft=zeros(num_Points,2);
[M,N]=size(image_pre);
%pre-trimming image
for i=1:num_Points
imshow(image_pre);
AA=floor(ginput(2));
img1=image_pre(AA(1,2):AA(2,2),AA(1,1):AA(2,1));
imshow(img1);
img1 = medfilt2(img1,[5 5]);
bw = im2bw(img1,1*graythresh(img1));
imshow(bw)
L = bwlabel(bw);
stats = regionprops(L,‘all’);
for ii = 1:length(stats)
Area = stats(ii,1).Area;
for j = ii+1:length(stats)
if stats(j,1).Area > Area
Area = stats(j,1).Area;
temp = stats(ii,1);
stats(ii,1) = stats(j,1);
stats(j,1) = temp;
end
end
end
T = [stats(1).Centroid(1) stats(1).Centroid(2)];
wintx=30;
winty=30;
Point_pre(i,:)=[T(1)+AA(1,1),T(2)+AA(1,2)];
imshow(image_pre)
hold on;
plot(Point_pre(i,1),Point_pre(i,2),‘+’,‘color’,
[1.000 0.314 0.510 ],‘linewidth’,1);
pause
clear vars - L stats T bw
end
%post-trimming image
for i=1:num_Points
imshow(image_aft);
AA=floor(ginput(2));
img1=image_aft(AA(1,2): AA(2,2),AA(1,1):AA(2,1));
imshow(img1);
img1 = medfilt2(img1,[5 5]);
bw = im2bw(img1,1*graythresh(img1));
imshow(bw)
pause
L = bwlabel(bw);
stats = regionprops(L,‘all’);
for ii = 1:length(stats)
Area = stats(ii,1).Area;
for j = ii+1:length(stats)
if stats(j,1).Area > Area
Area = stats(j,1).Area;
temp = stats(ii,1);
stats(ii,1) = stats(j,1);
stats(j,1) = temp;
end
end
end
T = [stats(1).Centroid(1) stats(1).Centroid(2)];
wintx=30;
winty=30;
Point_aft(i,:)=[T(1)+AA(1,1),T(2)+AA(1,2)];
imshow(image_aft)
hold on;
plot(Point_aft(i,1),Point_aft(i,2),‘+’,‘color’,[ 1.000 0.314 0.510 ],‘linewidth’,1);
pause
clear vars - L stats T bw
end
%save the coordinate position
save Point_pre.txt -ascii Point_pre
save Point_aft.txt -ascii Point_aft
Point_pre=load(‘Point_pre.txt’);
Point_aft=load(‘Point_aft.txt’);
% Fine-tune the control points using cross-correlation.
input_points_corr=cpcorr(Point_aft,Point_pre,image_aft,image_pre); %optimism the points
%calculate the parameters of the transformation model
fTaffine=cp2tform(input_points_corr,Point_pre,‘affine’);
% Taffine=cp2tform(Point_aft,Point_pre,‘affine’);
% Transform the unregistered image to bring it into alignment
image_aftransf=imtransform(image_aft,fTaffine,‘XData’,[1 size(image_pre,2)],…
‘YData’,[1 size(image_pre,1)]);
image_aftrans=imtransform(image_aft,Taffine,‘XData’,[1 size(image_pre,2)],…
% ‘YData’,[1 size(image_pre,1)]);
% imshow(image_aftrans);
imshow(image_aftransf);
% image subtraction
% imshow(image_aftransf);
BB=floor(ginput(2));%manual selection of interest zone
pre=image_pre(BB(1,2):BB(2,2),BB(1,1):BB(2,1));
aft=image_aftransf(BB(1,2):BB(2,2),BB(1,1):BB(2,1));
figure
imshow(pre);
figure
imshow(aft);
area_cut=pre-aft;
imshow(area_cut,[])
bw = im2bw(area_cut,1.1*graythresh(area_cut));
bw=∼bw
imshow(bw)
area=sum(sum(bw==0))
Appendix 2
Declaration of conflicting interests
The author(s) declared no potential conflicts of interest with respect to the research, authorship and/or publication of this article.
Funding
The author(s) disclosed receipt of the following financial support for the research, authorship, and/or publication of this article: This work was supported by the National Basic Research Program of China (grant no. 2014CB046503), the National Natural Science Foundation of China (grant nos U1508207, 51505064 and 51575082), the National Innovative Research Group of China (grant no. 51621064) and the Education Ministry’s New Century Excellent Talents Supporting Plan Program of China (grant no. NCET-13-0081).