
Abstract
The perennial challenge for the industry is to make parts, assemblies and machinery lighter and more efficient. This has led to progressively wider application of composites due to their excellent strength, stiffness and corrosion resistance properties. Composite components are assembled predominantly by fastening, which makes drilling a common machining process for such components. Delamination of the component surface at entry and exit of the drill is a drilling defect frequently encountered. Assessment of the severity of the delamination is necessary for correction and improvement of the performance of the parts and assemblies. Over a period of time, several factors have been suggested as the index of delamination for comparison and control. Also, various techniques are being adopted to measure the extent and severity of delamination so as to calculate the assessment factor. This study aims to present and review the different means and methods for the assessment of delamination.
Introduction
Composites are results of research and innovations during the last few decades when these progressed from glass fiber for automobile bodies to particulate composites for aerospace and a range of other applications. There is wide use of composite laminates in industry. Some common examples of these laminates are carbon fiber–reinforced polymer (CFRP), glass fiber–reinforced polymer (GFRP) and fiber metal composite laminates (FMLs). Their applications cover sectors like aerospace, defense, transportation and power generation.1,2 Special characteristics of these materials make them difficult to machine as compared to other homogeneous materials. 3 Drilling is a very common secondary machining operation for facilitating assembly of parts made of fiber-reinforced materials. Delamination is a major damage encountered in drilling. 4 Rejection rates of up to 60% are reported in case of aircraft assembly work as a result of such defects. 5 Therefore, delamination can critically downgrade the performance of the finished part. The drilling thrust influences the extent of the delaminated area and the existence of a “critical thrust force” providing a threshold below which no occurrence of delamination is expected. 6 The following section describes the mechanisms of the delamination.
Types of delamination mechanisms
Peel-up mechanism
This mechanism can be explained in terms of the initial laminae being taken up along the drill flute as the drill starts the cutting process. This results in the upper laminae being pulled up away from the uncut portion of the job resulting in delamination.7,8 Peel-up mechanism is shown schematically in Figure 1.
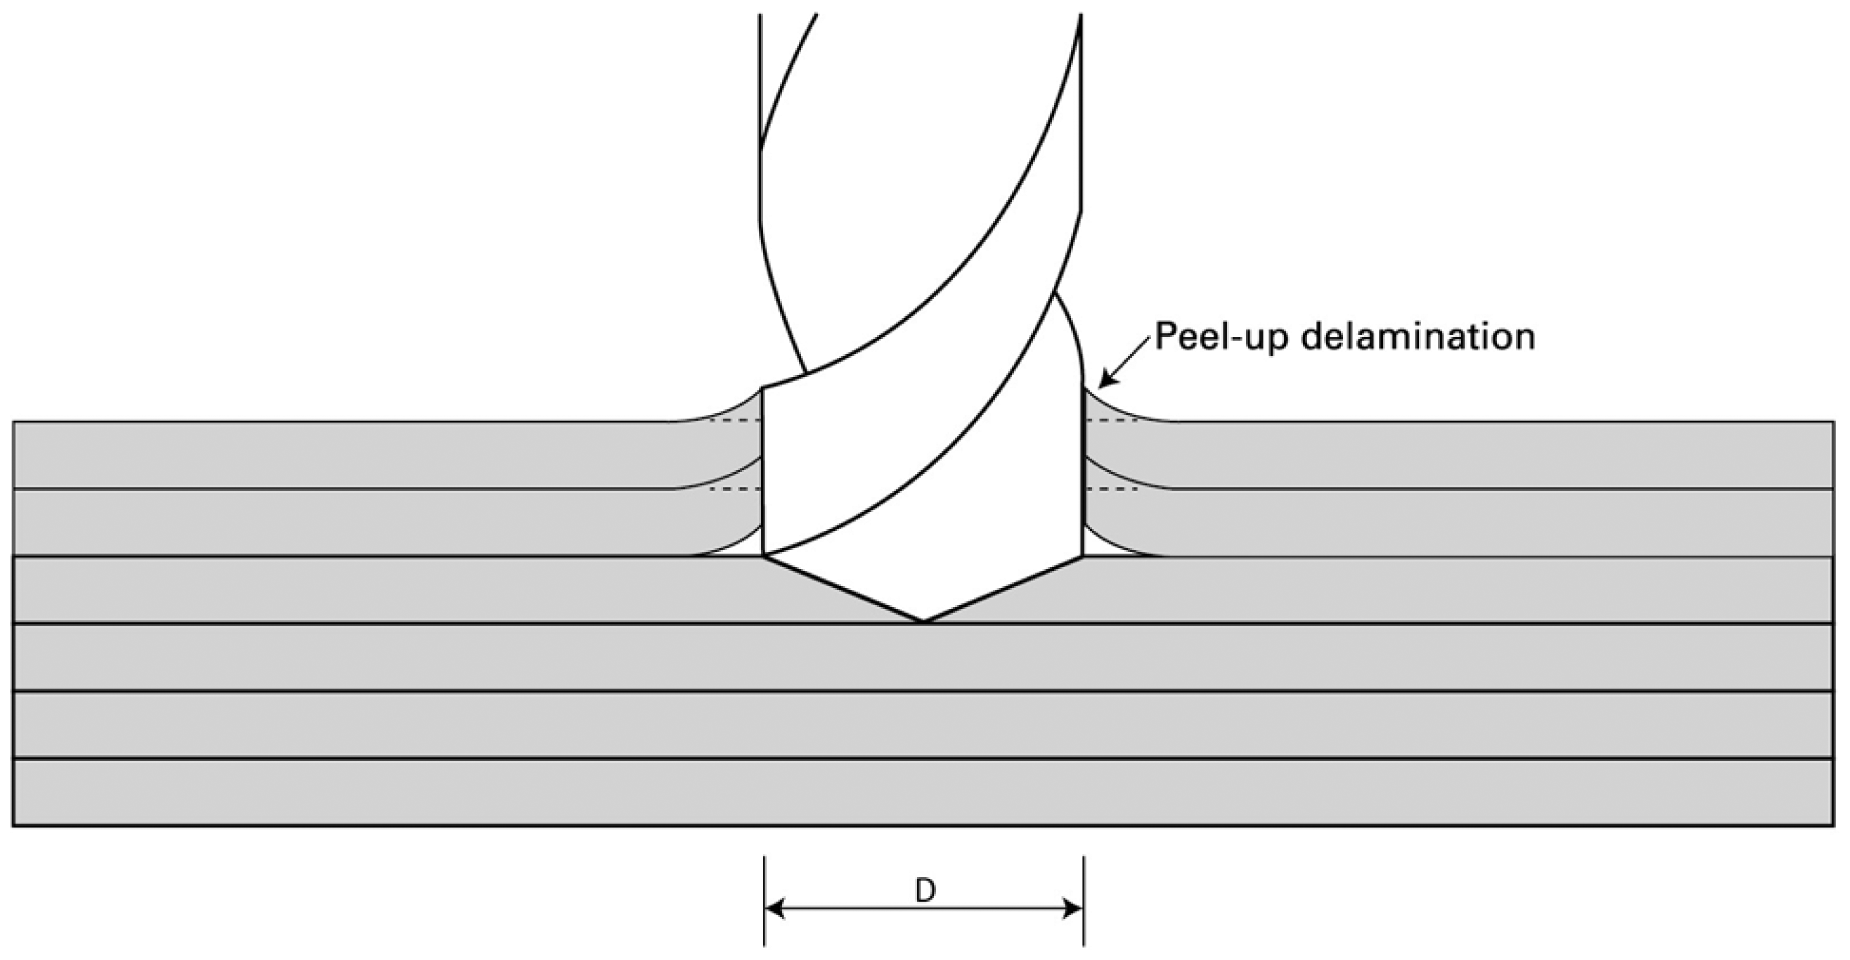
Peel-up delamination.
Push-out mechanism
While drilling, the laminae under the drill is compressed and when it nears the lowest layers of the composite, this thrust of the drill pushes out the laminae from the hole as it overcomes the inter-laminar bond strength. This causes delamination at the exit face of the workpiece.7,8 Push-out mechanism is shown schematically in Figure 2.
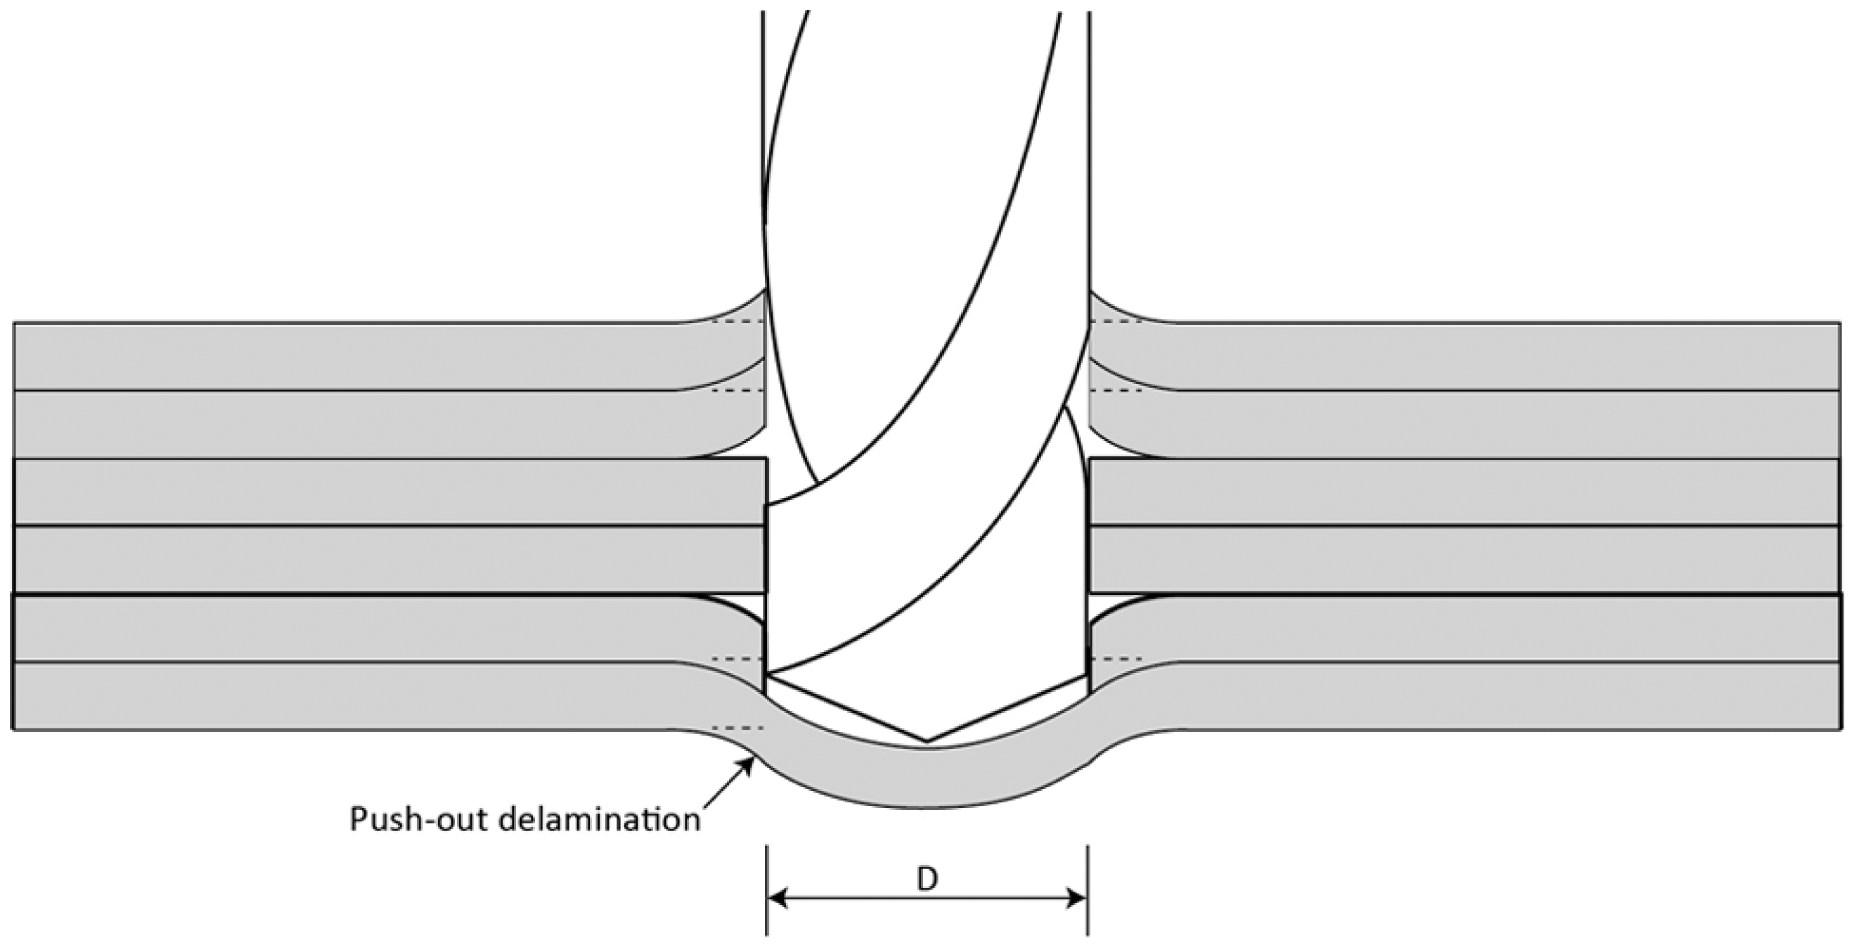
Push-out delamination.
Lachaud et al. 9 classify the drilling defects on composite materials into four categories: peel-up delamination, push-out delamination, geometric defects and thermal damages. They point out the unsuitability of the metal cutting drills for drilling composite materials, as demonstrated by the frequent occurrence of damages in aircraft structures due to drilling with high-speed steel (HSS) drills. Defect-free drilling is crucial since drilling is a final operation as no reaming is usually carried out on composites. 10 This study aims to present a detailed examination of the assessment of delamination factor and is divided into two parts. First part explains the various dimensional and non-dimensional measures used for assessing the delamination and the second describes the various methods for measuring the delamination, the final section being the concluding remarks.
Measures for the assessment of delamination
Techniques employed to assess the delamination vary considerably from one researcher to another. Abrão et al. 3 present different parameters considered to assess delamination. Some consider measurements of delaminated area or crack length, others use ratios of delaminated areas or radii to reference areas or radii as the delamination measure. The latter facilitates one to compare the results of different investigations. Figure 3 lists different measures used by various researchers to evaluate delamination. Following sections briefly describe various measures of assessing delamination.
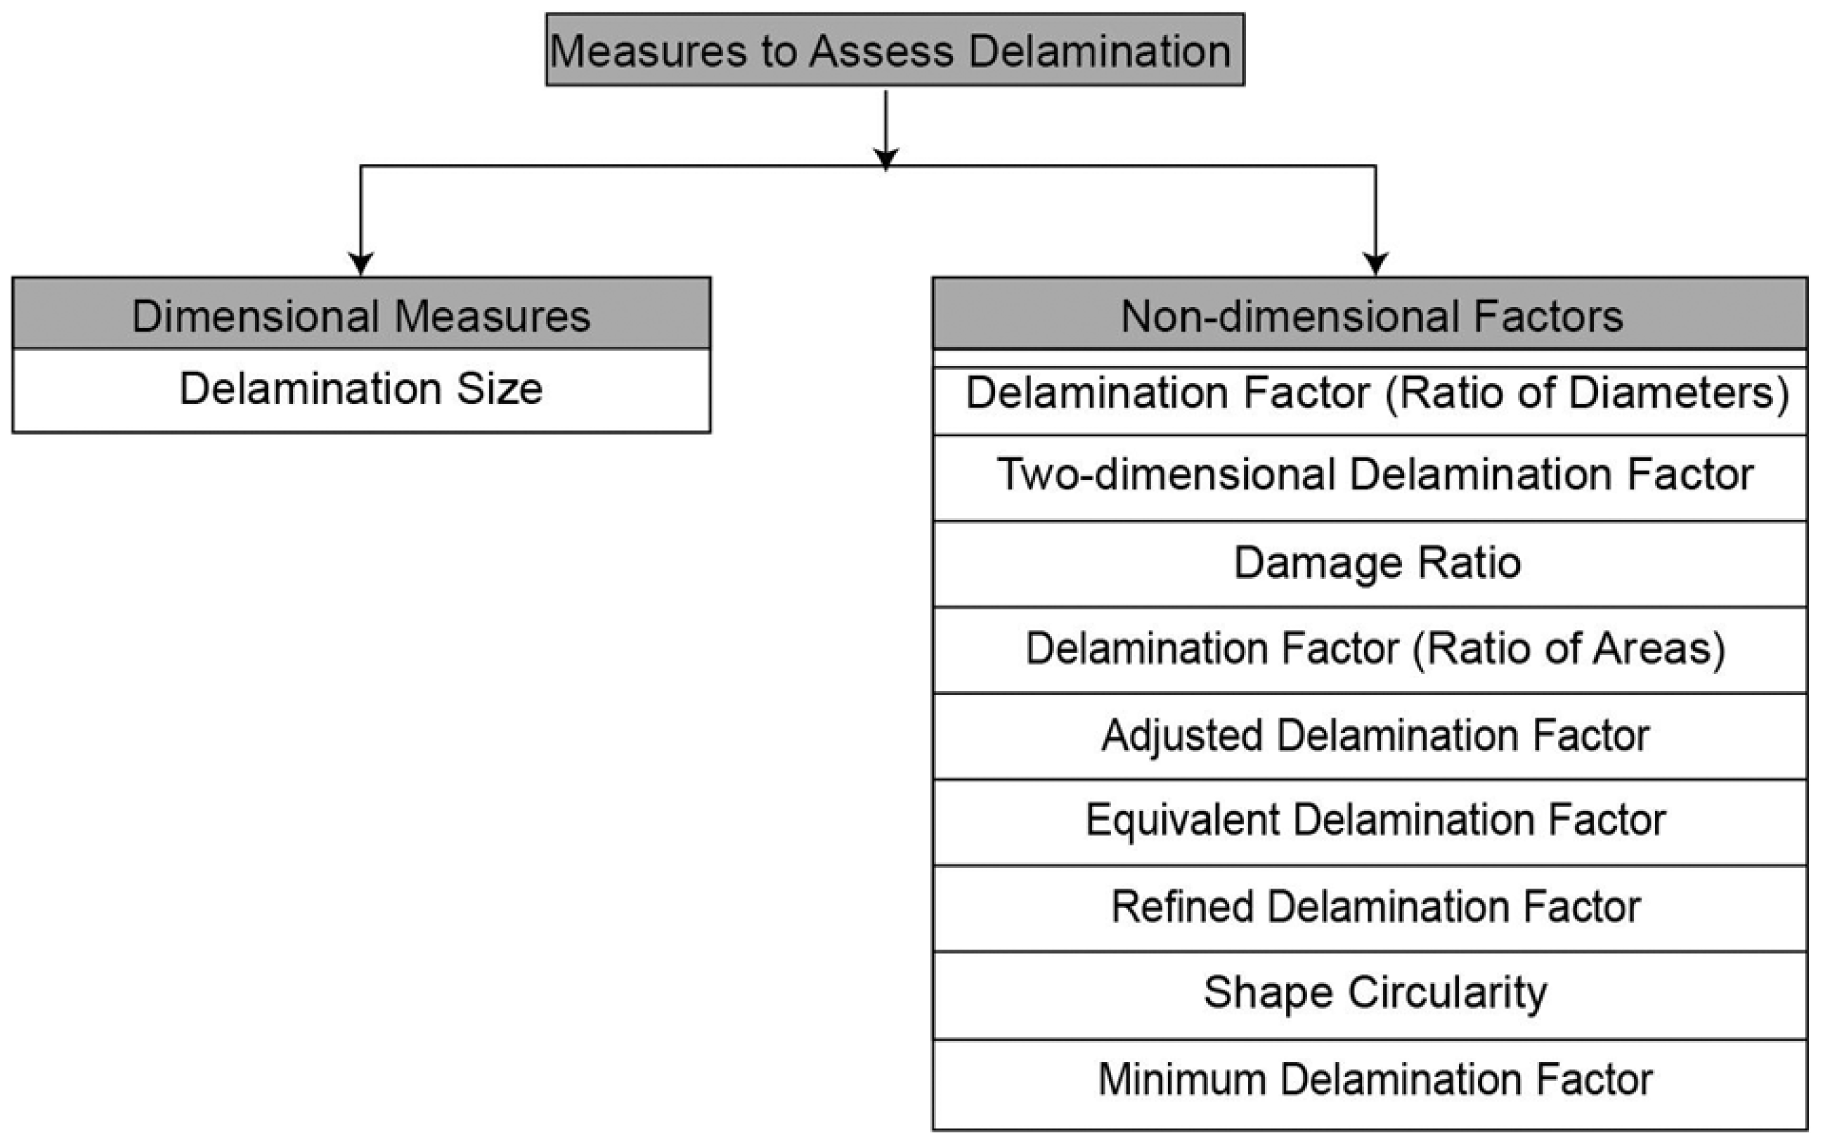
Principal measures used to evaluate delamination.
Delamination factor (Fd)
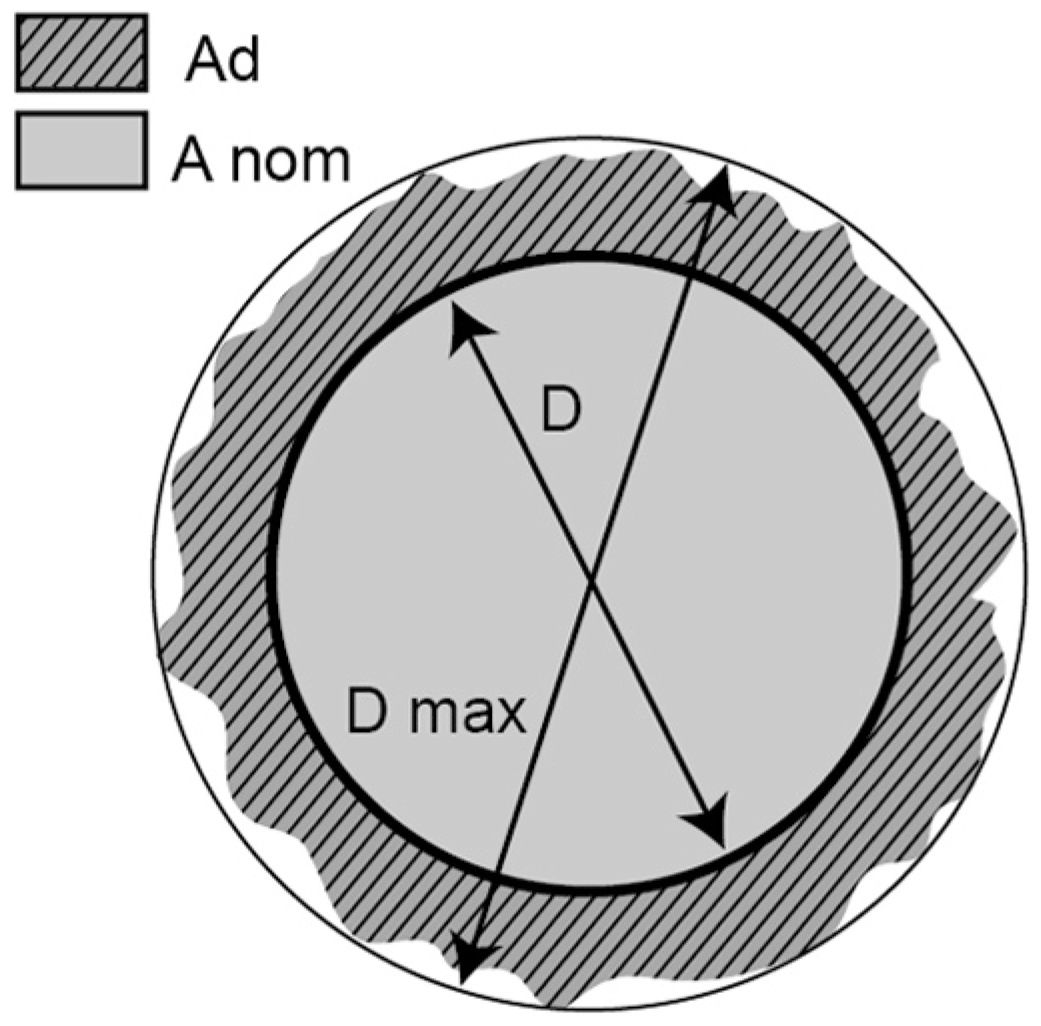
Chen 11 proposes a delamination factor for the assessment and comparison of the extent of delamination caused by drilling of laminated composites. It is a ratio called delamination factor (Fd) which is defined as the ratio of the maximum diameter of delamination (Dmax) to the nominal diameter of drilled hole (D) as shown in Figure 4. It is calculated using the formula given in equation (1)
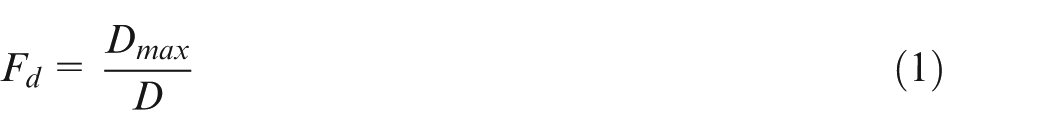
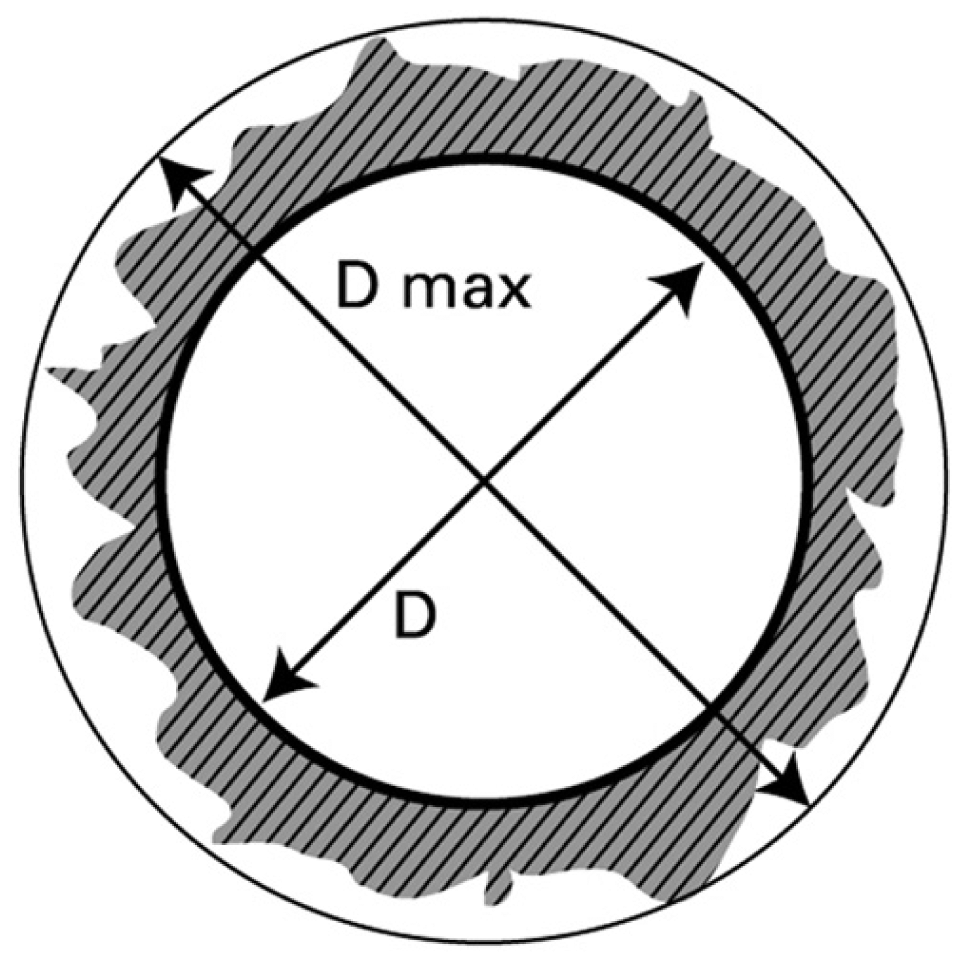
Scheme of evaluation of conventional delamination factor (Fd).
One-dimensional delamination factor may not be the correct method of assessing the delamination. The reason for this can be explained with Figure 5. Figure 5(a) and (b) will have the same Fd values as Dmax is same in both the cases, but Figure 5(b) specimen will be more prone to failure at lower load application than Figure 5(a) specimen in practical conditions as it is more severely damaged.
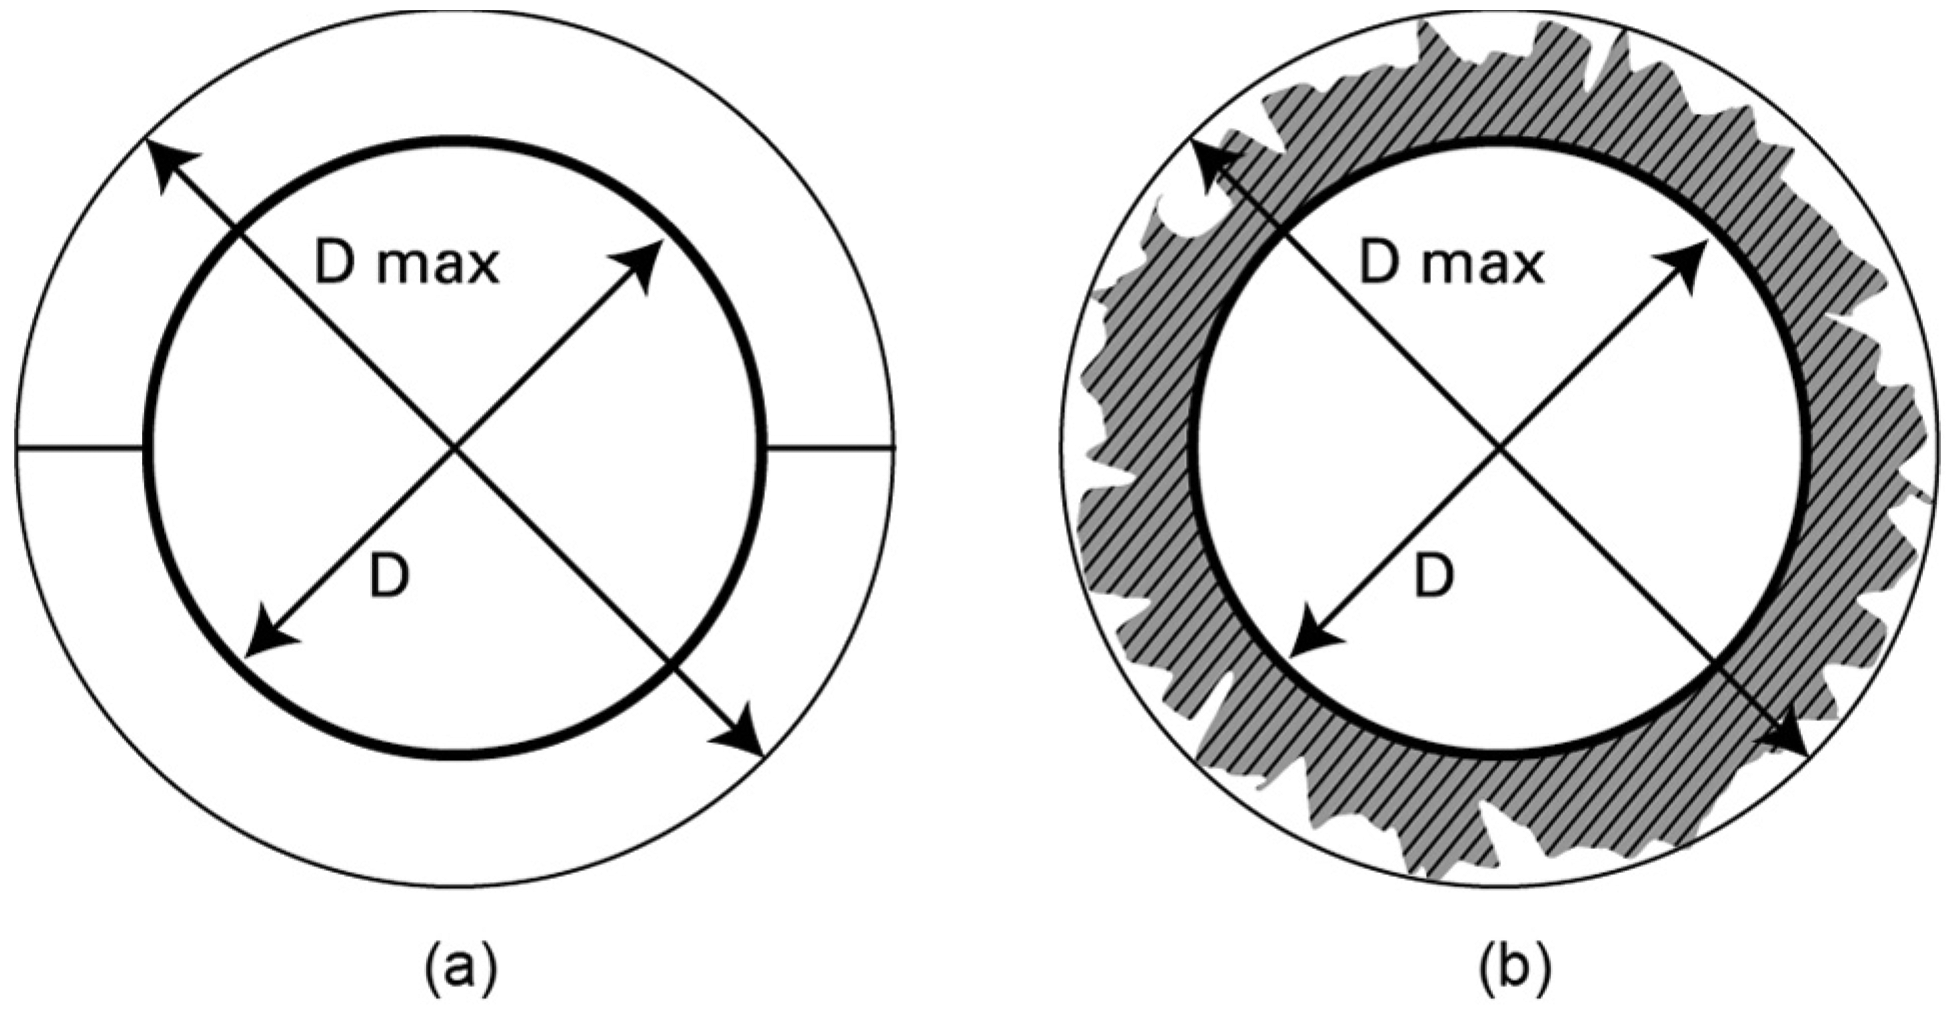
Diagram of the damage: (a) fine crack and (b) severe cracks with damaged area.
Delamination size
This is delamination measure proposed by Khashaba and colleagues. 12 The difference between the maximum radius of the damaged area (Rmax) and the radius of the drilled hole (R) is defined as the delamination size, as shown schematically in Figure 6. The delamination size is given by equation (2)

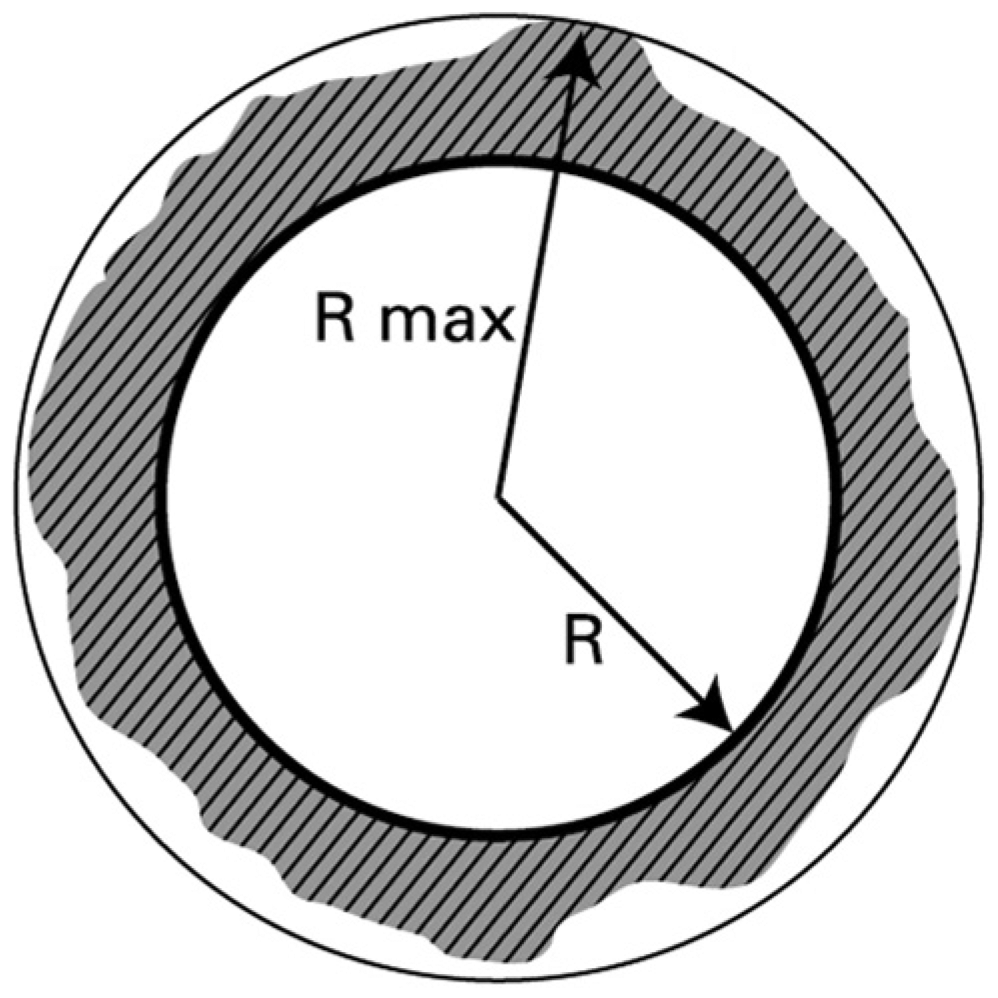
Scheme of evaluation of delamination size.
Two-dimensional delamination factor (Fa)
As pointed out by Faraz et al., 13 Fd may not give a complete picture of delamination since a few fibers delaminating can give a large radius with small delamination of the hole periphery as illustrated in Figure 5. They therefore propose a two-dimensional delamination factor (Fa), which is given in equation (3) and schematically shown in Figure 7. Anom is the nominal drill area
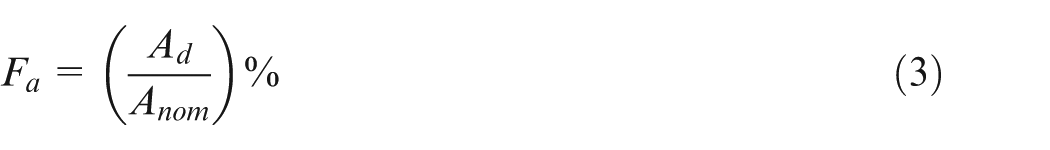
Scheme of evaluation of two-dimensional delamination factor.
Fa appears to be better for assessing delamination, but this method also may not be the most accurate one, as can be explained with Figure 8. Figure 8(a) and (b) shows the same delaminated area and hence same Fa values, but Figure 8(b) specimen is more prone to failure at lower load application than Figure 8(a) specimen in practical conditions as it is more severely damaged, with more fine cracks. Crack contribution to delamination damage is neglected in this method. This method considers only the contribution of delaminated area to delamination damage.
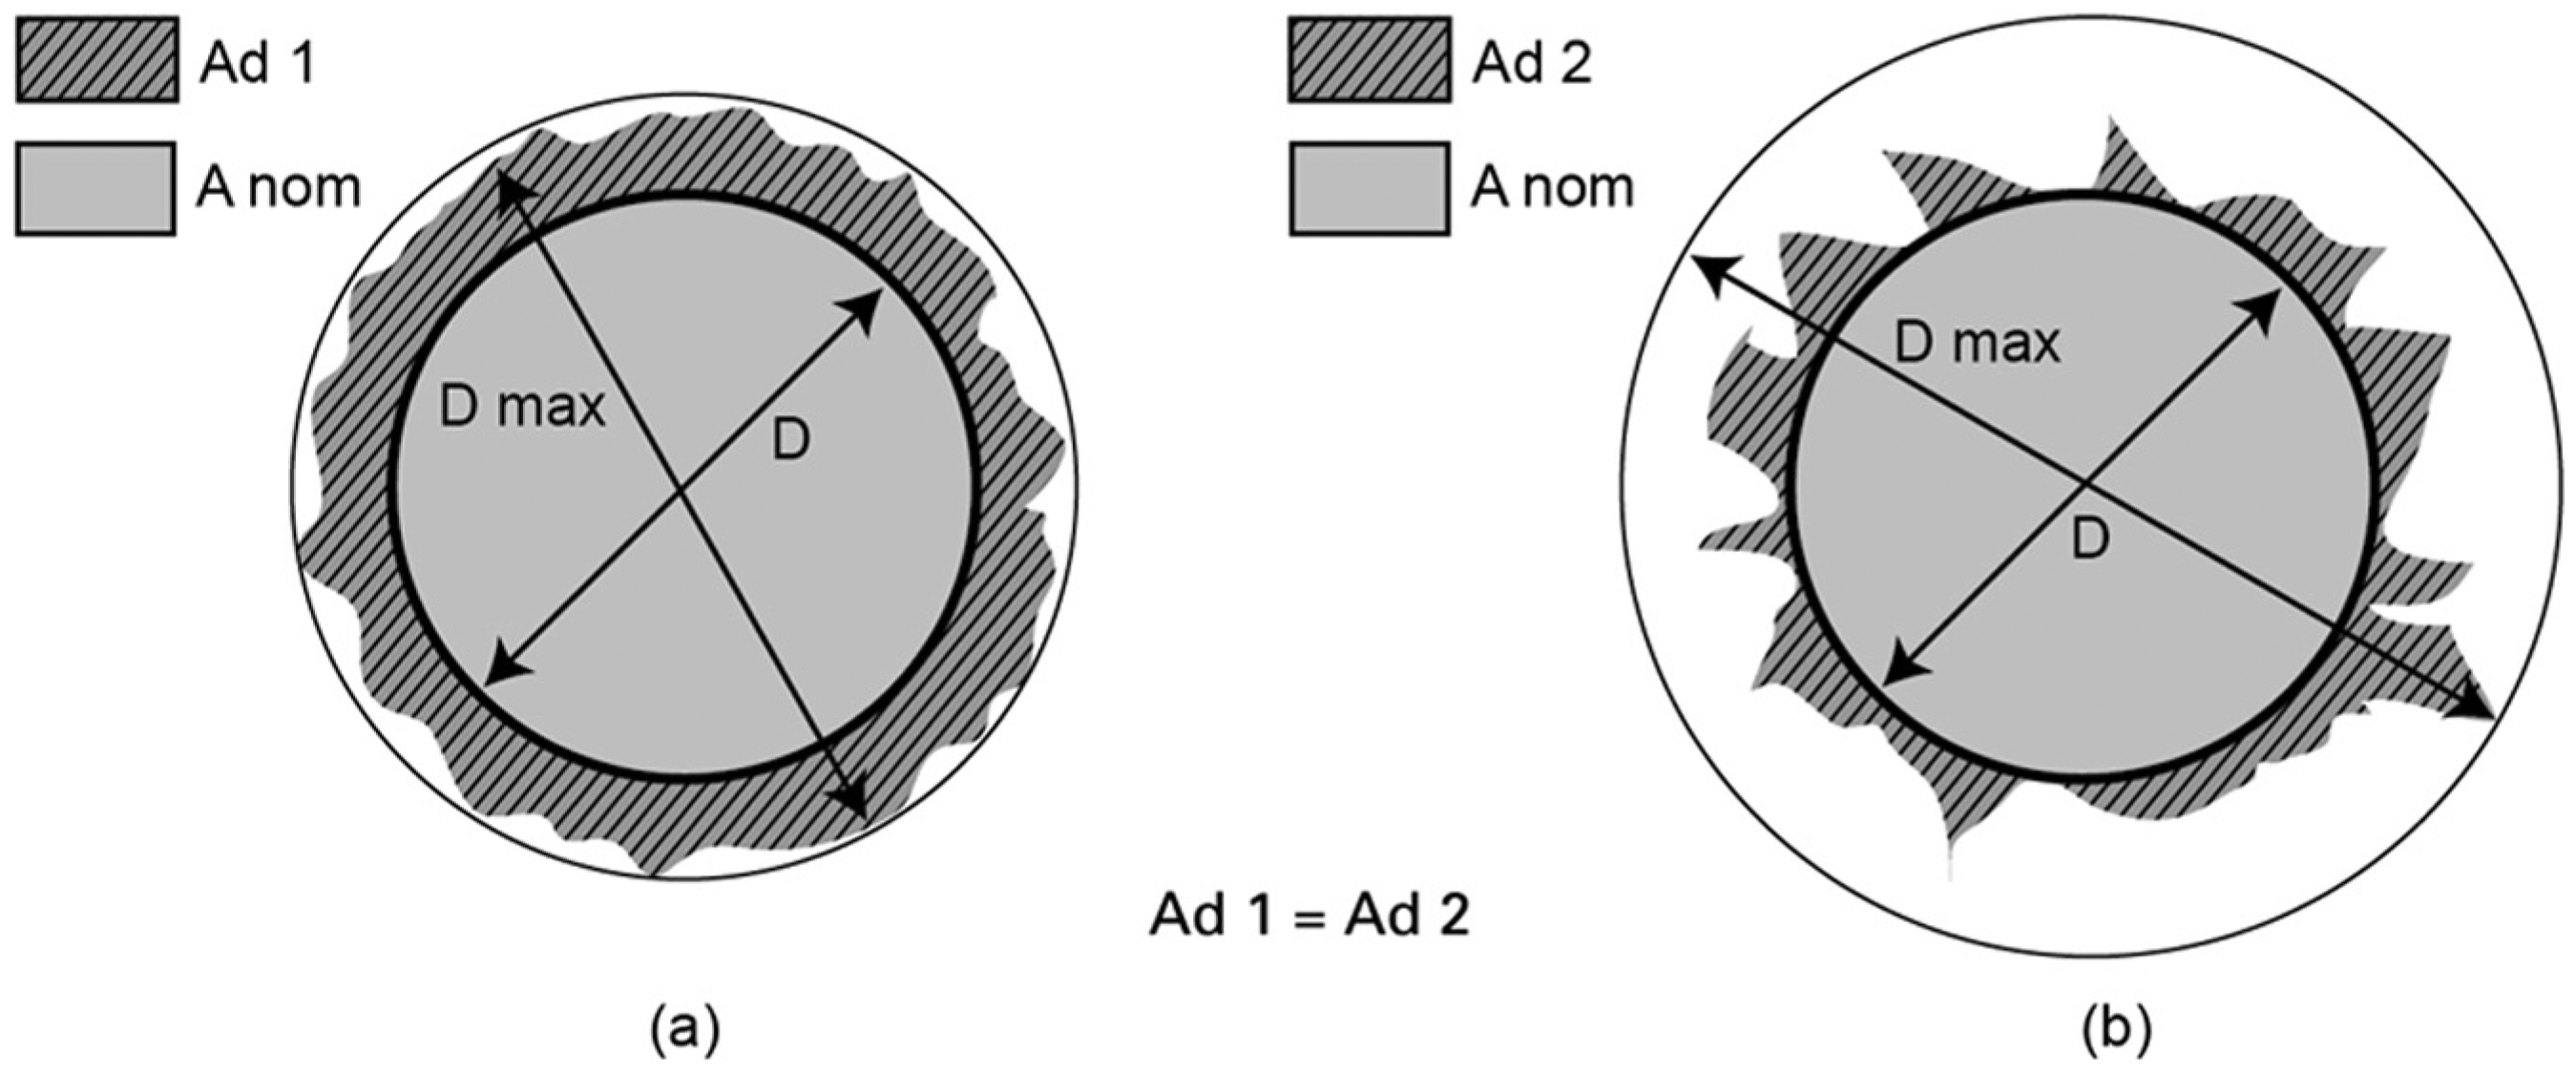
Diagram of the delamination damage: (a) uniform damage and (b) irregular damage with severe cracks.
Damage ratio (DRAT)
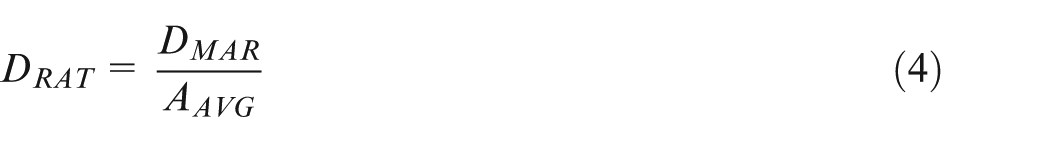
Mehta et al. 14 suggest another ratio called the damage ratio DRAT, which is defined as the ratio of the damaged area at hole periphery, DMAR, to nominal area of drilled hole, AAVG. Equation (4) gives the formula for calculating damage ratio
This is similar to the two-dimensional delamination factor, except that, it is expressed as a factor instead of a percentage. This method may also have the same disadvantages as those of two-dimensional delamination factor.
Delamination factor (Fd)
The delamination factor (Fd) suggested by Mohan et al. 15 is calculated as the ratio of the area of delamination to the nominal hole area. Equation (5) calculates this factor
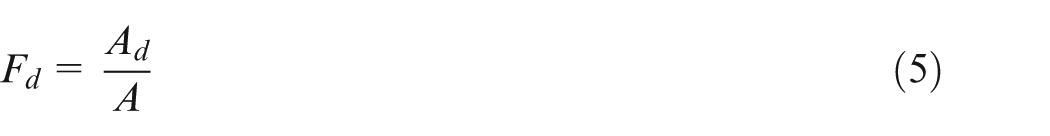
where Ad is the total area of the drilled hole and delamination, and A is the nominal hole area. This method may also have the same demerit as that of two-dimensional delamination factor and damage ratio.
Adjusted delamination factor (Fda)
The conventional delamination factor (Fd) does not truly represent the magnitude of delamination as it does not consider the area of delamination, and the two-dimensional delamination factor methods are also not the correct representation of damage magnitude as these methods do not include the maximum crack length while assessing the delamination factor. Therefore, a new approach to calculate the delamination factor was suggested by Davim et al., 16 named as adjusted delamination factor (Fda). Equation (6) is used to calculate this factor which is shown schematically in Figure 9. The first part of equation (6) is the conventional delamination factor, Fd, reflecting the crack damage and the second part reflecting the extent of the damage area (Fa, DRAT)
where Amax is the area corresponding to Dmax, and A0 is the area corresponding to D0.
Scheme of evaluation of adjusted delamination factor.
This method appears to be more appropriate than earlier mentioned methods as it takes care of both the maximum crack length and the damaged area of delamination. This method gives different Fda values for the cases shown in Figure 10(a) and (c). But, it may still be inaccurate as can be explained with Figure 10(b). Figure 10(b) consists of very fine cracks which may constitute very negligible area. Therefore, the delamination factors for Figure 10(a) and (b) can show almost the same value of Fda. But, Figure 10(b) specimen will be more prone to failure at lower load application than Figure 10(a) specimen in practical conditions. Moreover, in this method, the damaged area, Ad has a multiplication effect on Fda, which leads to a higher value indication of the factor.
Schematic diagram of the delamination damage: (a) fine crack, (b) more number of fine cracks and (c) maximum delamination area.
Equivalent delamination factor (Fed)
The adjusted delamination factor is superior to the previously mentioned factors in assessing the delamination. However, it does not have a direct correlation with Fa and has the tendency to exaggerate the factor value as indicated earlier. Therefore, another delamination factor was proposed by Tsao et al. 17 called the equivalent delamination factor (Fed). It is calculated using equation (7). The equivalent diameter is calculated using equation (8). The schematic representation of equivalent diameter is shown in Figure 11
where De is the equivalent diameter which is calculated by equation (8)
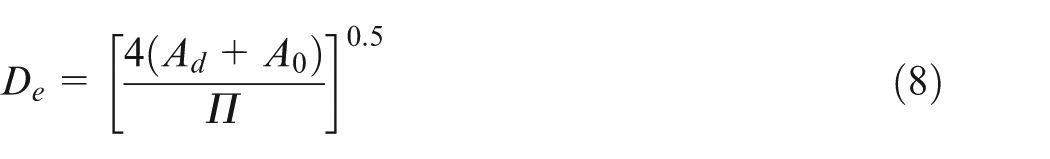
Scheme of evaluation of equivalent delamination factor.
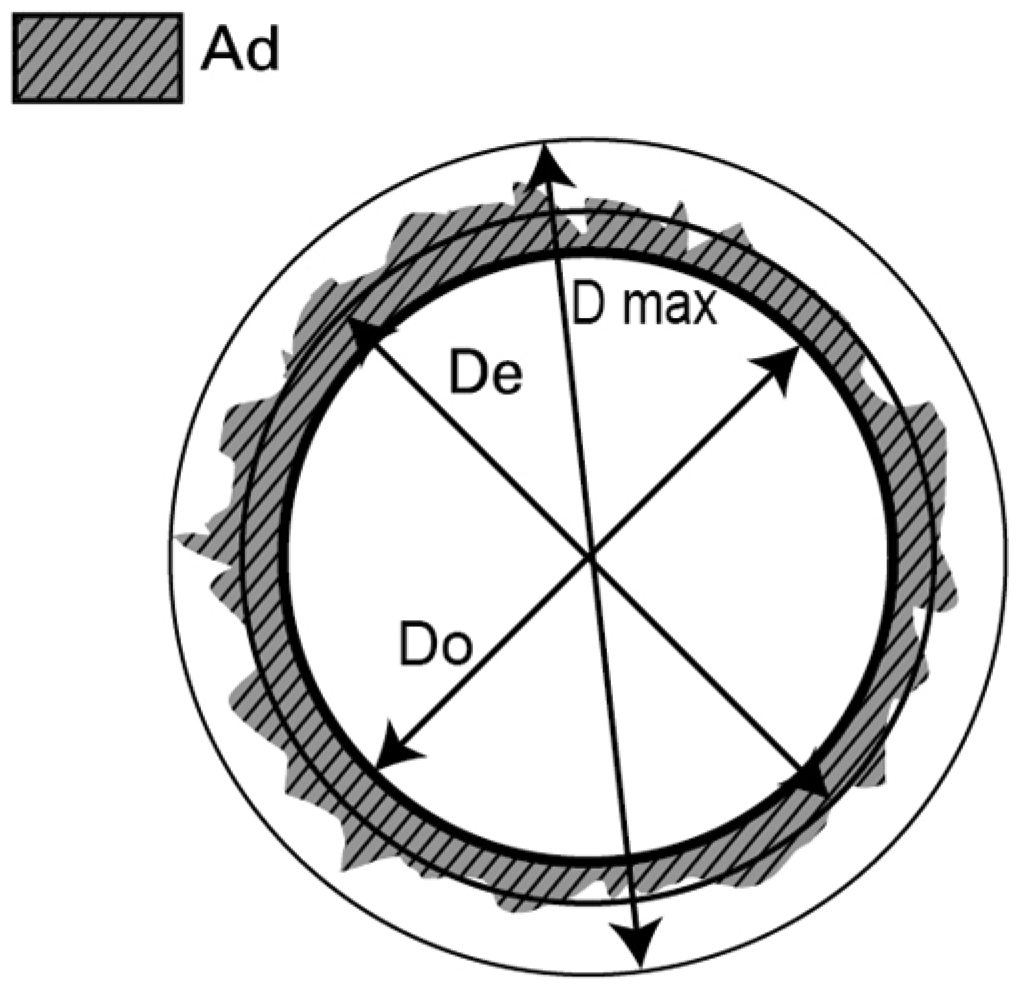
Although Fed appears to be a better method for assessing delamination, it still may not be an accurate method, as can be explained by Figure 12. Figure 12(a) and (b) shows the same delaminated area and hence the same equivalent diameter De and same Fed values, but Figure 12(b) specimen is more prone to failure at lower load application than Figure 12(a) specimen in practical conditions, as it is more severely damaged with many cracks. Crack contribution on delamination damage is negligible in this method, the dominant consideration being damaged area due to delamination.
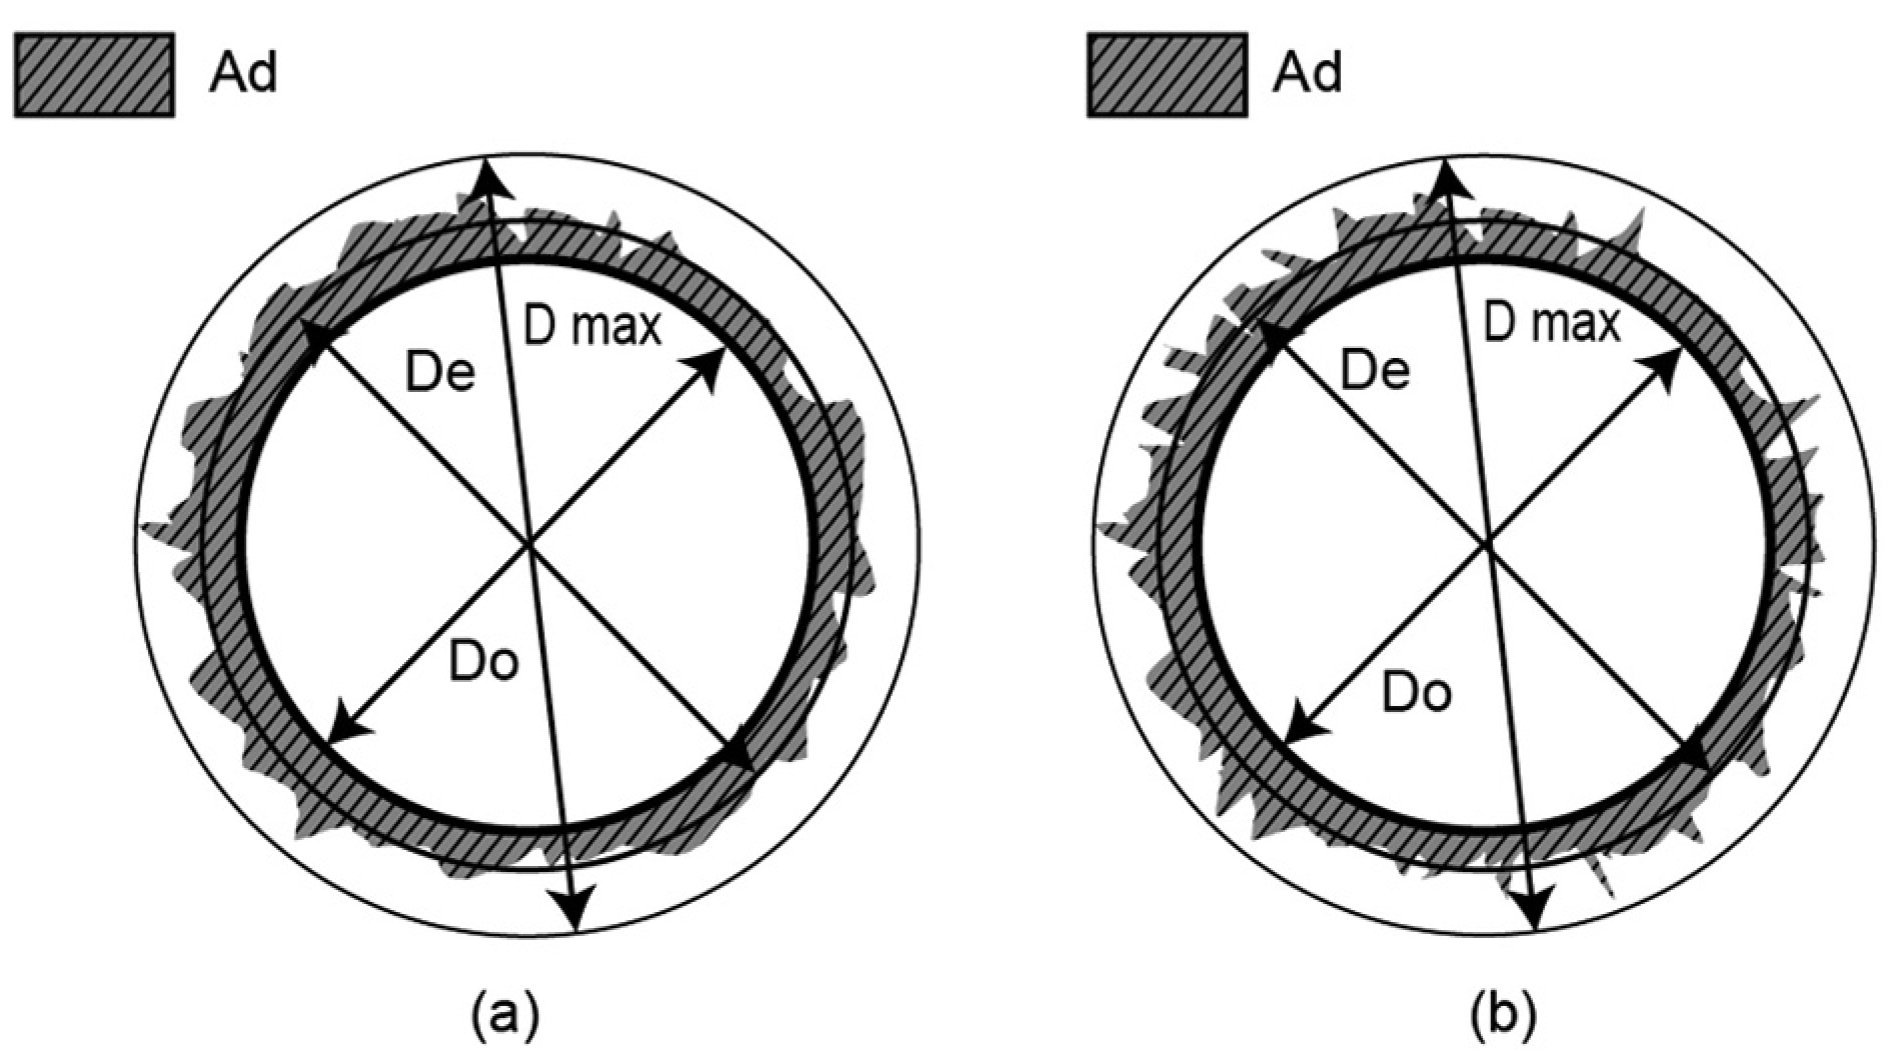
Diagram of the delamination damage: (a) uniform damage and (b) damaged with severe cracks.
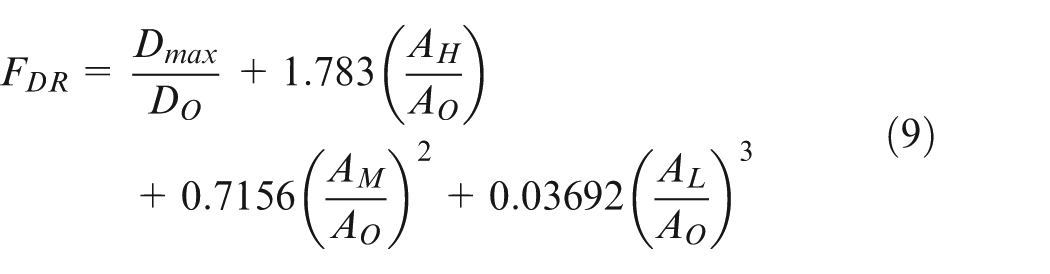
Refined delamination factor (FDR)
Since the above-mentioned methods of assessing the delamination do not reflect the extent of severity of damage, Nagarajan et al.
2
proposed a method to calculate, what they called the refined delamination factor (FDR). They divided the total damage area into three areas, namely, heavy damage area (AH), medium damage area (AM) and low damage area (AL), the severity being assessed based on the depth of the damage and quantitatively measured using the concept of neural network with MATLAB 7.0 tool. They used Buckingham’s
This factor appears to be better than the other measures, as they considered all the elements of delamination damage to assess the delamination. They conducted some destructive tests to validate their method of assessment of delamination factor. But they limited their validation tests to one spindle speed of 1400 r/min to support their method. It may need more number of destructive tests with the samples drilled at different spindle speeds to validate their method of assessing delamination factor.
Shape circularity (f)
Durão et al. 18 suggested consideration of the shape of the damaged area in the analysis of the delamination factor. This is done through the calculation of the shape’s circularity (i.e. the similarity of the shape of delaminated area compared to a circle of equal perimeter) using equation (10)
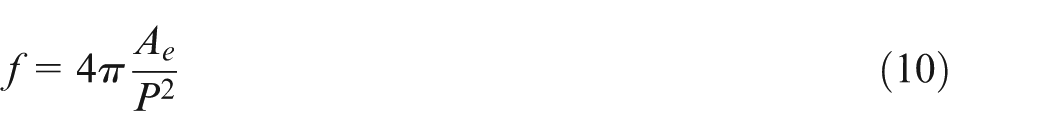
When the damage pattern resembles a circle, the circularity will be nearly 1. As the value approaches 0, the damage pattern becomes an elongated polygon. This method focuses on the shape of damaged area. From their research they concluded that the use of HSS drills resulted in higher damaged area circularity (i.e. more circular in shape), whereas carbide drills had no influence on the shape of the damaged area. They also could not establish any correlation between circularity and damage extension or bearing strength. This leads to a conclusion that shape circularity cannot be included in the assessment of delamination.
Minimum delamination factor
Recently, Da Silva
19
proposed a different approach to measure the damage caused by drilling, called the minimum delamination factor
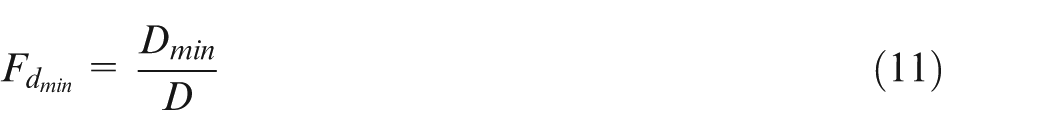
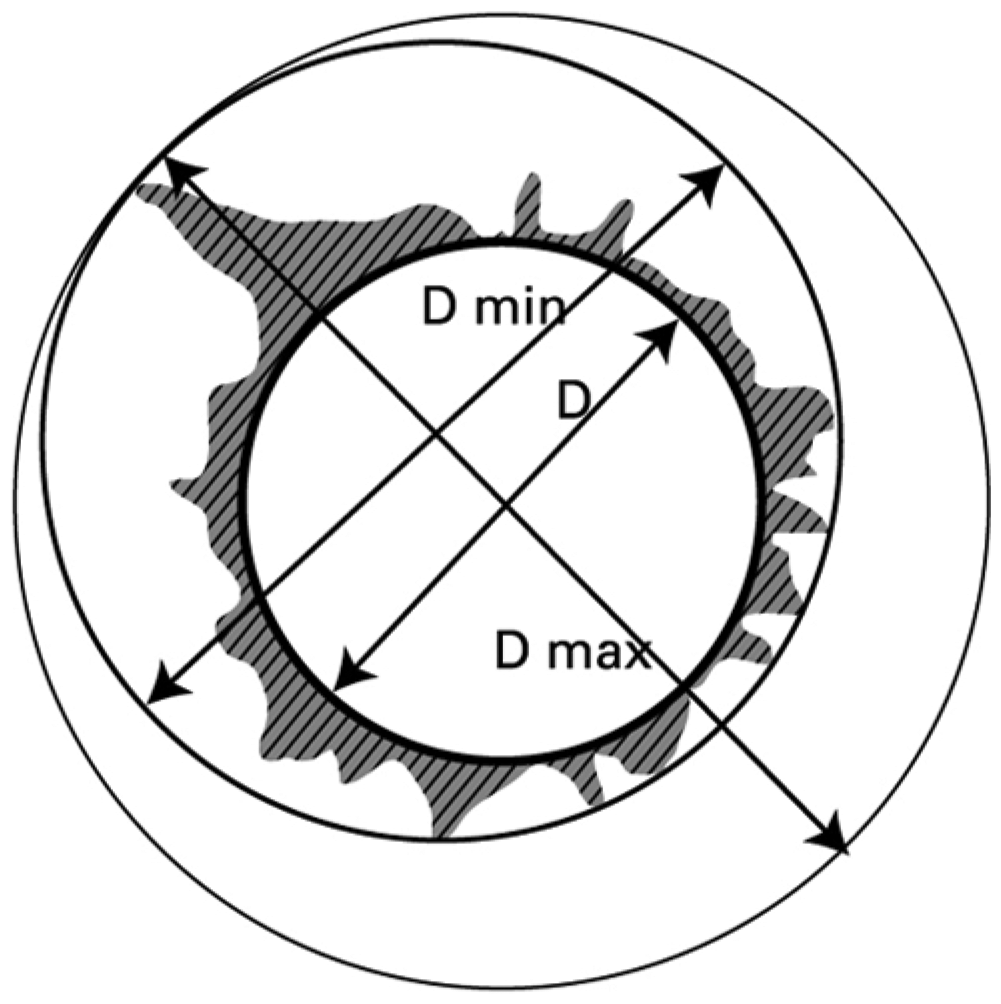
Scheme of evaluation of minimum delamination factor.
The formulation of the
Sereshk and Bidhendi 20 make a comparison of conventional delamination factor, area ratio and adjusted delamination factor along with the shape circularity to identify their applicability.
The literature survey indicates that several authors used different approaches to assess the delamination factor. The various methods adopted by them are tabulated in Table 1.
Evaluation of delamination factor by various researchers. a
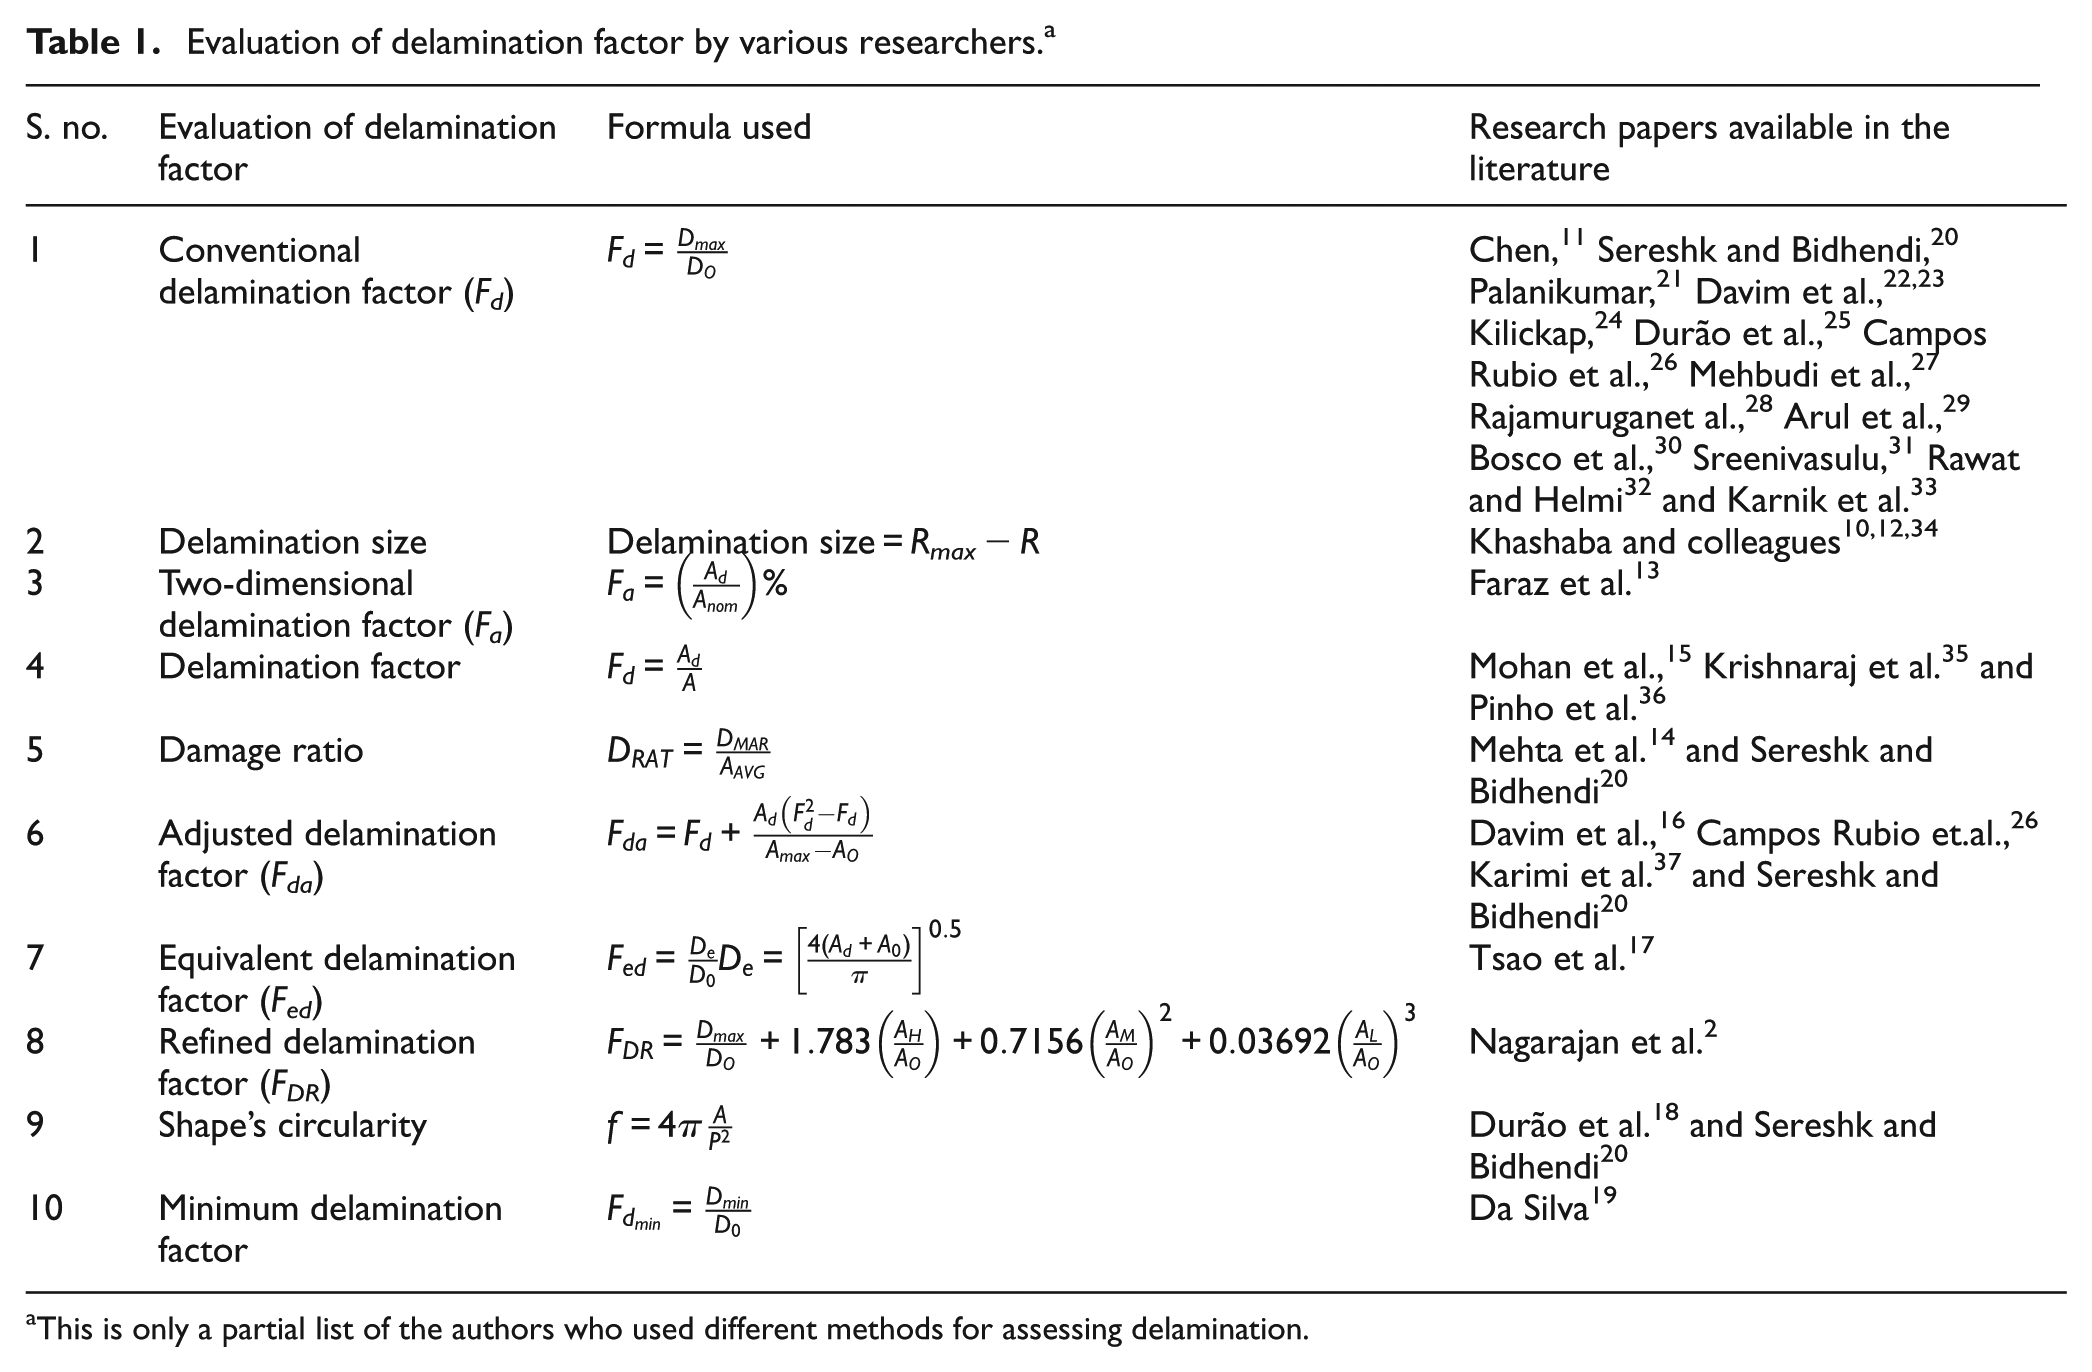
This is only a partial list of the authors who used different methods for assessing delamination.
Most of them used linear regression analysis to obtain empirical models of delamination to arrive at the delamination factor (Fd). The methods listed at 6, 7, 8 and 10 in the list appear to be better methods for assessing the delamination. There is no consistency and common agreement among the various methods. The time has come now to arrive at a standard method to assess the delamination factor.
Methods for measuring delamination
Various techniques for measuring the delamination were developed over a period of time which included measuring the dimensional parameters like length and area. Earlier researchers focused mainly on the maximum diameter of delamination damage;11,12 later, it was understood that consideration of damaged area was more appropriate in assessing the delamination. The methods used by various researchers to measure the delamination are explained in the following sections.
Microscopy
Visual measurement of delamination damage using microscopes is a convenient and economical measurement method adopted by many researchers. Enemuoh et al. 38 and Davim and Reis 39 used a tool-maker’s microscope to measure the delamination. They used magnifications of 5× and 30×, respectively, for the measurements in AS4/PEEK and CFRP composite materials. Caprino and Tagliaferri 40 used a 10× magnification to measure the extent of the damaged area in GFRP composites. A strong light source kept at the back helped this visual inspection. Similar visual measurement of delamination of graphite-epoxy composites was carried out by Stone and Krishnamurthy. 41 They used a charge-coupled device (CCD) camera with a digitizer to capture the images. Tagliaferri et al. 42 used a liquid to diffuse into the material through the delaminated surface which is then measured using an optical microscope with a magnification of 10×. Obviously the results were influenced by the length of time during which the material was immersed in the liquid. They adopted a standard immersion time period of 24 h for all the measurements. This leaching with the chemical affects the characteristics of the specimen, thus vitiating the non-destructive nature of the visual measurement. 43
Scanning electron microscopes (SEMs) are employed by some researchers to obtain images of delamination with high magnification. An example is that of Murphy et al. 44 who used this method in their investigation of drilling CFRP composites. Visualization techniques for the measurement of delamination damage are quite challenging for non-transparent composites like carbon fiber–reinforced epoxy composites. 43
The researchers used different techniques for the visual measurement of the delamination; there was no consistent procedure followed within the same method making the results not strictly comparable.
Image processing
In 2004, Khashaba 10 developed a technique which could measure the delamination size of up to 10−3 mm accuracy. The measurement could be cheaply done using a PC, a color scanner and related image software. The procedure used by him was as follows.
The specimen was placed directly on the glass plate of the scanner and the photograph of the drilled specimen was acquired, with 400 DPI resolution, using the software supplied with the scanner, directly. Shadow zone (delamination) was clearly observed around the drilled hole due to the transmitted light through it. Using the contrast, brightness and focusing utilities, the shadow zone was easily distinguished from the other undamaged area. The file was saved in BMP format. This file was imported to the “CorelDRAW” program, and the image was magnified up to 30×. A circle was drawn to the delamination (shadow) zone. The CorelDRAW program gave the diameter of the circle within 10−3 mm. The delamination size was calculated as the difference between the maximum damage radius and the radius of the drilled hole. This technique was calibrated by measuring several dimensions on standard steel ruler.
Faraz et al. 13 used stereomicroscopy along with image processing using a computer for measurement of delamination. Special illumination of the stereomicroscope makes it possible to observe and measure the delamination in three dimensions (3D), making use of the varying reflection of the light from the uneven delaminated surface. They used an integrated camera and connected computer to acquire and store the images. Using commercial image processing software “AnalySIS,” they measured the delaminated area by pixel count.
Digital image processing and analysis thus form an important knowledge field that is able to acquire, process and analyze digital images. It consists of four stages: (1) image acquisition, (2) pre-processing, (3) measurement and analysis of characteristics and (4) results and conclusions:
Image acquisition: Common image acquisition techniques use visible light, infrared, microwaves and X-rays, video cameras, digital cameras, digital X-ray equipment and so on. Thermal imaging using infrared pulses is another important method in cases of large components like aircraft panels. 2 The image acquisition is a very important stage since the quality of the images is crucial for the success of the later stages and the accuracy of the final results.
Pre-processing: The first step in preprocessing is to improve the image quality. It involves operations to reduce noise, remove unnecessary and wrong data, restoration of impaired images and enhancement of the clarity and contrasts of the images. Next step is image segmentation where the images are demarcated into regions of interest based on specified properties. A threshold value is applied to convert the grayscale image to the binary image. 8 Segmentation thus facilitates computational image processing and analysis.
Analysis: First, the measurements of the required characteristics from the segmented regions are carried out. Usual characteristics measured are perimeter, diameter, area, texture and crack length. These measurements are then used for comparison, analysis and reasoning.
Results: On the basis of the analysis of the measurements, the possible results and conclusions are arrived at with respect to the objects whose images are processed.
Several authors like Khashaba, 10 Durão et al., 18 , 25 Campos Rubio et al., 26 De Albuquerque et al. 45 and Silva et al. 46 evaluated the delamination factor using the digital image processing method.
In the assessment of delamination from digital images, it is necessary to identify the drilled hole, delaminated zone and the unaffected region. A neural network is used by some researchers in the segmentation and analysis of these identified regions. Using the inputs of the pixel values of the image, the network segments the regions. The diameters and areas of the segmented regions are then computed by taking the lengths of the longest diagonals as the diameters and the number of pixels giving the areas of the respective regions.
Researchers use various techniques like X-ray radiographic images, digital scanning, shop floor microscope, SEM and stereomicroscopy to acquire the images. Advancements in digital image processing have made analysis of these captured images more accurate. Image acquisition plays a major role in its further accurate processing. Till now there is no common agreement on the acquisition techniques of images for the assessment of delamination. Moreover, different researchers used different techniques in processing the digital images in the selection of threshold values and noise reduction and use of other software techniques. These techniques may give different delamination values for the same delamination damage.
Acoustic emission
This method allows online assessment of delamination. Hocheng and Jia 47 used acoustic emission method for monitoring drilling defects in electronic circuit boards. Cai et al. 48 used acoustic emission monitoring along with other methods to experimentally analyze delamination damage in high-speed drilling of carbon fiber–reinforced composites.
When an external force acts on a material, putting it under stress, any resulting damage causes a quick release of energy which manifests as sound waves. This is called acoustic emission. This release of sound waves can indicate the effect of drilling on a material (delamination). The root mean square (RMS) value of acoustic signal can be used for the analysis of this effect. The output voltage from the acoustic emission sensor is the measure of the emitted energy. The amount of released energy is correlated to the square of the RMS voltage in a linear relationship. One constant of the relationship is considered to be a function of the properties of the composite material and the machining set up, and the other the threshold for the onset of delamination. The values of these constants can be arrived at by conducting machining trials with a sample specimen for a particular machining operation and used for monitoring the actual process in real time for any onset of damage. A schematic arrangement for acoustic emission monitoring in a drilling set up is given in Figure 14.
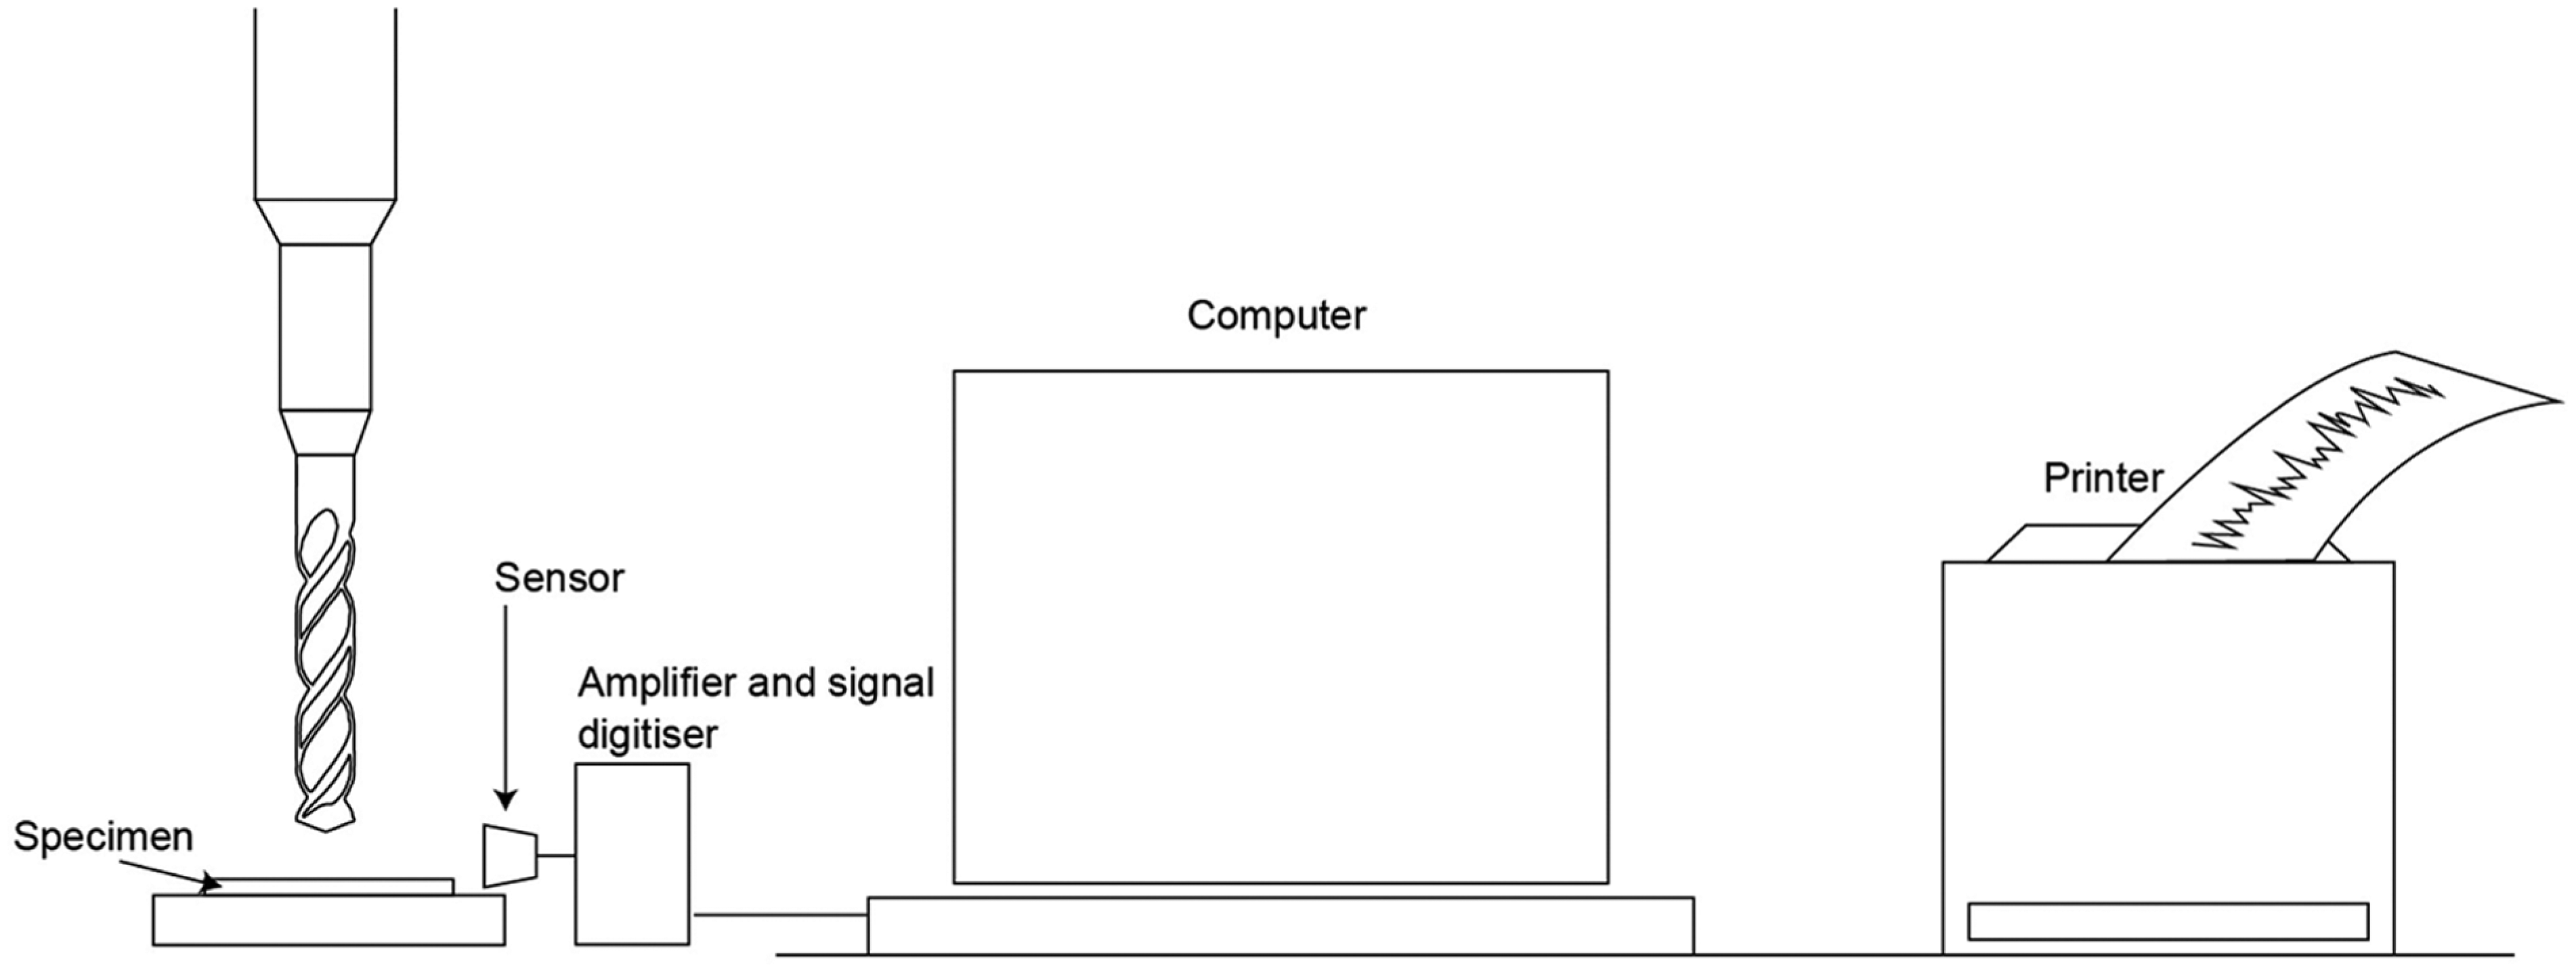
Schematic arrangement for acoustic emission monitoring in a drilling set up.
Ultrasonic C-scan
Durão et al., 18 Cai et al. 48 and Tsao et al. 17 measured the delamination using ultrasonic C-scan. In this method, the ultrasonic waves at frequencies above 20 kHz 48 are passed through the test specimen, and the echo signal acquisition from any discontinuity is done with a digital oscilloscope. The two methods of ultrasonic scan, the pulse echo method and the through transmission method, can be used. Delamination measurement data can then be obtained from the C-scan image using commercial software (PhotoImpact 8). A large number of images can be obtained, their contrast depending on the resolution opted for each scanning, which can then be used for the assessment of delamination. A schematic arrangement of pulse echo ultrasonic C-scan is shown in Figure 15.
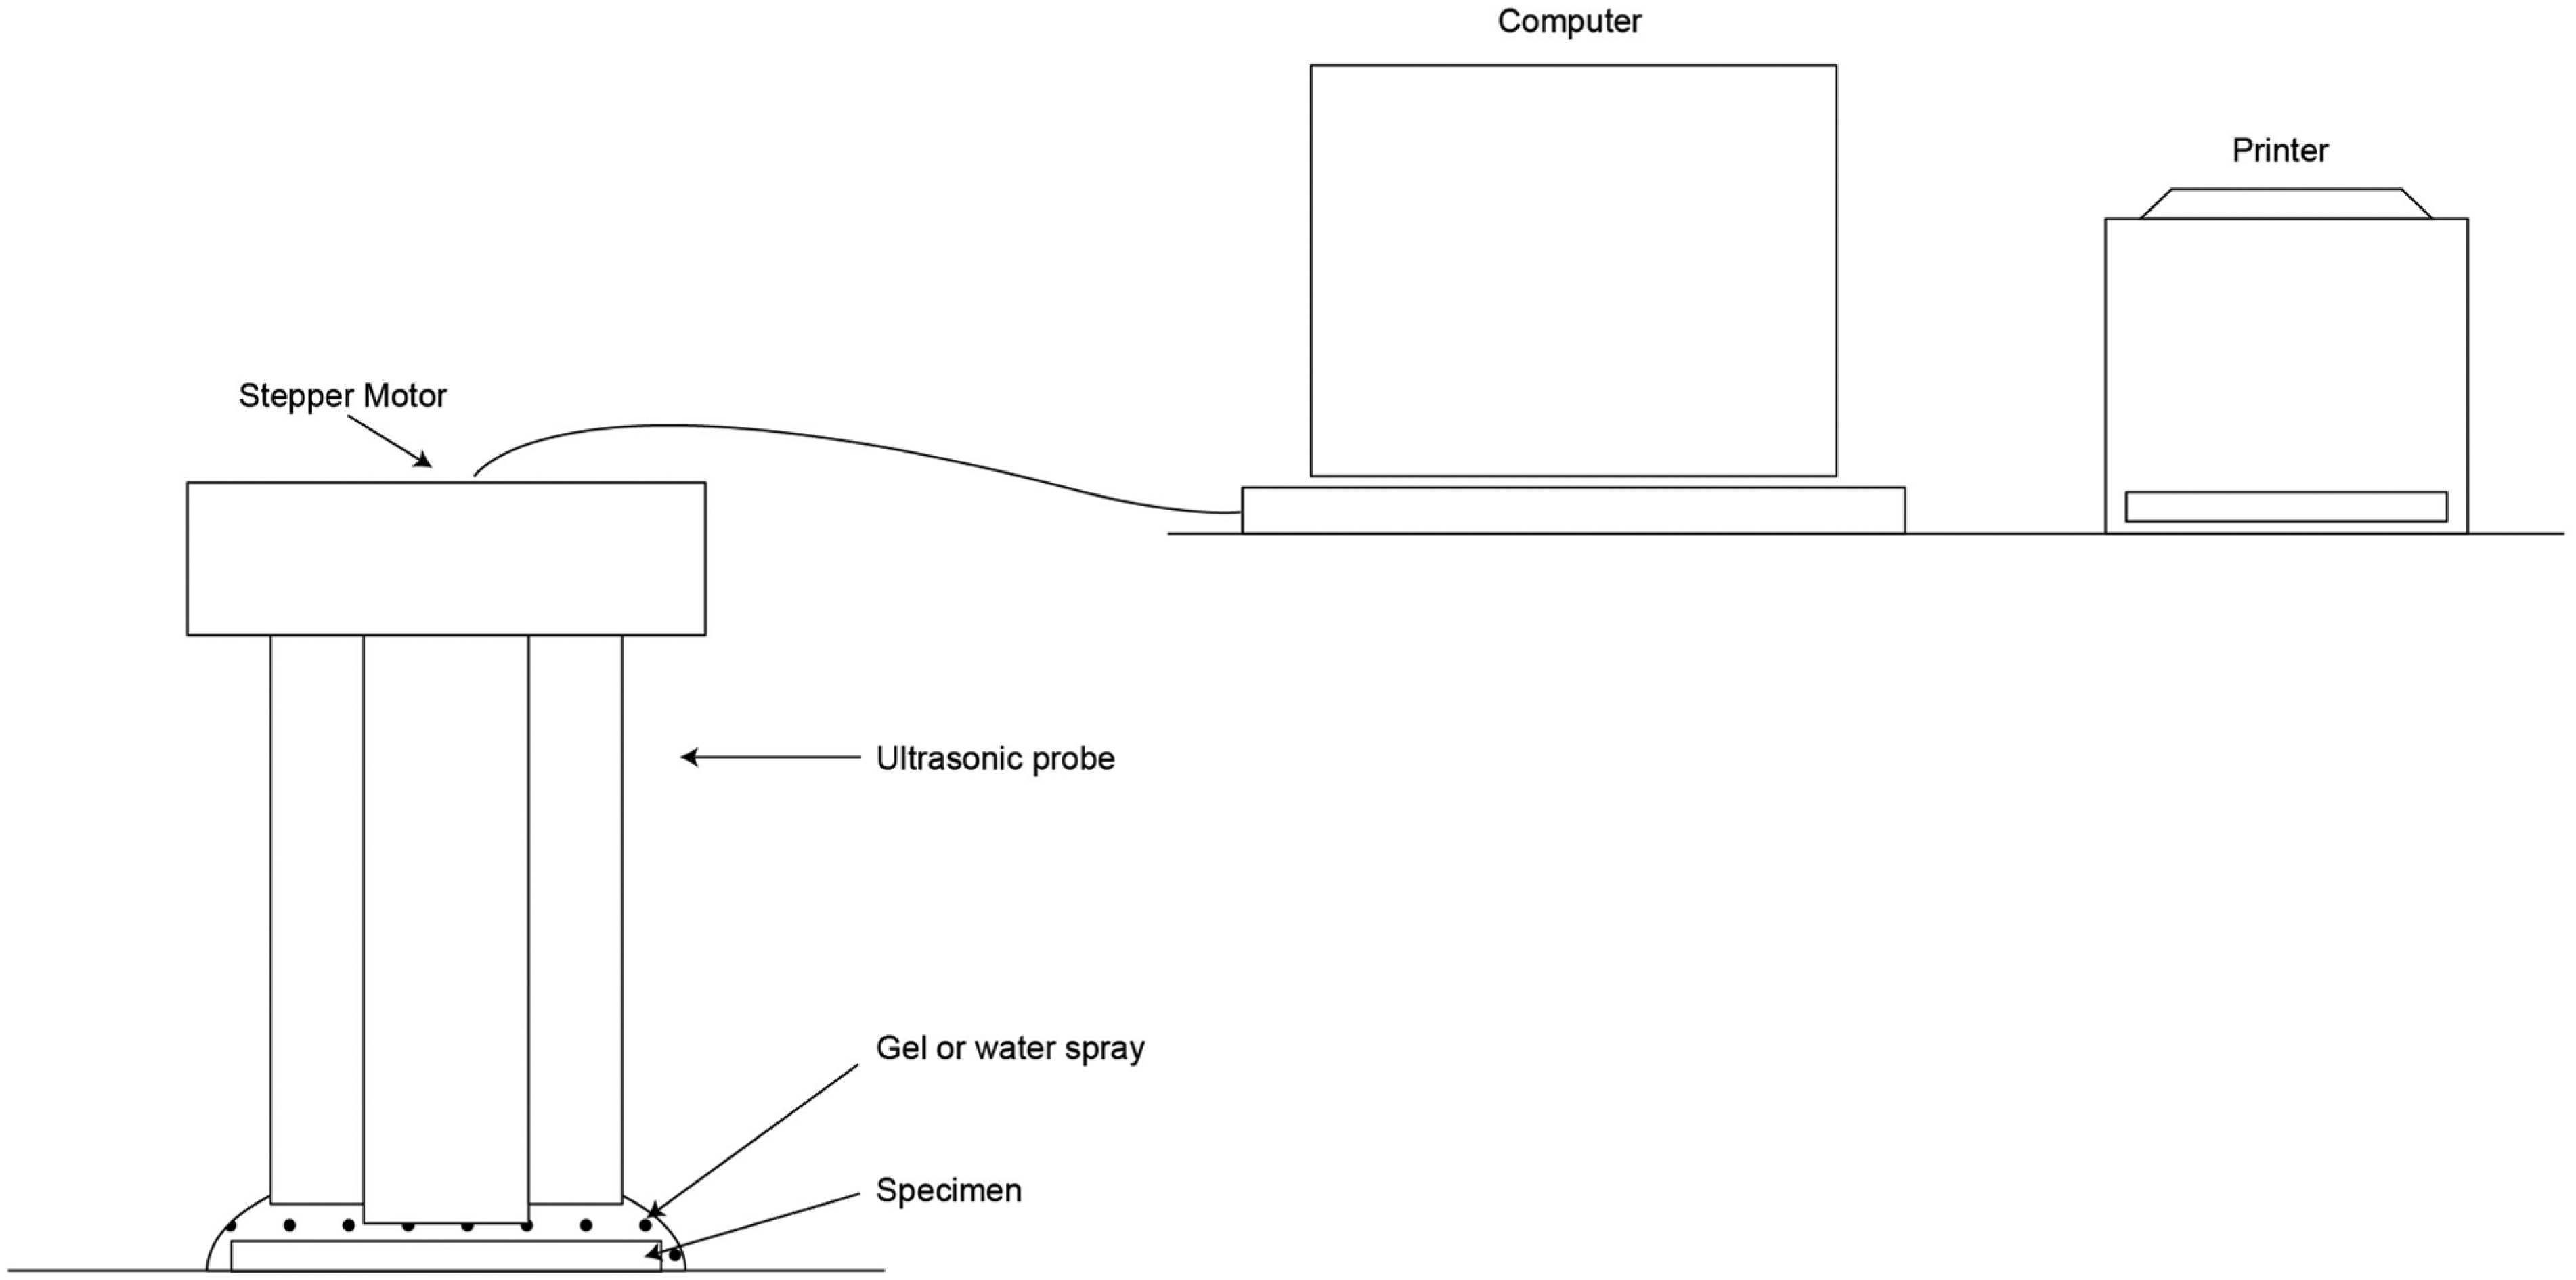
Schematic arrangement of pulse echo ultrasonic C-scan.
Ibarra-Castanedo et al. 49 in their investigations of defects in glass-reinforced (glass laminate aluminum reinforced epoxy (GLARE)) fiber metal laminates found that it was difficult to get accurate defect detection with the ultrasonic C-scan method, as the glass fibers reflect the ultrasound waves.
Shadow moiré interferometry
Seif et al. 43 proposed a method for measuring delamination of CFRP composites using the shadow moiré imaging principle. This principle was developed in the US Army Materials Technology Laboratory. 50 The method involves insertion of a master grating between the incident laser beam and the object of examination. Any level difference on the surface of the object which is the result of delamination causes a dark and light fringe pattern to develop depending on the distances of the out of plane displacements. A piezo-electric transducer device is introduced in the optical path to obtain phase shifting. The phase modulation interferometry allows 3D shape measurements. A CCD camera is used to photograph the fringe pattern. Using phase shift software, 3D contours of the object are created from the camera images for the before-drilling and after-drilling states of the object. The out-of-plane contours in the image reveal the delamination damage. The delaminated area is measured by counting the number of pixels within these contours. This technique is suggested to be suitable for carbon fiber composites where visual methods fail. It has the added advantage of being a non-destructive and non-contact testing procedure. A schematic diagram illustrating this method is given in Figure 16.
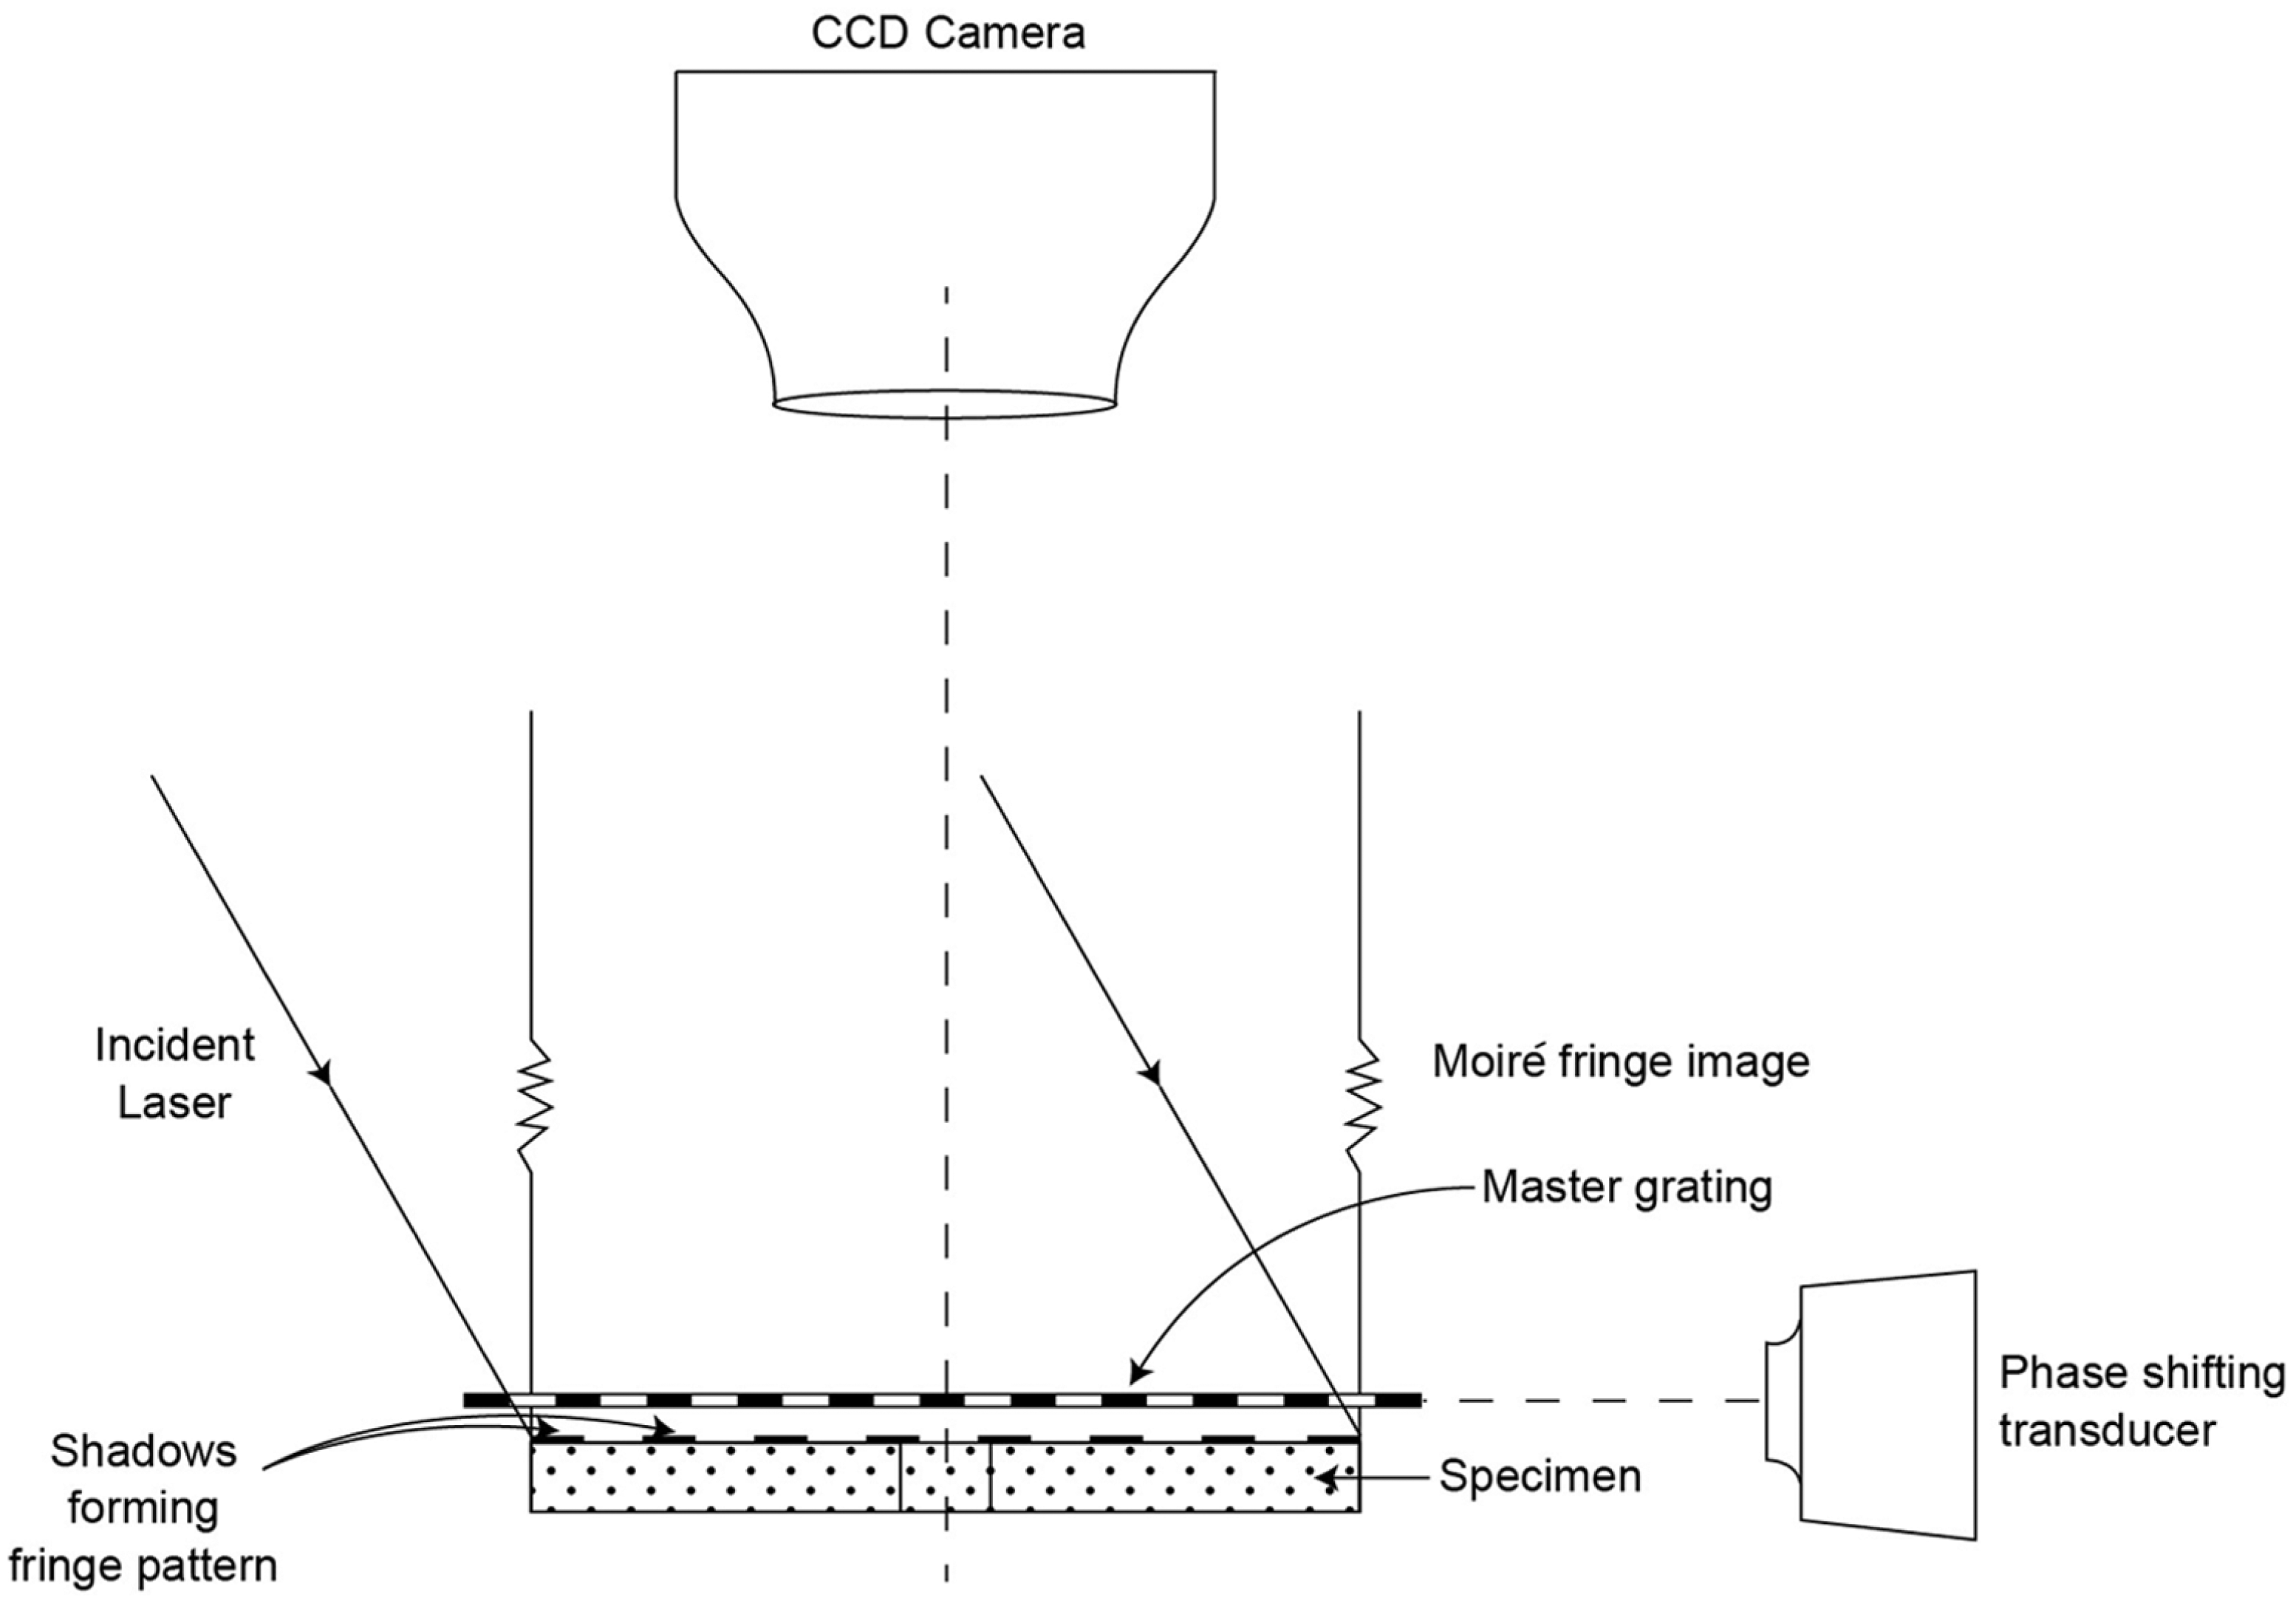
Schematic diagram illustrating shadow moiré interferometry.
Radiography
Da Silva et al. 19 used digital X-radiography with image processing to quantify drilling-induced delamination in composites. Chen 11 used the X-ray non-destructive testing method to assess delamination in CFRP materials. To improve the contrast between damaged and undamaged areas of the component, a radio-opaque chemical is coated on the part to be examined. Di-iodomethane was used by Da Silva et al. 19 for this purpose. Tetrabromoethane is another such chemical used for this purpose. 11 The specimen is kept in a lead container while being X-rayed, for radiation protection. A schematic illustration of the X-ray radiography is given in Figure 17.
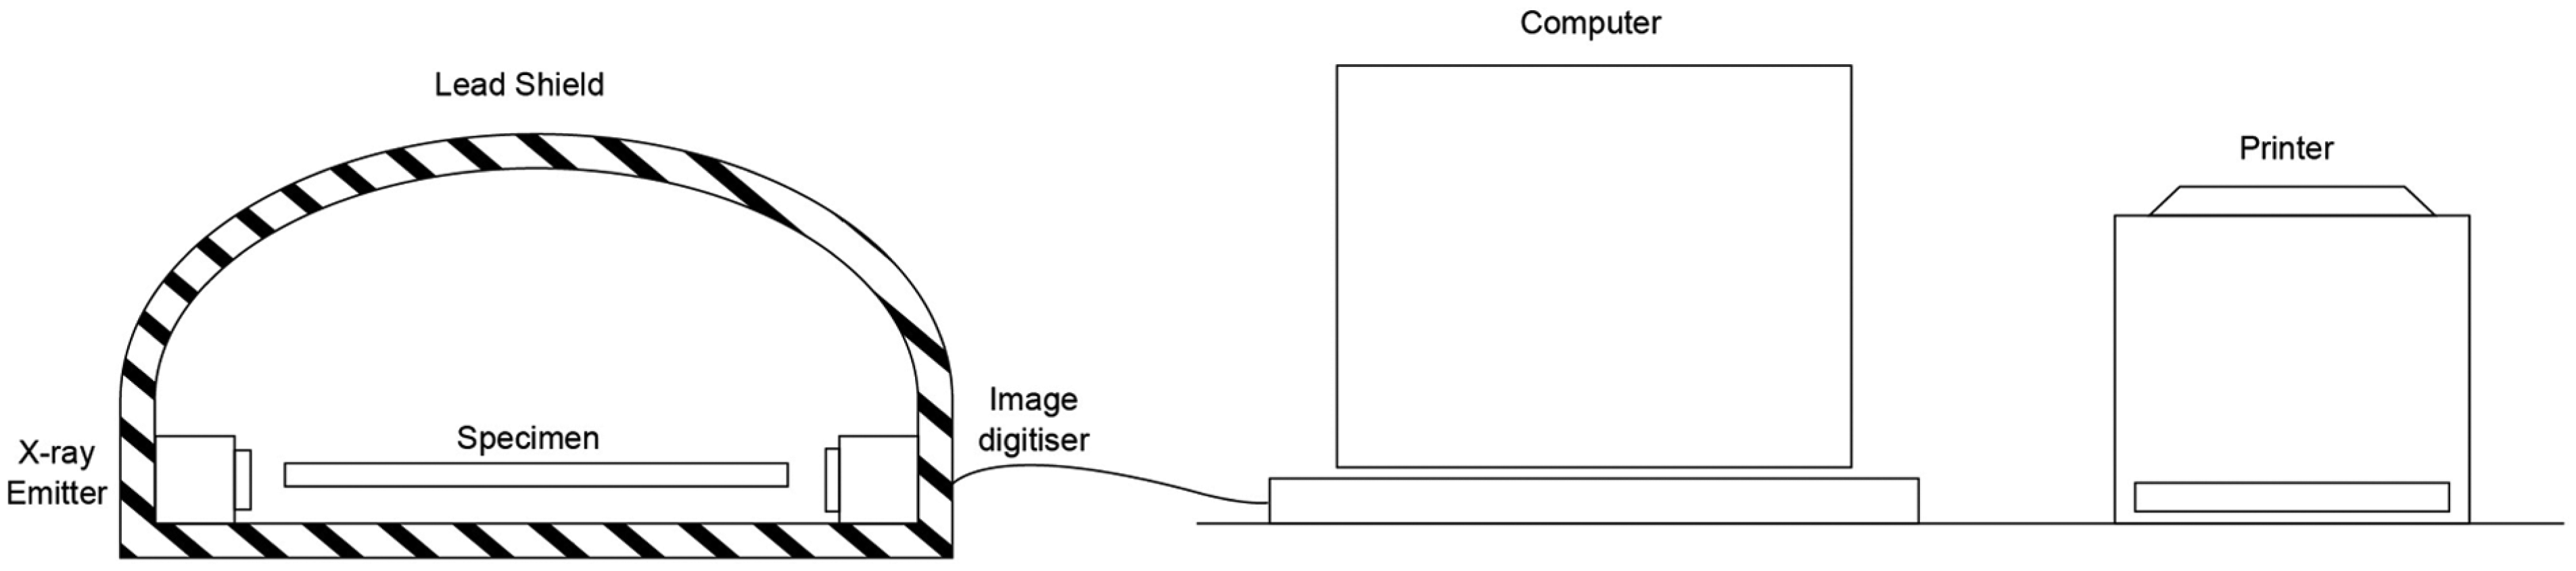
Schematic illustration of the X-ray radiography.
In this method, a collimated beam of X-ray is made to pass through the object onto a film, thereby obtaining a projection of the object with high resolution. This method thus gives a picture of the object. These pictures are used to correlate the X-ray absorption density with the material density of the sample thereby providing a measure of the delamination. Some of the other researchers who used X-ray and radiography for the evaluation of delamination factor are Chen 11 and de Albuquerque and colleagues. 18
Radiographic images of the specimen were obtained prior to as well as after the drilling operation. The comparison of the two images would help in eliminating pre-existing defects from the damage measurement. The Adobe Photoshop software is useful in overlapping the before-drilling and after-drilling radiographies for this purpose. Threshold values developed through algorithms by earlier researchers were applied using MATLAB software to segment the damaged area by Da Silva et al. 19 They carried out the radiographic analysis using a Kodak RX unit along with the Kodak digital radiography system. They found that the penetrability of the contrasting chemical is an influencing factor in radiography.
X-ray computerized tomography
X-ray computerized transverse axial scanning (tomography) was described by Hounsfield 51 in 1973. He explained how X-ray absorption values across the edges of a series of slices of the cranium can provide very accurate pictures of these slices by processing the values in a computer.
This method is adopted for 3D non-destructive testing of composite specimens for delamination damage and its measurement. Hocheng and Tsao 52 and Tsao and Hocheng 53 used the Siemens Somatom AR X-ray medical computerized tomography to investigate drilling-induced delamination in carbon fiber–reinforced composites. The X-ray beam passes through the specimen which is detected by the detectors at the opposite end. The detectors record the attenuated X-ray signals as a digital image which is stored in a computer. The frame on which the X-ray tube and the detectors are mounted is rotated through 180° in steps of 1° to get a series of images of the slice of the specimen. The frame is then moved vertically to get a similar series of images for the next slice. A FUJIX medical image processor MF-300S was used by them for image reconstruction, which was then displayed on the computer screen, or a print-out of the image could be taken using a printer. A schematic diagram of the CT scan frame arrangement is shown in Figure 18.
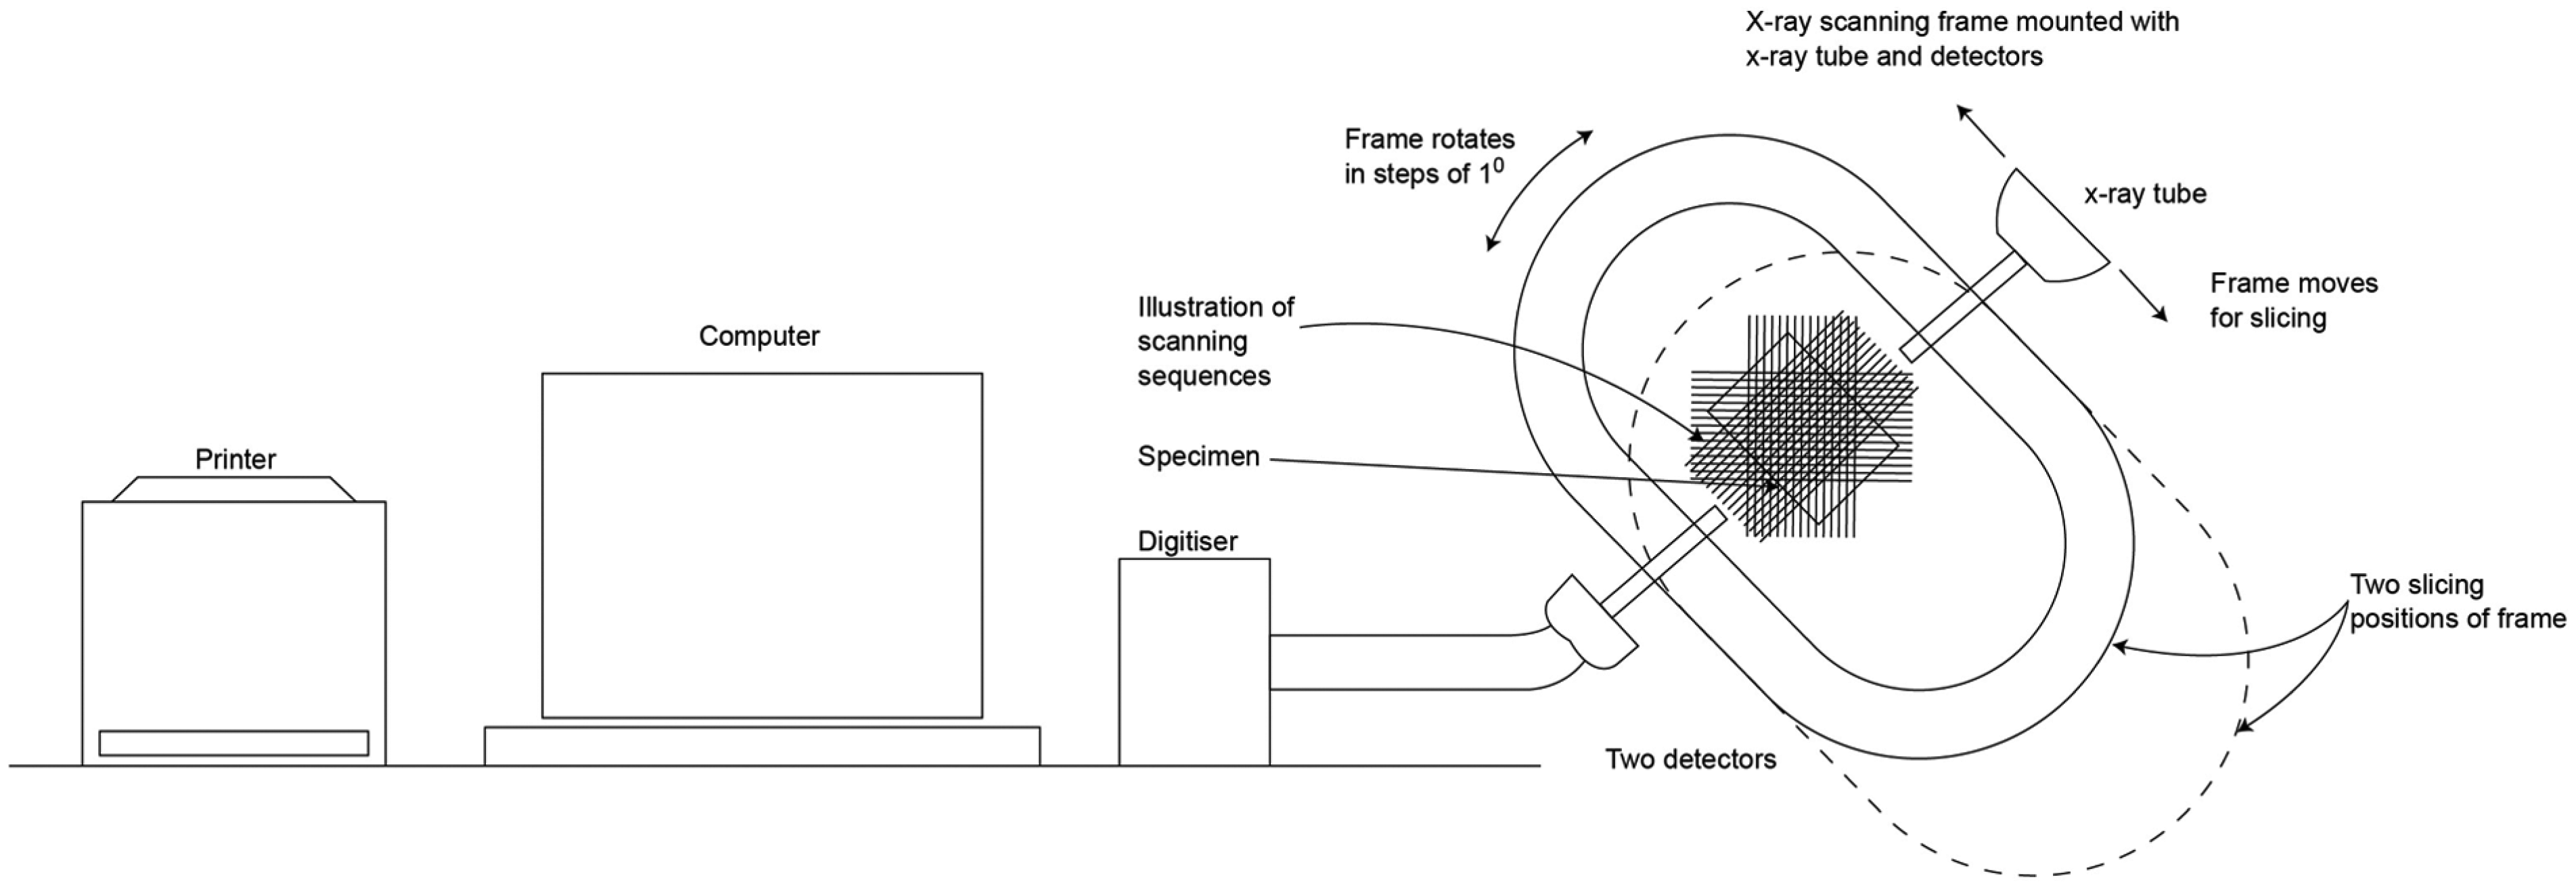
Schematic diagram of the CT scan frame arrangement.
Different methods used to measure delamination by various researchers are tabulated in Table 2.
Different methods used to determine delamination. a
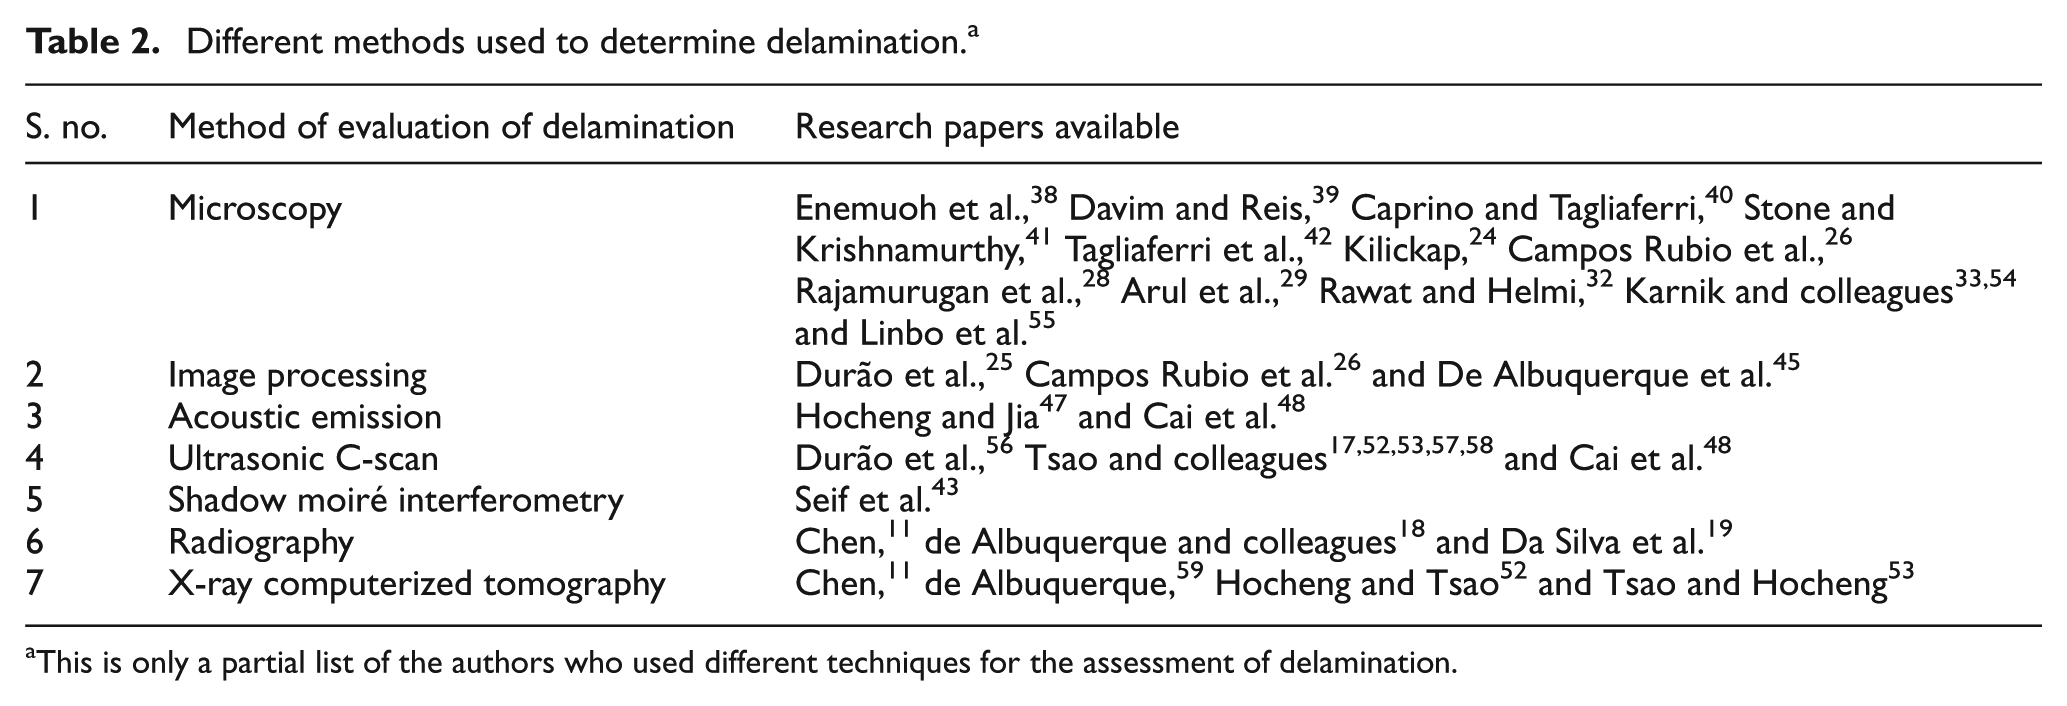
This is only a partial list of the authors who used different techniques for the assessment of delamination.
Concluding remarks
The field of application of composite materials is expanding fast due to their favorable strength- and stiffness-to-weight ratios. Compared to drilling of metals and metal alloys, drilling of composites demands very different considerations since composites are non-homogeneous with hard reinforcement fibers and abrasive matrix fillers. Delamination is the most common defect during drilling of composites, which results in irregular size and shape with long and fine cracks and breaks. The work presented here is an overview of the assessment of delamination, means and methods that have been proposed and are being used over a period of time. The conclusions drawn from this study are as follows:
Most of the authors used conventional delamination factor (Fd) to assess delamination; the drawback is that different delamination damages may have the same conventional delamination factor value.
Two-dimensional delamination factor and damage ratio and equivalent delamination factor do not consider the crack length contribution on delamination.
Adjusted delamination factor (Fda) takes care of both damaged area contribution and crack length contribution; the drawback is that it may give a higher value indication of the delamination factor.
Equivalent delamination factor shows less value than adjusted delamination factor, but this method does not consider the crack length contribution to delamination.
Refined delamination factor is considered to be the better method, as the authors of this method also conducted the failure load tests to support their method. But they limited their destructive tests to validate their method of assessment of delamination to the spindle speed of 1400 r/min only. It may need more number of destructive tests with the samples drilled with other spindle speeds. Furthermore, it is very difficult to differentiate and classify the delaminated area into the three proposed levels of damage. The assessment of delamination severity may vary from one researcher to another, as the authors did not clearly specify how to differentiate these regions.
There is no correlation between the circularity of delaminated zone and its area as well as its strength.
Till now there is no common agreement in assessing the delamination factor.
There are several techniques or methods developed to measure the delamination, and the delamination factor obtained by different techniques may differ from one another. This further complicates the process of assessing the delamination factor. So many permutations and combinations are possible to assess the delamination factor by changing the means and methods.
Among all the measures the refined delamination factor seems to be a more accurate one, but authors should clearly define how to differentiate and classify the delaminated area into the three levels of damage. The main task in the assessment of delamination is to capture a sharp image of the delamination zone and to further process it so as to determine the parameters required to assess the delamination. Advancements in digital image processing make processing and analysis of these captured images more convenient and accurate. Image acquisition plays a major role in the accuracy of its further processing.
Future research
Till now there is no common agreement in the method of acquisition of images for the assessment of delamination. It will be better to set a standard for both means and methods of assessing the delamination factor, like there are standard methods to determine the tensile strength of materials and surface roughness of machined parts.
Footnotes
Appendix 1
Declaration of Conflicting Interests
The author(s) declared no potential conflicts of interest with respect to the research, authorship and/or publication of this article.
Funding
The author(s) received no financial support for the research, authorship and/or publication of this article.