
Abstract
In order to provide an accurate estimation of energy consumption, this work proposes a novel energy consumption modeling and prediction approach for a milling process from a multistage perspective. Based on its work stages, each stage’s energy consumption model is established by sliding filter, multiple linear regression, and improved gene expression programming (variable neighborhood search–based gene expression programming) methods and then the total energy consumption is predicted through their combination. A case study is given to illustrate the proposed model and its effectiveness. Compared with the full quadratic model, which can fully consider the interaction between cutting factors, the proposed method can achieve the higher accuracy to predict the energy consumption of the milling process.
Introduction
Manufacturing consumes significant amounts of energy, which leads to substantial stress on the environment. 1 Recently, with the increasingly serious resource and environment problems in manufacturing industry, sustainable manufacture attracts more and more attention. It is reported that the energy consumption in manufacturing industry contributes to 33% of the world’s total energy consumption. 2 Therefore, a reliable evaluation model of energy consumption would be of great significance for the environment and resource.
The metal machining, for example, milling and turning, plays an important role in the manufacturing field. In fact, machining process is a material removal process, which consumes a large amount of resource. The use of energy consumption model of machine tool can effectively analyze the resource consumption and environmental impact of mechanical processing system. But the complexity of parts and the particularity of materials have brought unprecedented challenges for machining technology. Performing the prediction of energy consumption can provide better judgment and support for the practice of the machining process. However, the energy consumption evaluation model of the machine tool is hard to obtain due to the complexity of the machine tool structure and the nonlinear relationship between the energy consumption and machining parameters. Therefore, establishing an appropriate and accurate energy consumption evaluation model of the machining process could help users to choose reasonable and optimal processing parameters. Moreover, the machining process is similar among numerical control (NC) machine tools. At present, for the parts with complex structure, thin-walled, variable thickness, many surface and curve structures, or high reconciliation precision, NC milling has been used to product them. As a typical machining way, NC milling process has been applied to many practical productions, such as auto parts, mobile shell molds, and so on. If its energy consumption is decreased, there will be much energy saved for other imperative need.
In view of the above, it is necessary to exploit an evaluation model of machining energy consumption. Since machining energy consumption problem was initialized by Gutowski et al. 3 in 2006, there have been many advances in their modeling.4,5 The early work is a simple model on cutting process, and it is expressed as follows

where E is the total energy demand, P0 is the idle energy, k is a coefficient, MRR is the material removal rate, and t is the total cutting time.
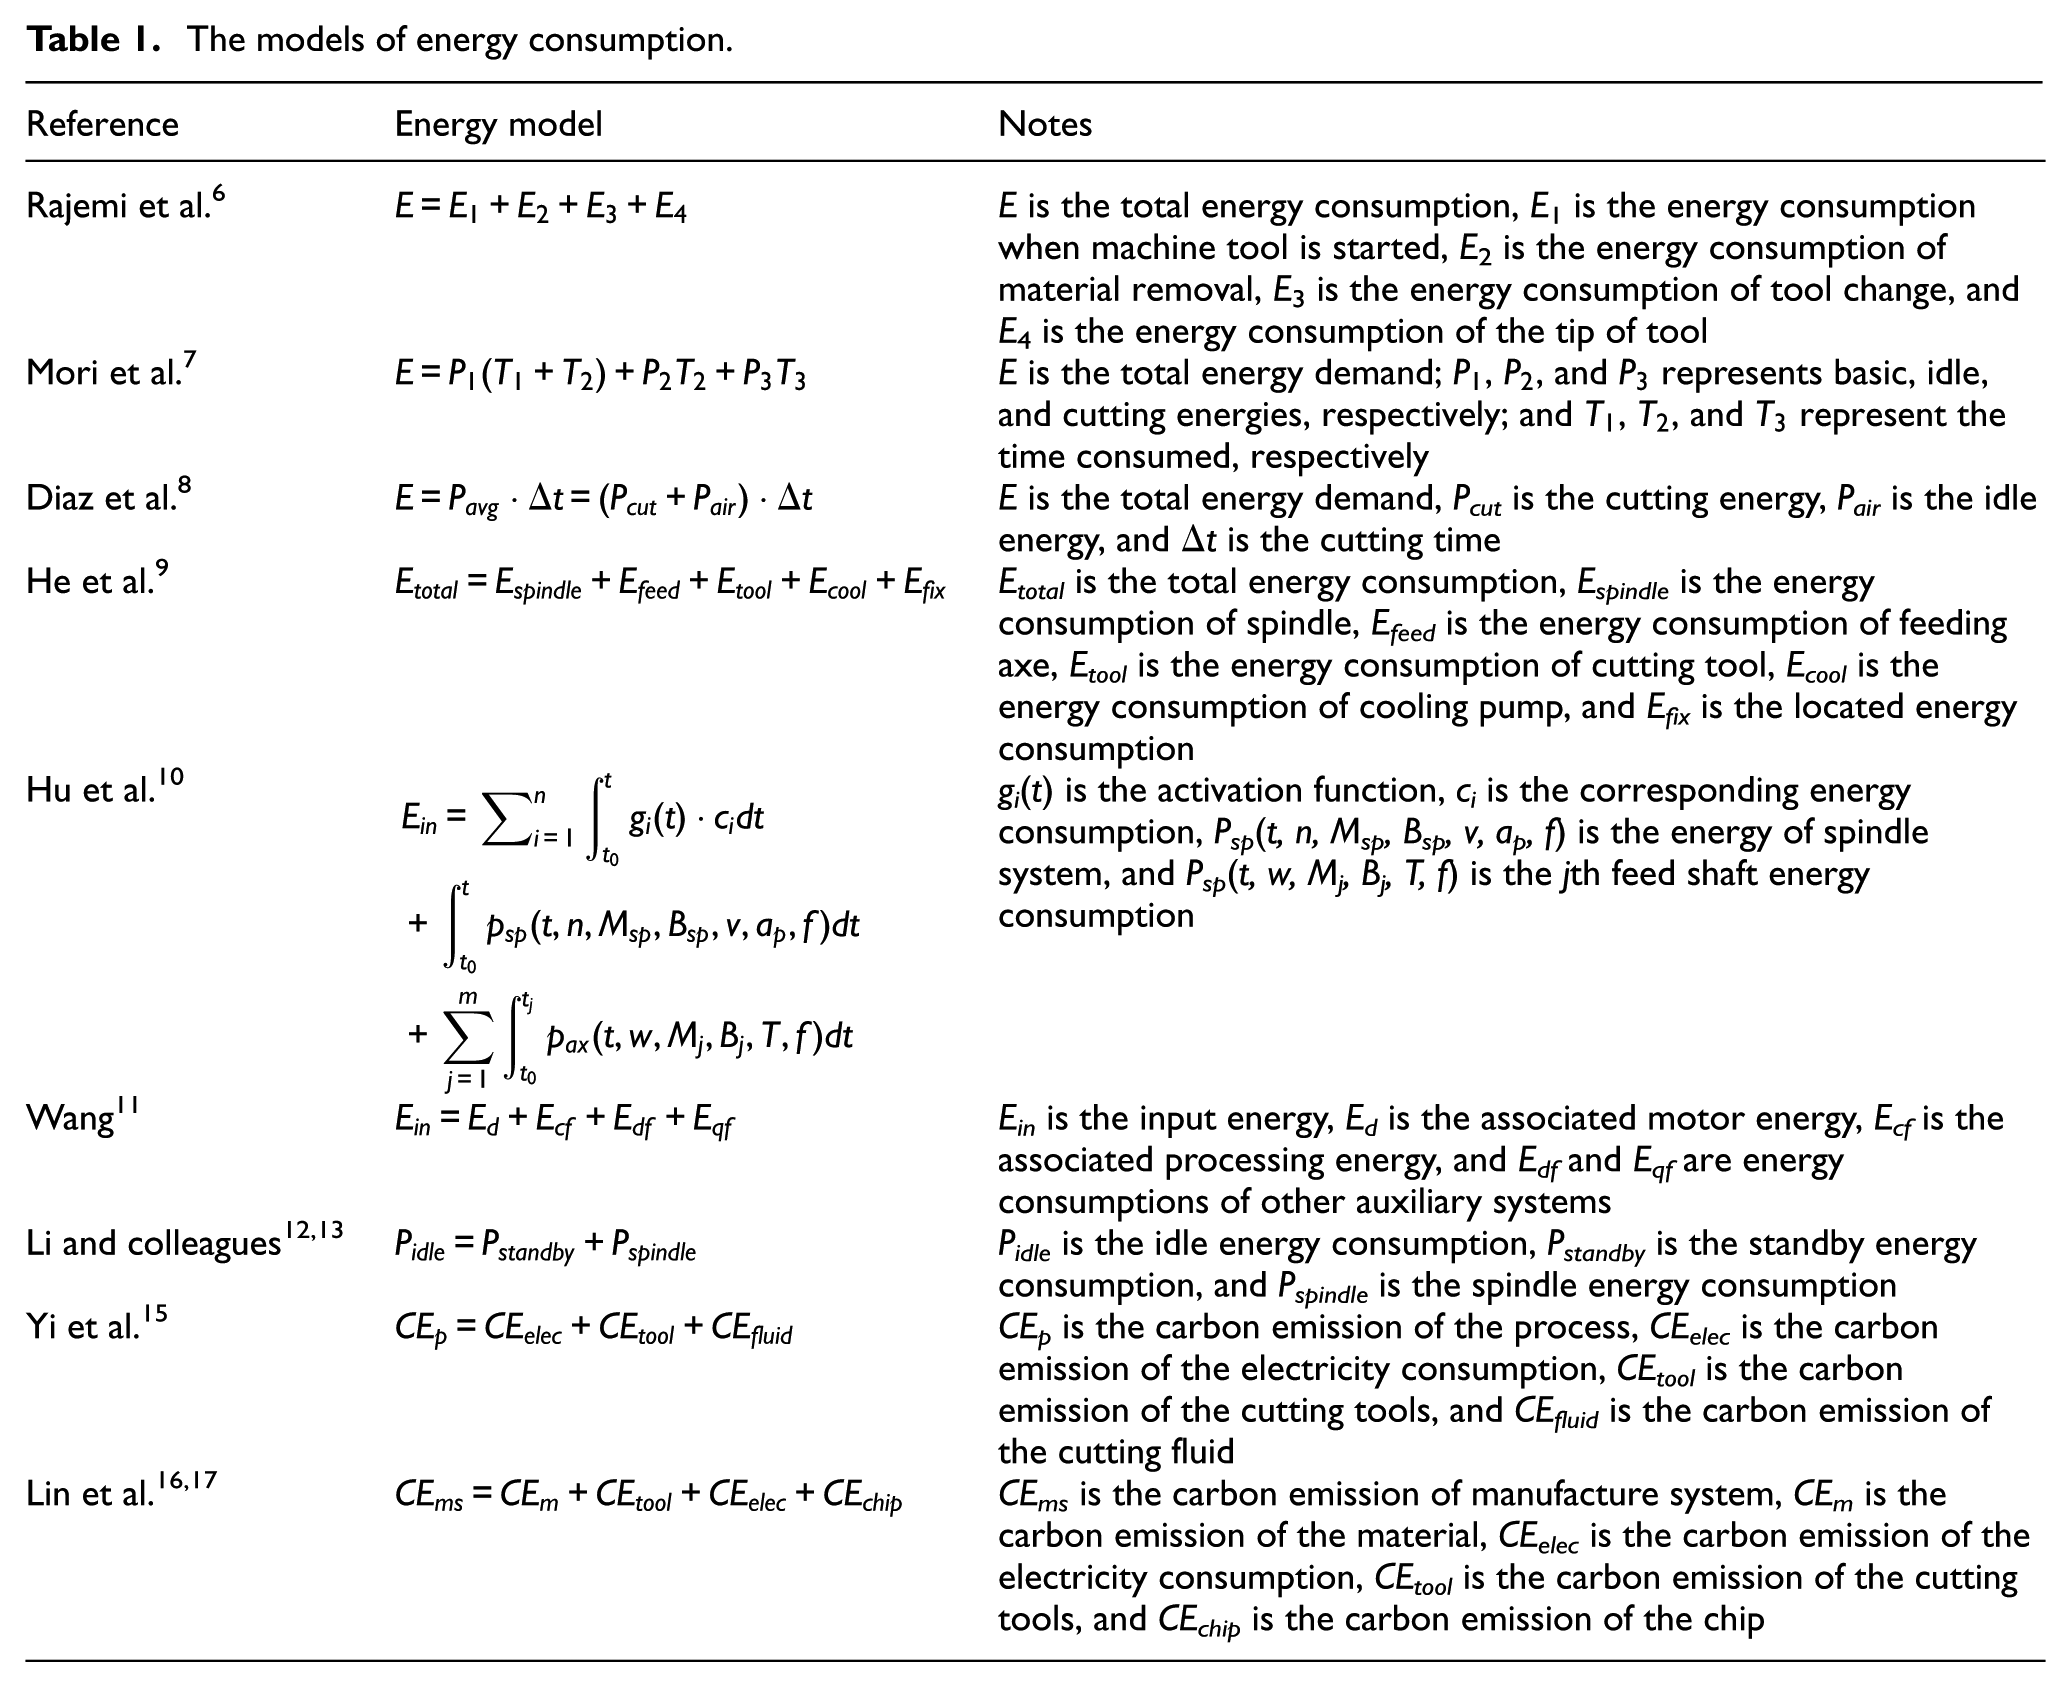
From equation (1), it shows that the no-load energy is a dominant part of the direct energy demand in machining. It reflects that the choice of machine tools has a large impact on the direct energy demand. After equation (1) is put forward, many researchers have presented comparatively deep exploration to establish energy models of the machining process. For example, Rajemi et al. 6 consider that start-up energy consumption is independent of the load. Mori et al. 7 decompose the whole machining process into three states, that is, basic, free, and cutting conditions, and propose their measure methods of energy loss. Diaz et al. 8 propose that the machining process could be divided into cutting and un-cutting states, but it faces inevitable energy acquisition problem. He et al. 9 divide the total energy consumption into five parts, for example, energy consumption of spindle, feeding, cutting, cooling pump, and fixing. Hu et al. 10 introduce an activation function describing the energy consumption for auxiliary and feed systems of the machine tool. Wang 11 divide auxiliary system into the processing energy loss and motor energy loss. Li and colleagues12,13 propose that the no-load energy consumption could be divided into standby energy consumption and spindle energy consumption. Zhang et al. 14 establish energy consumption optimization models for industrial processes and provide the guideline for the machining process programming. Yi et al. 15 establish a carbon emission model of wet cutting process associated with energy consumption. Lin et al.16,17 propose a carbon emission model of dry cutting process and propose three carbon-footprint reduction strategies, which are important to saving energy. The typical energy models in the above literatures are listed in Table 1.
The models of energy consumption.
Obviously, many researchers applied the above models to study other problems, for example, Dureja et al. 18 take the cutting energy into the cutting parameter optimization in turning process. Balogun et al. 19 analyzed specific cutting energy coefficient and integrated the energy demand. Based on the above, current researchers mainly analyze energy consumption modeling and evaluation problems from perspectives of processing state and machine tool construction. However, machining processing factors, for example, cutting velocity and cutting depth, have a large impact on the energy consumption; thus, these factor characteristics should be considered when energy consumption model of machining is established. In addition, researchers concentrate on energy consumption modeling and evaluation issues, but they pay little attention to its prediction problem. Although some researchers have proposed to use fuzzy logical20,21 and statistical analysis 22 to address the energy consumption prediction problem, these methods still heavily depend on subjective experience of experts. Moreover, the experience deviation of expert can lead to the reduction of prediction precision. Thus, it is essential to introduce an accurate prediction method based on the actual experimental data by identifying the main factors of the machining process to avoid the insufficiency of subjective experience of experts and improve the prediction performance. Also, each factor influencing the machining process has a strong nonlinear and complex relationship with the energy consumption. In this case, the accurate assessment between cutting parameters and energy consumption cannot be determined by the traditional linear regression method. While gene expression programming (GEP) and multiple linear regressions (MLRs) are two most widely used artificial intelligence tools in some fields due to its strong nonlinear fitting ability, for example, disassembly and efficiency of chemical inhibitors.23,24 Also, sliding filter has the good evaluation ability in facing uncertainty data. 25 To do so, using TC500R drilling center as a typical machine tool and taking milling process as an example, this work proposes to establish its energy consumption prediction model using multistage modeling ideology with the combination of sliding filter, MLR, and the improved GEP for the first time. Namely, the aim of this work is to find a new way to determine the relationship between the energy consumption of milling process and machining parameters in view of energy efficiency and multistage. Compared with the existing work, there are two unique contributions: (1) Based on the work stages of the milling process, this work proposes a novel multistage approach to accurately predict the energy consumption for a milling process, that is, its each stage’s energy consumption model is established by sliding filter, MLR, and improved GEP (variable neighborhood search–based gene expression programming (VNS-based GEP)) methods, respectively, and then the total energy consumption is predicted through their combination. (2) By comparing with the full quadratic model, this work validates the effectiveness and feasibility of the proposed method in predicting energy consumption of milling process.
The rest of this article is organized as follows: section “Prediction methods and algorithms of energy consumption” presents the energy consumption model for milling process and lists the methods and algorithms used to predict it. Section “Case study” displays a case study for the presented model. Section “Analysis and verification of the proposed model” shows its comparative analysis and verification. Finally, section “Conclusion” concludes this article and describes future research issues.
Prediction methods and algorithms of energy consumption
Based on the energy consumption model proposed in prior work, 12 combining with work stage of the milling process, in this work, the energy consumption model of the milling process under dry cutting conditions is presented as follows
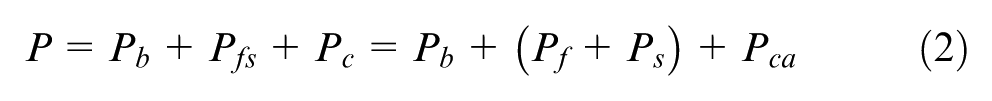
where Pb is the basic energy consumption without any operation on the machine tool, Pfs is invalid operating energy consumption, and it is the sum of energy consumption Pf of feeding process and energy consumption Ps of the spindle rotating process, and Pca is the sum of energy consumption of material removal process and additional load loss. The characteristic curve of the total energy consumption about time for a milling process is shown in Figure 1, which is the real-time power measured during processing state on the TC500R.
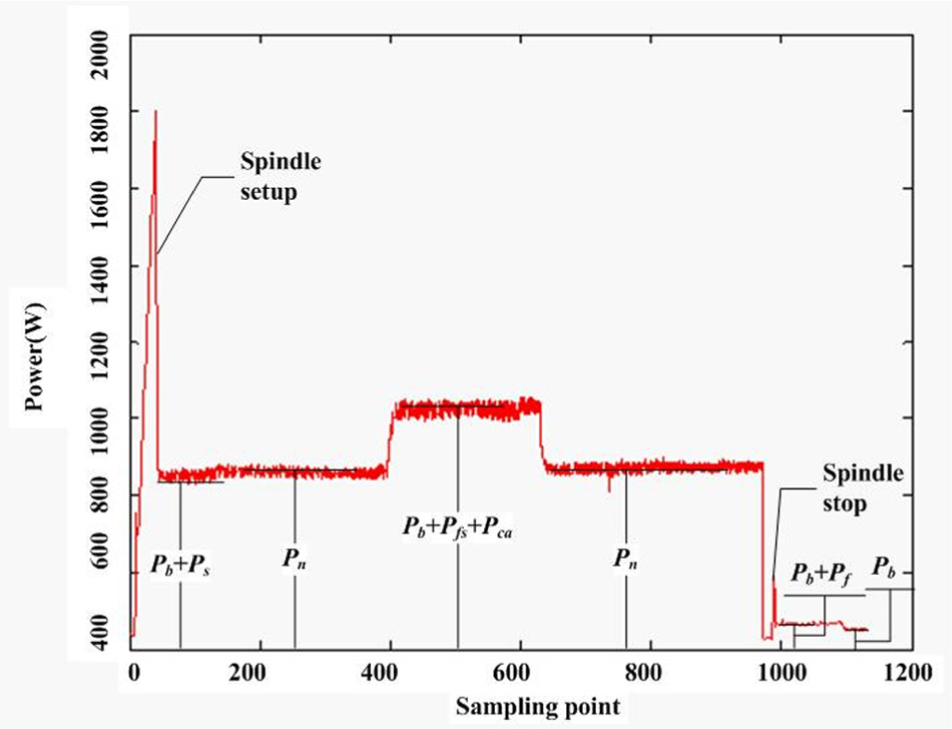
Energy consumption characteristic.
In view of Figure 1, the total energy of the milling process includes three-stage parts, that is, basic energy consumption Pb, invalid operating energy consumption Pfs, and the sum of energy consumption of material removal process and additional load loss Pca. In addition, Pn represents the energy consumption when the machine tool is in no-cutting state.
In this work, based on each stage’s characteristic, the following three methods are adopted and proposed to predict the total energy consumption of the milling process. They are presented in the following.
Sliding filter method to evaluate Pb
For Pb, it is obtained by energy sensor before the start-up of spindle and feeding axe. Since the current and voltage are instable, the experimental value fluctuates within a certain range and is irrelative with the milling parameters. The sliding filter method can filter the experimental data with relatively large deviation. Then, the effective data can be obtained to estimate the average level. 26 Thus, the sliding filter is adopted to process the Pb data, and it is expressed as follows
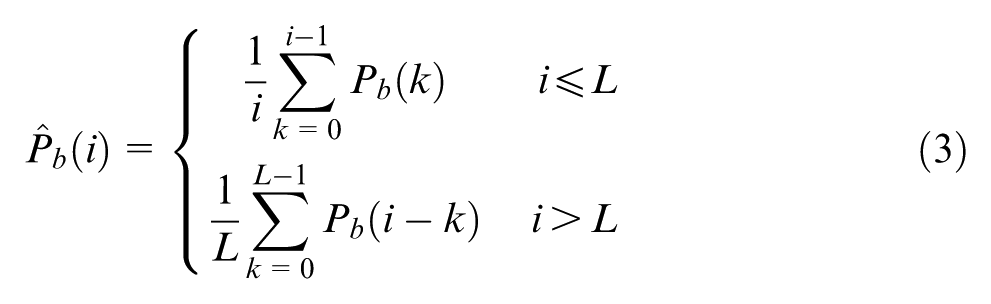
where
MLR method to predict Pfs
The sum Pfs of feeding process energy Pf and the spindle rotating process energy Ps shows a linear trend with cutting parameters, 27 that is, v and f. To accurately achieve its prediction, an MLR is applied to predict it.
Due to the good regression and prediction ability, MLR method can be widely used to deal with a variety of issues such as biological, economic, chemical, and engineering problems.28,29 In this work, it is used to predict the energy consumption for a part of milling process.
An MLR model is generalized as follows

where t0 represents the prediction target variable or dependent variable, and y1, y2,…, yn are independent variables with the coefficients
Since only the rotating speed of spindle and the feed rate are relative with the no-load energy consumption and the basic energy consumption is almost a fixed value, the prediction model of Pfs is expressed as follows

where the dependent variable t0 represents Pfs and y1 and y2 represent cutting speed and feed rate, respectively.
Based on the above discussions, it can be seen that a dependent variable is considered as the combination of independent variables subject to their coefficients. Thus, the prediction of Pfs could be effectively conducted after their coefficients are determined. In this work, these coefficients can be obtained by Origin 8.0.
Improved GEP algorithm to predict Pca
Since the sum of energy consumption of material removal process and additional load loss Pca has the strong nonlinear relationship with cutting parameters, that is, v, f, and ap, traditional methods, for example, MLR, cannot achieve the precise prediction, while GEP has good mapping capability for the nonlinear problems which are of great complexity, multi-input, and uncertain. 30 To do so, this work adopts an improved GEP algorithm, which combines variable neighborhood search (VNS) with GEP algorithm, to predict it.
In the GEP algorithm, the chromosome contains one gene or multiple genes connected by functions. Moreover, the gene of chromosome is expressed by a string, which is composed of linear symbols and concludes head and tail parts. The head part contains function symbols and terminators, while the tail part only contains terminators. 28 The length of the head h can be set according to a specific problem, while the length of the tail t is a function about h and n, and it is expressed as follows

where n is the maximum operation number of function symbols.
The genotype of gene (K-expression, K) is a string, which can be used to construct its phenotype (T), which is an expression tree. The expression tree can be translated into a mathematical expression. For example, there is a K-expression, that is, Q+×/abcda. The function set and the terminator set are considered as equations (7) and (8), respectively


where F is the function character set, Q is the square root, and T is the terminators set. The K-expression is translated into the expression tree by decoding, which is shown in Figure 2. In view of K, obviously n is 2, while the length of head h is set as 4, and then the length of tail t is 5. In addition, black part is called as noncoding region, also known as neutral genes.
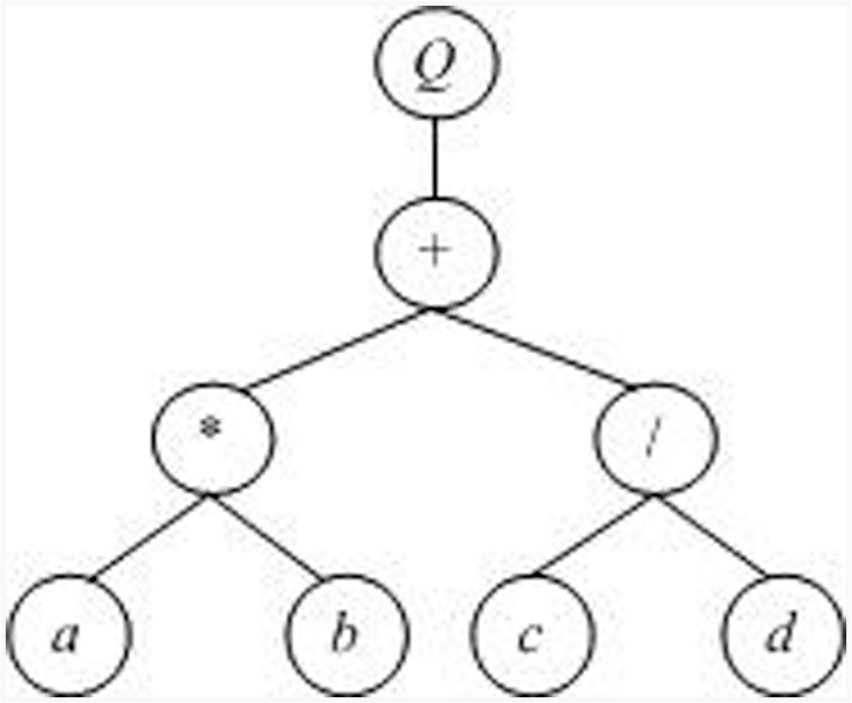
Expression tree.
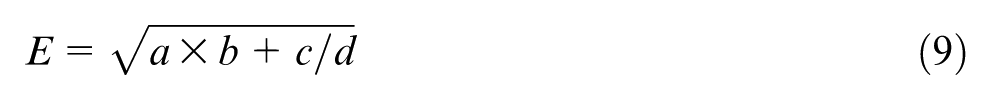
The expression tree above can be translated into a mathematical expression as equation (9)
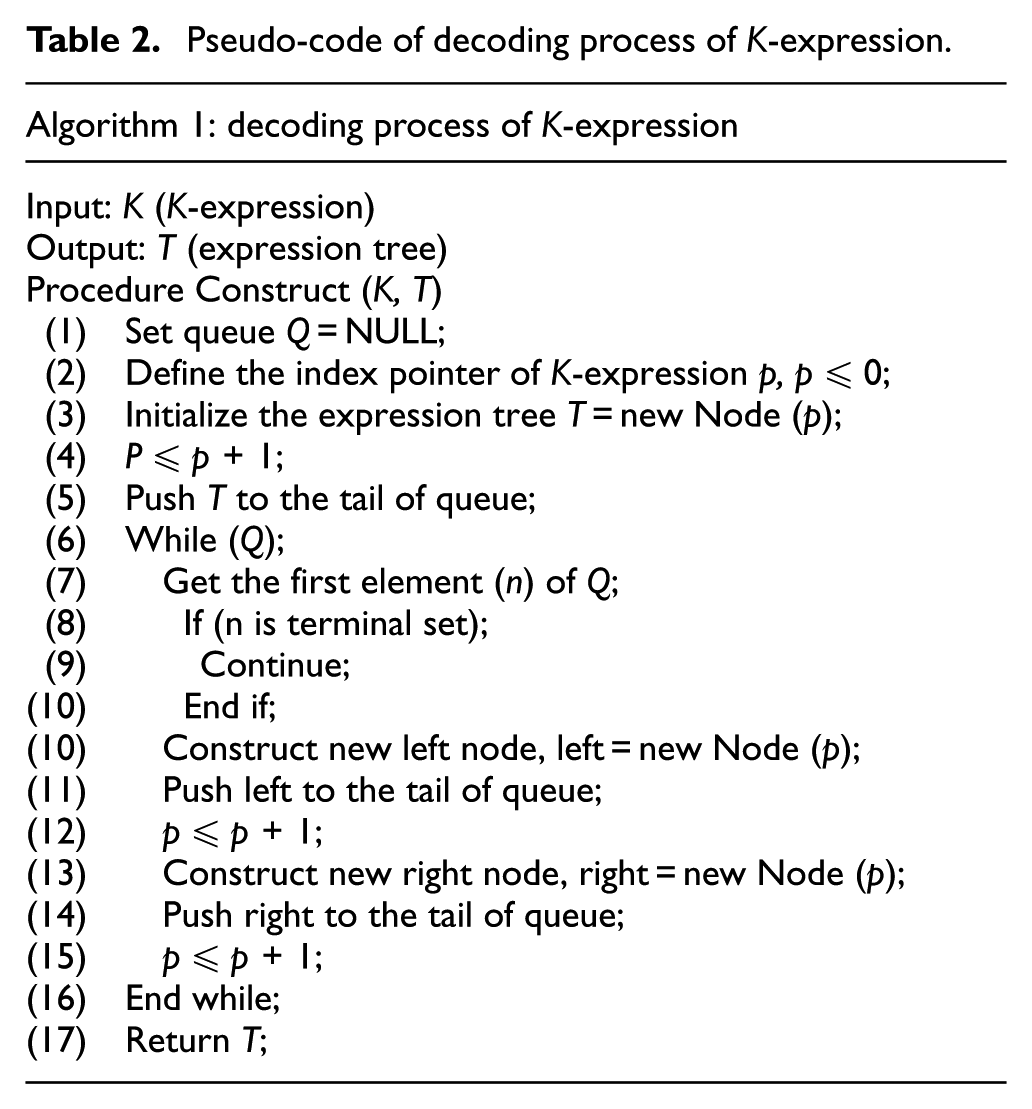
In the decoding process described above, the queue as a data structure is applied to temporarily store the binary trees. Through the en-queue and de-queue operations, characters in the K-expression are inserted in the nodes of binary tree from left to right, which is achieved as listed in Table 2.
Pseudo-code of decoding process of K-expression.
In addition, the GEP algorithm inherits the features of genetic algorithm, which has selection, mutation, and recombination operators. In addition, it has its particular operator, called as inserted string (IS) operator. The four operators of GEP algorithm are listed as follows.
Selection operator. According to the value of fitness function, select individuals with high fitness in the population within a threshold range.
Mutation operator. It plays a major role in maintaining the diversity of the population. Mutation occurs at any position in the chromosome, but in order to maintain the integrity of the chromosome structure, strings in head part can mutate into a function symbol, while the terminator and elements of the tail part can only mutate terminator.
IS operator. It is the particular operator of GEP and includes three kinds of operations, that is, IS, root inserted string (RIS), and gene IS.
Recombination operator. Two homologous chromosomes are mated and recombined to form new chromosomes, which also has three kinds of operations, that is, one-point recombination, two-point recombination, and gene recombination.
GEP is very effective at performing global search but often suffers from premature convergence, while local search is good at fine-turning but often falls into local optima. However, the basic idea of VNS is that changing the neighborhood structure set is to expand the scope of the search and then obtain a local optimal solution. 31 If it is applied in a global search algorithm, the degree of premature convergence could be reduced. Hence, in this work, an improved GEP based on VNS is presented, and the role of VNS in the context of GEP has been taken into serious consideration. In the proposed algorithm, GEP is used to perform global search to escape from local optima, while VNS is used to perform fine-turning.
For the construction of neighborhood structure set of VNS, it could be considered from the string structure, that is, the head part and the tail part. Moreover, the search operation in neighborhood structure set contains mutations and exchanges. The steps of VNS are given in Table 3.
Pseudo-code of VNS.
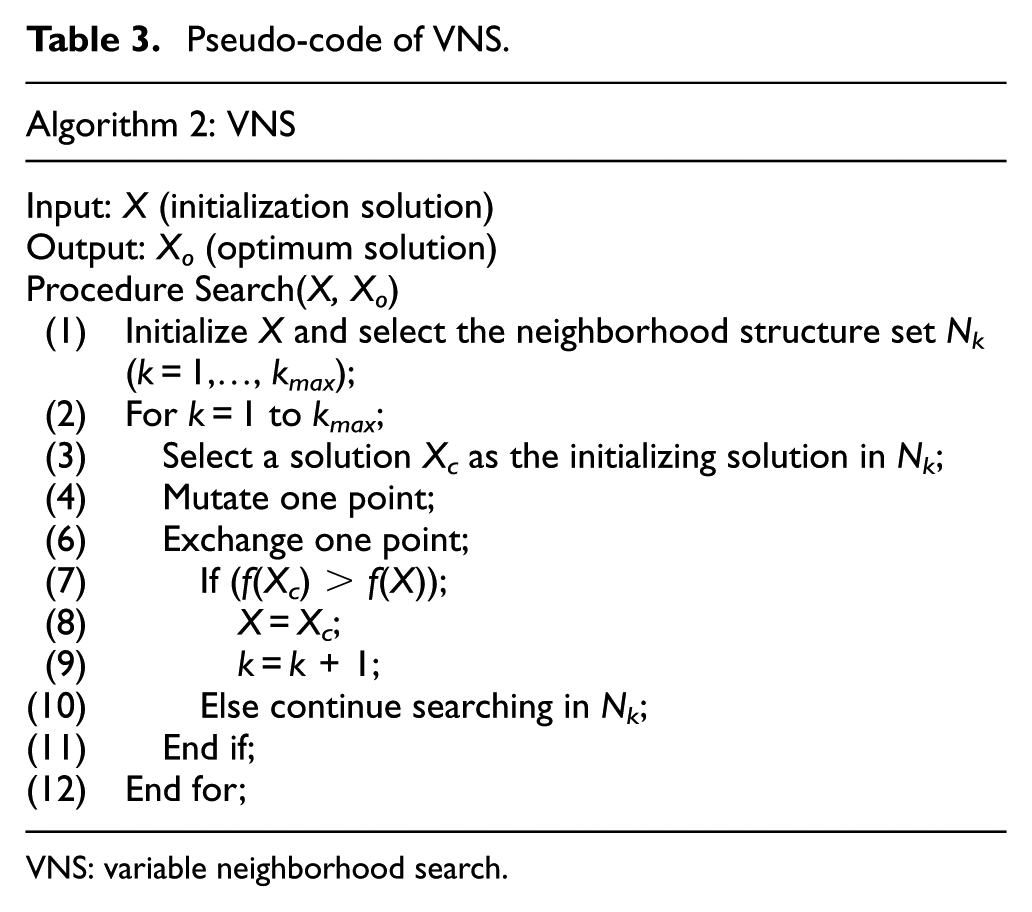
VNS: variable neighborhood search.
For the problem presented in this work, the genes in the improved GEP are expressed by a string, which contains operations, factors, and neutral genes. Similarly, the terminal set concludes three independent variables and three numerical constants in this work, which are expressed in the genes with a lowercase letter. In addition, the numerical constants are changed with generations and genes. They are changed randomly in the range of −1 to 1. For example, a chromosome with three genes has nine different numerical constants, which ensures the diversity of genes. The improved GEP mainly contains three parts, that is, initialization, genetic operation, and selection phase, whose flow is listed in Figure 3.
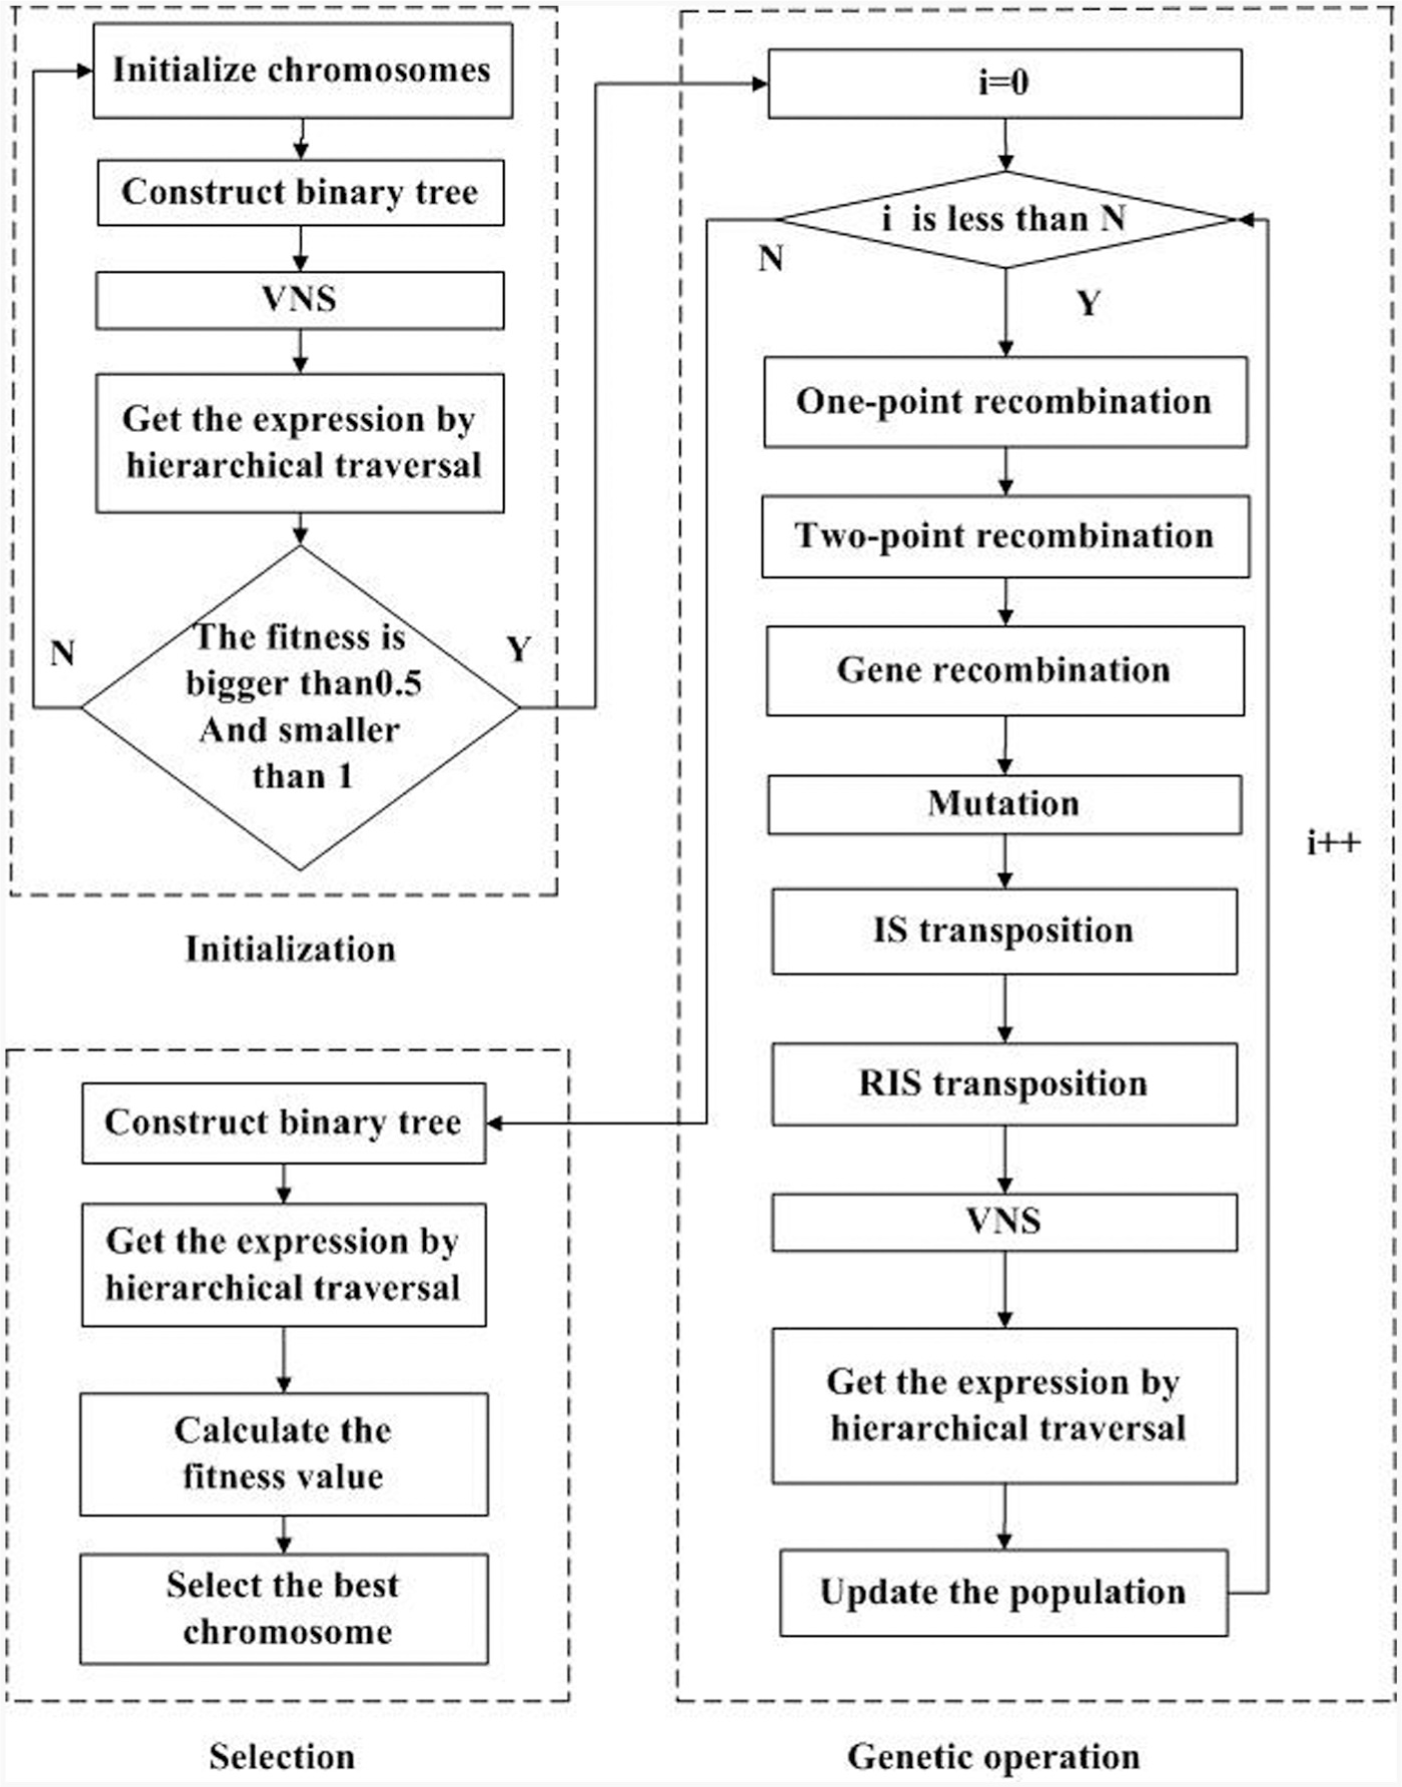
The flowchart of the improved GEP.
Case study
Experimental design and data acquisition
To verify the proposed model, by taking the TC500R drilling center which is widely used in enterprises as an objective, this work obtains its energy consumption data as presented in the following.
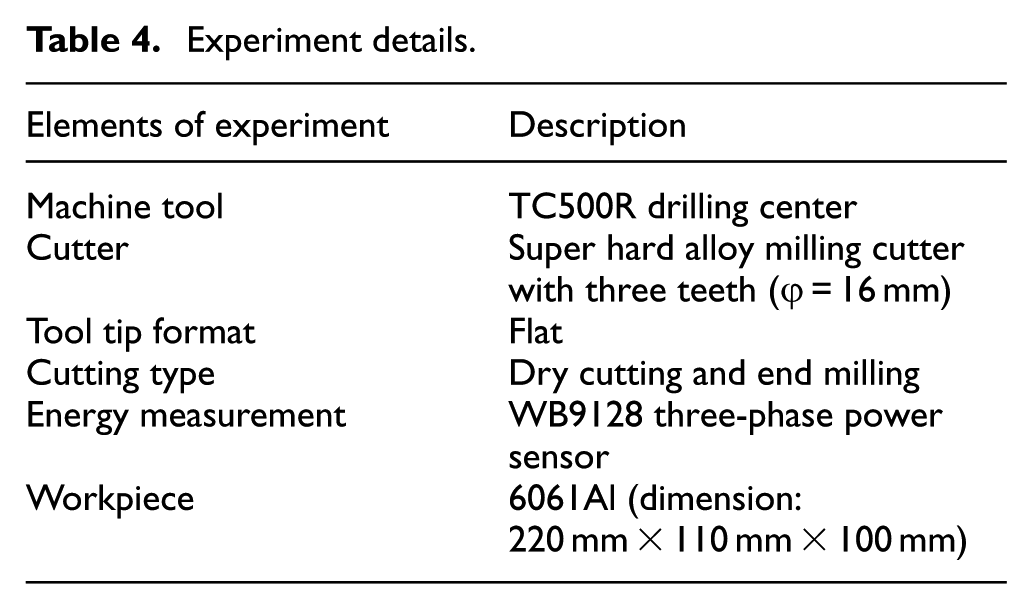
For end milling side, because of the smaller chip, the size of the chip is not considered, and the rigidity of the tool is more than that of the tool. Moreover, even though milling the aluminum workpiece, the super hard alloy milling cutter is applied to ensure the stability of processing and the reliability of experimental data, which can also be consistent with the tool used by the firm researched on. The experiment details are listed in Table 4. The experimental platform and processing site are shown in Figure 4(a) and (b), respectively.
Experiment details.
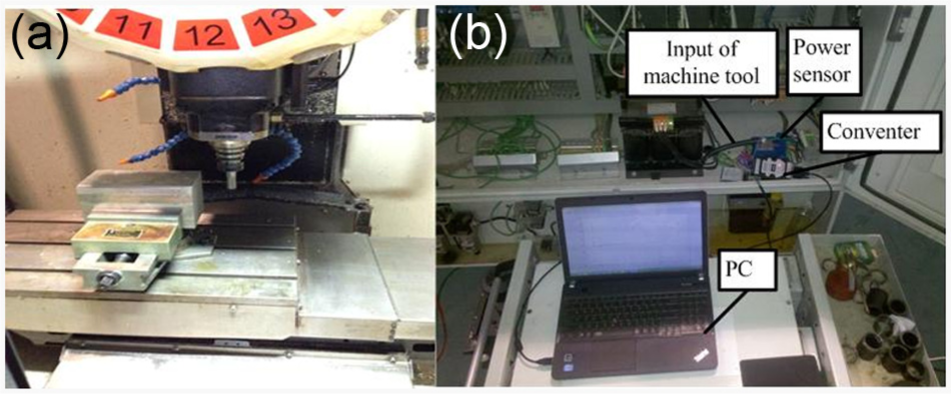
(a) Experimental platform and (b) processing site.
In the experiment, three factors, namely, cutting velocity v, feed rate f, and milling depth ap, are considered. After different milling process parameter levels are given, the corresponding energy consumption data, that is, Pb, Pfs, Pca, and P, are measured and obtained by power sensors, as shown in Table 5.
Experimental data.
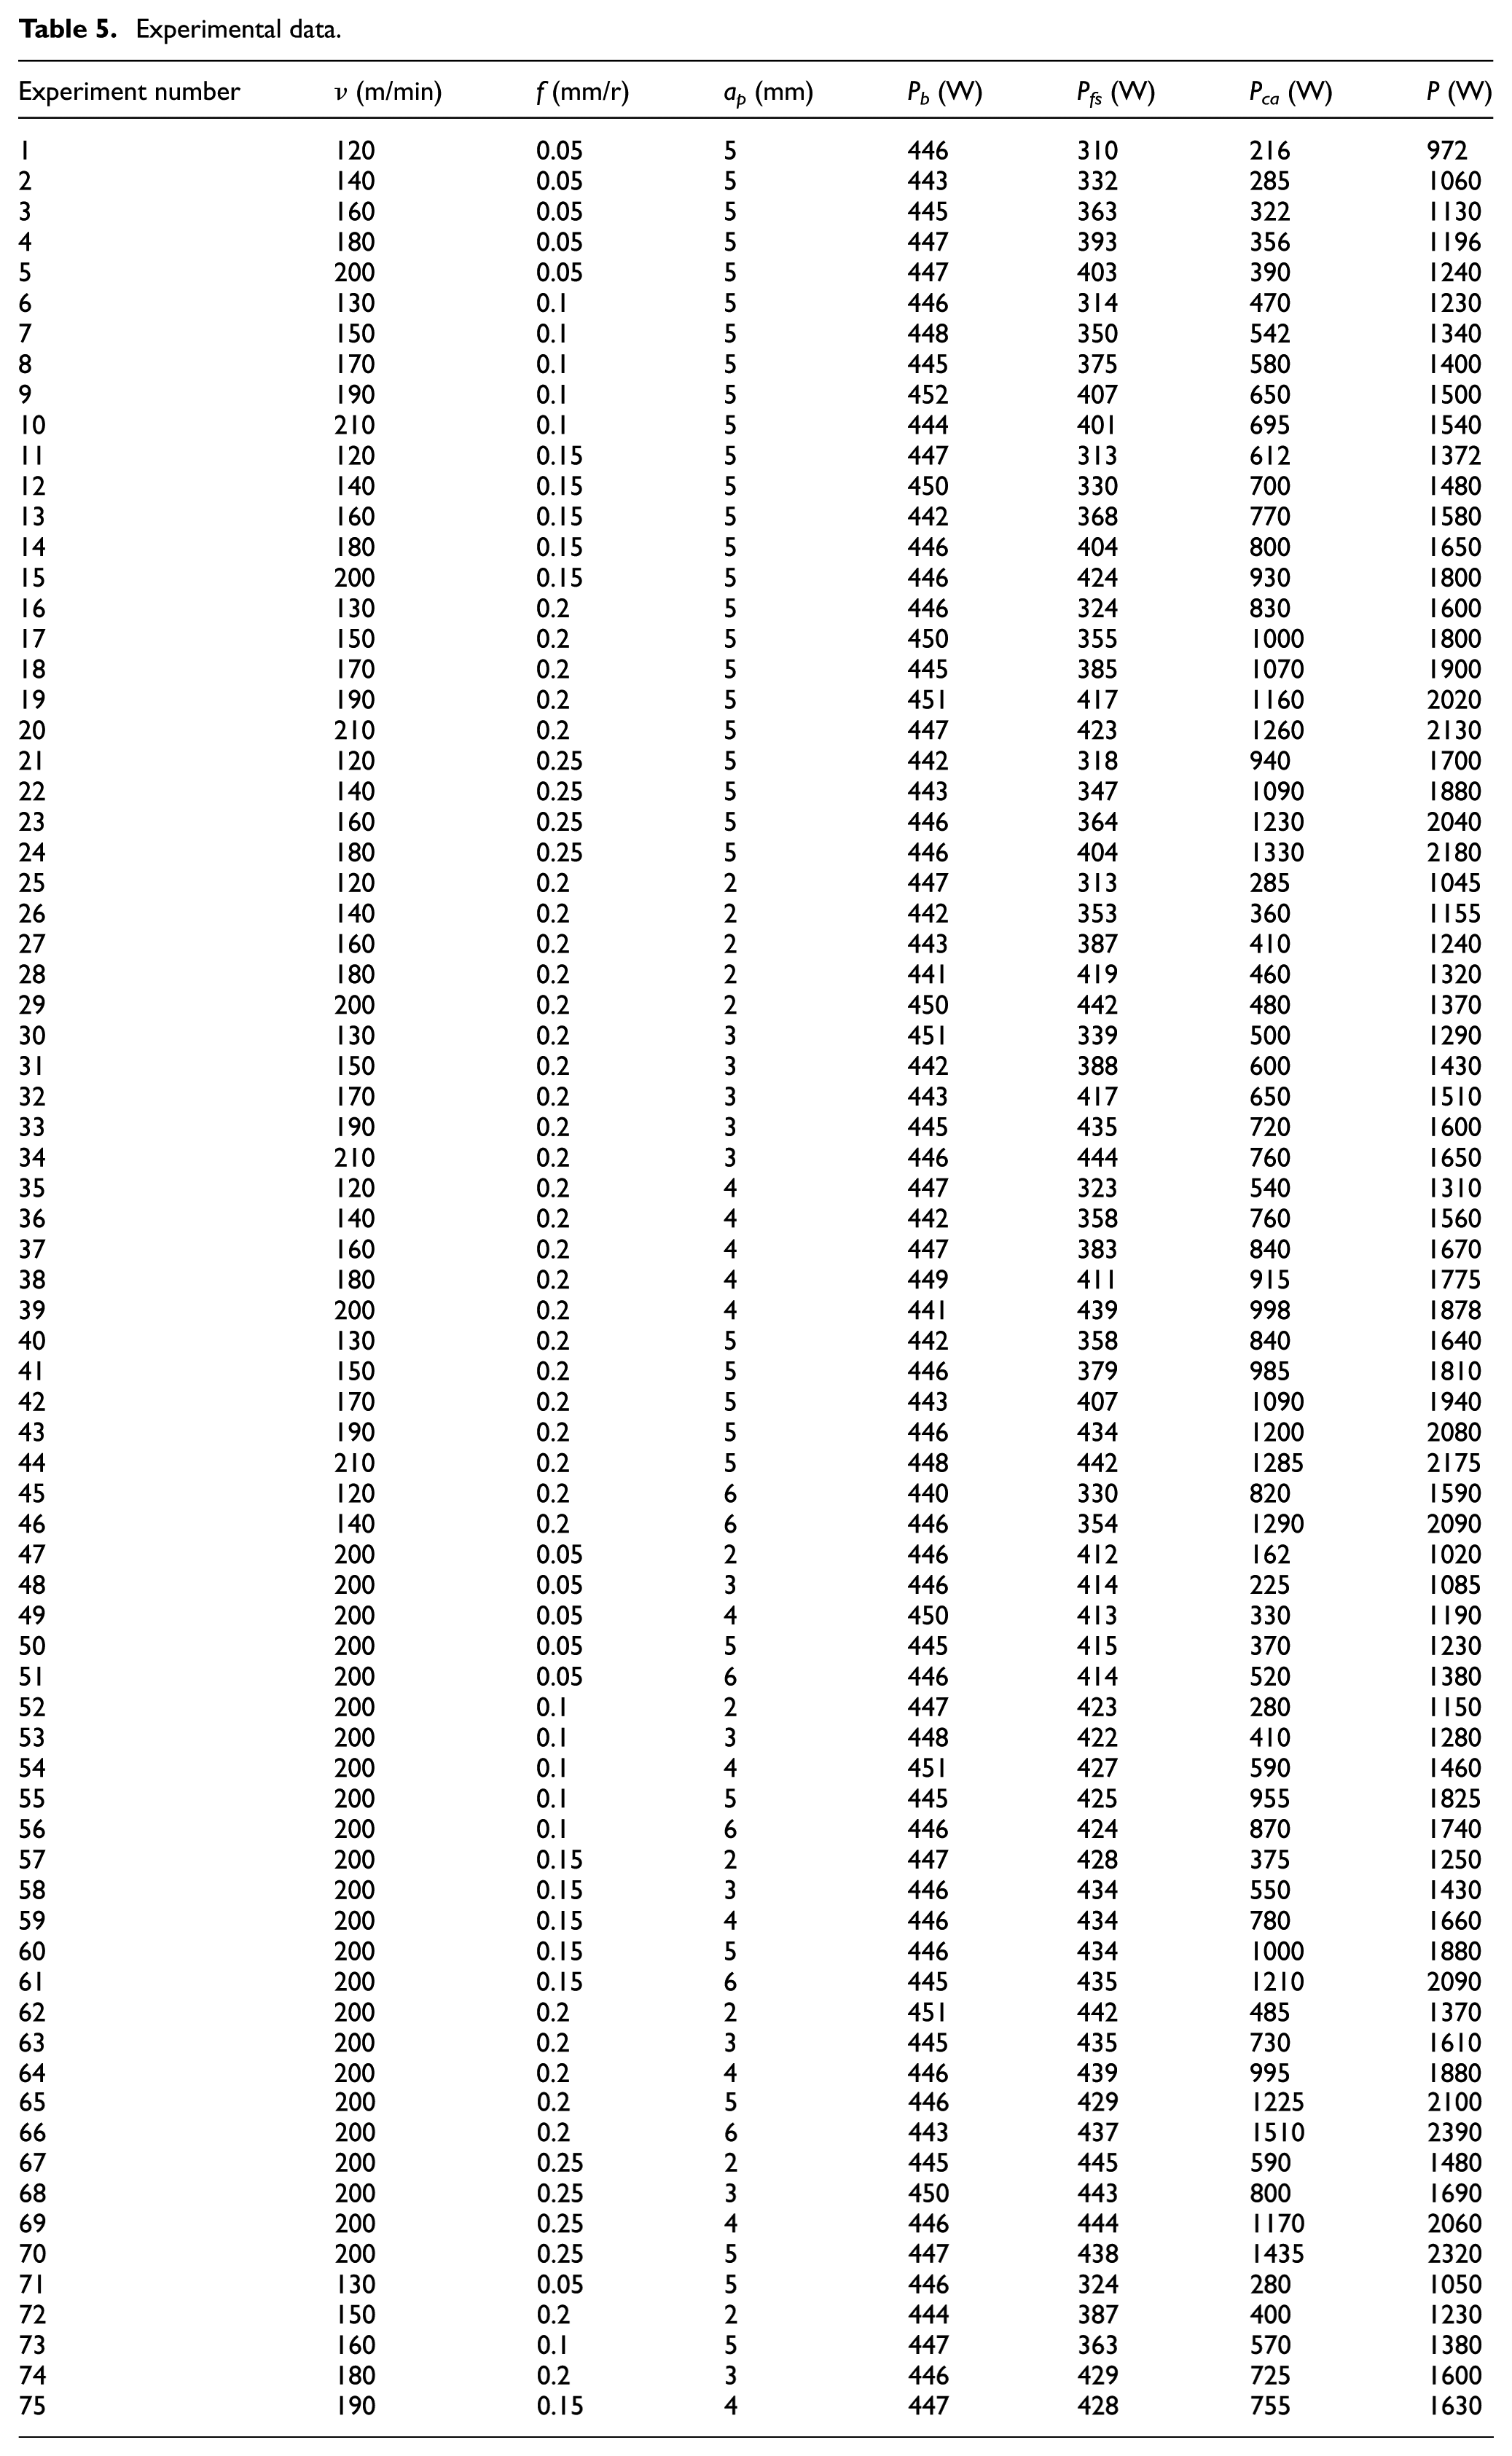
The selection of cutting speed mainly depends on the material of the workpiece, while the choice of the feed rate and the depth of milling mainly depend on the material of the workpiece, the diameter of the end milling cutter, and machine performance. Combined with the experience of cutting, the cutting velocity in the range of 120–210 m/min, the feed rate in the range of 0.05–0.25 mm/r, and the milling depth in the range of 2–6 are widely used in semi-finish machining on the machine tool. For the design of experiment, in view of the methods above, a large number of experimental data are needed to train. Thus, combining the thought of mean experimental design and orthogonal experimental design could avoid the lack of experimental data and achieve comprehensive coverage. The experimental data are divided into two parts, that is, training data listed as first 70 lines and testing data listed as last 5 lines. Among them, the testing data are designed randomly but unduplicated with the front ones. In addition, the cutting width is set as 8 mm in this experiment, which has little impact on energy consumption compared with the other three elements.
Prediction of energy consumption
Based on the above-described method and experimental data, this work adopts a novel three-stage method to predict the energy consumption for a milling process, namely, determination of Pb by sliding filter method, prediction of Pfs by the MLR method, and prediction of Pca by the improved GEP algorithm. After this, the total energy consumption of the milling process is obtained.
Evaluation results of Pb
For a machine tool, if it is at nonload state, its energy consumption is theoretically constant. However, as described above, since the voltage and current are instable, the measure value of basic energy Pb is a certain value with volatility. According to the experimental data in Table 3, Pb is determined by the slide filtering method. For example, for the third experiment, according to the slide filtering method, the sampling points corresponding to Pb are intercepted as shown in Figure 5. Thus, Pb corresponding to the third experiment is obtained, that is, 445 W. Similarly, Pb corresponding to other experiments can also be obtained as line 5 in Table 5. So, the estimated value of Pb is the mean of Pb corresponding to each experiment, which is 446 W.
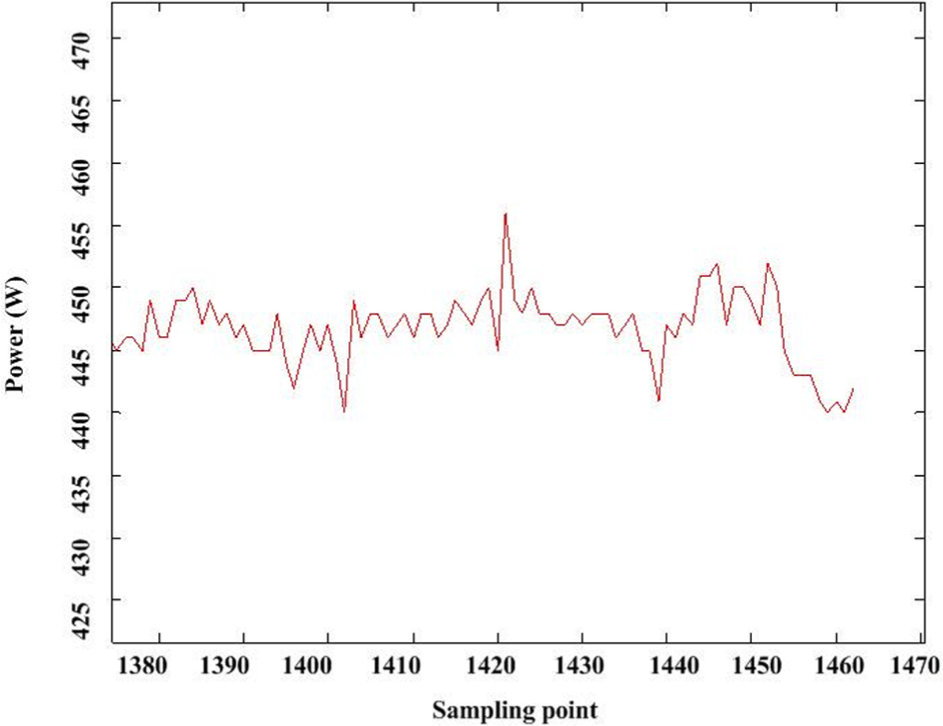
Interception of real-time Pb of the third experiment.
Prediction results of Pfs
For Pfs, to accurately achieve its prediction, an MLR method is applied to do it. Using Origin 8.0 to process the training data, its coefficient results and the statistic results between prediction value and experimental data are displayed in Table 6. Also, the correlation coefficient R2 and the mean absolute percentage error (MAPE) are used to evaluate the prediction performance; usually, the larger the R2 and smaller the MAPE, the higher the accuracy. MAPE can reflect the gap between predictive value and experimental value.
The result of regression.
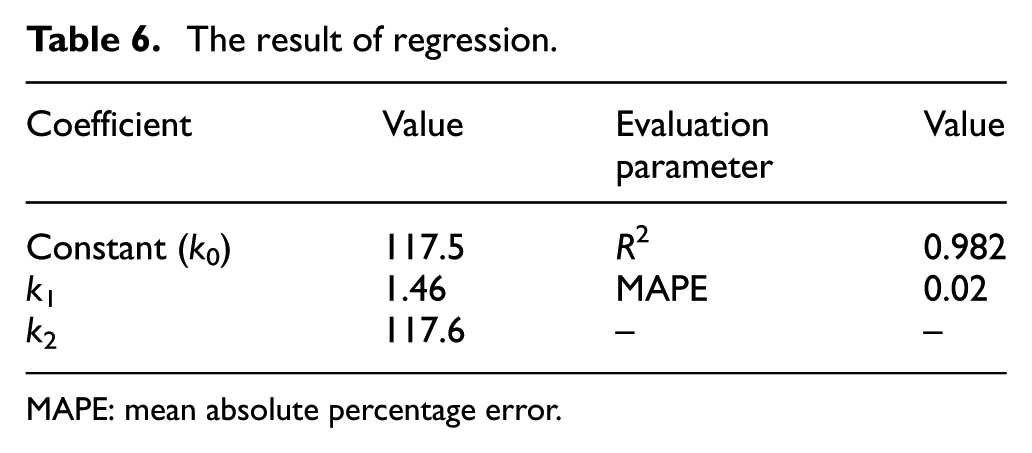
MAPE: mean absolute percentage error.
From Table 6, the R2 is 0.982, and MAPE is only 0.02. The training effect of MLR is highly satisfactory when the method is used to predict Pfs, which is written as follows

To verify its predictive ability, the testing data are applied to predict them, and their results are shown in Figure 6. From Figure 6, the MLR method has the good predictive ability. Moreover, the MAPE between testing data and predictive data is 0.039, and the R2 is 0.973, which also reflect its accuracy.
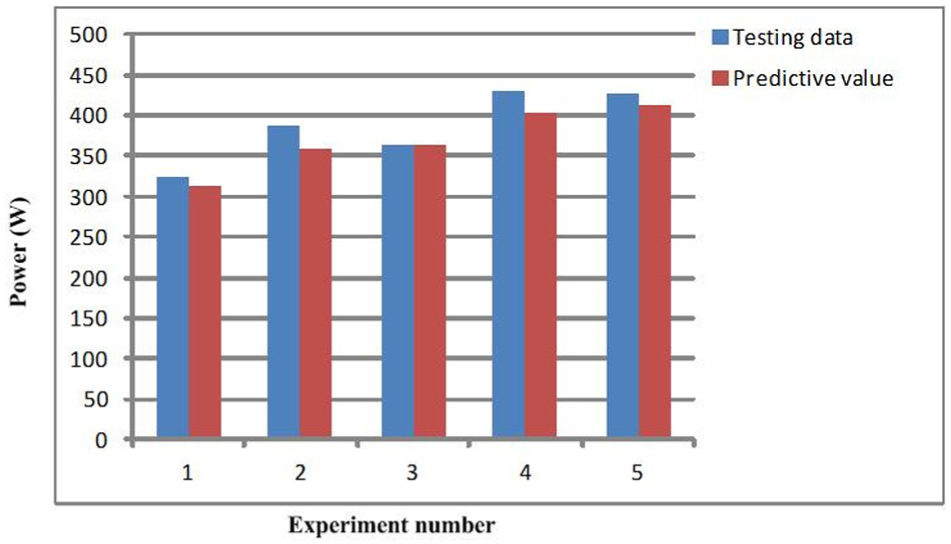
The prediction results for testing data for Pfs.
Prediction results of Pca
Since Pca has the strong nonlinear relationship with cutting parameters, that is, v, f, and ap, this work adopts the improved GEP method to predict it.
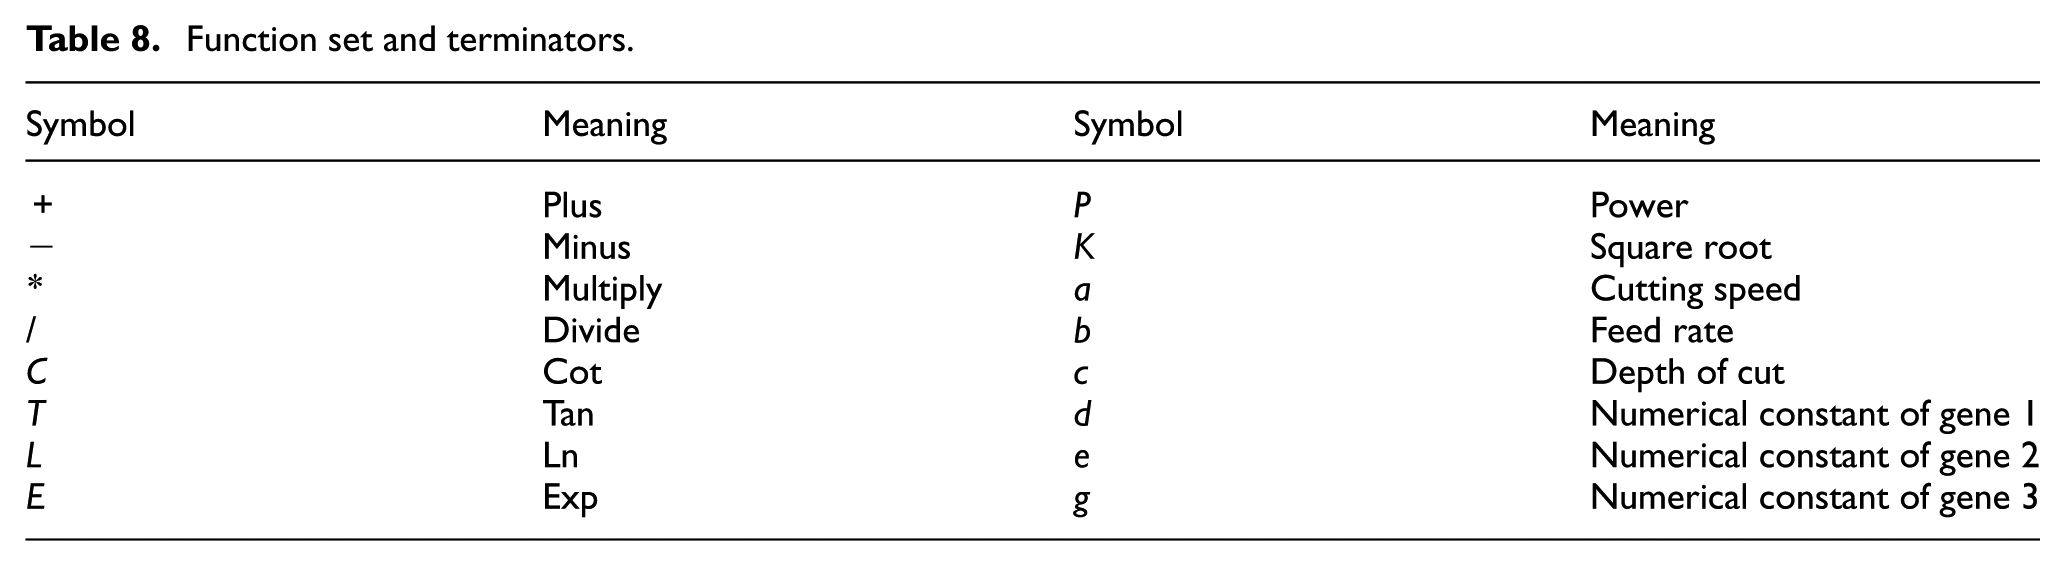
The program is coded in C++ and implemented on a personal computer with a 2.53-GHz Intel Core 2 Duo central processing unit (CPU). The specific parameters used in the improved GEP are set in Table 7. In addition, the improved GEP’s function set concludes 10 operations, and it is displayed in Table 8. The probabilities of genetic operations are set according to the genetic algorithm. For example, the mutation rate is generally set in the range of 0.01–0.1. 32 Note that 75 data shown in Table 3 are divided into two groups, first 70 dataset is used to train and the other 5 dataset is used to test.
The specific parameters of improved GEP in the models.
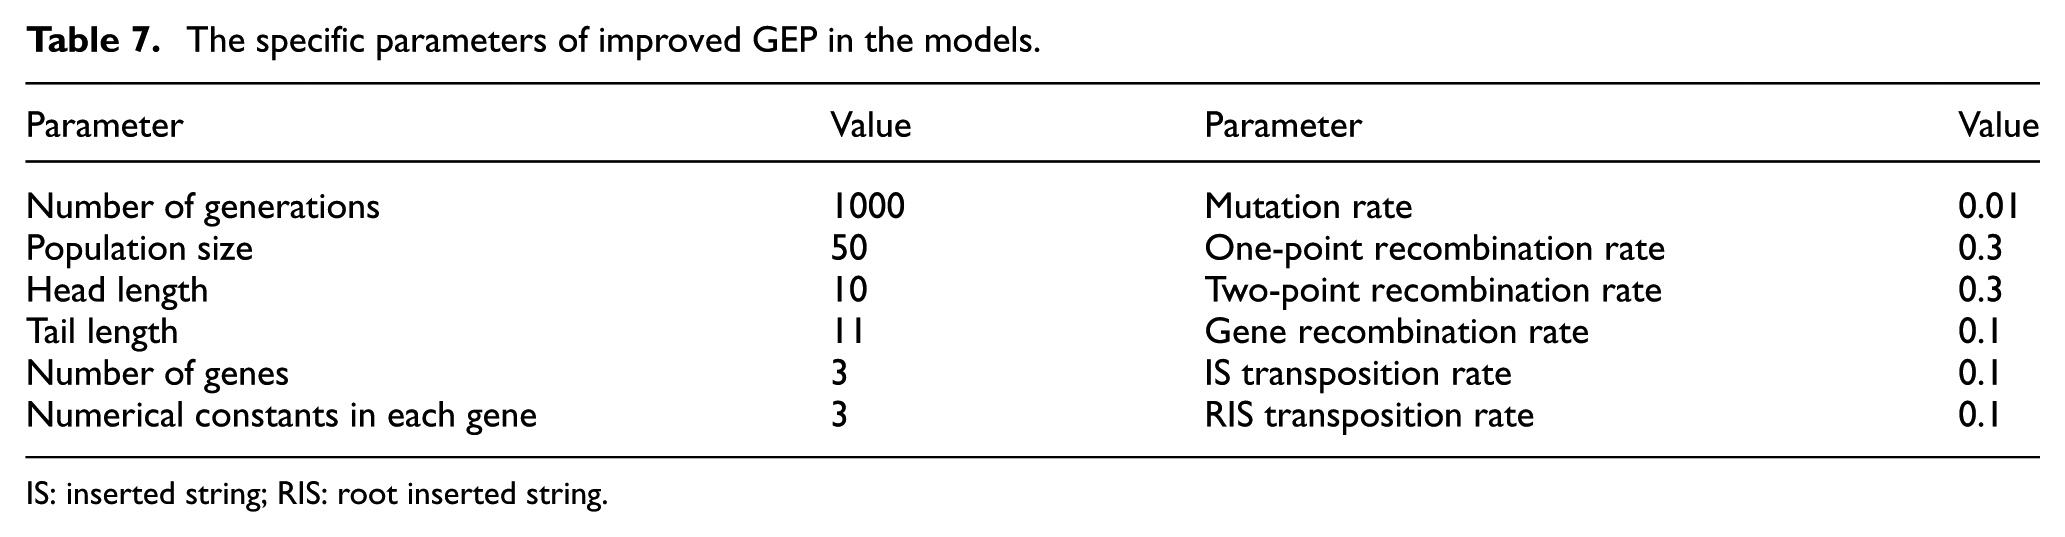
IS: inserted string; RIS: root inserted string.
Function set and terminators.
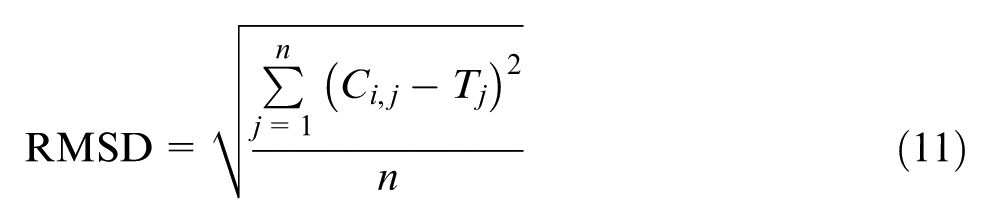
Take 70 three factors, that is, cutting speed v, cutting depth ap, feed rate f, and energy consumption Pca dataset as input and output of GEP training, respectively. After the improved GEP algorithm is run, the specific GEP model is established. For estimating the effect, root mean square deviation (RMSD) is selected as the fitness function in the algorithm. RMSD is expressed as in equation (11). In addition, the iterative results are progressing as shown in Figure 7
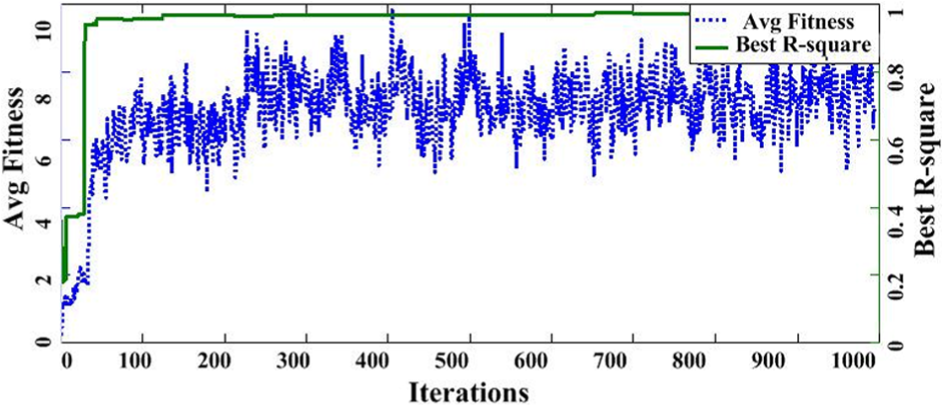
The iterative results.
The result shows that the best fitness is 24.3, and the R2 is 0.989, which denote that accuracy of the predicting model about the milling energy by the improved model is highly satisfactory. The three genes of the best chromosome obtained are shown in Figure 8.
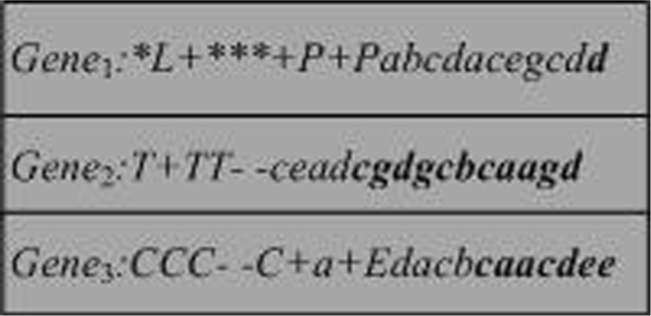
The result of GEP.
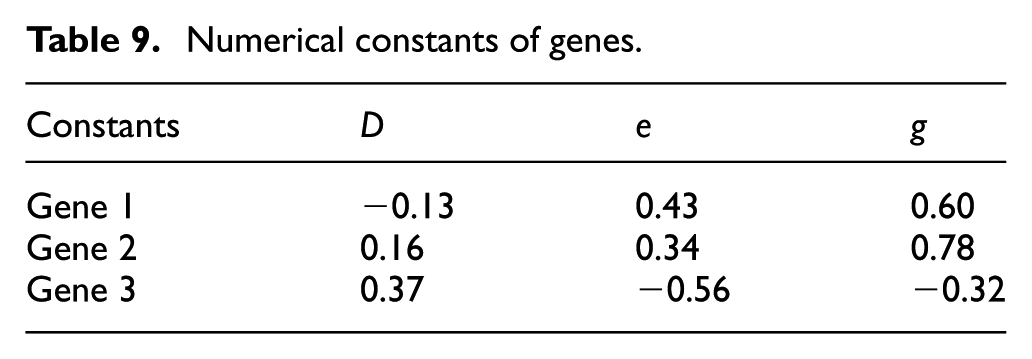
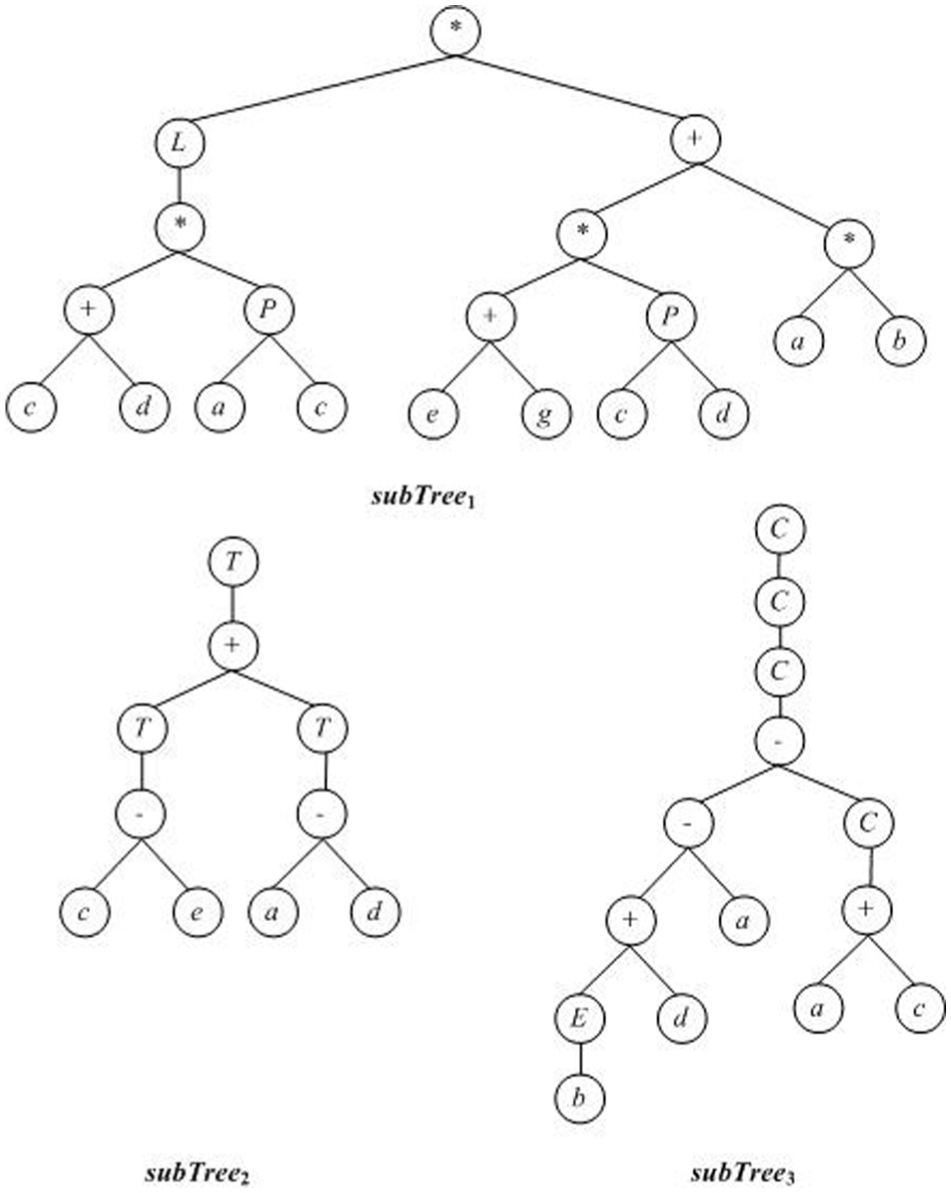
In addition, the constant terms of the three genes are obtained, which are listed in Table 9. The genes expressed by strings are used to construct the corresponding sub-trees via decoding, which are shown in Figure 9.
Numerical constants of genes.
ET for expression.
Thus, the prediction model of milling energy Pca is obtained and is expressed as follows

In addition, in order to make future tests and observe the effectiveness of the proposed GEP method, the prediction result for testing data is presented in Figure 10.
The prediction results for testing data for Pca.
From Figure 10, the proposed GEP method has the good predictive ability. Moreover, the MAPE between testing data and predictive data is 0.066, and the R2 is 0.996, which also reflect its accuracy.
Prediction of total energy consumption P
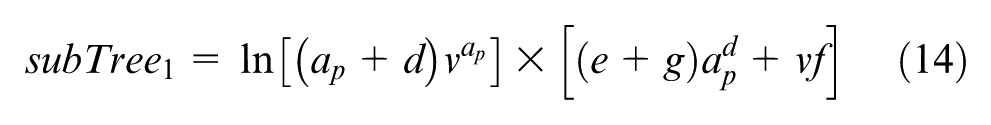
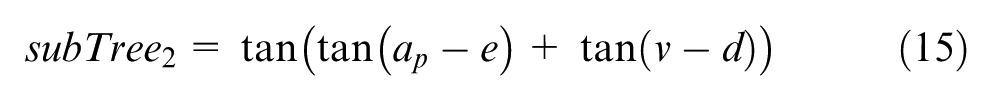
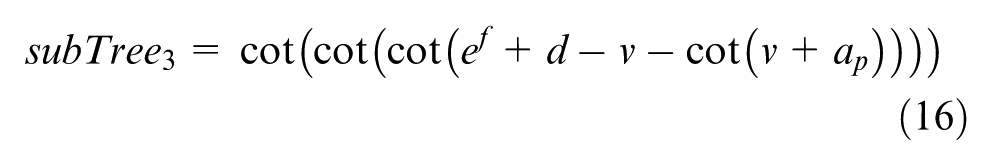
Based on the above three-stage modeling and equation (2), P is the combination of Pb, Pfs, and Pca, and it is presented as follows
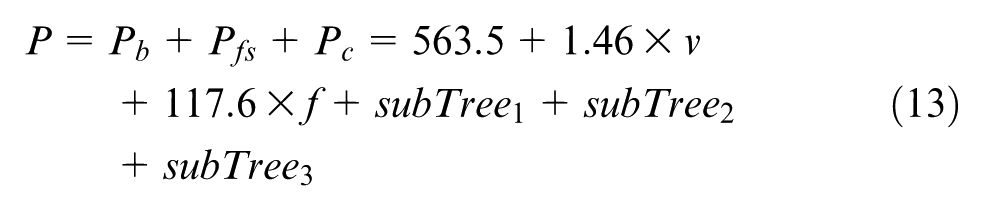
where subTree1, subTree2, and subTree3 are functions associated with cutting variables in the following equations. In addition, the values of d, e, and f come from Table 9
Analysis and verification of the proposed model
To verify the proposed combination method, the traditional full quadratic model is used to contrast with it. Note that the latter can effectively solve many prediction problems, for example, constrained program and mixed integer program. 33 Facing this problem proposed in this study, full quadratic model can fully consider the interaction between cutting factors. Thus, it is selected as a method for our comparison purpose in this work. The full quadratic model is expressed as follows
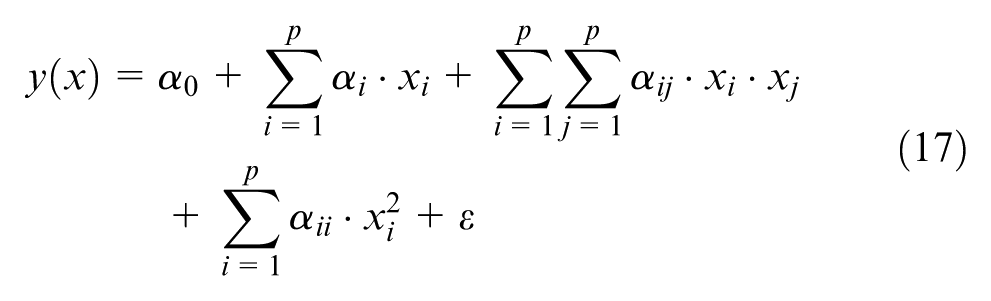
where y(x) is response value, xi and xj are the input variables,
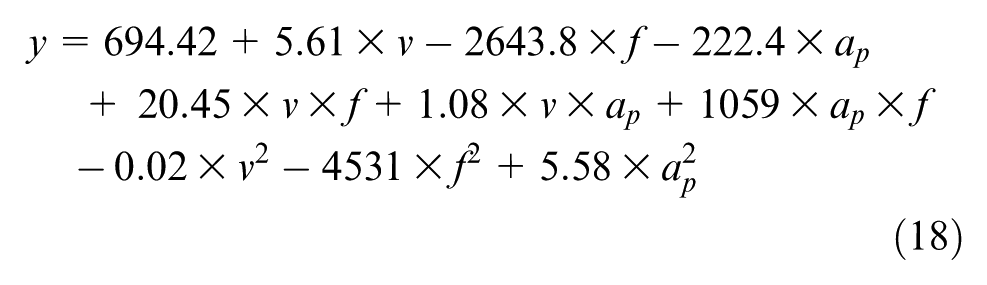
In this model, for predicting the energy consumption, x1, x2, and x3 denote the cutting velocity v, the feed rate f, and the milling depth ap, respectively. It is obtained by MATALB as follows
In addition, in order to observe the effectiveness of the proposed combination method, the training results for 70 training data among experimental data, the full quadratic model, and the proposed method are presented in Figure 11.
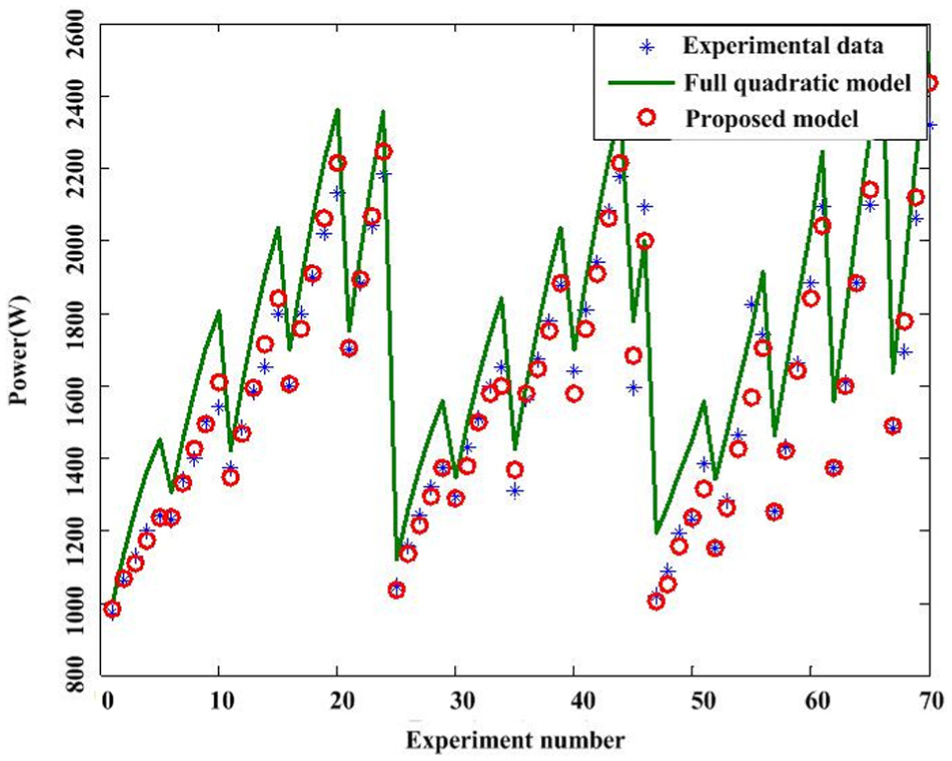
The training result comparison.
From Figure 11, overall, the proposed method has a better training performance than the full quadratic model. In addition, the training performance comparison for different prediction models is listed in Table 10.
Performance comparison for different prediction models.
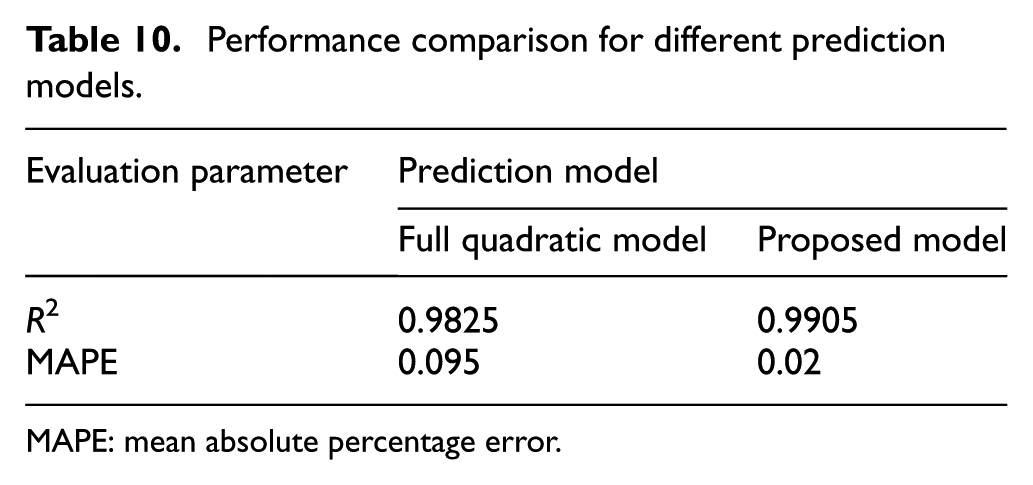
MAPE: mean absolute percentage error.
Moreover, the significant tests about the two models are conducted by MATLAB. As the sample number is >30 and subjects of testing are paired samples, the function t-test2 expressed in equation (19) is chosen to achieve it. The null hypothesis is the mean of experiment data is equal to the mean of the predicting value of the above models. When alpha is 0.01, the result is 0, which reflects to accept the null hypothesis at the significance level of 0.01. All in all, the proposed method can achieve the higher accuracy to predict the energy consumption of the milling process
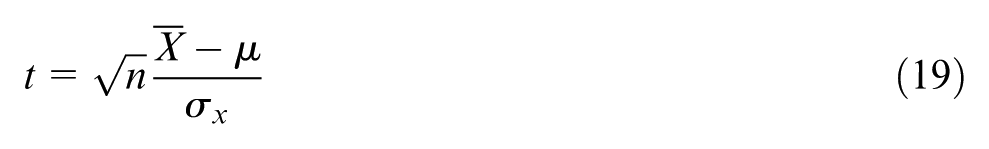
where t is the deviation statistic, n is the number of sample,
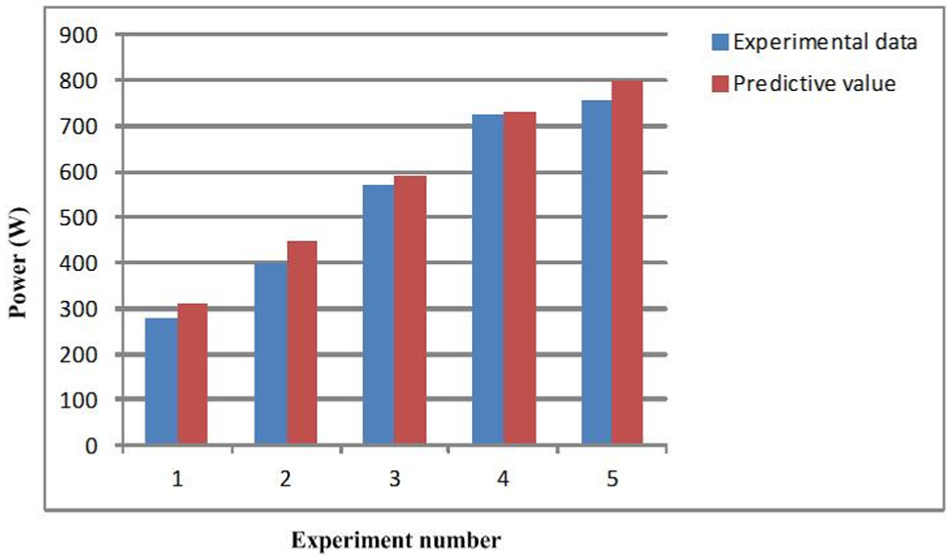
Additionally, the training result could only prove that the proposed model has better fitting ability than full quadratic model. To testify its predictive ability, the testing data are verified. Thus, the results of different prediction models for testing data are shown in Table 11 and Figure 12.
The comparison of prediction error.
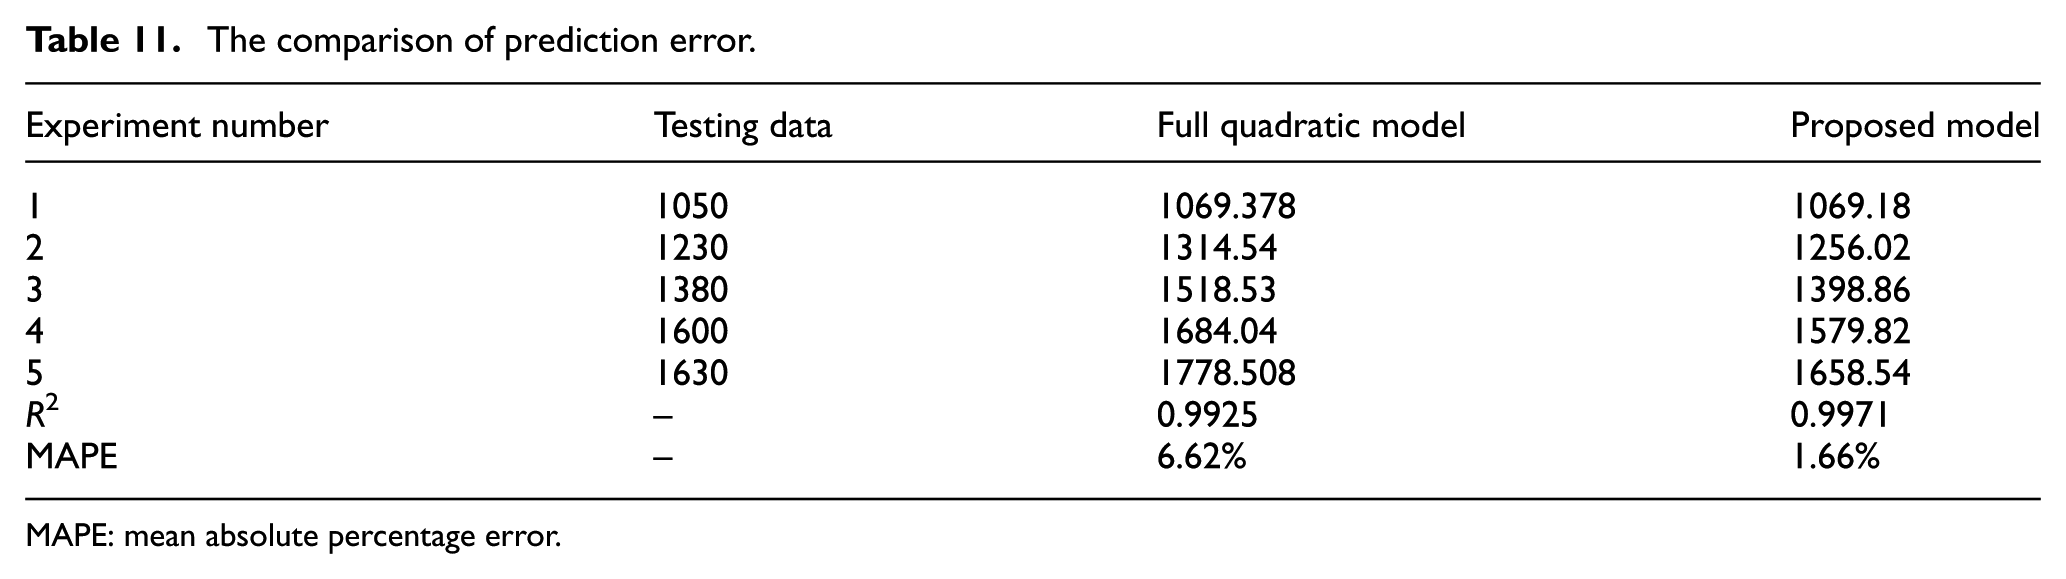
MAPE: mean absolute percentage error.
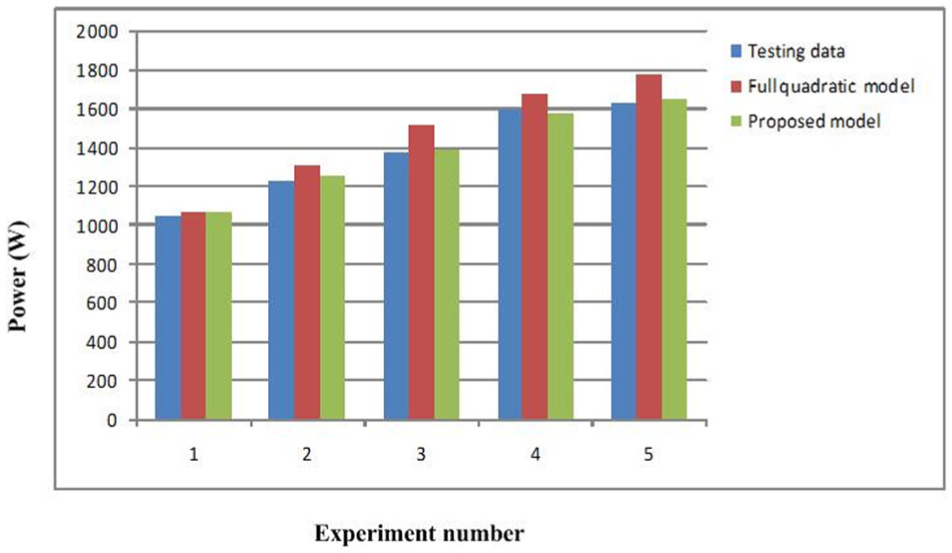
The prediction results for testing data for P.
From Table 11 and Figure 12, the energy consumption by the proposed method has more predictive effect than traditional full quadratic model, with the precision of >95%. The result denotes that the proposed method can effectively and accurately predict the energy consumption of the milling process.
Conclusion
For the specific milling process, the energy consumption model has been developed from a multistage perspective. The modeling and testing experiments are conducted on TC500R drilling center. The model proposed fully takes the relationship between energy consumption and the cutting variables in different stages into consideration. This method can not only avoid errors brought by the algorithm without this consideration but also explain its physical meaning to a certain extent. What is more, the improved GEP algorithm is proposed for solving complex and nonlinear predicting problem. This algorithm combines the advantages of VNS and GEP, which could escape from local optima and perform fine-turning. The study case proved its good effect. Compared with the full quadratic model for energy consumption, the proposed method can predict energy consumption of the specific end milling process with more accuracy. The obtained results can be used to guide decision makers in making better milling decisions.
There are still some issues not solved in this article. The model is developed on drilling center, which has some limitation when it is under end milling. For the model developed, the inner laws of how the energy consumption affects the machining process can be studied in the future. In addition, as the limitation of experiment conditions, this work only considered the milling process. Future works will be done to validate in a wider field and modern machining conditions.
Footnotes
Declaration of conflicting interests
The author(s) declared no potential conflicts of interest with respect to the research, authorship, and/or publication of this article.
Funding
The author(s) disclosed receipt of the following financial support for the research, authorship, and/or publication of this article: This research was supported by funds from International Cooperation and Exchange of the National Natural Science Foundation of China (No. 51561125002), the National Natural Science Foundation of China (Nos. 51575211, 51405211 and 51275190), the Natural Science Foundation of Hubei Province (No. 2014CFB348), and Postdoctoral Science Foundation Project of Heilongjiang Province of (Nos. LBH-Z13005 and LBH-TZ0501).