
Abstract
Titanium alloy, Ti6Al4V, is an exceptional material with several desirable properties, namely, high specific strength, high corrosion and heat resistance, which make it a promising contender in number of demanding applications. However, it has poor machinability, resulting from low thermal conductivity, high chemical reactivity with tool and spring effect during cutting. These properties lead to reduced tool life during machining, due to which its usage is limited despite excellent mechanical properties. Therefore, optimization of process parameters using response surface methodology in face milling of Ti6Al4V alloy with uncoated carbide tools has been investigated experimentally in this work. This article is focused on developing mathematical relation between input factors and response parameters, namely, surface roughness (Ra), tool wear (Tw) and tool vibration (Tv). The machining parameters are optimized for minimum Ra, Tw and Tv values. The optimal parameters are validated experimentally which showed a good agreement with the predicted results. The feed rate was found to be the most influential parameter affecting Ra and Tv, whereas cutting speed is the most effective in influencing Tw.
Introduction
Ti6Al4V is the most widely used titanium alloy due to its versatility in properties including high specific strength, exceptional corrosion resistance, biocompatibility and ability to retain its mechanical properties at elevated temperatures which make them suitable for aerospace, automobile and biomedical industries. 1 All these applications demand high-dimensional tolerances which generate the need for one or the other machining operation in processing this alloy. However, the poor machinability of this alloy, arising from low thermal conductivity, high hot hardness, high chemical reactivity with cutting tool and low elastic modulus, is a hindrance in its economical usage as conventional material. Rebeiro et al. 2 presented the chemical reactivity of Ti6Al4V alloy with tool material and conducted dry turning operations and found the machining results to be satisfactory at low cutting speeds. Sun et al. 3 carried out experiments to represent tool wear evolution and growth in dry machining of Ti6Al4V alloy. Furthermore, Boyer 4 mentioned the limited use of Ti6Al4V in specific fields like aerospace applications due to high cost of manufacturing compared to steel and aluminum, and suggested economic measures to reduce this cost. These factors lead to reduced tool life in Ti6Al4V alloy machining, demanding specialized machining practices, thus increasing its processing cost. A number of measures have been adopted by researchers to increase the tool life in Ti6Al4V alloy machining which includes utilization of superior tooling, coated tools, non-conventional machining and use of variable coolant systems including cryogenic cooling. Bermingham et al. 5 suggested the use of cryogenic cooling for improved tool life in high cutting heat generating materials like Ti6Al4V. These techniques have proved to be effective in tool life enhancement, but there is a need to obtain balance between the economics of machining and the quality achieved. A state-of-the-art review of number of techniques in tool life improvement of carbide tools in machining Ti6Al4V alloys has been suggested by Saini et al. 6 Here, the use of statistical techniques for generation of optimal solution plays a significant role.
The effect of various input factors on response parameters need to be critically analyzed before optimizing them for a required machining process involving certain workpiece and tool material. Suitable work regarding effect of input parameters on machining of Ti6Al4V alloy has been presented by several researchers. The increase in cutting speed has been considered beneficial for reduced cutting forces and improved Ra value in Ti6A44V machining, but it drastically reduces tool life 7 . Oraby and Alaskari 8 analyzed that though the lesser feeds are beneficial for attaining lower Ra values, the use of larger feeds with high cutting speeds is recommended for minimizing cutting vibrations as the lower feed rates result in lower chip stiffness causing fluctuation in cutting forces resulting from low elastic modulus and high tool tip temperature. The depth of cuts upto 0.8 mm is advised in dry machining of Ti6Al4V alloy, 9 as it results in moderate Ra values and tool wear with advantage on decreased force and vibration amplitude. The other input factors affecting machining are tool material and tool geometry, tool surface treatment to reduce friction and type, and quantity of lubrication used. For Ti6Al4V machining, the use of tungsten carbide tools with positive and lower rake angles has been recommended 10 for low and moderate cutting speeds. The use of coated tools and refractory tools, such as polycrystalline diamond (PCD) and polycrystalline cubic boron nitride (PCBN), is recommended in high-speed machining of Ti6Al4V alloy. Polini and Turchetta 11 attempted milling on Ti6Al4V alloy using coated carbide tools and found improved tool life with improved surface integrity of workpiece. Jaffery and Mativenga 12 suggested the use of coatings having lower thermal conductivity than the alloy itself, for forced heat dissipation from the workpiece. The drawback with PCD and PCBN was presented 13 in the form of pronounced chatter at high cutting speeds, although much lower chipping was reported for these tools. Additionally, the use of minimum quantity lubrication (MQL) for improved machinability in terms of cutting forces, surface finish, tool wear and cutting temperatures was demonstrated.14–16 The use of cryogenic machining employing liquid nitrogen (LN2) as coolant was recommended 17 for improved tool life in high-speed machining of Ti6Al4V alloy.
The use of statistical methods for optimizing various machining input parameters to obtain desired response parameters has shown promising results by utilizing prediction model for these response parameters. One of the commonly used techniques in designing, predicting and optimizing a machining problem is response surface methodology (RSM). This technique is commonly used in predicting surface roughness (Ra), which is a measurable quality sign of machined component. Furthermore, the use of RSM for prediction of tool life, especially in hard-to-cut materials, by correlating it with other response parameters, namely, cutting forces, tool vibration and acoustic emission, has been tried by researchers. Thus, the use of RSM for prediction of tool life in Ti6Al4V is more than justified due to variability in results achieved during its machining.
A number of researchers have successfully utilized RSM technique in optimizing various process parameters in machining of hard-to-cut materials. A state-of-the-art review of various RSM techniques and parameters studied by researchers are listed in Table 1.
State-of-the-art review of various RSM techniques applied to various cutting processes.
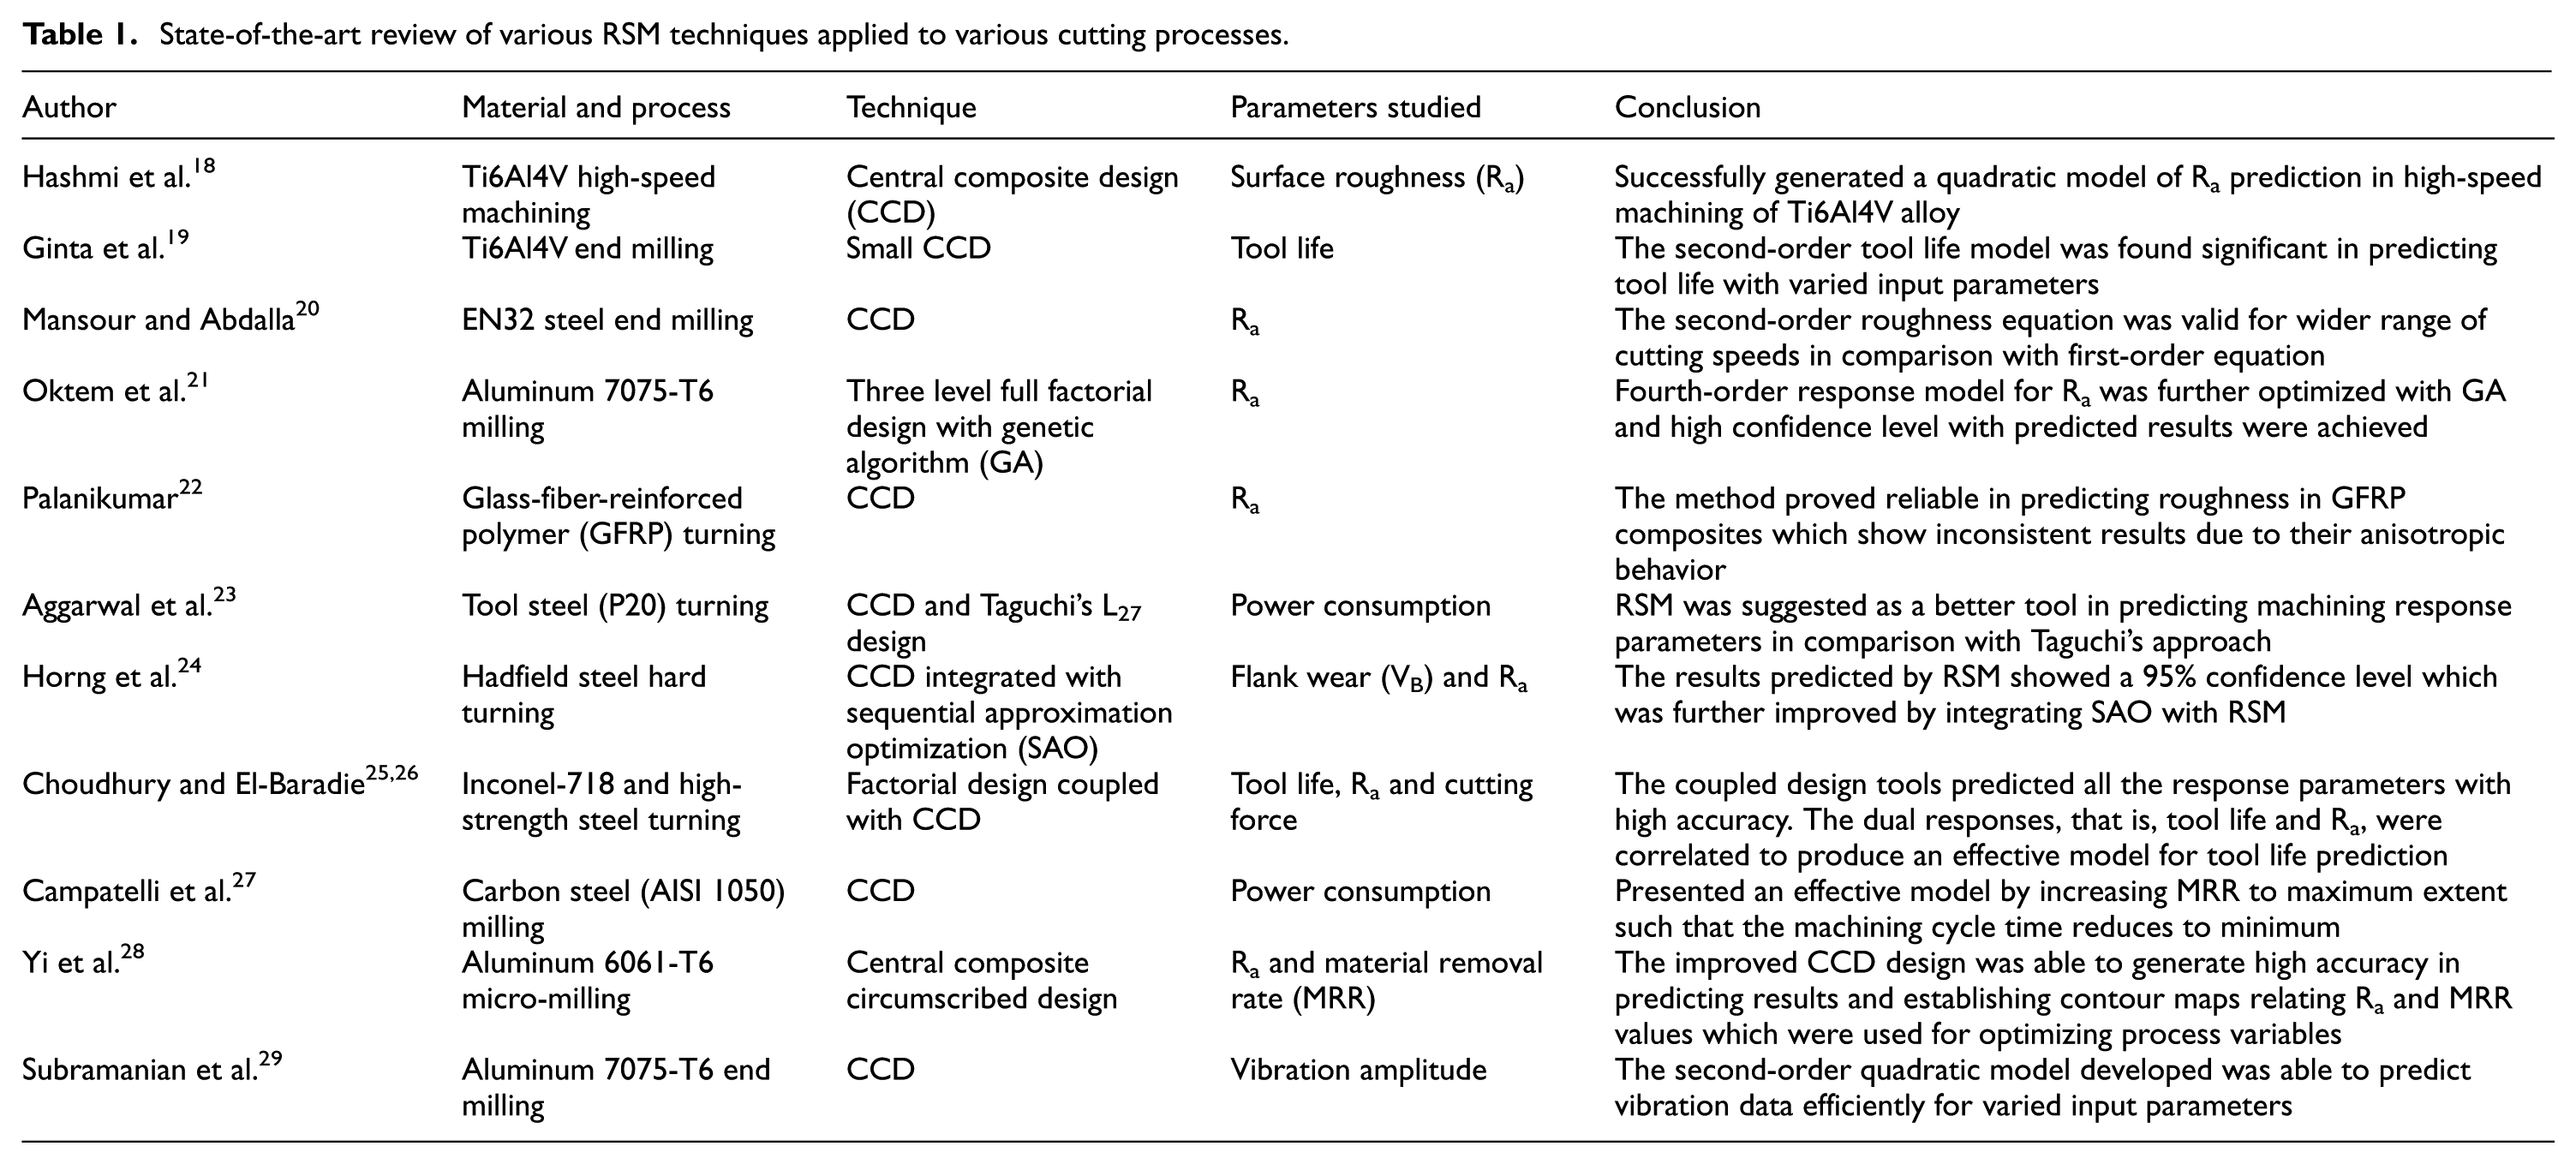
The reviewed work by various researchers provides a significant opinion on the use of RSM for measuring various response parameters in machining operation. Furthermore, the use of central composite design (CCD) technique in RSM is the most widely used technique and the response factor optimized being the Ra in most of the cases.
Experimental methodology
The experimental methodology of this work is divided into two parts. The first part is the experimental setup, which contains the description of the material and the equipment used in the experimentation. Second, the experimental design utilization and the input parameter consideration for experimentation.
Experimental setup
In this work, face milling of Ti6Al4V alloy using tungsten carbide tool (WC) was performed in dry conditions and multiple responses in the form of surface roughness (Ra), tool wear (Tw) and tool vibration (Tv) were analyzed for interpretation of tool life of the cutting tool. Figure 1 shows the machining setup used for face milling.
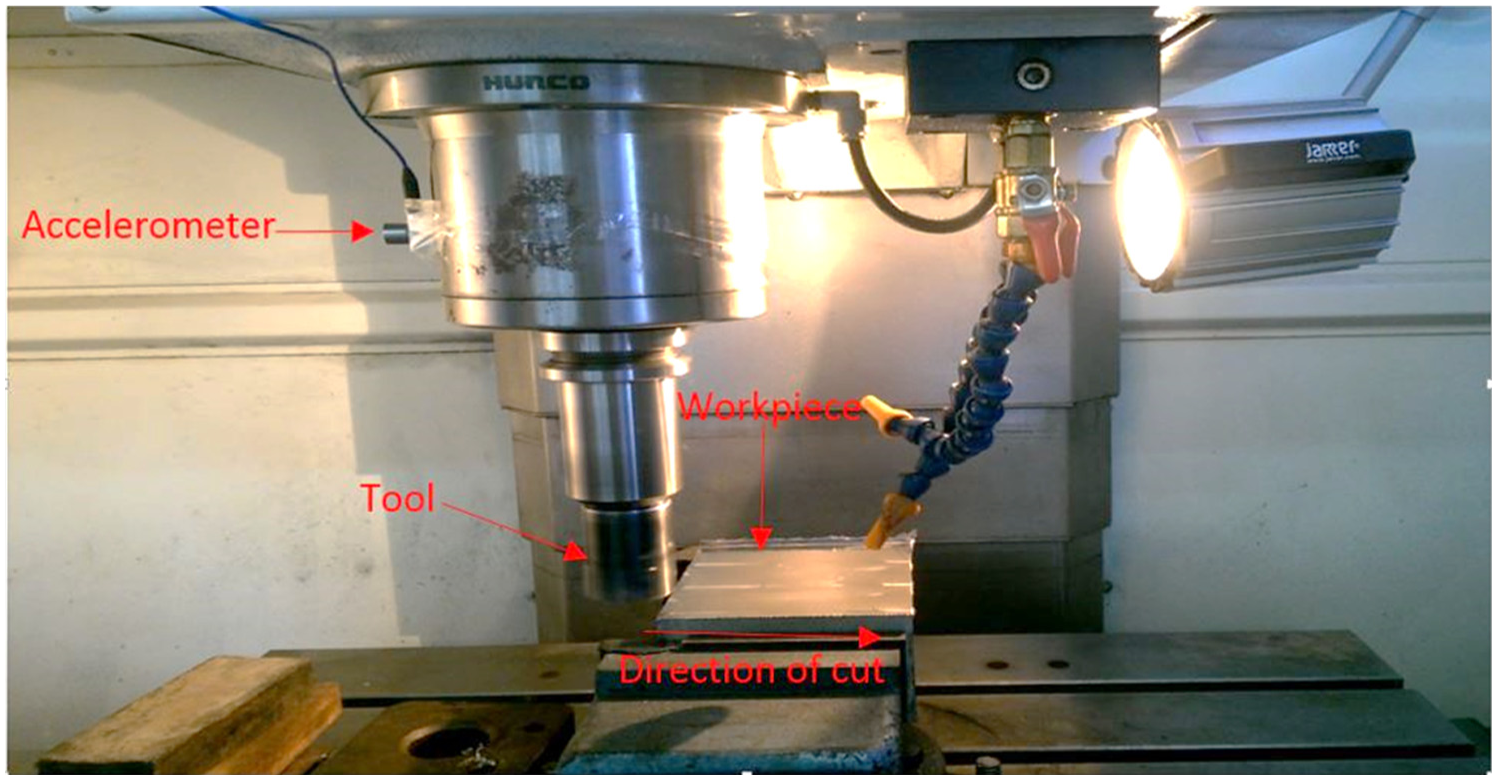
Experimental setup.
Workpiece specifications
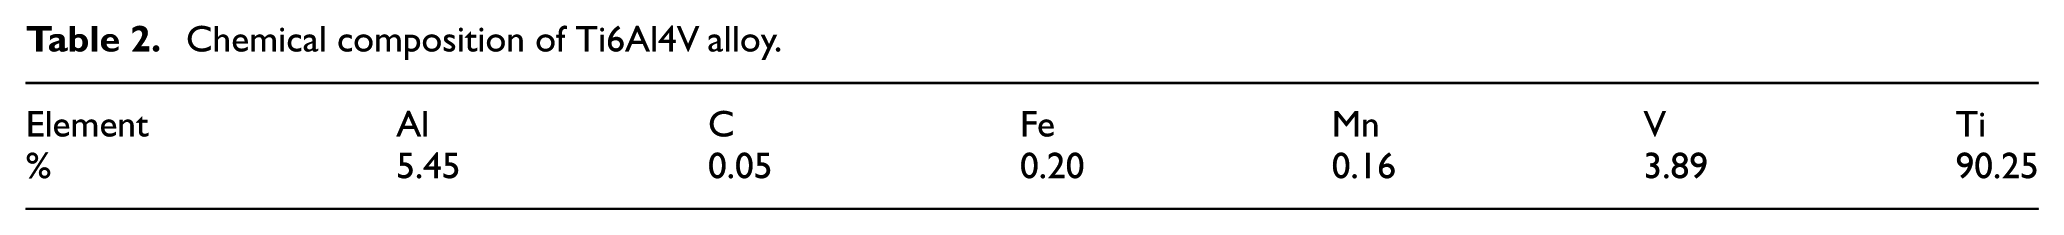
The workpiece in the form of plates of annealed Ti6Al4V alloy, of size 110 mm × 115 mm × 65 mm, was utilized for the milling operation. The chemical composition of the workpiece material is given in Table 2.
Chemical composition of Ti6Al4V alloy.
Tool specifications
The cutting inserts used were uncoated tungsten carbide (TPKN2204PDR CTC-K20) of Carbotec Company. The triangular inserts having three cutting edges were of length 22 mm, 4.5 mm thickness and axial rake angle of 11°. The machining was performed by a 40-mm face mill tool cutter (BT40) with 62 mm overhang length. Two cutting edges per cut were utilized for the cutting operation. Each experiment was started with new cutting insert. The computer numeric control (CNC) machine tool used was a Vertical Milling Centre (Hurco VM-10).
Testing equipment
The responses were noted after each 110 mm length of cut for a maximum upto the failure of tool, that is, either tool flank wear (VB) of 300 µm or tool premature failure was reached. The averaged surface roughness value, Ra, was measured after each cut using a portable surface roughness tester (Mitutoyo make). An average of three Ra values was taken as final response for a fixed sampling length of 4 mm. The VB of the tool was measured for specified length of cut for each experimental combination using a machine vision system (Sipcon make) at a magnification of 100×, and an average of maximum, middle and minimum VB value was considered as response for tool wear (Tw); the images for VB measurement, built-up edge (BUE) and crater face are shown in Figure 2. The tool life was thus interpreted from time of each run multiplied by number of runs. For tool vibration, a single-axis accelerometer was attached to the spindle of machine, as shown in Figure 1, in order to measure the vibration amplitude in terms of acceleration, of the cutting tool, in the feed direction of cut, the data obtained is shown in Figure 3. The average of the vibration amplitude data for the mentioned length of cut was considered as response. The data was recorded and analyzed using NI cREO and NI Labview software, respectively, for single-axis accelerometer.
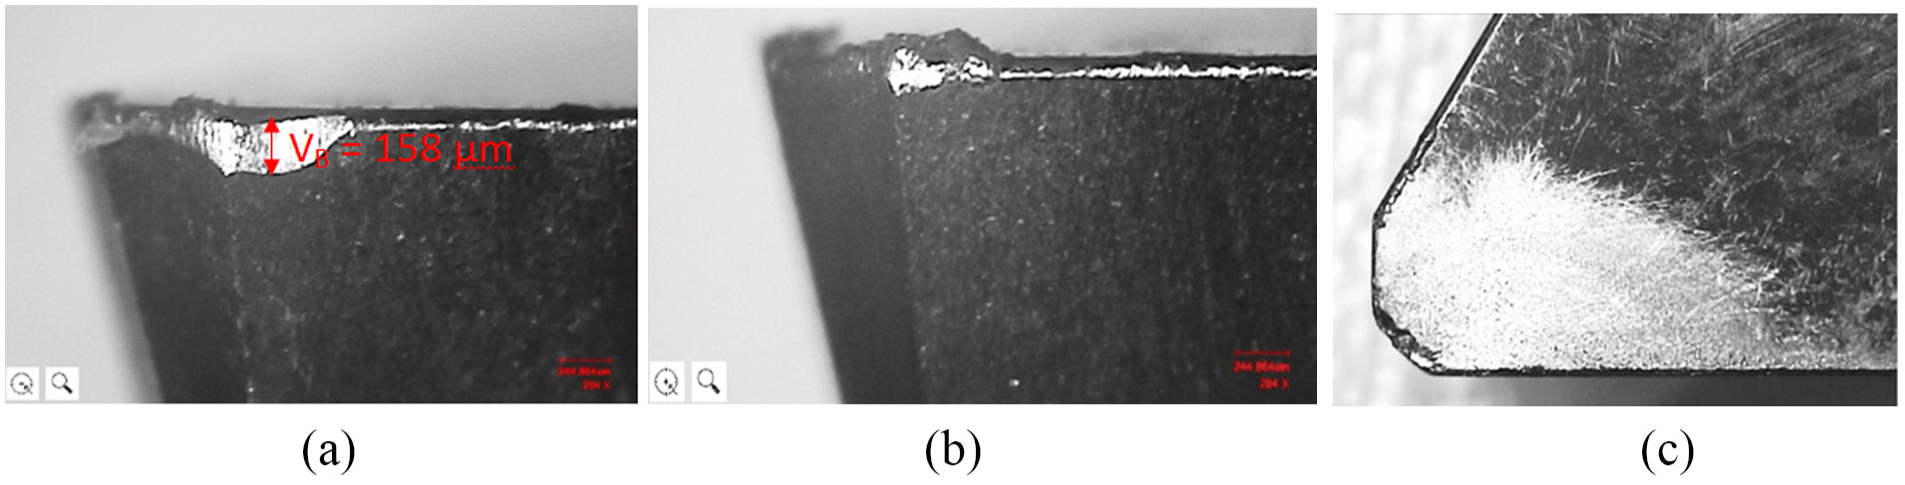
Image from machine vision system (100×) showing (a) VB, (b) BUE and (c) crater face after 660 mm length of cut for any random set of input parameters.
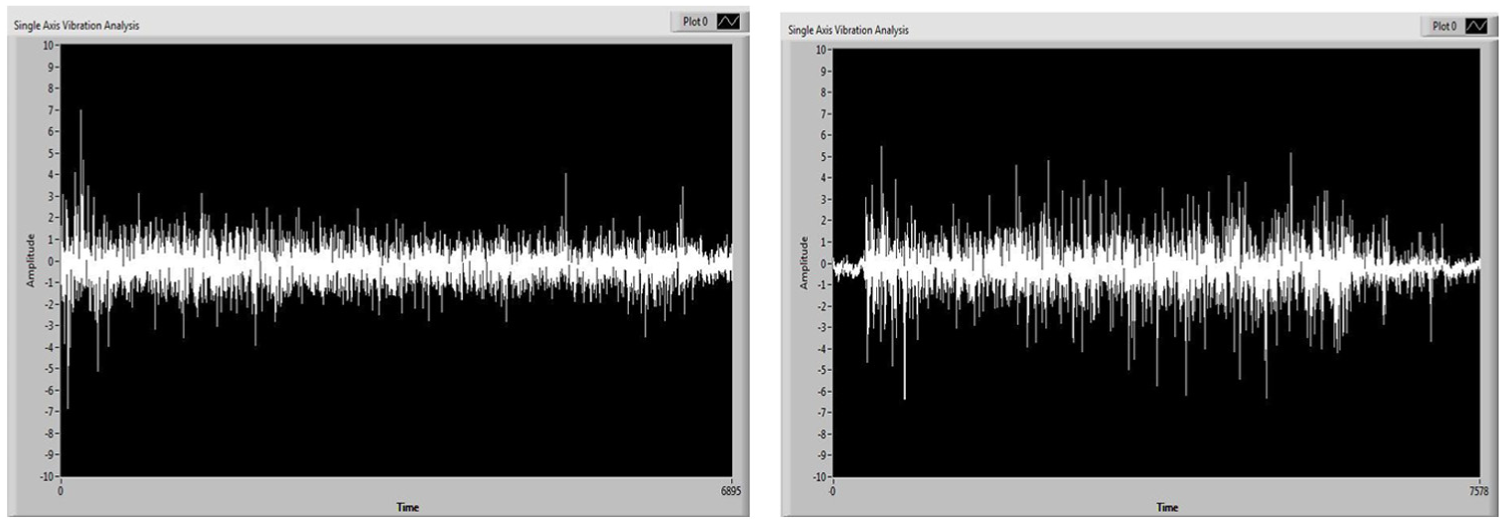
Vibration signatures captured from single-axis accelerometer.
Experimental design
The use of CCD and regression technique in RSM was preferred for designing the experiments. The results were further analyzed using analysis of variance (ANOVA) and optimized for surface roughness (Ra), tool wear (Tw) and tool vibration (Tv) simultaneously. The Design Expert 8.0 software package from Stat-Ease Inc. was utilized for analysis and optimization using RSM. RSM is a combined mathematical and statistical tool for modeling and analysis of multi-variable problems. The detection of these response parameters with simultaneous variation in input parameter is where the RSM scores over other techniques. The user needs to identify and apply proper range of data for different input variables.
The CCD is the most commonly used RSM technique due to its reliability and efficiency in designing and predicting several manufacturing processes. Its use in machining is also justified as larger number of parameters can be incorporated effectively with least number of experiments. CCD is regarded as good design for fitting second-order (quadratic) polynomials. It is either a full factorial or a fractional factorial design consisting of center points, factorial points (on the edges) and axial points (star points) as shown in Figure 4. The choice of full or fractional design is based on the desired level of estimation in interaction terms. The axial points provide estimation of the curvature and give an estimation of quadratic terms. The center runs provide an internal estimate of error (pure error) and contribute toward the estimation of quadratic terms. The repeated center point runs contribute to the estimation of error in the quadratic terms. More the center runs, more is the accuracy in obtaining pure error, as it controls the distribution of variance within the area of interest. Further flexibility in design is available in the selection of axial distance (α), which estimates the region of operability of the design. The choice of ‘α’ value determines the design to be rotatable or not which depends on the number of experimental runs in factorial portion of CCD. In this work, in all, a total of 20 experiments are constituted for a full factorial design in CCD consisting of eight factorial points, six axial points and six repeated central point runs.
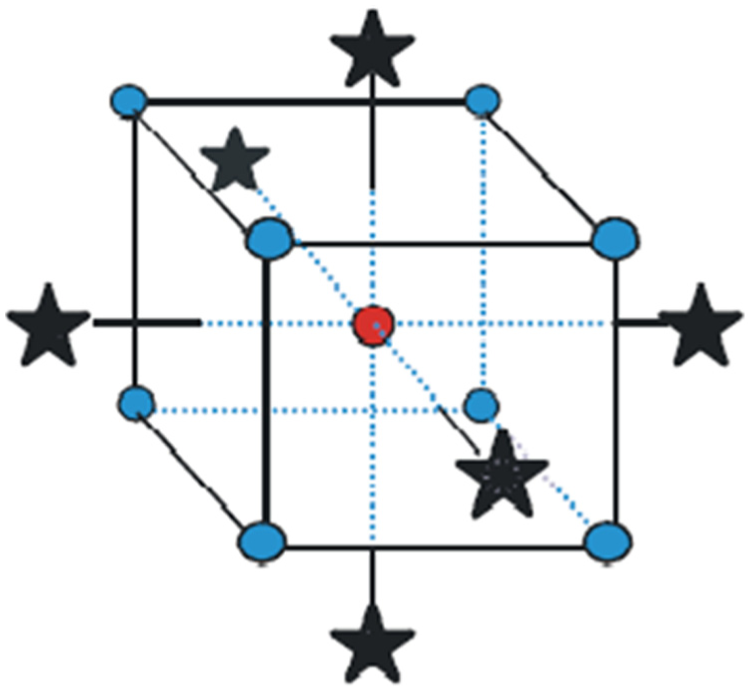
Central composite design diagram.
Empirical model generation
The various responses in machining are expressed by a generalized equation, as a function of different input variables, and its mathematical representation is given in equation (1) as

where ‘Y’ is the response factor; ‘s’, ‘f’ and ‘d’ are the input factors, namely speed, feed and depth of cut, and ‘ε’ is the error for the responses measured. The first and second-order mathematical equations, for equation (1), generalized from its logarithmic scale are expressed as equations (2) and (3), respectively


The RSM usually considers equation (3) for fitting the model in quadratic form to generate improved approximation in results. For further increasing the approximation of the data, either the degree of the polynomial is increased or region of interest is restricted (applicable to quadratic).
The relation between response surface Y and the process variable X1, X2 and X3 in generalized quadratic form of polynomial is given in equation (4)
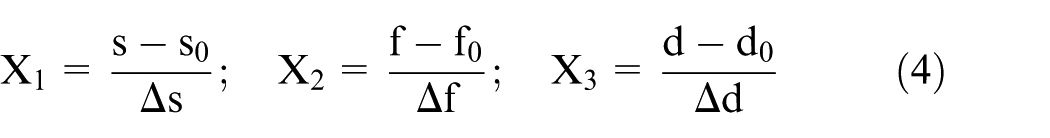
The initial conditions of input variables are denoted by ‘s0,’‘f0’ and ‘d0’, and Δs, Δf and Δd are the parameter variation intervals. Tw, Ra and Tv referred to as Y(Tw), Y(Ra) and Y(Tv), respectively, are the response functions.
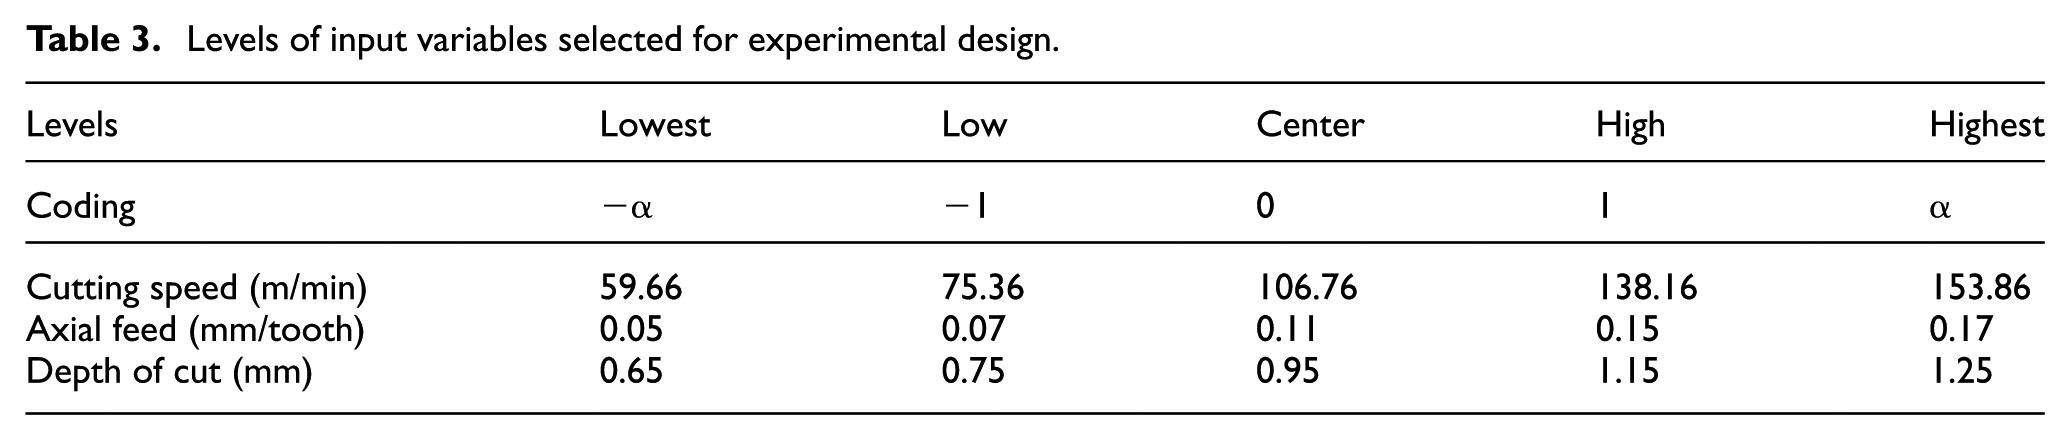
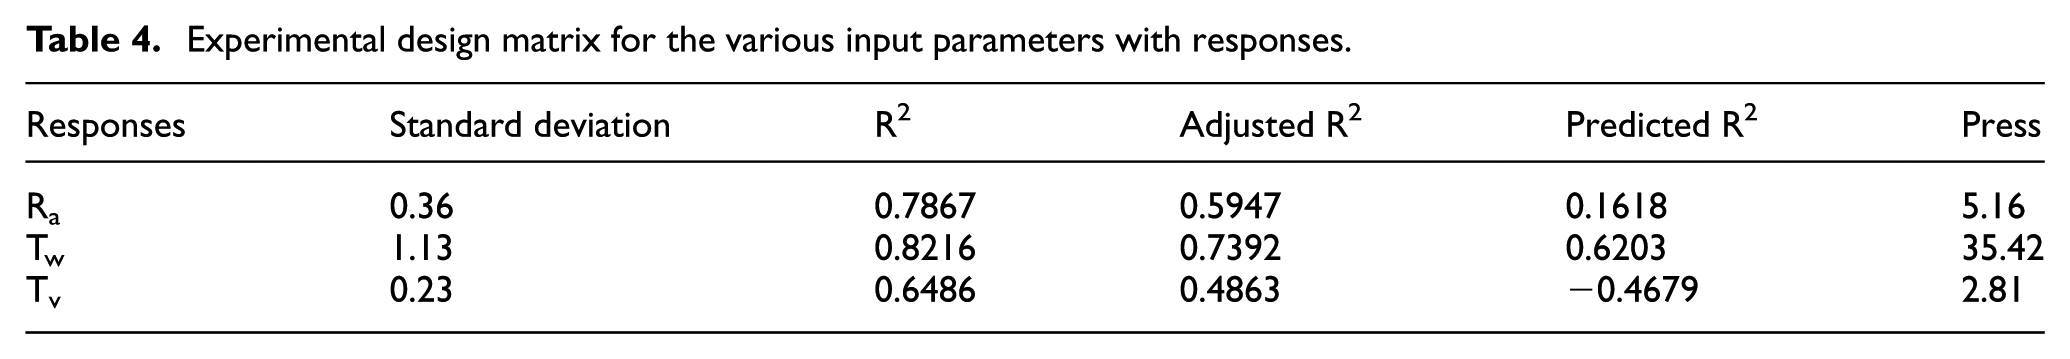
A full CCD model was selected which generated a total of 20 design experiments covering five levels for three input variables, namely, cutting speed (s), feed (f) and depth of cut (d). The appropriate input parameters were decided considering the findings from previous research work and recommendation made by the industry for face milling using uncoated tools under dry machining conditions (Table 3). Three response parameters, namely, Ra, Tw and Tv were considered. The range factor (α) was taken to be 1.5 for estimating additional input parameter in proximity of selected parameters. Table 4 shows the regression analysis of the responses with standard deviation, adjusted R2 and predicted R2 values for various response factors. The minimum value of standard deviation was presented for quadratic model for each of the response. Thus, the second-order quadratic model was selected for each of the response. The RSM model assists in developing interaction between various responses, namely, Y(Ra), Y(Tw) and Y(Tv) and the cutting input parameters s, f and d.
Levels of input variables selected for experimental design.
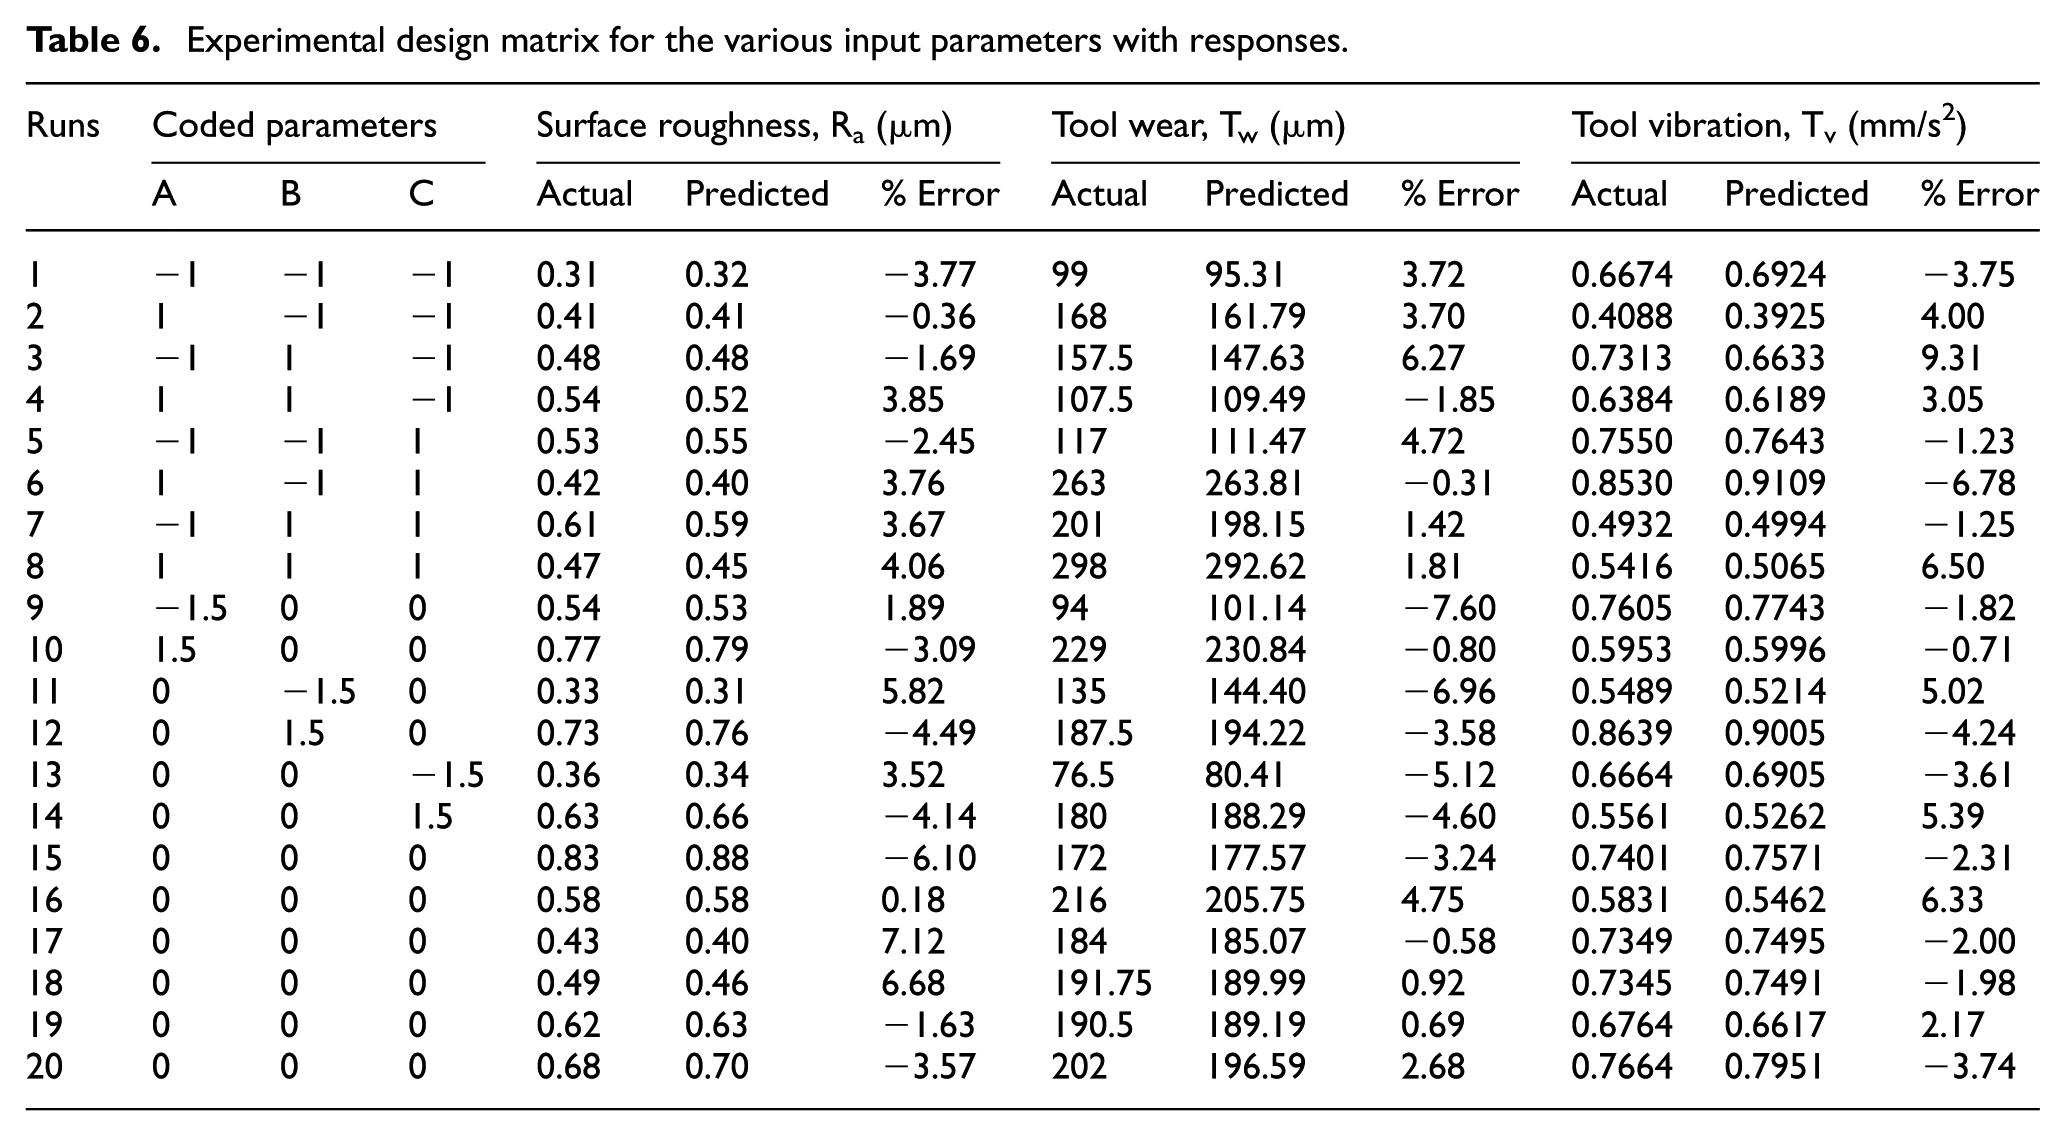
Experimental design matrix for the various input parameters with responses.
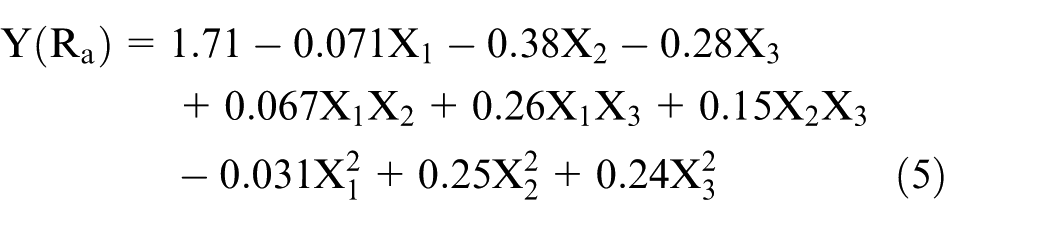
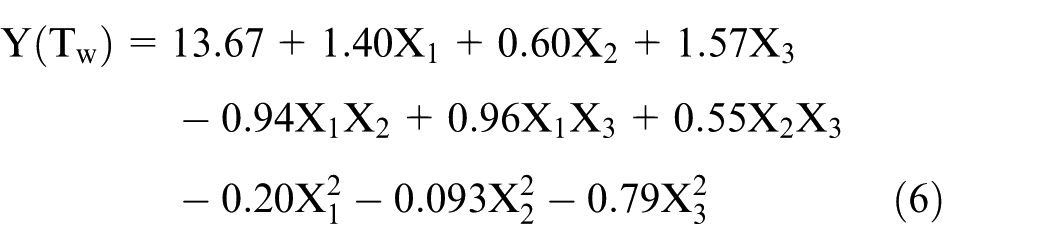
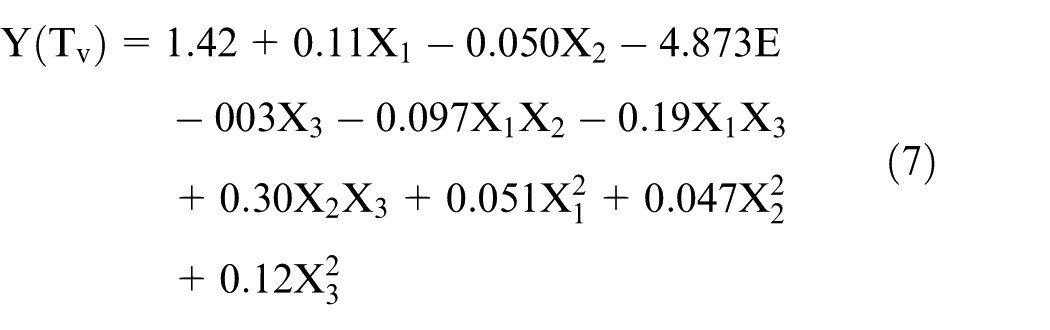
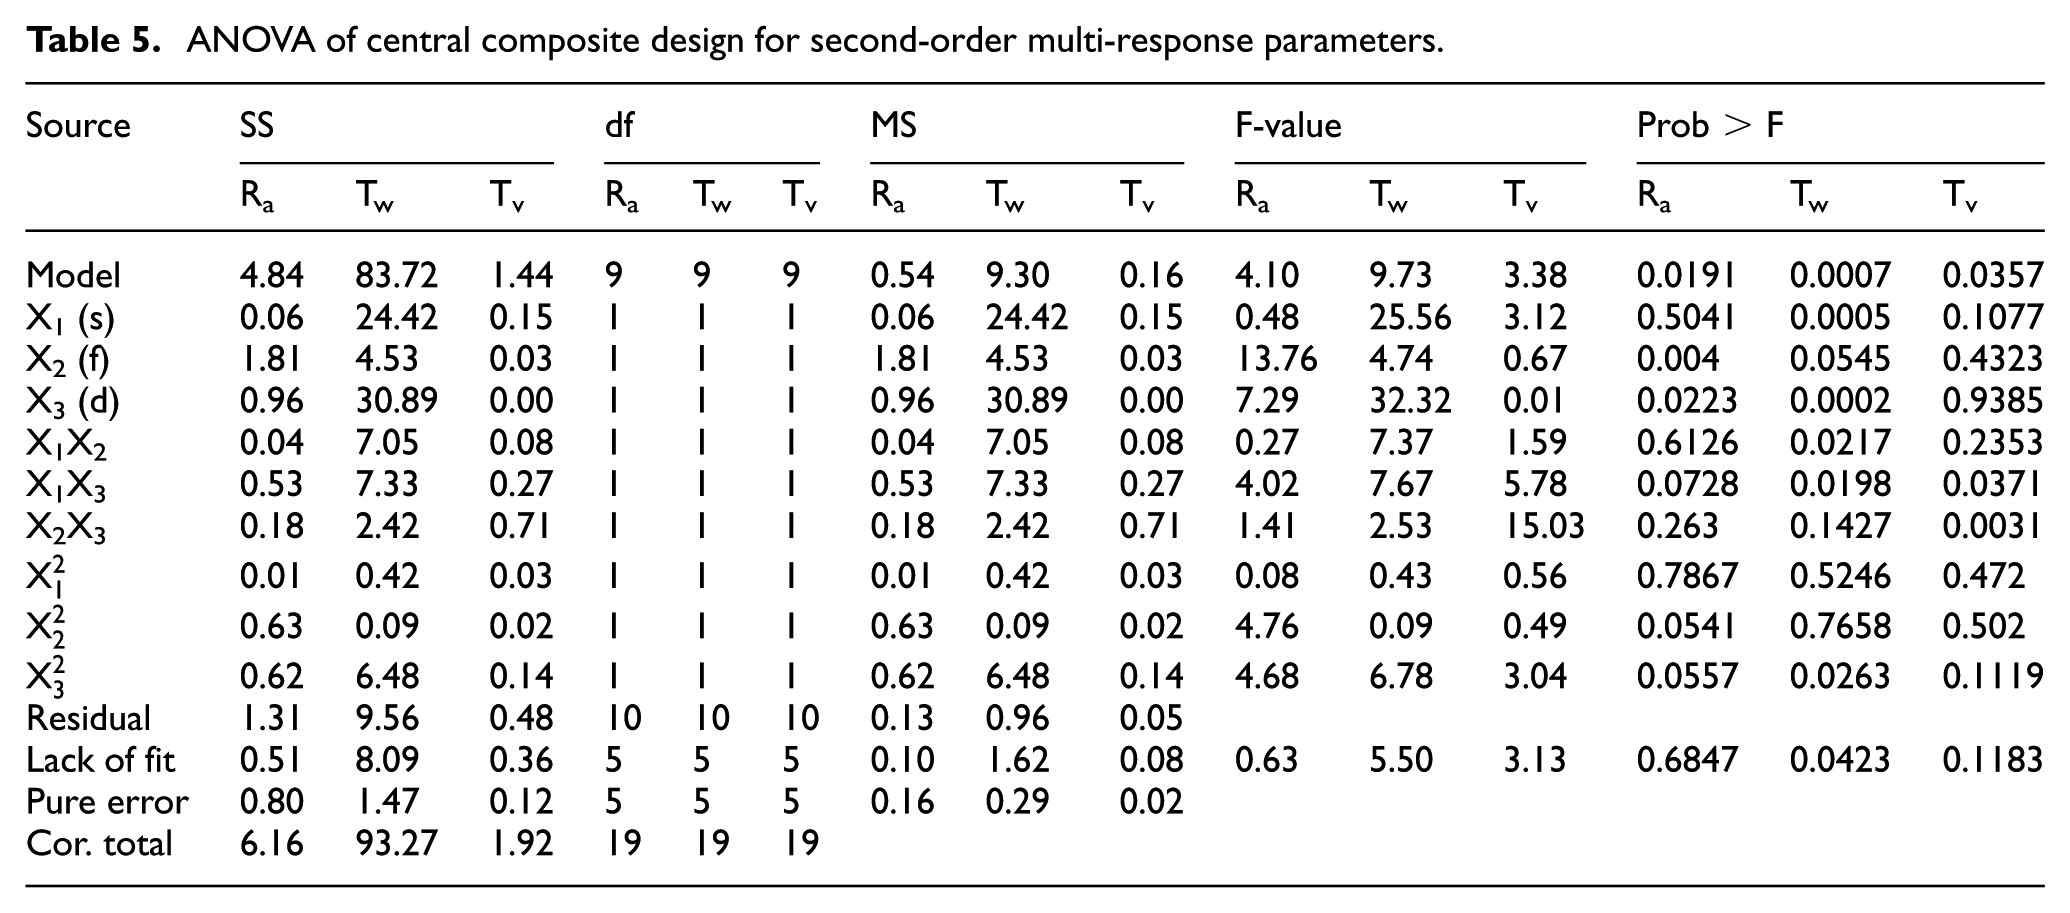
Furthermore, Table 5 shows the residual data obtained from the analysis using ANOVA for the second-order multi-response model. The model shows an acceptable value of F-probability less than 0.5 for all the responses, thus suggesting all the three models to be significant. Consequently, the second-order response equations for all the three responses were developed for the standard 20 experimental runs modeled using RSM
ANOVA of central composite design for second-order multi-response parameters.
Analysis of mathematical model
The chart in Table 6 shows the corresponding responses after 660 mm length of cut. The deciding factor for appropriate length was the point of first failure of tool occurring in any one of the experimental runs. The multi-response parameters, namely, Ra, Tw and Tv were analyzed for simultaneous minimization of all these parameters for the 20-run experimental model, utilizing the error values obtained in actual value and the predicted value from the empirical model. The data show a maximum of 9.31% prediction error in case of Tv, 7.60% for Tw and 7.12% being the maximum in case of predicting Ra value. Thus, the model was the most accurate for prediction of Ra, followed by Tw and least for Tv, with overall confidence level above 95% for all the averaged values of error data. Moreover, the confirmation of data generated from residual curves is shown in Figure 5, which represents the interaction between actual and predicted data. The proximity of all the data points to the inclined line indicates the validity of model and confirms its adequacy for the proposed work.
Experimental design matrix for the various input parameters with responses.
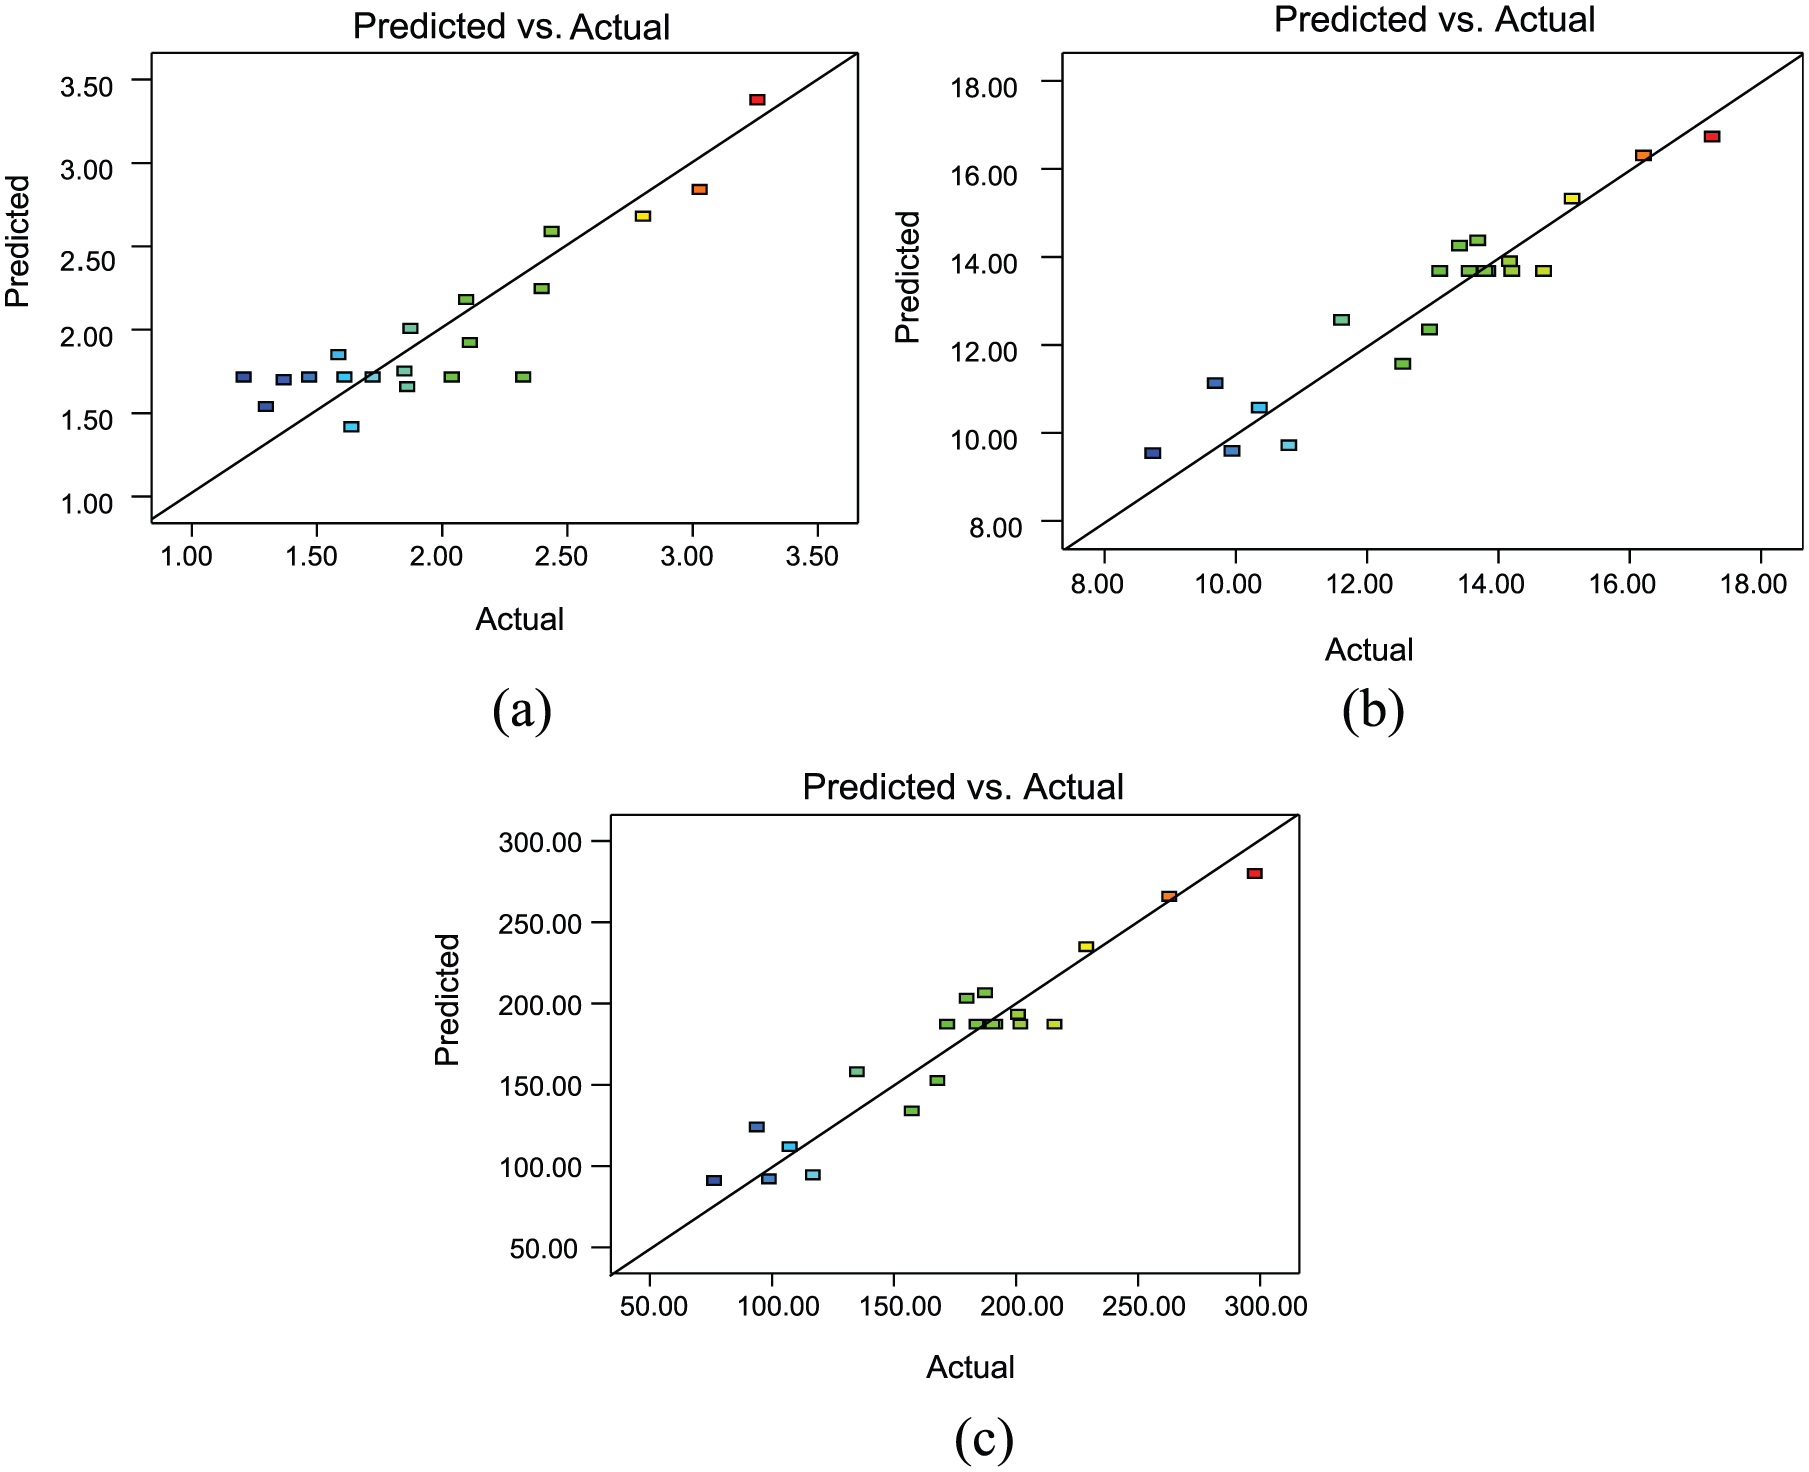
Predicted versus actual curve for (a) Ra, (b) Tw and (c) Tv.
Results and discussions
The mathematical model developed using RSM was analyzed and was found significant for all the three response parameters. The analysis of the responses was followed by optimizing the desired input variables in face milling of Ti6Al4V alloy to obtain desired responses. The effects of various parameters were studied on individual response factors to analyze the level of influence. The results were represented graphically and comparison charts were generated for each parameter. Finally, the desired conditions for optimization were simultaneously evaluated for predicting the optimal results in terms of cutting speed, feed and depth of cut.
Influence of input variables on surface roughness (Ra)
The input variables, that is, cutting speed, feed and depth of cut, were analyzed to study their individual effect on Ra. The data from the 20 experiments were used for developing the mathematical algorithm used for prediction and optimization. The results were represented in the form of multi-dimensional curves representing varied slopes, thus indicating variation in level of influence on Ra value. Figure 6 shows the effect of cutting speed (coded-A), feed (coded-B) and depth of cut (coded-C) on Ra. From perturbation curve shown in Figure 6(a), it is clearly indicated that the feed is the most influential factor in controlling Ra, as the slope is found to be maximum for this case. The increase in depth of cut is the next most influential parameter in increasing Ra value with least effect from cutting speed which shows almost neutral behavior with a slight negative slope, indicating that Ra decreases with increasing cutting speed. The three-dimensional (3D) curves in Figure 6(b)–(d) represent the simultaneous effect of any two parameters on Ra. Here, the behavior of Ra is seen to be almost constant with cutting speed in both Figure 6(b) and (c), with increase in Ra visible in direction of feed in Figure 6(b) and depth of cut in Figure 6(c). In Figure 6(b), the minimum surface roughness is for minimum feed 0.07 mm/tooth and keeps on increasing to maximum upto 0.13 mm/tooth feed and then again starts decreasing. Similarly, in Figure 6(c), the minimum Ra is at minimum depth of cut value of 0.75 mm and increases to maximum at constant speed reaching a value above 0.6 µm at 1.15 mm depth of cut, but sees a decline if higher cutting speed is considered. The combined effect of feed and depth of cut is shown in Figure 6(d) which indicates minimum Ra, at least value of both parameters with the maximum Ra attained at mid ranges of both the parameters, namely, 0.11 mm/tooth feed and 0.95 mm depth of cut. Thus, it was indicative that for obtaining minimal Ra value, maximum speed and minimum feed, as well as depth of cut, were recommended. The reason for this could be attributed to BUE which was common in almost all cases due to reactive nature of Ti6Al4V alloy, and it reduced and ultimately vanished with increasing cutting speed resulting in better surface properties, but it increased tool wear (Tw), discussed further, as BUE was shielding the flank face from wearing. Moreover, the higher cutting speeds resulted in high cutting temperatures which not only made the cutting easier but also resisted the adhesion of chips to the tool resulting in lower diffusion wear. On the contrary, the combination of higher feeds with lower cutting speeds resulted in maximum BUE and thus least surface finish quality. Thus, the high reactivity of Ti6Al4V led to BUE, resulting in increased surface wear at higher feeds and low cutting speeds.
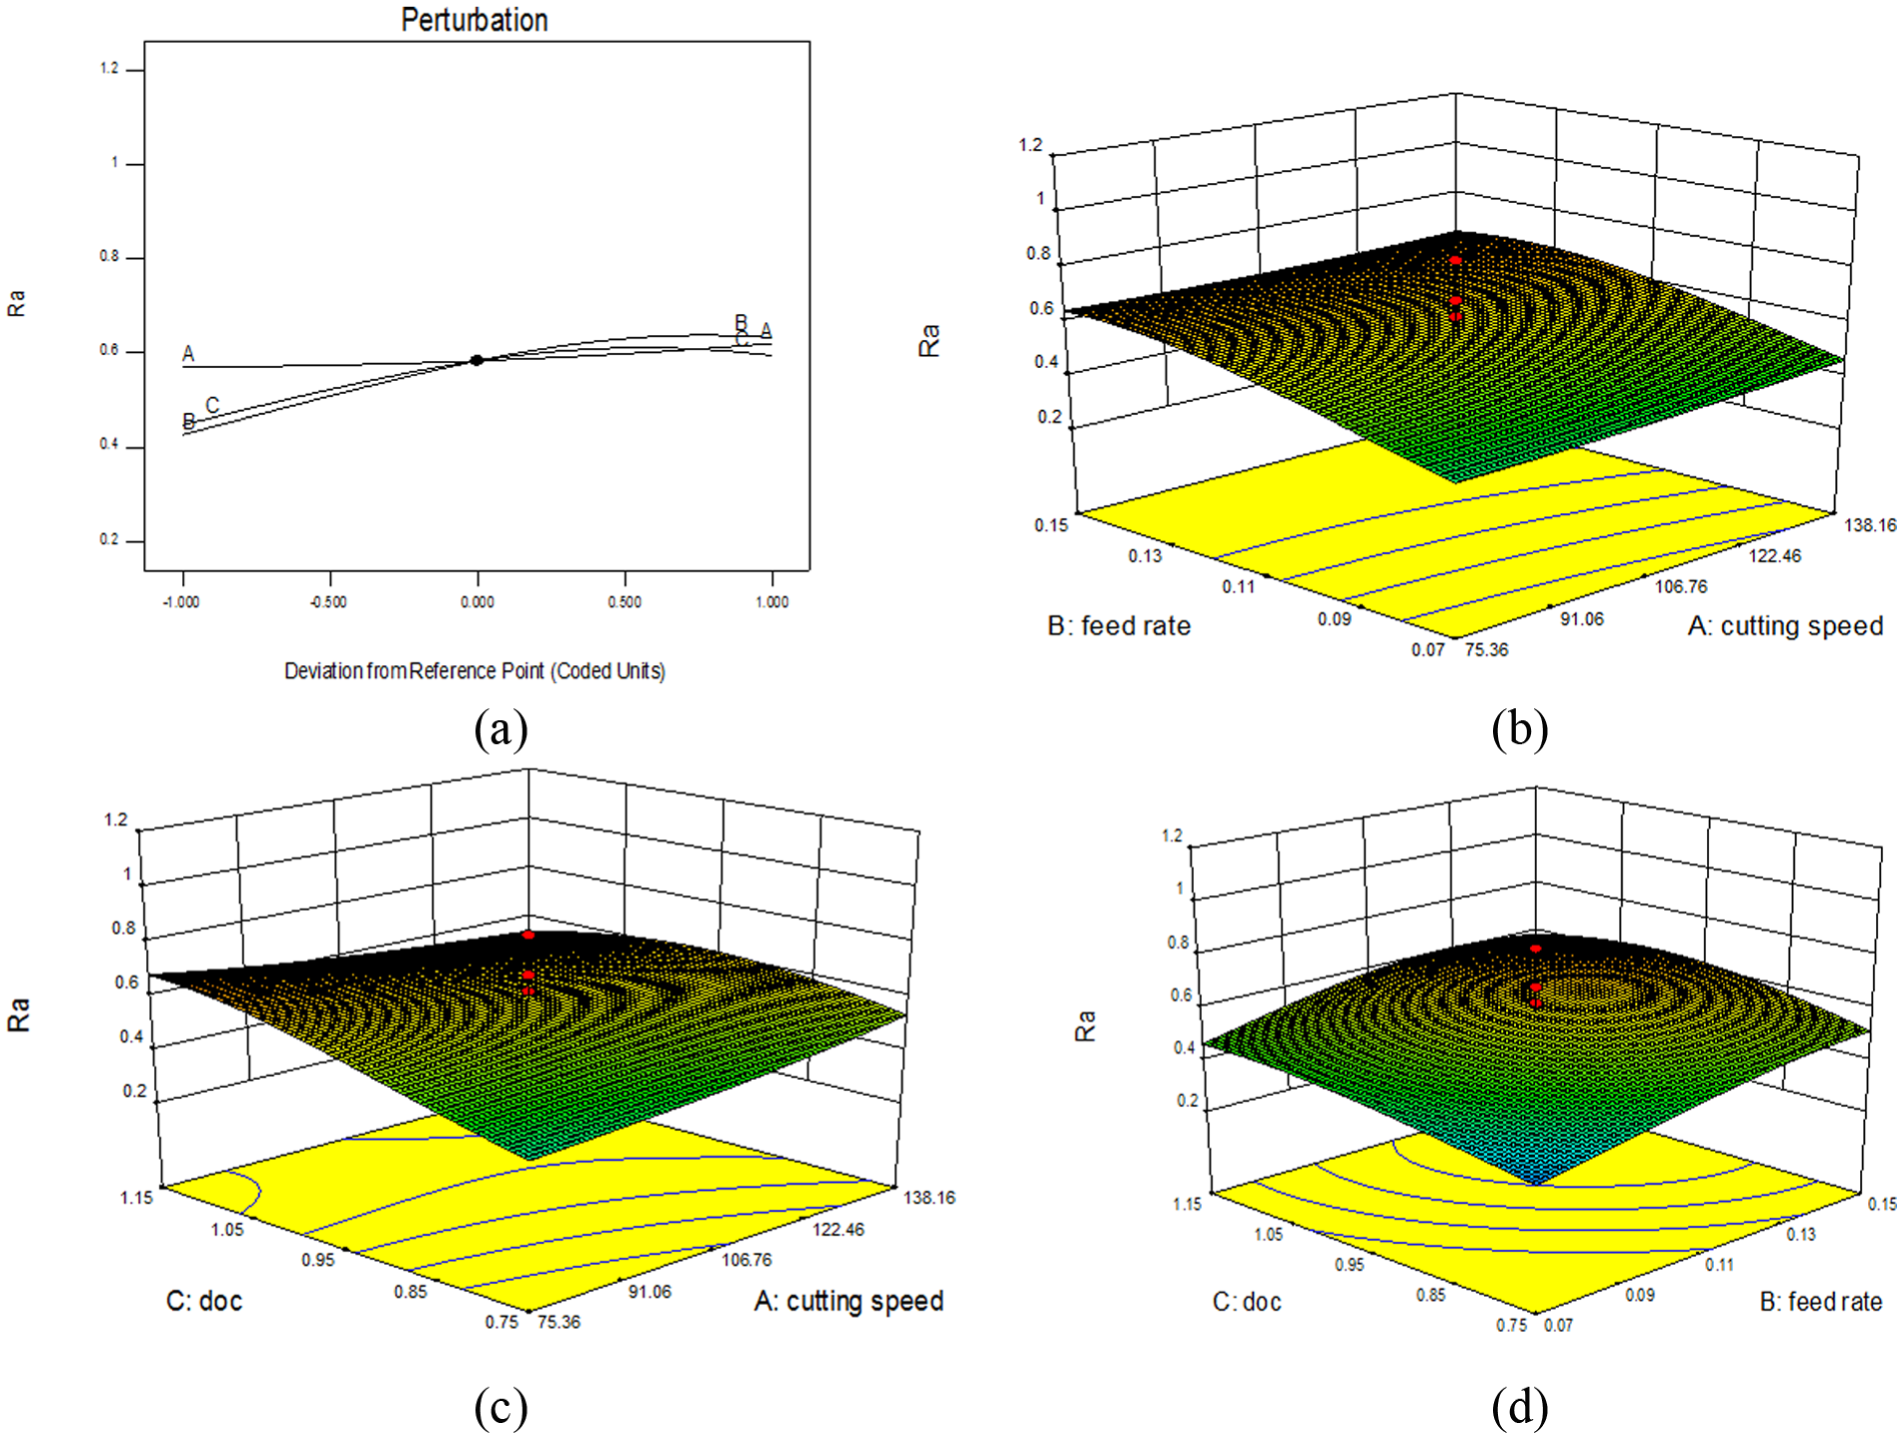
Effect of input factors on Ra in the form of (a) perturbation curve, (b) 3D graph showing effect of s and f, (c) 3D graph showing effect of s and d and (d) 3D graph showing effect of f and d.
Influence of input variables on tool wear (Tw)
Figure 7 shows the effect of cutting speed, feed and depth of cut on tool wear (Tw). First, the perturbation curve in Figure 7(a) clearly indicates the highest positive slope of cutting speed, indicating that increasing cutting speed was the most effective in increasing Tw. The depth of cut was found to be the second most influential parameter, very close to cutting speed in influencing Tw, with feed the least of all. Of the three 3D curves showing two-factor simultaneous response, it is clearly indicative that Tw increases with increase in all the three input parameters. The maximum Tw is visible in Figure 7(c) at maximum cutting speed of 138.16 m/min and depth of cut of 1.15 mm, reaching almost a 275-µm mark for a 660-mm length of cut. The minimum value of Tw is also visible in Figure 7(c) which gives an indication of almost constant Tw value with increasing feed at minimum cutting speed of 75.36 m/min. Figure 7(b) indicates that for constant depth of cut, Tw increases with feed for lower cutting speeds, whereas it decreases with increasing feed rate for higher cutting speeds. Whereas, Figure 7(d) indicates increasing value of Tw with increasing feed, as well as depth of cut, for a given cutting speed. The depth of cut closely followed by the cutting speed is seen as the most influential factor affecting tool wear. The increase in depth of cut results in increased diffusion wear, resulting from increase in contact area between tool and workpiece. Whereas, an increase in cutting speed results in more frequency of rotations leading to larger contact length and higher cutting temperatures, both increasing tool wear. Thus, for minimum Tw value, minimum cutting speeds, minimum depth of cut and a moderate feed rate were suggested.
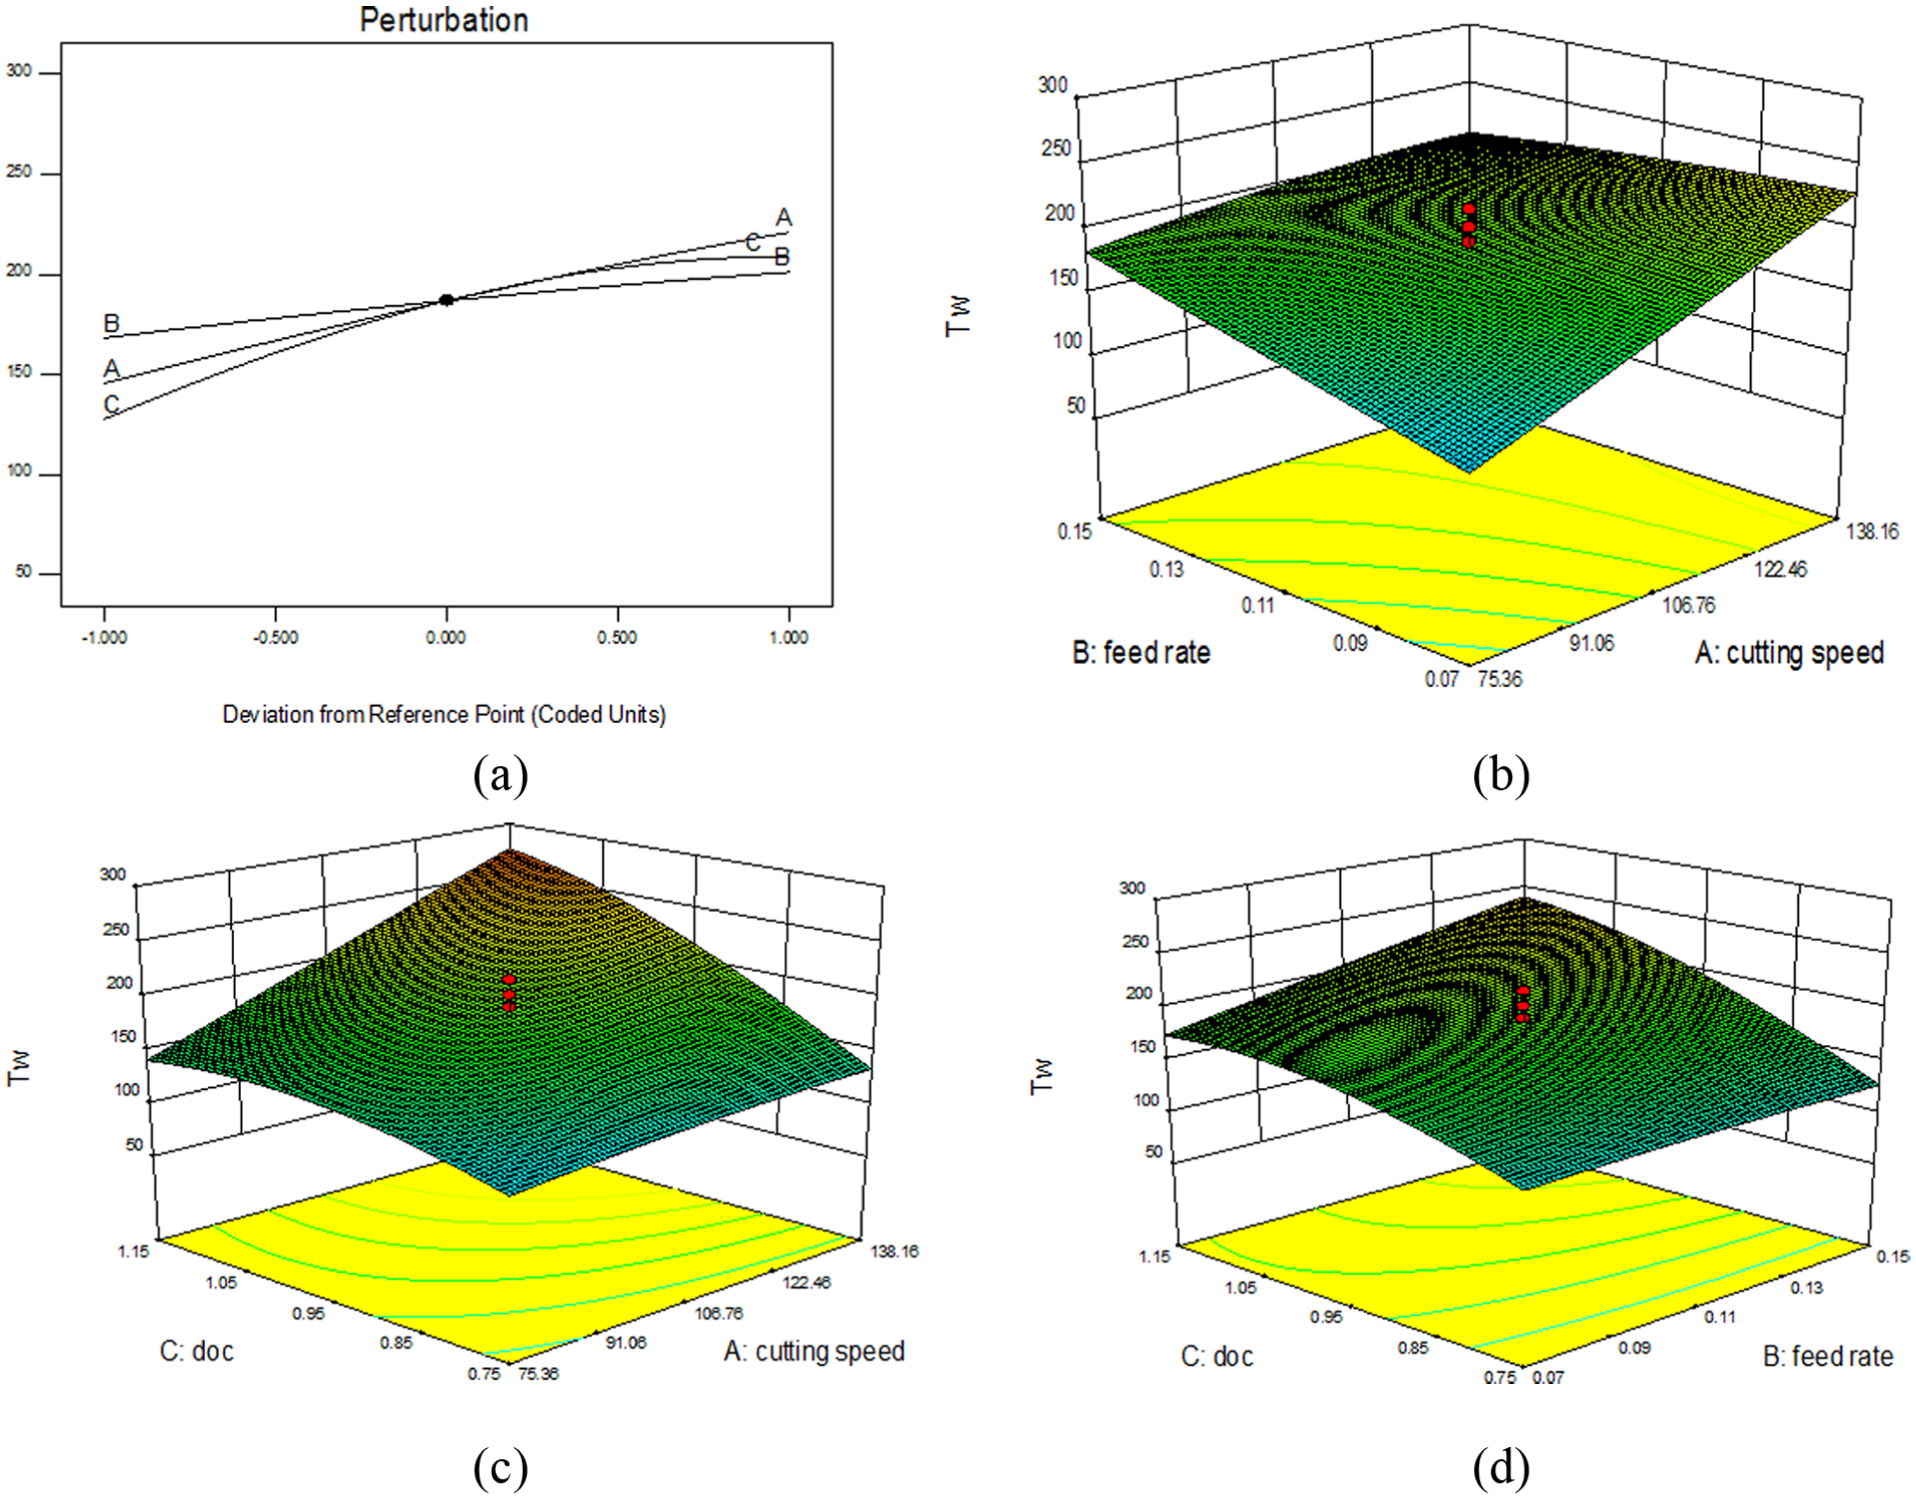
Effect of input factors on Tw in the form of (a) perturbation curve, (b) 3D graph showing effect of s and f, (c) 3D graph showing effect of s and d and (d) 3D graph showing effect of f and d.
Influence of input variables on tool vibration (Tv)
Tool vibration (Tv) during machining can be utilized as a criteria for predicting tool life, resulting from variation in tool signature with changing tool wear and surface roughness values, and is an important parameter for real-time tool condition monitoring. Moreover, it is significant in this case, as the chatter during machining of Ti6Al4V alloy is much pronounced due to its lower elastic modulus compared to steel, resulting in increased tool vibration. Both the reasons encouraged the study of vibration behavior, and thus Tv data was recorded continuously in the direction of feed for each predefined cutting length. The Tv data and its interaction with various input parameters are represented in Figure 8. The perturbation curve, in Figure 8(a), for the Tv indicates almost same slope of B and A but in opposite polarities, with C firstly showing a positive slope and then a negative slope. Thus, it could be formulated that the increase in feed, increases Tv upto a level and then becomes almost constant. The increase in cutting speed results in decrease in Tv value, and the increase in depth of cut first increases Tv upto the mid-level and then tends to decrease it. Here, the 3D graph in Figure 8(b) indicates a minimum value of Tv at highest cutting speed and lowest feed, and maximum vibration of almost 0.7 mm/s2 (averaged value for 110 mm length of cut) was recorded at maximum feed and moderate cutting speed. The curve between cutting speed and depth of cut, in Figure 8(c), indicates an initial increase in Tv with increasing depth of cut upto midpoint, that is, 0.95 mm, keeping the other two parameters constant, and then starts decreasing till the end. The maximum Tv for this graph is visible at the center with both the parameters at mid-level. At maximum cutting speed, the Tv increases continuously with increasing depth of cut for constant feed. The overall maximum Tv is indicated in Figure 8(d) at maximum feed of 0.15 mm/tooth and minimum depth of cut of 0.75 mm and reaches almost a value of 0.8 mm/s2. The overall minimum Tv is collectively visible in Figure 8(b) and (d) and could be interpreted to occur either at maximum cutting speed and minimum feed for constant depth of cut or at minimum feed and minimum depth of cut for constant cutting speed. Thus, minimal feed is clearly the most effective parameter for minimizing tool vibration (Tv).
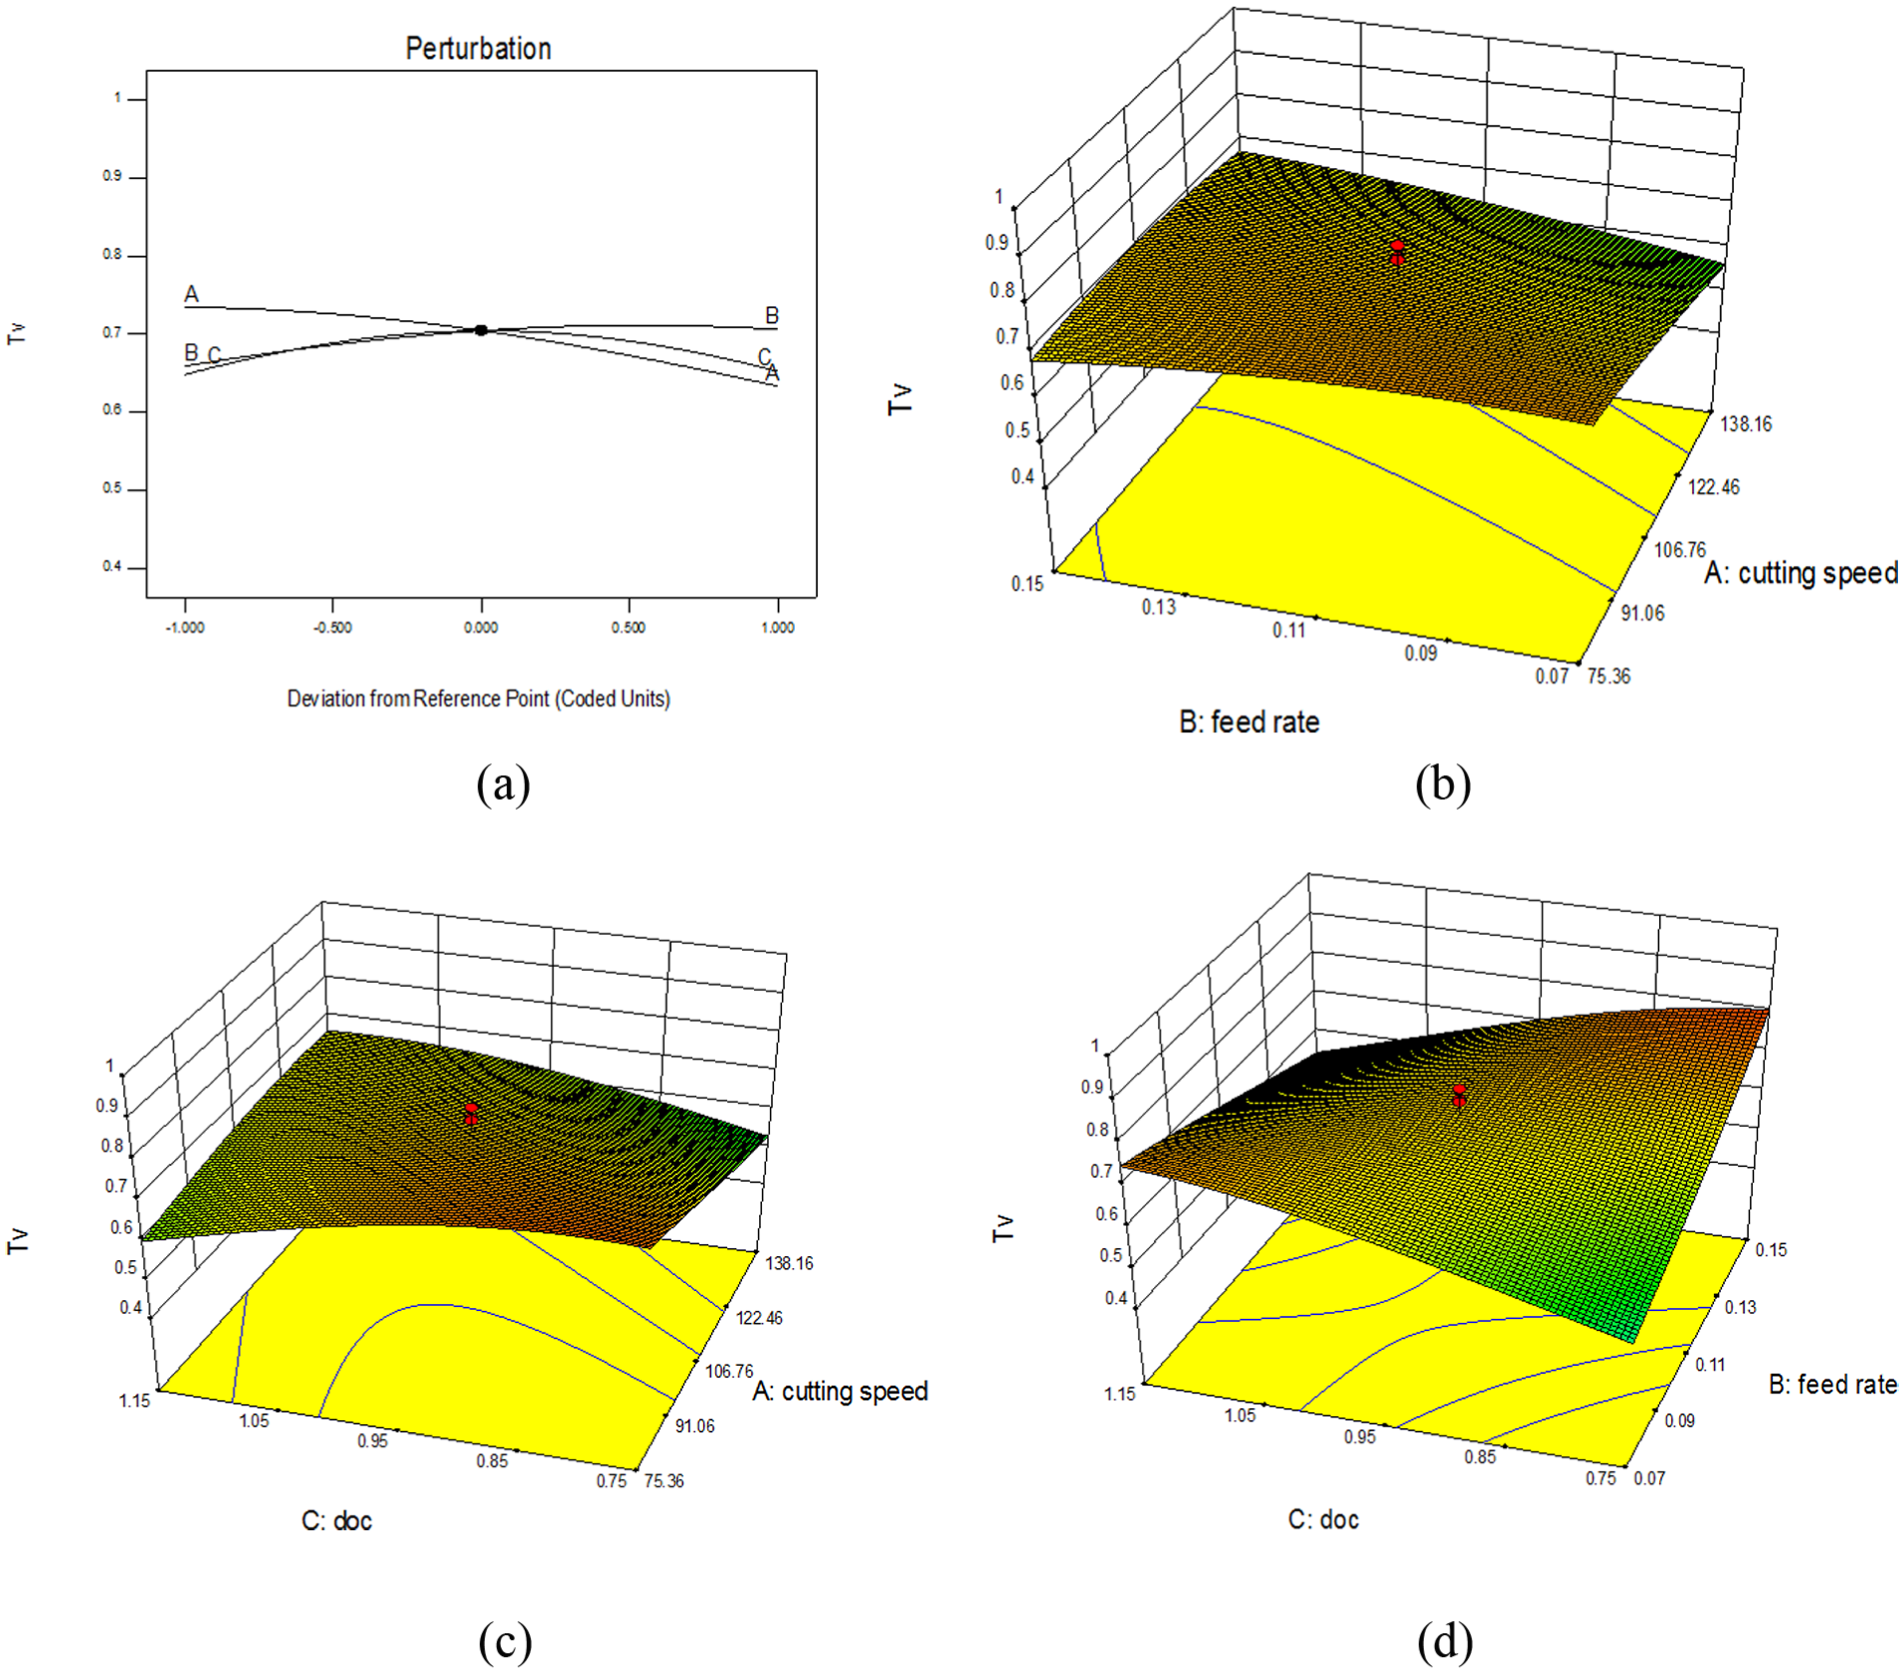
Effect of input factors on Tv in the form of (a) perturbation curve, (b) 3D graph showing effect of s and f, (c) 3D graph showing effect of s and d and (d) 3D graph showing effect of f and d.
Optimal solution generation
The effect of all the input factors on individual responses was modeled which showed feed as the most effective input parameter overall in controlling Ra, as well as Tv, followed by cutting speed influencing Tw and finally, depth of cut being the least effective input parameter. Now, for minimizing Ra, feed and depth of cut need to be kept low with highest cutting speed. For minimum Tw, the cutting speed and depth of cut were suggested to be minimum with a moderate value of feed. Finally, the Tv was seen to be effected by feed the most, and minimum feed and depth of cut with maximum cutting speed were the criteria derived for minimizing Tv. Thus, it was observed that Ra and Tv were having almost same combination of input factors conditions with Tw acting almost in the opposite manner in terms of selecting input factors.
Now, the real-time conditions demand all these machining response parameters to be optimized simultaneously to achieve an overall set of input parameters. Also, the optimal responses need to be achieved at adequate metal removal rate for high productivity. Considering that an optimal solution was developed for minimum Ra, minimum Tw and minimum Tv. For this, varied conditions of input parameters were modeled and tested. The Tw was the most effected when optimal conditions for input parameters were varied, and hence was given the priority for deciding the optimal solution model. The other responses, that is, Ra and Tv, were observed to be marginally effected by varying optimality of input variables. The model which generated an overall highest desirability for all the responses simultaneously was with maximum cutting speed, maximum feed and in-range depth of cut. The model resulted in a substantial increase in tool life with a small compromise in Ra and Tv values when compared with other feasible models. The optimal values thus obtained were 138.16 m/min cutting speed, 0.14 mm/tooth feed and 0.75 mm depth of cut. The ramp model of each factor for interpretation of optimal solution was generated and is shown in Figure 9 with a desirability factor of 0.69.
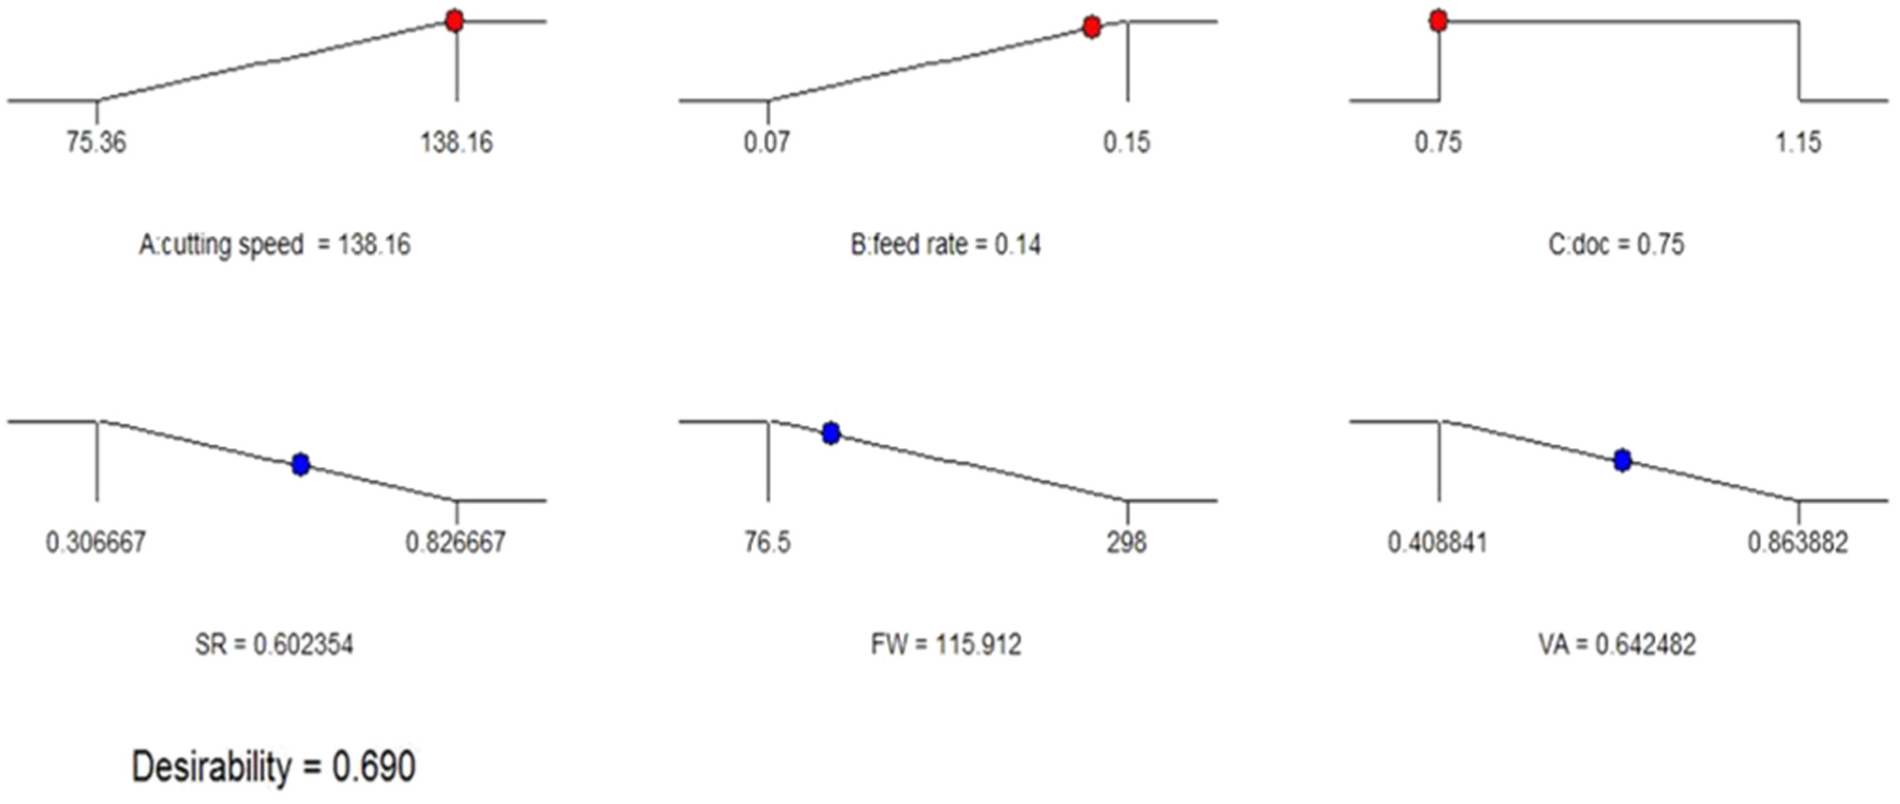
Ramp charts for optimal solution.
Model validation
The set of input factors were computed for the optimal model generation and were experimentally confirmed. Three set of experiments were performed and the overall average value for each response factor was considered. The results were compared with those predicted by the RSM model. The graphical representation of optimal solutions obtained experimentally, compared with predicted responses is shown in Figure 10. The results showed a maximum of 7.9% error in case of Ra. So, an overall confidence level of 92% was achieved.
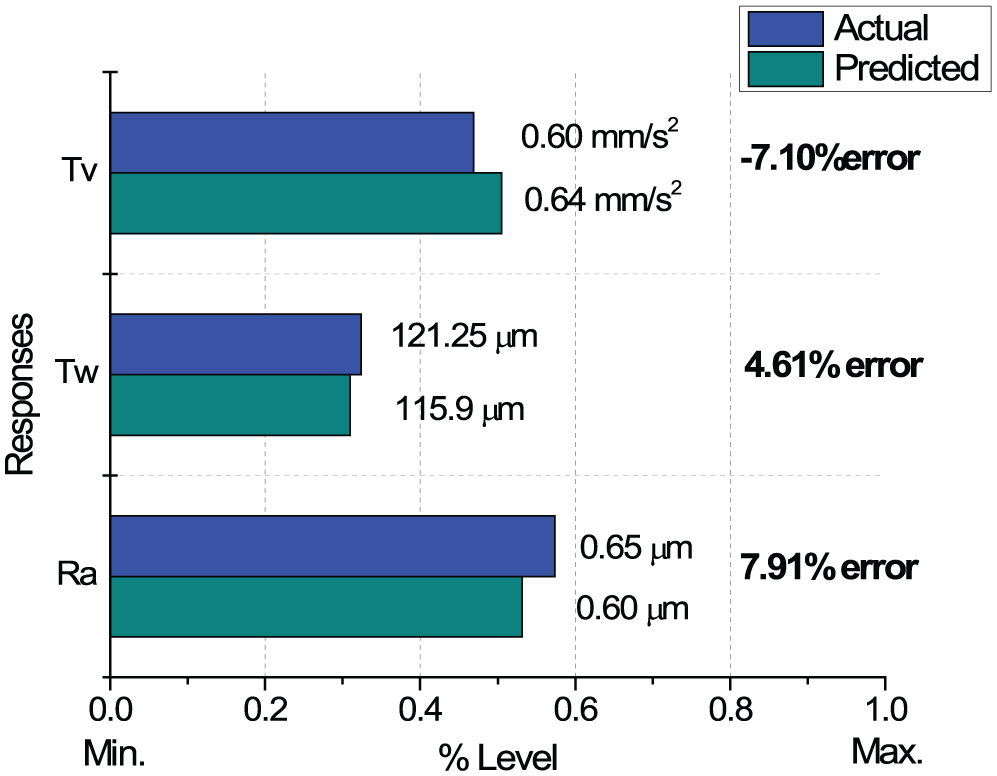
Comparison chart of actual versus predicted responses for optimal conditions.
Conclusion
The use of statistical modeling technique for predicting multi-process factors to estimate the useful cutting life of tool is an effective technique. In this study, RSM as a tool for prediction of multi-response parameters was utilized. The feed was the most influential parameter in controlling the surface finish, as well as tool vibration of machined workpiece, whereas cutting speed affected tool wear the most. The optimal model for minimizing surface finish, tool wear and tool vibration was envisaged, and out of various possible models, the one with maximum tool life, with adequate material removal rate was selected. The responses proposed by the optimal model were at cutting speed of 138.16 m/min, feed of 0.14 mm/tooth and depth of cut of 0.75 mm. Finally, the authenticity of model was confirmed experimentally and a maximum error of 7.91% was obtained, which suggested an acceptable liaison with the predicted model. Thus, the utilization of CCD tool in RSM for process parameter prediction in Ti6Al4V alloy face milling is recommended.
Footnotes
Declaration of conflicting interests
The author(s) declared no potential conflicts of interest with respect to the research, authorship and/or publication of this article.
Funding
The author(s) disclosed receipt of the following financial support for the research, authorship, and/or publication of this article: The authors received financial support from TEQIP-II scheme of AICTE and World Bank, in the conduct of experimentation.