
Abstract
In the present study, high-speed and ultra-high-speed face milling of AISI H13 steel (46–47 HRC) is conducted in order to acquire a thorough understanding of the tool wear evolution process and tool wear mechanisms in high-speed hard milling. According to the variation trend of the tool life with cutting speed, three cutting speed ranges are identified. For different cutting speed ranges, the tool wear evolution process and typical tool wear mechanisms are analyzed and compared. It is found that the cutting speed of 1400 m/min can be considered as a critical value for both the average value of the resultant cutting force and tool life. The analysis of the tool wear mechanisms show that, as the number of cutting speed range increases, on the tool flank face, oxidation wear influences more greatly, while the effect of adhesive wear decreases. In the speed range 1400 m/min < v ≤ 2400 m/min, the abrupt flaking that occurred on the tool rake face was mainly caused by the increase of tool temperature, mechanical impact and thermal impact.
Introduction
The concept of high-speed cutting (HSC) was first proposed by Salomon 1 by means of high-speed milling tests. Better surface quality and higher machining efficiency are expected to be obtained using HSC technology. There have been many valuable researches on surface quality, tool wear characteristics, optimization of cutting condition and finite element modeling in the field of high-speed milling.2–8
High-speed milling has been extensively used in the manufacturing of aluminum aeronautical and automotive components so as to efficiently generate smooth surfaces with high geometric accuracy. With the development of cutting tools and machine tools, HSC technology has been used to manufacture the mold and dies in their hardened state. Hard milling can even be an alternative for the grinding process in some cases. 9 It has advantages, such as reduction of machining costs and elimination of part distortion caused by heat treatment, etc.
At high cutting speeds, the mechanical properties of the cutting tool are weakened by the high cutting temperature. The tool wear increases dramatically, leading to the short tool life and impaired surface integrity. It is of great importance to assess the tool wear evolution process and tool wear mechanisms in high-speed face milling of hardened steel. Valuable information can be provided for enhancing the machining efficiency and surface quality by means of tool wear assessment. Deeper understanding of the tool wear will also be valuable for the reasearchers who endeavor to manufacture tools for high-speed hard milling.
AISI H13 tool steel has great high-temperature strength and wear resistence. It has been widely applied in extrusion, extrusion mandrels, hot forging and pressure die casting. In this work, a block of AISI H13 steel, hardened to 46 to 47 HRC, was used. The influences of cutting speed on tool wear in high- and ultra-high-speed face milling are focused on. For the purpose of having a comprehensive understanding of the effects of cutting speed, cutting speeds ranging from 200 m/min to 2400 m/min are adopted. The variations of tool life and the tool wear evolution process with cutting speed are investigated. The typical wear mechanisms are analyzed and compared for tools tested within different cutting speed ranges.
Literature review
Previous studies on high-speed milling of hardened steels have concentrated mainly on end milling and side milling operations. Some of these previous researches focused on the investigation of surface roughness in end and side milling. Ghani et al. 10 stated that when high cutting speed, low feed rate and low depth of cut were adopted, good surface finish can be obtained in semifinish and finish machining of hardened AISI H13 steel. Vivancos et al. 11 presented a mathematical model for the surface roughness in high-speed ball-end milling of hardened steels using design of experiments. Vivancos et al. 12 conducted a study of the surface roughness obtained in high-speed side milling of hardened die steels. The influences of cutting parameters were studied by means of a 24−1 fractional factorial design of experiments.
Many other studies have concentrated on tool performance and tool wear mechanisms in end milling. High-speed milling of hardened steels was conducted by Fallböhmer et al. 13 to determine the performance of advanced cutters and identify recommended cutting speeds and feed rates. Machining time and surface finish focused on the investigation. Toh 14 investigated and evaluated different cutter path orientations in high-speed finish milling of hardened steel. It was found that employing a vertical downward orientation achieved the longest tool life. But vertical upward orientation was generally preferred in terms of workpiece surface roughness. Aslan 15 studied the performance and wear behavior of different cutting tools in end milling of X210 Cr12 cold-work tool steel (62 HRC). The results showed that cubic boron nitride (CBN) tools exhibited the best cutting performance in terms of both flank wear and surface finish. End milling of AISI D2 tool steel (58 HRC) was conducted by Koshy et al. 16 Analysis of flank wear indicated that chipping, adhesion and attrition were the governing mechanisms responsible for tool wear. The workpiece surface roughness was in the range 1–6 µm Ra for carbide ball-nose end mills. Ghani et al. 17 investigated the wear mechanism of TiN-coated carbide and uncoated cermets tools at various combinations of cutting parameters in end milling of hardened AISI H13 tool steel. Urbanski et al. 18 studied the tool wear, workpiece surface roughness and cutting force in high-speed ball-end milling of hardened AISI H13 hot work steel.
Relatively few researches have been conducted in the field of face milling of hardened steels. Ultra-high-speed face milling experiments for cast iron, AISI 1045 tempered carbon steel and AISI 1045 hardened carbon steel were performed by Liu et al. 19 using different cutting tools, such as polycrystalline cubic boron nitride (PCBN), ceramic, coated carbide and fine-grained carbide. The tool wear types vary with different combinations of workpiece and tool material. It is found that the wear patterns were rake face wear, flank wear, chipping and breakage. The wear mechanisms were mechanical friction, adhesion, diffusion and chemical wear, promoted by cutting forces and high cutting temperature. Siller et al. 20 studied the impact of a special carbide tool design on the process viability in face milling of hardened AISI D3 steel (60 HRC), in terms of surface quality and tool life. Results showed that surface roughness Ra ranging from 0.1 to 0.3 µm can be obtained with an acceptable level of tool life.
It can be concluded that there are many studies10–18 conducted in the field of high-speed end and side milling of hardened steel. These previous researches provided much valuable information about surface integrity, tool performance and tool wear mechanisms. However, scant researches19,20 were conducted for high-speed face milling of hardened steel. In the present study, high-speed face milling of AISI H13 steel (46 to 47 HRC) is conducted to investigate the tool wear evolution process and tool wear mechanisms.
Both cutting forces and tool temperature influence tool wear mechanisms substantially. However, quantitative analysis was not conducted for either of them in the previous researches on tool wear in high-speed face milling of hardened steel. This article presents quantitative analysis of cutting forces and tool temperature in order to enhance the current understanding of the effects of mechanical and thermal loads on tool wear in high-speed face milling of hardened steel.
For the purpose of maintaining competitiveness, increasingly high cutting speed is adopted by industries to machine hardened steel. In the previous studies, high-speed face milling experiments with cutting speeds above 1100 m/min were not performed to investigate the tool wear mechanisms. The highest cutting speed (2400 m/min) adopted in this work is much higher than those in the previous researches. The present study increases the current understanding of tool wear mechanisms at higher cutting speed in high-speed face milling of hardened steel.
Details of experiment and finite element simulation
Experimental procedures
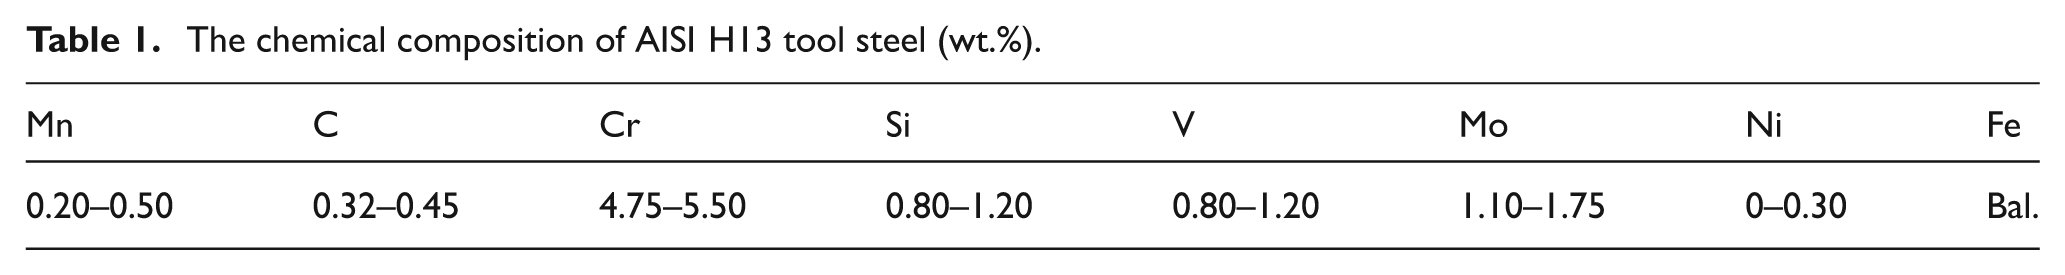
The nominal chemical composition of AISI H13 tool steel is listed in Table 1. The width and length of the block are 75 mm and 100 mm, respectively.
The chemical composition of AISI H13 tool steel (wt.%).
Tungsten carbide inserts SEEX 09T3AFTN-D09 coated with Ti(C, N)–Al2O3 were used. A Seco R220.53-0125-09-8C tool holder, with a tool diameter of 125 mm, axial rake angle of 20°, radial rake angle of −5° and major cutting edge angle of 45°, was applied. Only one of the teeth was used in all the tests so as to avoid the effect of small differences between the teeth and maintain a constant cutting condition. The experiments were performed on a vertical computer numerically controlled (CNC) machining center DAEWOO ACE-V500 with a maximum spindle rotational speed of 10,000 r/min and a 15-kW drive motor. All the tests were carried out in a dry condition.
Symmetric milling was applied. The radial depth of cut ae was fixed as 75 mm. Milling tests with cutting speed v ranging from 200 to 2400 m/min at an interval of 200 m/min were performed. The axial depth of cut ap and feed rate fz were set to be 0.2 mm and 0.04 mm/tooth, respectively.
Each trial was replicated three times. The cutting forces were measured during the first pass of the workpiece surface by means of a Kistler piezoelectric dynamometer (type 9257B) mounted on the machine table as shown in Figure 1. The charge generated at the dynamometer was amplified by a multi-channel charge amplifier (type 5070A). The sampling frequency of data was set to be 7000 Hz. The value of tool flank wear was examined periodically with an optical microscope during the milling process. The tool flank wear was measured three times for each insert and the average value was calculated. Tool life was recorded when the flank wear reached or increased over 0.3 mm. The worn tools were observed using scanning electron microscopy (SEM) (JSM-6510LV, Japan) and energy-dispersive X-ray spectroscopy (EDS).
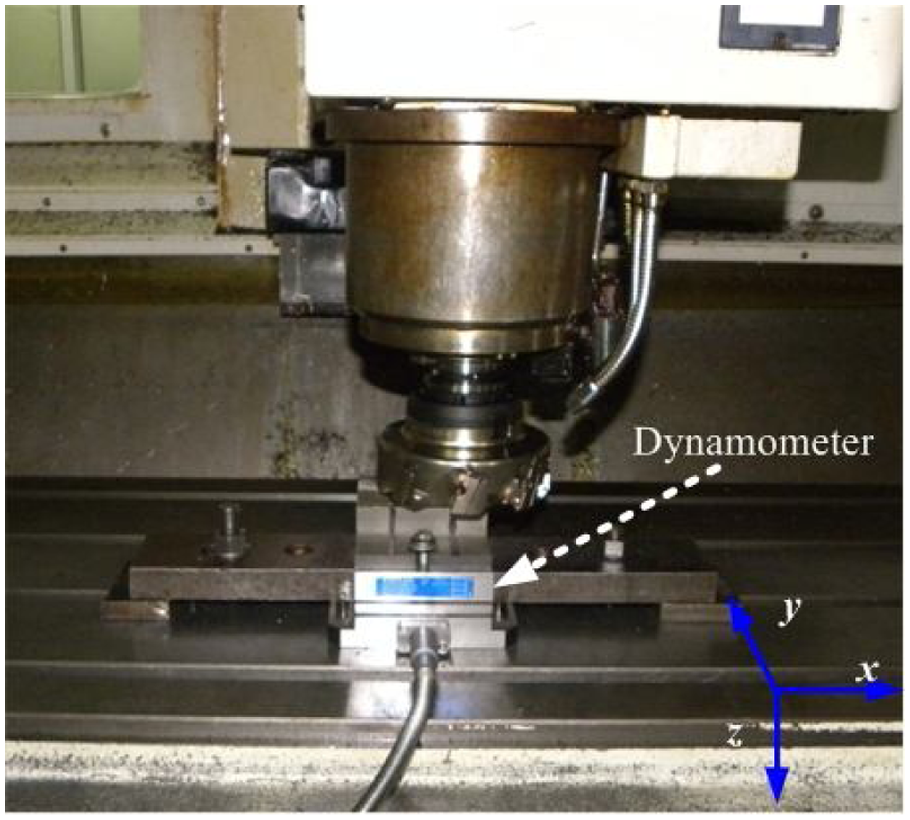
The experimental set-up for face milling test.
Finite element simulation of face milling
Since there are great difficulties in measuring the cutting temperature in the milling process, finite element simulation of face milling was conducted to investigate the evolution of tool temperature. The simulation process was set to be consistent with the actual milling condition.
Lagrangian formulation embedded in the package (Deform 3D) was applied in the modeling of the face milling. Geometries of the workpiece and the single insert cutter are shown in Figure 2. Tetrahedron elements were employed in the meshing of the cutter and the workpiece. Re-meshing technology and local refining technology were used in the workpiece meshing. The boundary conditions were specified to constrain the top surfaces of the tool in vertical directions. The tool rotated at the specified cutting speeds. The workpiece was constrained in vertical and lateral directions on the bottom surface. The initial temperature of the workpiece and cutter was set to be 20 °C. The tool was modeled as a rigid but heat transfer body.
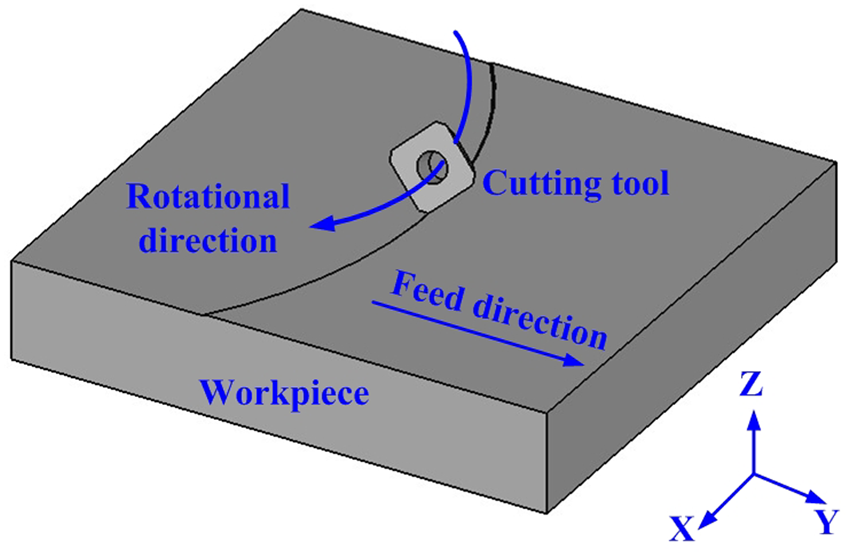
Geometries of the workpiece and the cutter.
Adopting a suitable material-constitutive model for the workpiece is essential for successfully simulating the metal cutting process. The Johnson–Cook model has been used by many researchers to investigate high strain rate and high temperature deformation behavior of steels. The Johnson–Cook constitutive equation was used as
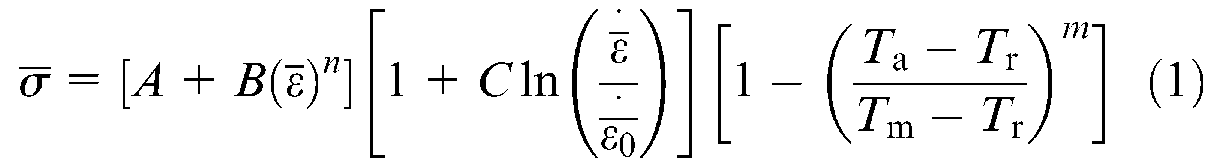
where
Results and discussion
Cutting force and tool temperature
During the first pass of the workpiece surface, the cutting force signal was recorded when the cutter reached the midpoint of the workpiece. For each test, three cutting periods were picked. The average value and maximum value of the resultant cutting force were calculated and represented by Fra and Frm, respectively. In order to describe the mechanical impact, Frim is calculated as Frim = Frm – Fra.
In the cutting period, the development of the highest tool temperature Th is obtained by means of finite element simulation of the face milling. Tha and Thm are used to represent the average value and maximum value of Th, respectively. For the purpose of reflecting the thermal impact, Thim is calculated as Thim = Thm – Tha.
The evolutions of Fra, Frim, Tha and Thim with cutting speed are shown in Figure 3. The dotted lines in Figure 3 show the development of Fra and Frim obtained by means of finite element simulation. It can be found that they are close to the experimental results. This validates the simulation of face milling.
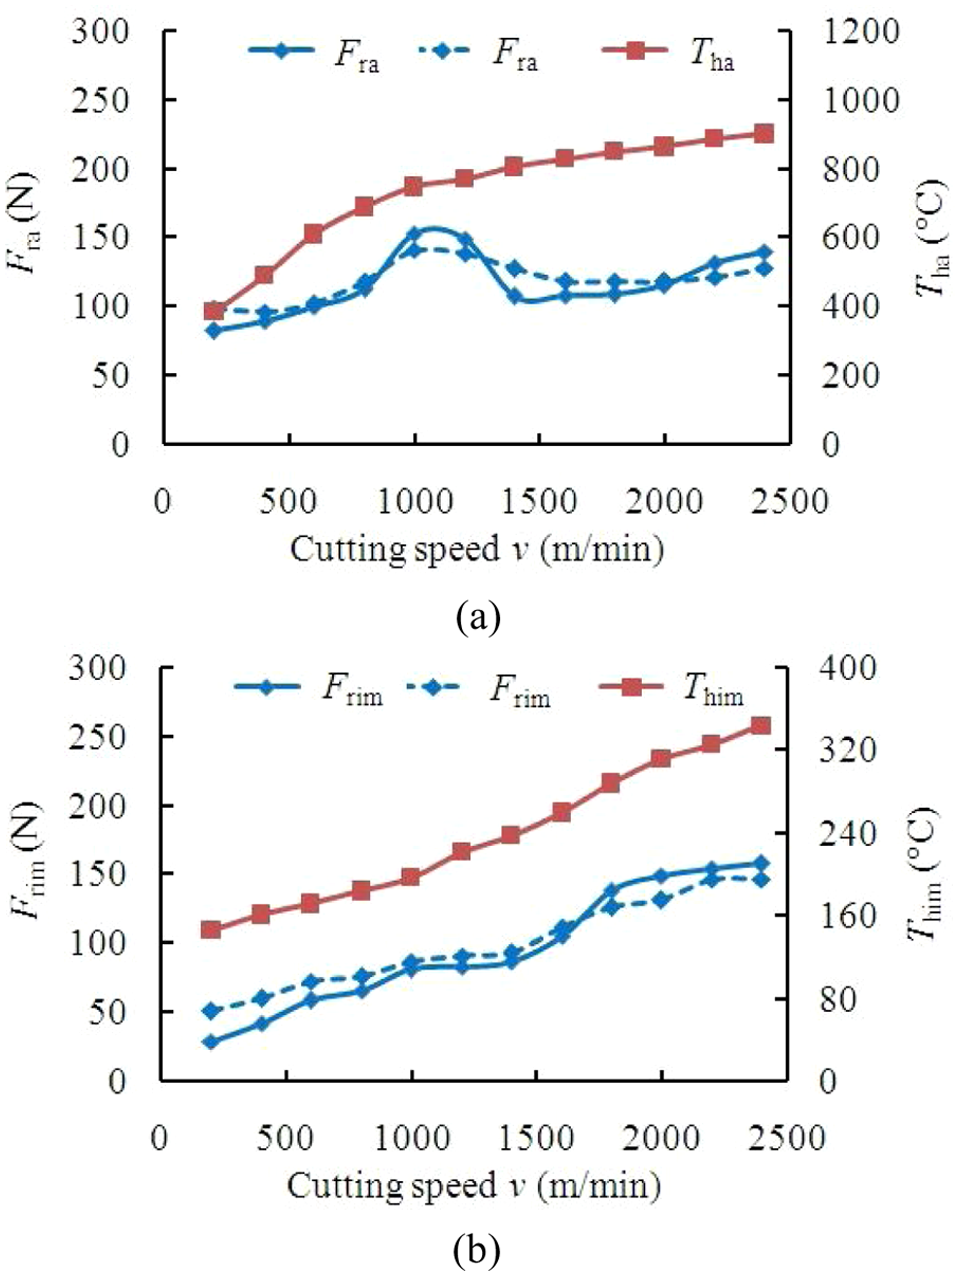
The evolutions of Fra, Frim, Tha and Thim with cutting speed v: (a) the evolutions of Fra and Tha with cutting speed v; (b) the evolutions of Frim and Thim with cutting speed v.
Figure 3 shows that Fra initially increases with increasing cutting speed. When the cutting speed is about 1000 m/min, it begins to decrease. As the cutting speed increases over 1400 m/min, it increases with increasing cutting speed. Frim, Tha and Thim all increase when the cutting speed increases. The increasing trends of them indicate that, when the cutting speed increases, the tool temperature becomes higher and both the mechanical and thermal impact become more severe.
Tool-life and tool-wear evolution
In the present study, the tool life L is represented by the volume of the removed metal (mm3). Figure 4 shows the development of the average value of tool life L and tool wear with cutting speed.
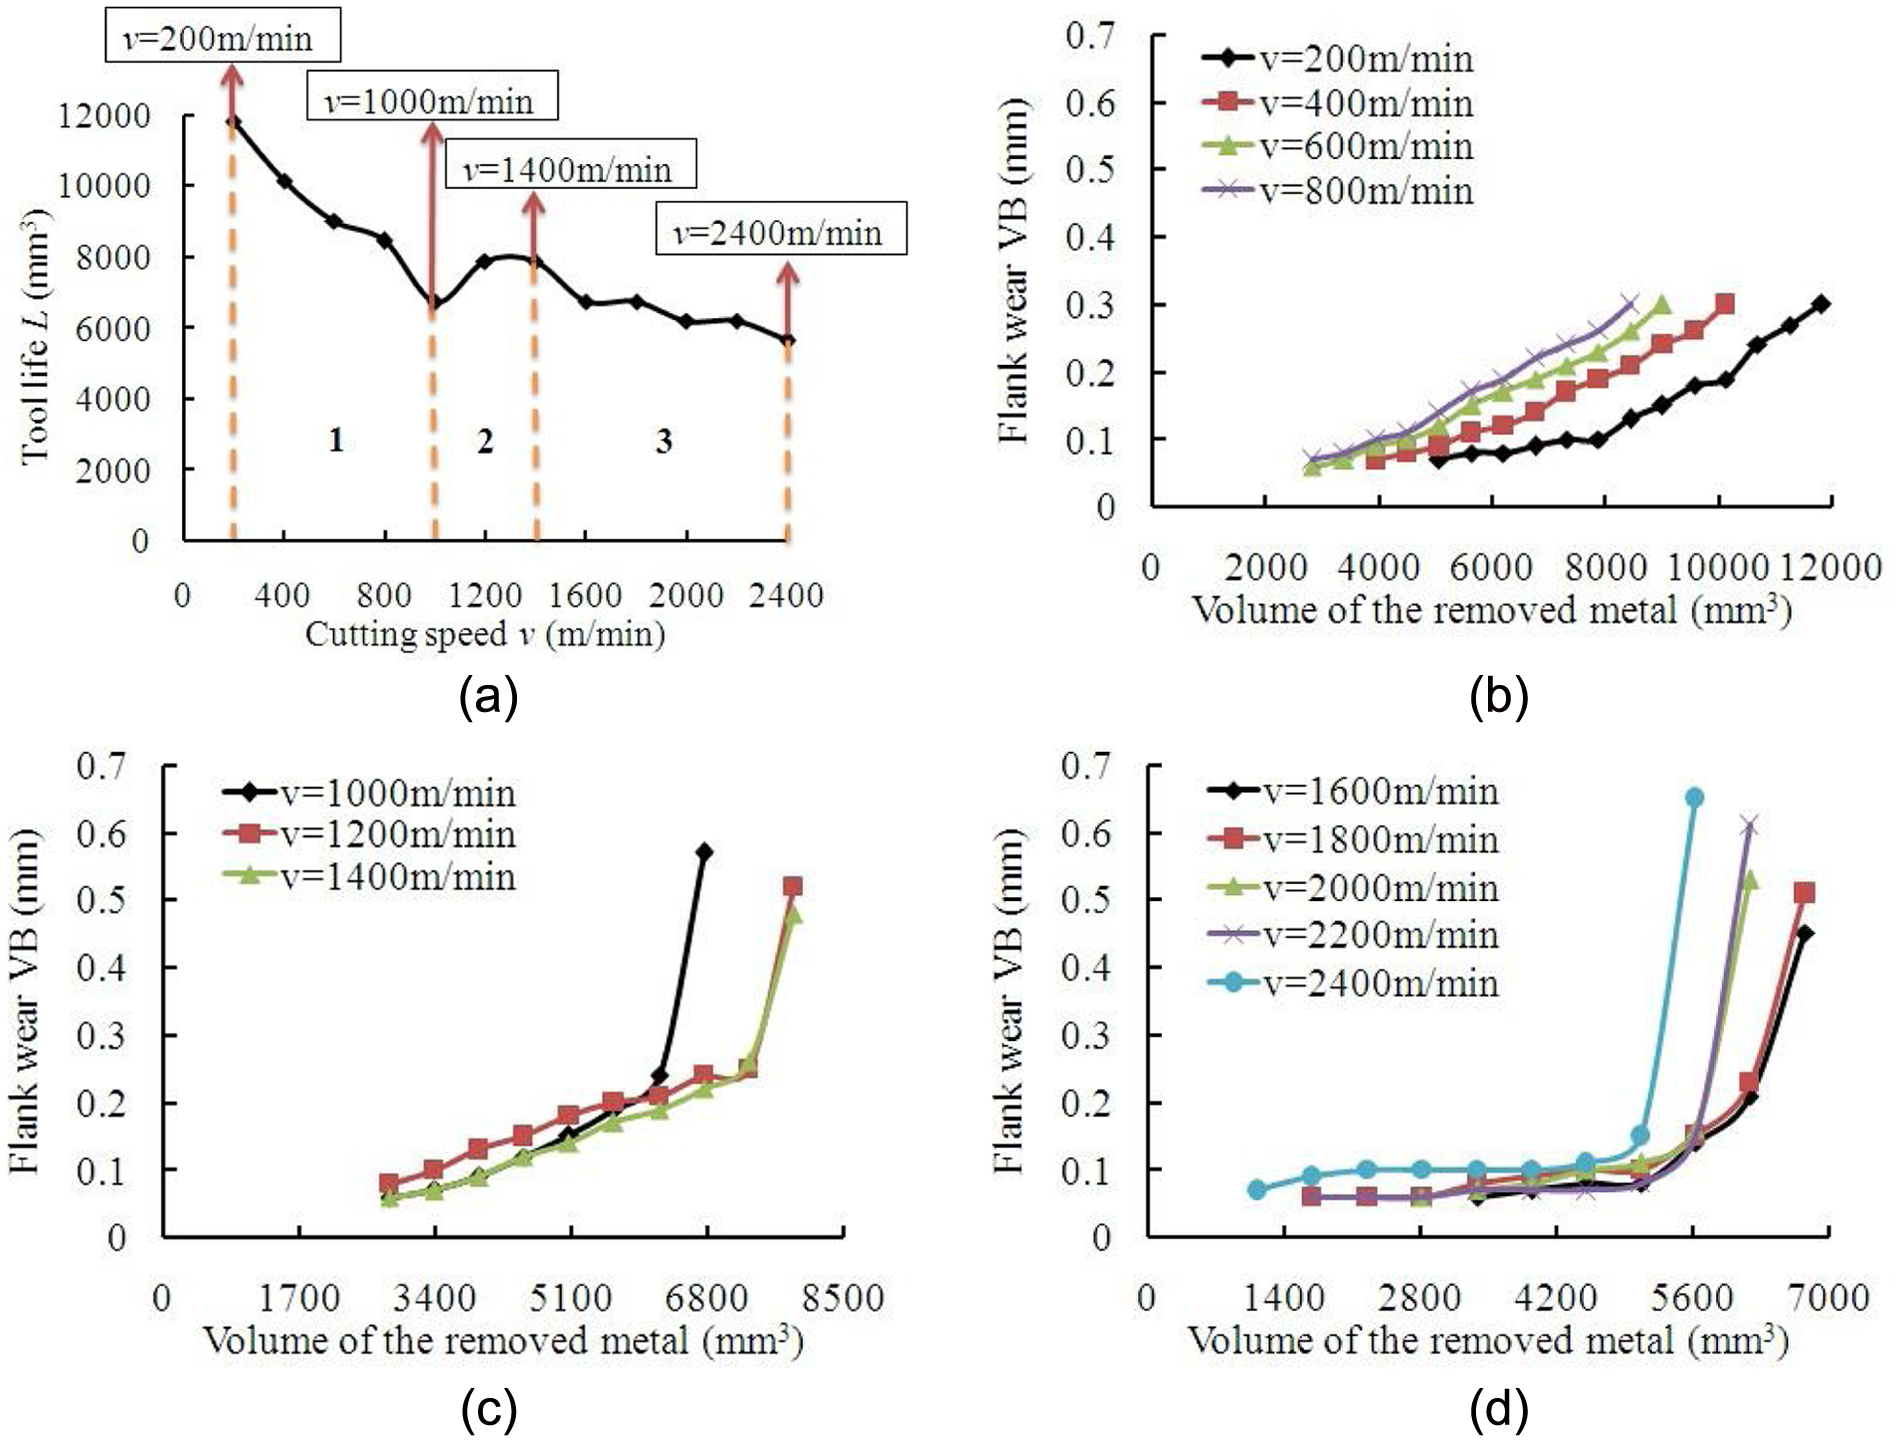
The evolutions of tool life and tool wear with cutting speed v (fz = 0.04 mm/tooth, ap = 0.20 mm): (a) the evolution of tool life L with cutting speed v; (b) the evolution of tool wear in cutting speed range 1 (200 ≤ v < 1000 m/min) ; (c) the evolution of tool wear in cutting speed range 2 (1000 ≤ v ≤ 1400 m/min) ; and (d) the evolution of tool wear in cutting speed range 3 (1400 < v ≤ 2400 m/min).
The assessment of the measurement uncertainty was conducted based on the method introduced in literature. 22 The value of the tool flank wear was examined using an optical microscope with a magnification of ×200. The selected magnification, repeated placement of the cutting tool, the divisions on the optical microscope and the calibration uncertainty will lead to possible errors of the measurement. It is assumed that the measurement errors are independent of each other and the combined standard uncertainty is normally distributed. The expanded uncertainty is obtained as 0.012 mm by means of multiplying the combined standard uncertainty by a coverage factor of 2, giving a confidence of approximately 95%. The evolutions of tool flank wear shown in Figure 4 are used to compare the developing trends of tool wear at different cutting speeds. Since the flank wear at lower levels of removed metal is comparable with measurement uncertainty, the relatively lower values of flank wear should not be considered. The plotted curves of tool flank wear should also provide sufficient information for the analysis of tool wear developing trends. Taking the above discussions into consideration, flank wear below 0.06 mm is not considered in Figure 4. The measurement uncertainty (0.012 mm) accounts for about 20% of 0.06 mm.
It can be seen from Figure 4 that the curve of tool life can be divided into three regions. When the cutting speed is between 200 and 1000 m/min the tool life decreases with increasing cutting speed. As the cutting speed surpasses 1000 m/min, the tool life begins to increase until 1400 m/min. In the speed range of 1400 to 2400 m/min, increasing cutting speed leads to shorter tool life.
The increasing trend of the tool life can be mainly attributed to the decreasing trend of the average value of resultant cutting force, as shown in Figure 3. It seems that the cutting speed of 1400 m/min is a critical value for both the mechanical load and tool life. At this critical cutting speed, a relatively low value of the average resultant cutting force and a relatively long tool life can be obtained at the same time.
In different speed ranges, namely 200 m/min ≤ v < 1000 m/min (speed range 1), 1000 m/min ≤ v ≤ 1400 m/min (speed range 2) and 1400 m/min < v ≤ 2400 m/min (speed range 3), the characteristics of the tool wear evolution process differs greatly, as shown in Figure 4.
It can be seen from Figure 4 that, in speed ranges 2 and 3, the tool wear increases rapidly at the end of tool life, which is different from those of the tools tested in speed range 1. In speed range 1, the wear rate changes little in the whole tool life, though it becomes a little higher when approaching the end of tool life. While in speed range 2, when the tool flank wear is more than 0.2 mm, tool wear increases rapidly. As for speed range 3, the wear rate is relatively small when the tool wear value is below 0.1 mm. However, when 0.1 mm is surpassed, the tool wear rate becomes much higher, and the tools are worn out with a high value of tool wear.
It can be seen from Figure 3 that, although the average value of resultant cutting force has a decreasing trend in speed range 2, these values are still high. Moreover, the higher cutting speed leads to higher tool temperature, and more severe mechanical and thermal impact. When the tools are tested in speed range 3, the loading condition is more fierce than that in range 2, as shown in Figure 3. Under such severe loading conditions, as for flank wear, a vicious circle will probably be obvious at the end of tool life: the more severe tool wear leads to higher cutting force, higher tool temperature, and more severe mechanical impact and thermal impacts, all of which subsequently lead to higher tool wear rate. At the end of tool life, the flank wear value is relatively high and the effects of this vicious circle are greater, explaining the rapid increase of tool wear.
Tool wear mechanisms
Figures 5–7 show the typical morphologies of the worn tools tested within the three cutting- speed ranges, respectively.
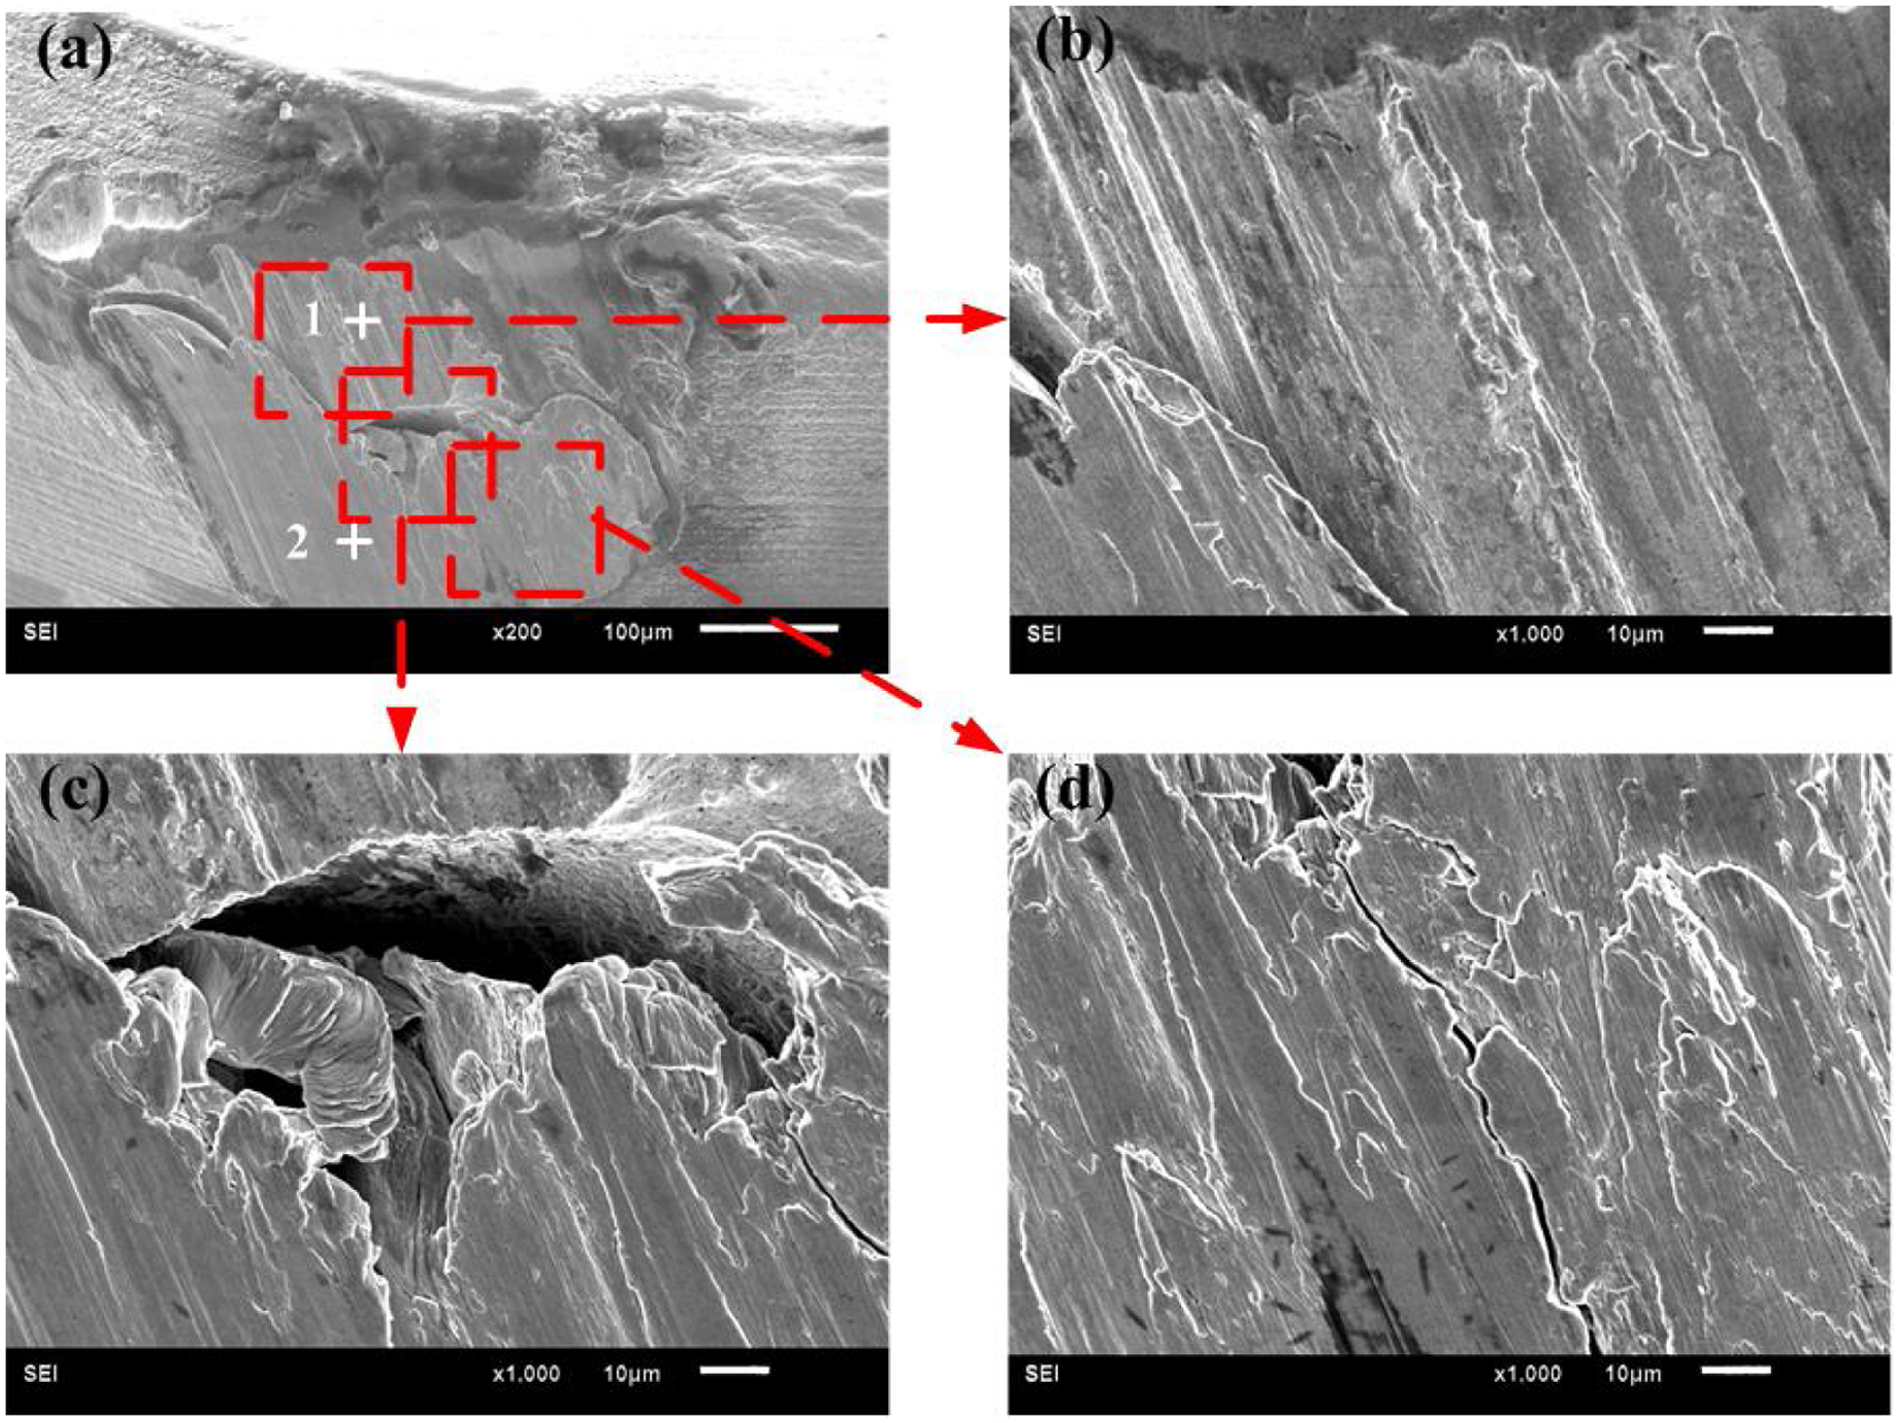
SEM images of the typical worn tool tested in speed range 1 (v = 400 m/min, fz = 0.04 mm/tooth, ap = 0.20 mm).
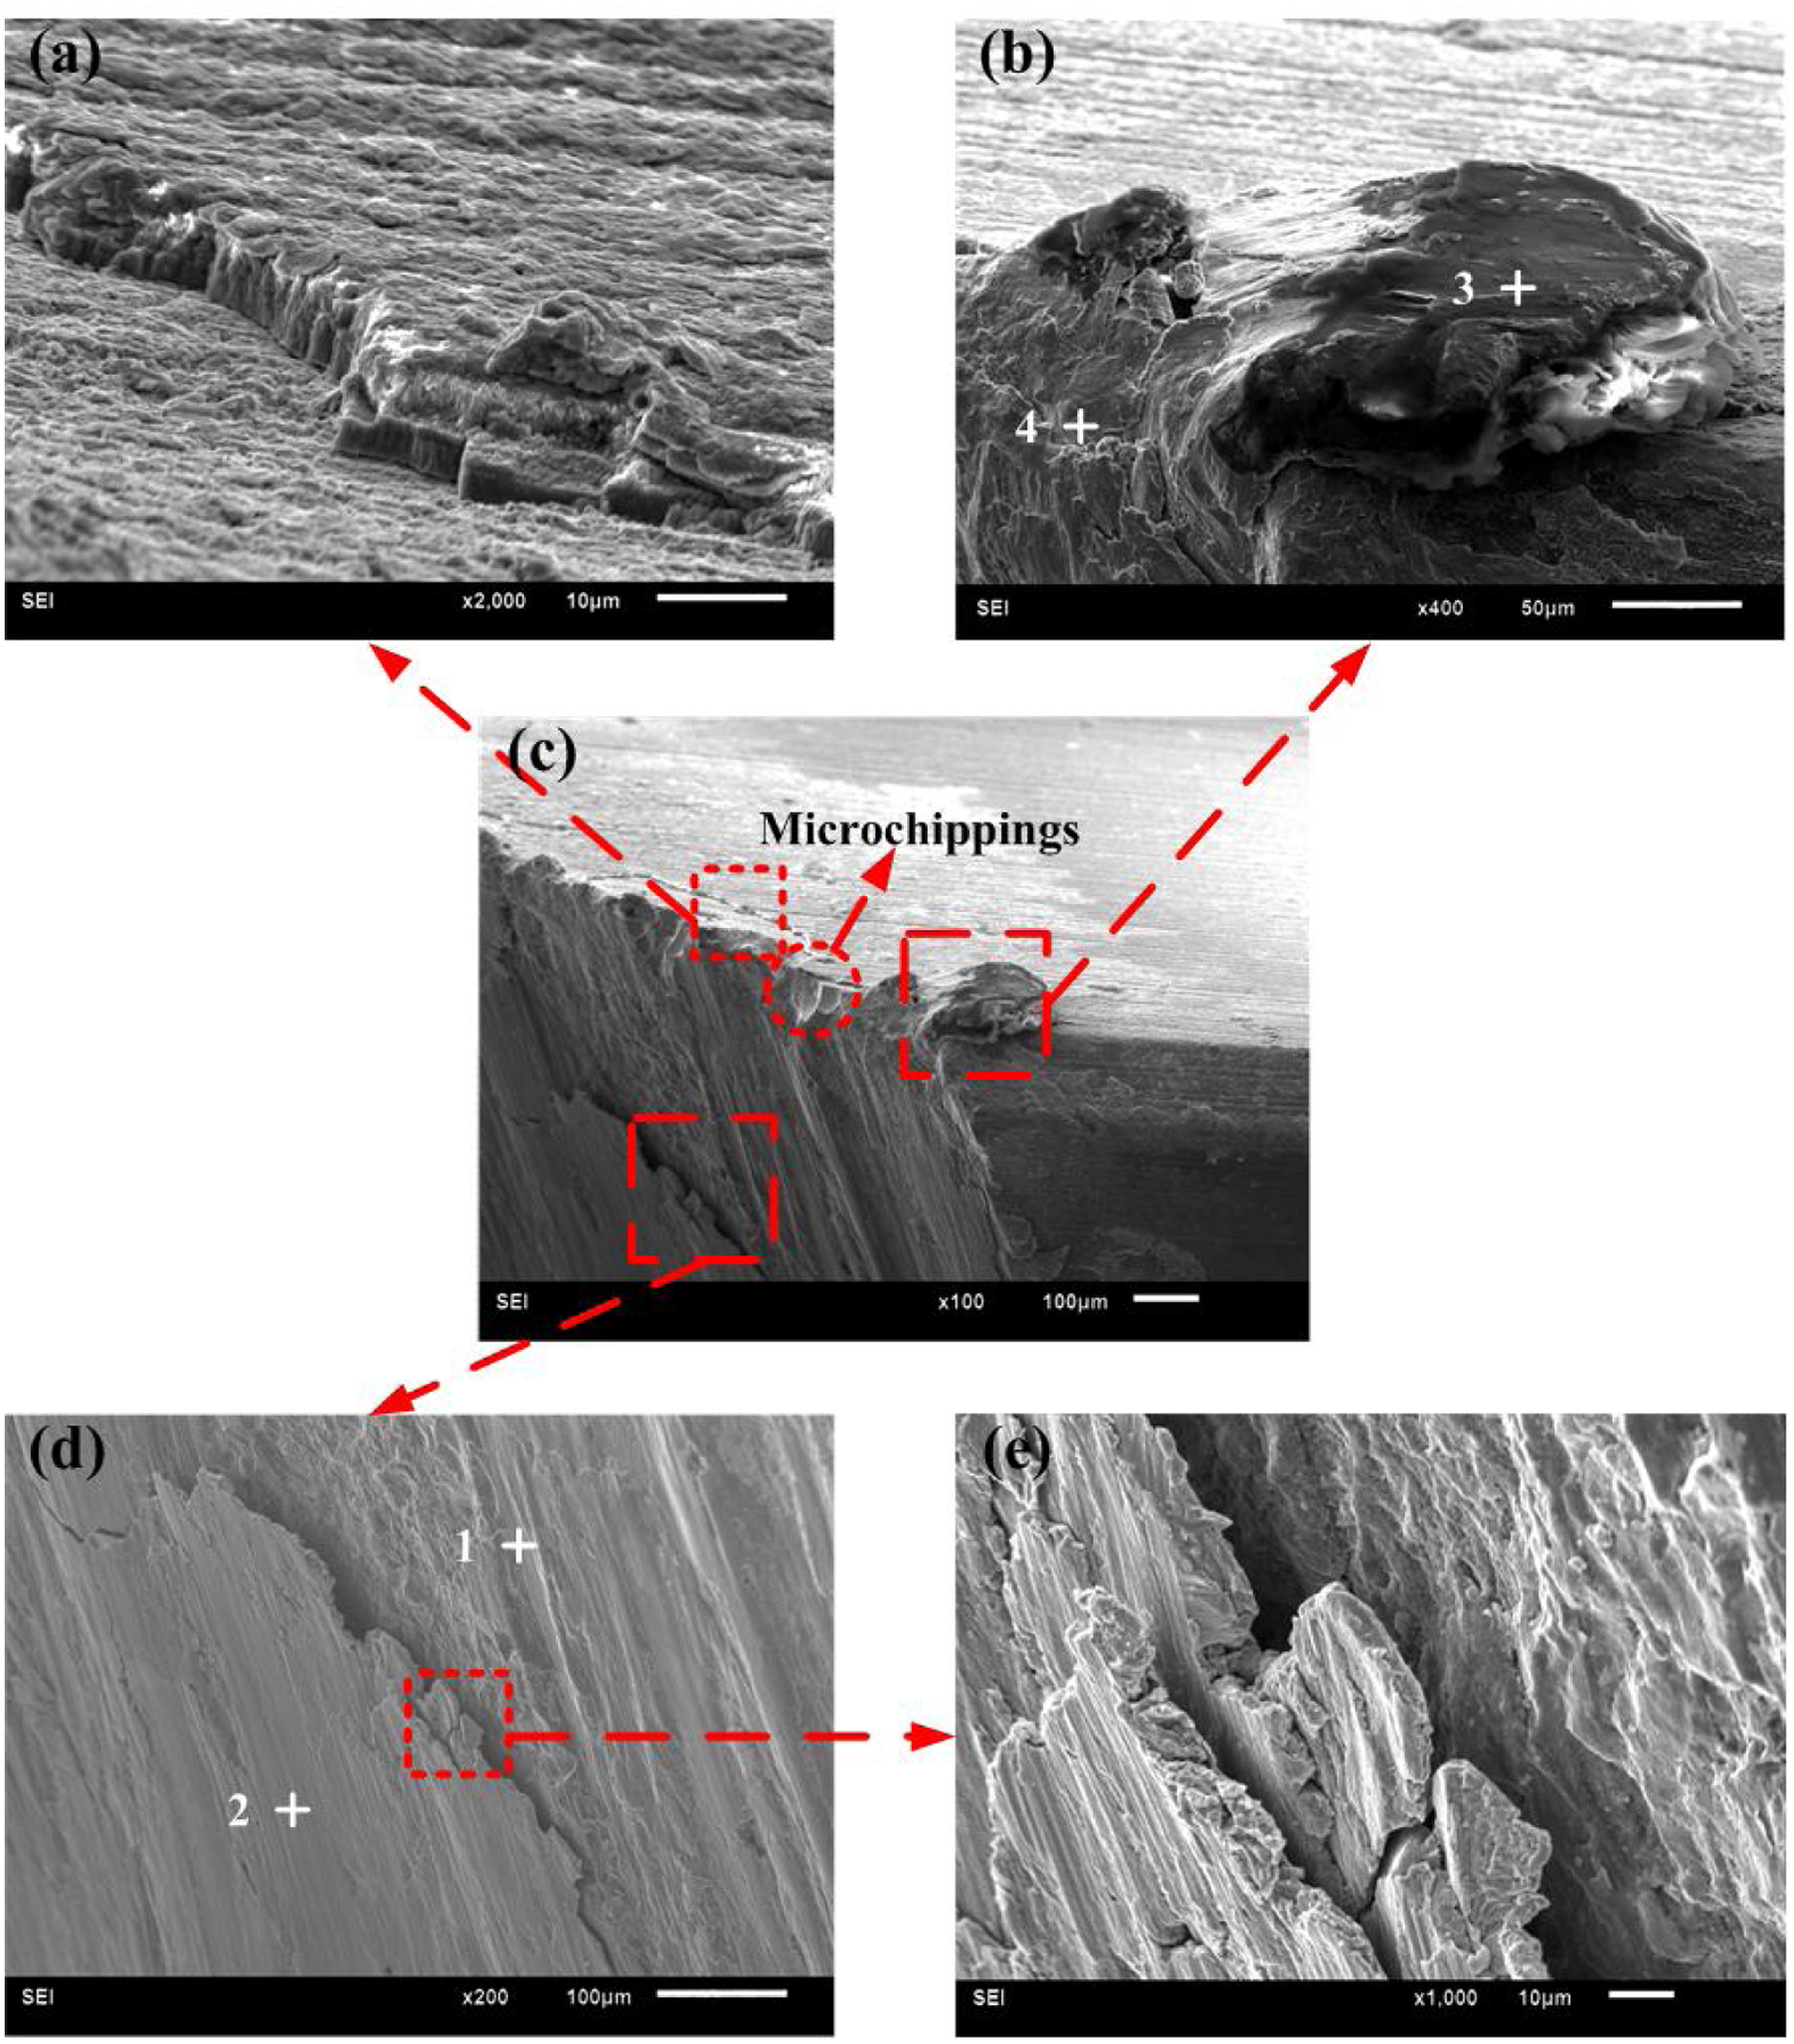
SEM images of the typical worn tool tested in speed range 2 (v = 1000 m/min, fz = 0.04 mm/tooth, ap = 0.20 mm).
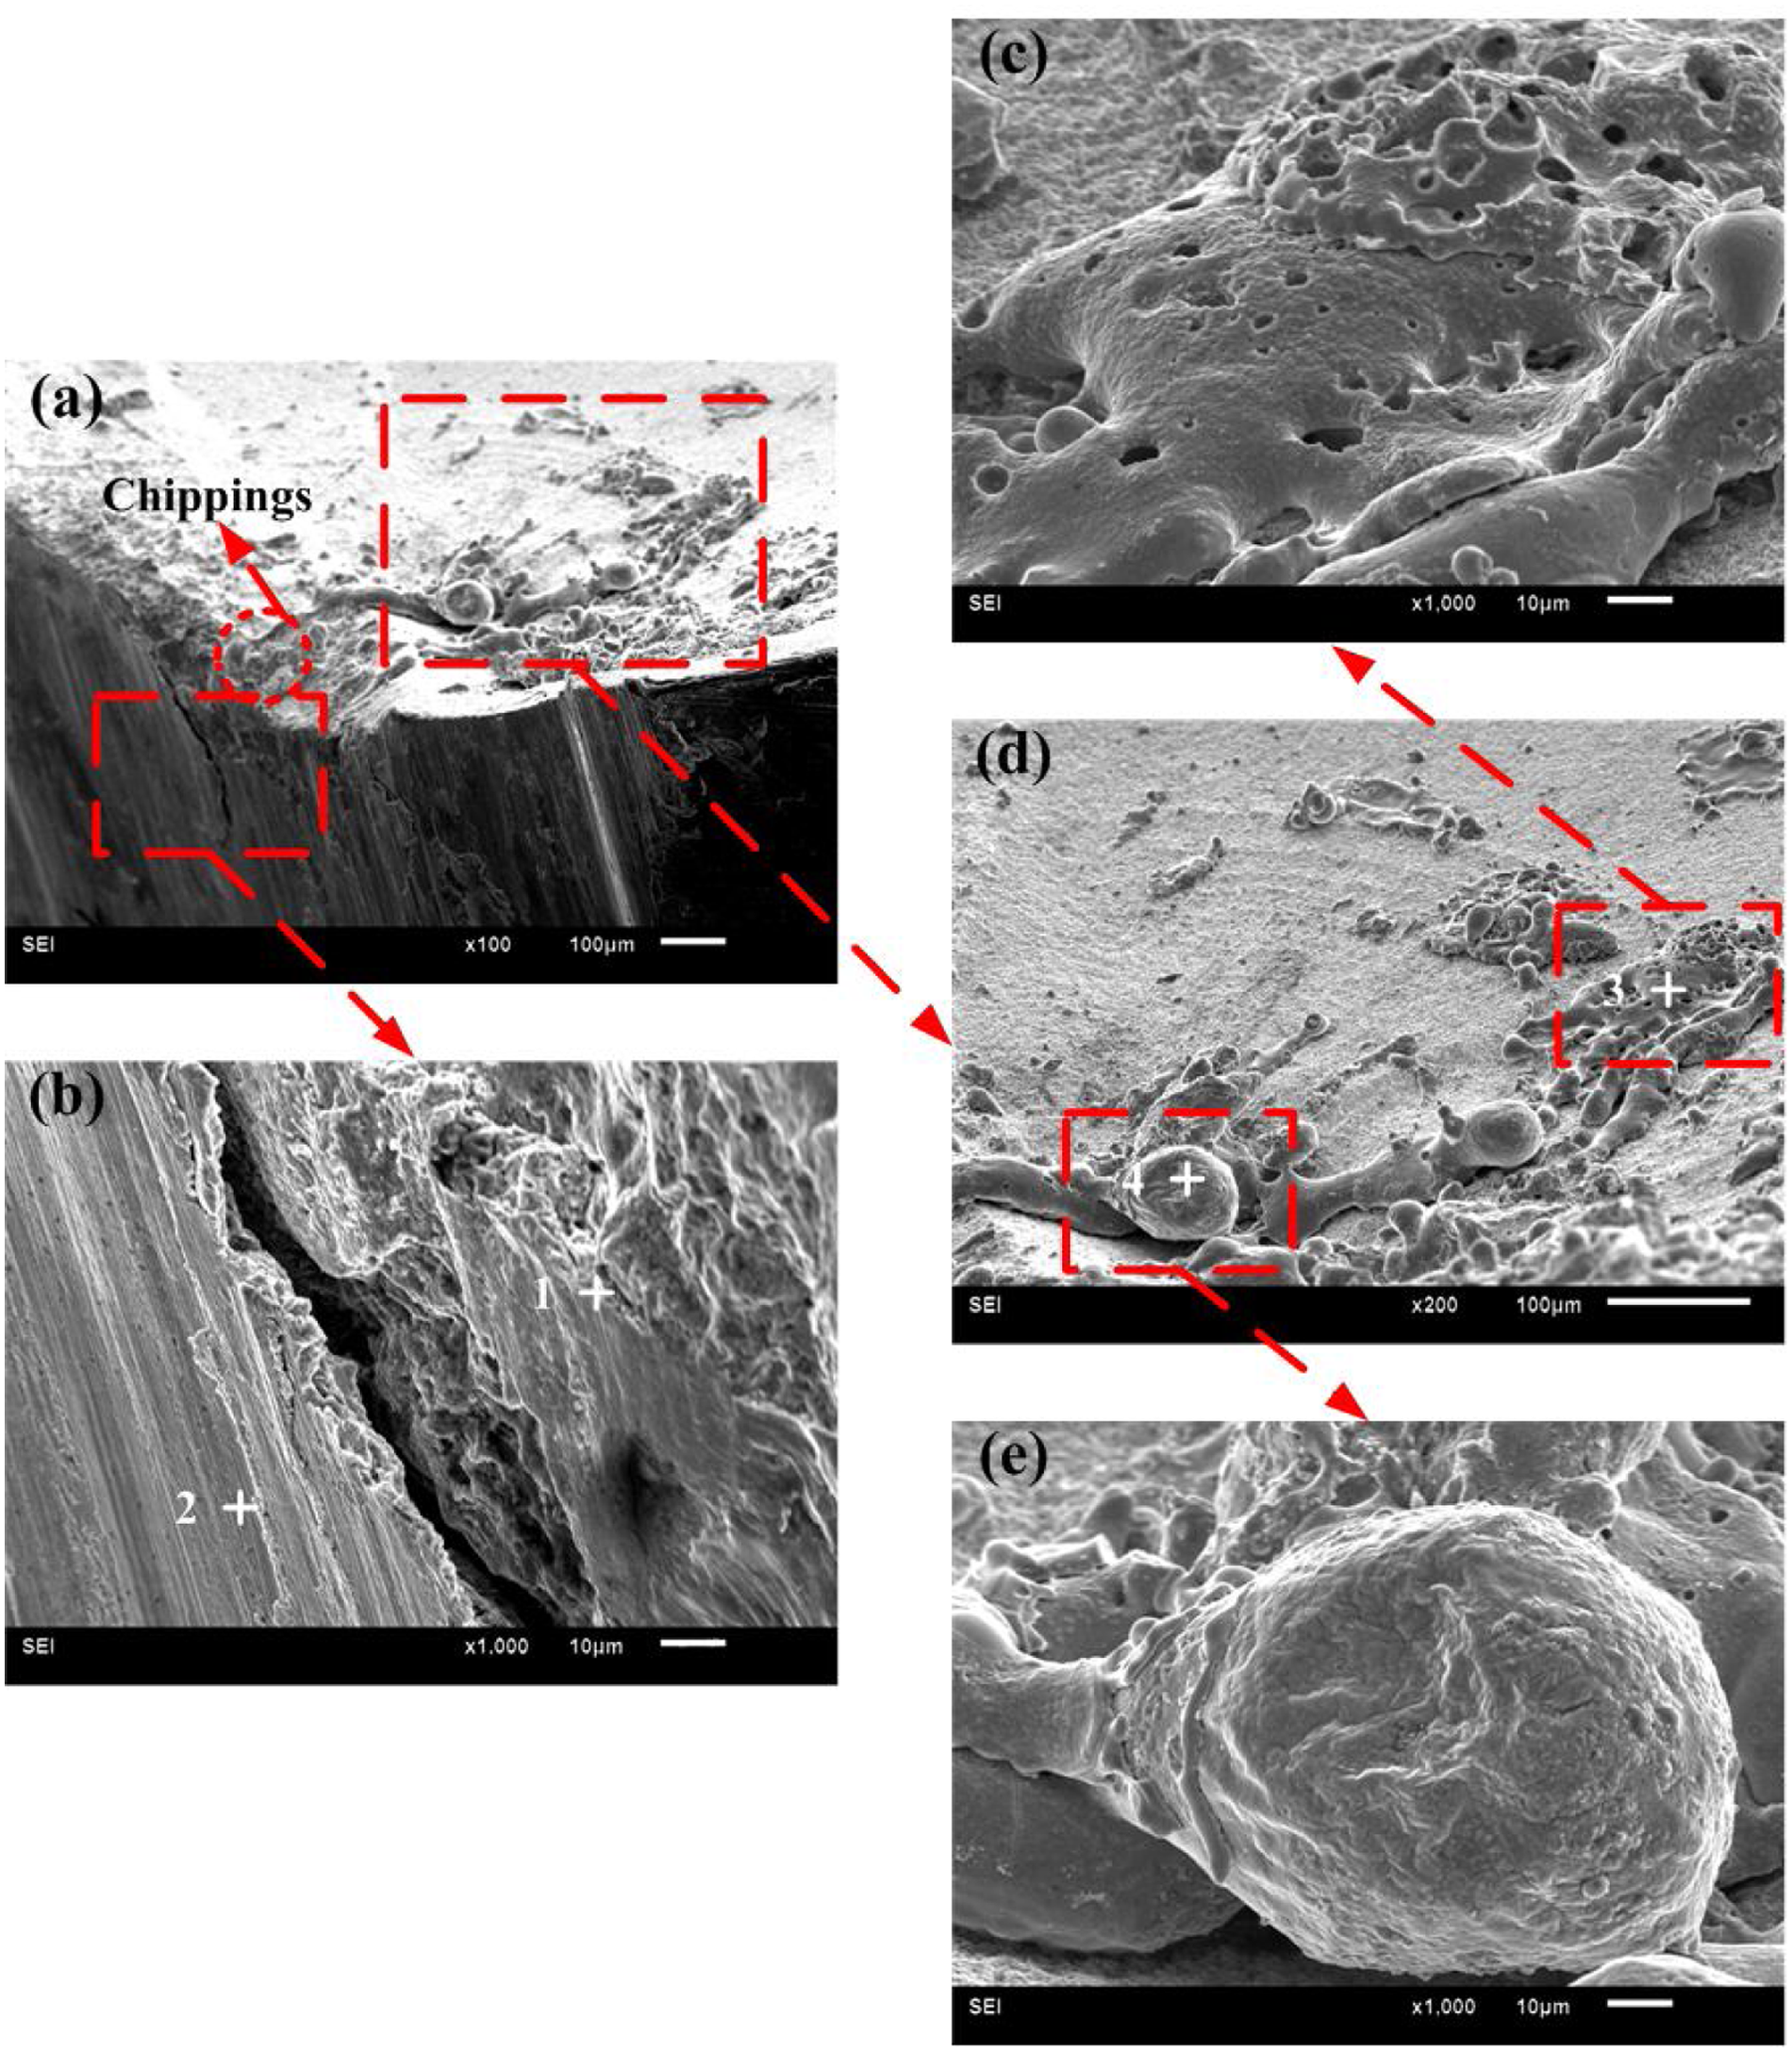
SEM images of the typical worn tool tested in speed range 3 (v = 2200 m/min, fz = 0.04 mm/tooth, ap = 0.20 mm).
The wear patterns of the tools tested within speed range 1 are depth of cut notch wear and flank wear, as shown in Figure 5(a). There is no obvious wear on the rake face. Figure 5 shows that the wear mechanisms of the tool are abrasive wear and adhesive wear, which appear on the flank face of the tool.
For the tools tested in the three cutting speed ranges, the EDS analyses of the regions, similar to where points 1 and 2 are located on the tool flank face in Figure 5(a), are conducted. As for the tools tested in the other two cutting speed ranges (speed ranges 2 and 3), the points located in these regions are also denoted as points 1 and 2, correspondingly as shown in Figures 6(d) and 7(b). It is found that the wear mechanisms of these regions are similar except for the changes of the element content. The evolutions of elements Fe and O in similar regions with cutting speed range number are shown in Figure 8, where region a represents the region where point 1 is located and region b represents the corresponding region for point 2. The contents of the elements (Fe, Cr, V, etc.) from the workpiece change in a similar way with the cutting speed range number. Therefore, element Fe is chosen to investigate the elements from the workpiece. Since each test was replicated three times, EDS analyses of the other tested cutting tools were also conducted. The results show similar trends to that shown in Figure 8, in spite of some value changes.
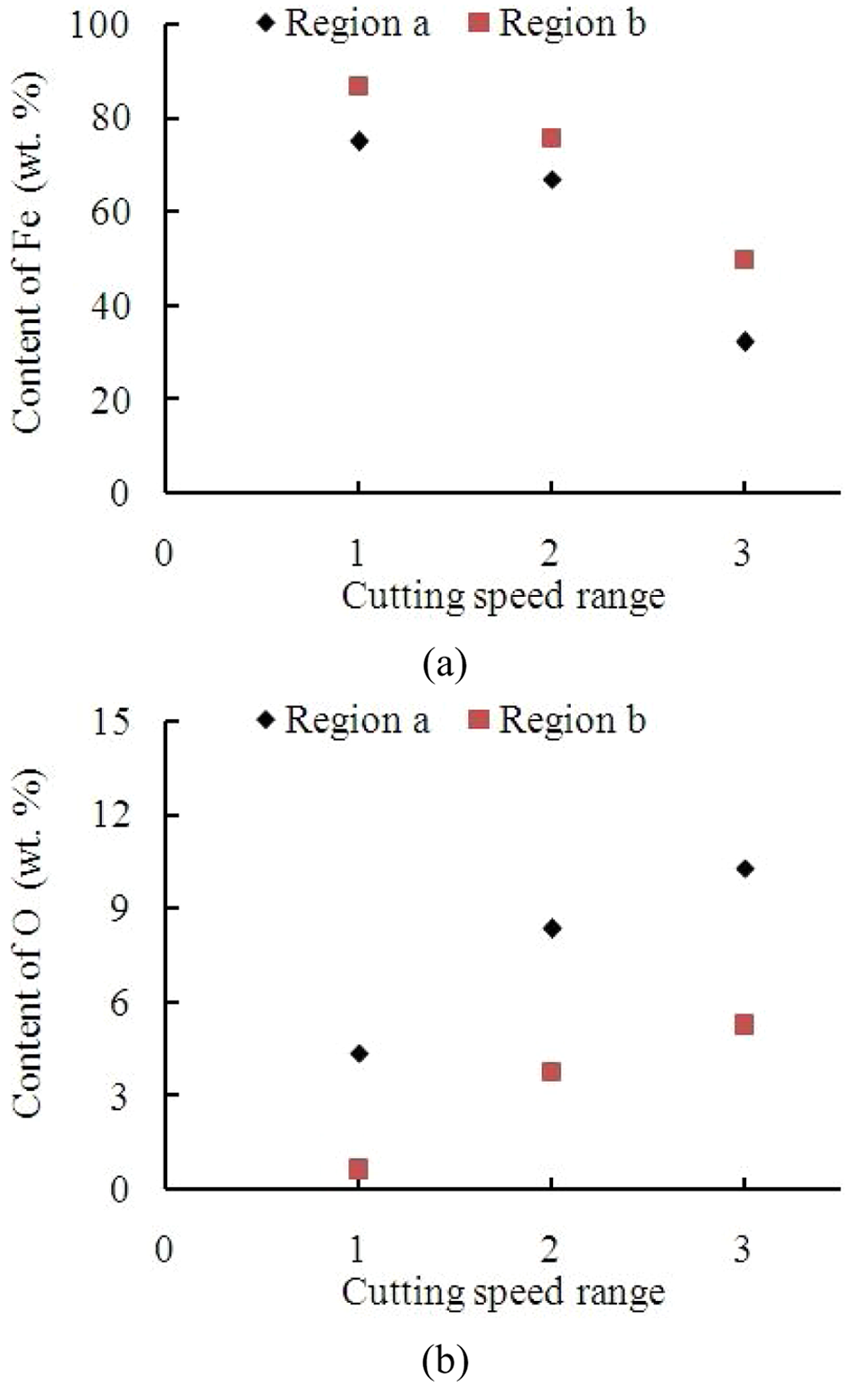
The content of elements. (a) The content of element Fe in regions a and b versus cutting speed range; (b) the content of element O in regions a and b versus cutting speed range.
The EDS analysis of region b reveals elements, such as Fe, Cr, V, etc., from the workpiece and element O. While the EDS analysis of region a shows a lower content of the elements from the workpiece but higher content of element O. In region a, oxidation wear is more serious than that in region b. The higher content of the workpiece in region b indicates that more severe adhesion occurred in that region. It is inferred that the more severe adhesion caused the lateral crack shown in Figures 5(c), 6(d) and 7(b). It can be seen from Figure 8 that, for these regions, as the number of the cutting speed range increases, oxidation wear is influenced more greatly, while the effect of adhesive wear decreases.
Figure 6 shows that the wear mechanisms of the tools tested within speed range 2 are coating delamination, microchipping of the cutting edge, adhesive wear and abrasive wear. As shown in Figure 6(a), obvious coating delamination occurs on the rake face of the cutting tool, which is not encountered in speed range 1. This can be attributed to the more severe thermal and mechanical impact, as shown in Figure 3. The more severe impact could also be the reason why microchippings appear.
The EDS analysis of points 3 and 4, denoted in Figure 6(b), shows that it is the chip that adheres to the cutting edge. The content of element O at points 3 and 4 are 6.14 wt.% and 9.92 wt.%, respectively. The relatively high content of element O indicates that the high cutting temperature induced by high cutting speed accelerated the chemical reaction between the chip and oxygen.
Figure 7 shows the SEM images of the worn tool tested in cutting speed range 3. As for flank wear, the wear mechanisms are similar to that of the tools tested within speed range 2. Adhesive wear, abrasive wear and oxidation wear seem to be the wear mechanisms. However, for the wear mechanisms of the rake face, there are great differences between speed range 2 and 3. In speed range 3, a large flaked region and more severe chippings appear on the rake face and cutting edge, respectively. The average values of the resultant cutting forces measured within speed range 3 are similar to those measured within speed range 2, as shown in Figure 3. Therefore, the flaked region and more severe chippings are mainly caused by the increase of tool temperature, mechanical impact and thermal impact in speed range 3.
Figure 7(c), (d) and (e) shows that liquid-like and sphere-like materials are distributed on the rake face. It can be seen from Figure 7(c) that there are many gas cavities in the region where point 3 is located. The content of oxygen at points 3 and 4 is very large (42.51 wt.% and 20.99 wt.%, respectively). It is inferred that they are the chips that have melted owing to the high cutting temperature. Fierce reaction between the chip and oxygen happened. Taking the melting point of H13 tool steel into consideration, the highest cutting temperature should be more than 1427 °C.
Conclusions
Experiments and finite element simulations were conducted in this article so as to acquire a thorough understanding of tool wear mechanisms in high- and ultra-high-speed face milling of hardened steel, and provide valuable information for the application of high-speed hard milling. The following conclusions can be drawn from the results of this work.
By means of identifying the developing trend of the tool life, the cutting speed was divided into three ranges, namely, 200 m/min ≤ v < 1000 m/min (speed range 1), 1000 m/min ≤ v ≤ 1400 m/min (speed range 2) and 1400 m/min < v ≤ 2400 m/min (speed range 3). At the critical cutting speed of 1400 m/min, both a relatively low average resultant cutting force and a relatively long tool life can be obtained.
In cutting speed ranges 2 and 3, at the end of tool life, a vicious circle was obvious. The more severe tool wear led to higher value of cutting force, tool temperature, mechanical impact and thermal impact, all of which subsequently led to the higher tool wear rate. This explained the rapid increase of tool wear at the end of tool life.
The wear mechanisms of the tool tested in speed range 1 were abrasive wear, adhesive wear and oxidation wear, which occurred on the flank face of the tool. In speed range 2, owing to the more severe mechanical and thermal impact resulting from the higher cutting speed, coating delamination and microchipping happened on the rake face and cutting edge, respectively. As for speed range 3, the wear mechanisms of the flank face were similar to those of tools tested within speed ranges 1 and 2. The abrupt flaking, which occurred on the rake face, was caused by the increase of tool temperature, mechanical impact and thermal impact in speed range 3. When the number of the cutting speed range increased on the tool flank face, oxidation wear influenced more greatly, while the effect of adhesive wear decreased.
Footnotes
Appendix
Funding
This work is supported by the National Basic Research Program of China [2009CB724402]; the National Natural Science Foundation of China [51175310] and the Graduate Independent Innovation Foundation of Shandong University (GIIFSDU) [yzc10119].