
Abstract
A comprehensive numerical model is introduced in this article for estimating the tool wear based on finite element model and inverse heat conduction techniques considering the interactive and direct effects of the experimental factors of recast layer thickness, anode energy fraction and plasma flushing efficiency. The individual and interactive effects of the major thermo-physical and electro-physical parameters have been modeled to improve the introduced tool wear estimation procedure. Comparison of the numerical results with the experimental observations indicated that the developed finite element model and inverse heat conduction process was capable of predicting the tool wear with high accuracy. Additionally, application of analysis of variance technique showed that the introduced mathematical models for estimating anode energy fraction, plasma flushing efficiency and recast layer thickness are statistically significant and adequate which means that the proposed equations can be used for a variety of physical, electrical and thermal variables’ combinations.
Keywords
Introduction
During the electrical discharge machining (EDM), the tool wear not only reduces the dimensional accuracy of the machined features but also raises additional costs through tool wear compensation methods and manufacturing new tool electrodes. At this condition, waste of the time and energy during the EDM process is increased which results in less efficient machining process. In order to reduce the tool wear magnitude and, consequently, its impacts on the process, it is of paramount importance to understand how and to what extent the thermo-physical and electro-physical parameters affect wear phenomenon individually and interactively. The major ones of these parameters include thermal diffusivity and conductivity of the tool electrodes and also pulse on-time and current of the EDM process. The numerical simulation of the tool wear process enables us to determine the interactive and individual impacts of the most significant parameters and gives a method for estimating the tool wear extent before performing experimental tests. Additionally, modeling the tool wear in EDM reduces the cost and time required for obtaining the optimized machining input parameters. However, the thermo-electro-physical nature of the EDM process enhances complexity of the wear mechanism which makes it difficult to introduce a comprehensive model for determining the effects of different factors. Therefore, experimental, semi-experimental and numerical factors are widely applied to correlate the numerical and experimental results which are called the modeling improvement factors. Izquierdo et al. 1 used a factor named equivalent temperature to determine the amount of material which was effectively removed. They concluded that the proposed factor increased the accuracy of modeling. Shabgard et al. 2 correlated the numerical and experimental results of material removal using the factor of plasma flushing efficiency (PFE). They reported that the numerical model covered significantly greater variation in the actual case using the PFE factor. They also concluded in significant dependence of PFE factor and machining input parameters. Kalajahi et al. 3 investigated material removal rate (MRR) with simulating electrical discharge process. They have reported a mathematical model for estimating MRR considering the direct effect of voltage, pulse on-time and current. Dhar et al. 4 presented their works on mathematical modeling of the composites. They considered MRR, tool wear rate (TWR) and radial over cut (ROC) as the responses of their second-order equation models. They have concluded that current has a major effect on the outputs in the electrical discharge process in their experimental and mathematical analyses. Karthikeyan et al. 5 attempted to develop mathematical models for optimizing mathematical models of MRR, TWR and centre line average (CLA) (surface roughness). They selected pulse duration, current and voltage as their work inputs. Current leads MRR, TWR and CLA to be increased with becoming intensified. Yeo et al. 6 applied iteratively adjusted factors as the heat flux coefficient to introduce a numerical model which was close to the actual case. They concluded that the proposed model was capable of estimating molten puddle and material removal from the electrodes.
Recast layer thickness (RLT), anode energy fraction (AF)/cathode energy fraction and PFE are the modeling improvement factors which provide the consideration of recast layer formation, dissipation of thermal energy and fractional elimination of the molten puddle in the numerical models. Considering the improvement factors, finite element (FE) simulation reflects the tool wear phenomenon much more consistent with the experimental conditions. The modeling improvement factors are dependent on different parameters which increase the complexity of their individual and interactive influence on the wear phenomenon. Therefore, understanding the significant effects of the parameters is of paramount importance. The electro-physical parameters including discharge current, pulse on-time and electrical resistivity and thermo-physical parameters including thermal conductivity and diffusivity, specific heat and melting point are the characteristics which must be determined in a way that provides the minimum tool wear condition. Accordingly, individual and interactive effects of the thermo-physical and electro-physical parameters on the wear magnitude must be assessed to obtain the optimal cutting conditions. Singh 7 and Singh and Shukla 8 experimentally and numerically studied the percentage of energy transferred to the workpiece. They concluded that the fraction of energy which was absorbed by the cathode (workpiece) electrode increased with the increase in current and pulse on-time. Newton et al. 9 conducted experimental tests to investigate the effect of the process parameters on the formation of the recast layer in the machining of Inconel 718. They reported that the increase in pulse on-time and current enhanced RLT due to an increase in energy per discharge. Çaydaş and Hasçalik 10 used response surface methodology to introduce mathematical models for the prediction of white layer thickness and tool electrode wear. However, the governing parameters which determine the modeling improvement factors have not yet been investigated in the literature.
In this study, a comprehensive numerical model was developed to estimate the tool wear magnitude considering individual and interactive effects of the thermo-physical and electro-physical parameters. The numerical results are evaluated by experimental and statistical analyses. Analyzing four different thermo-physical characteristics, the experiments were performed at three levels of current and pulse on-time using four tool electrodes including graphite, CuFe2P, copper and A96201, in full-factorial scheme. Furthermore, for having the model enabled to estimate the tool wear before performing experimental tests, the results were analyzed using analysis of variance (ANOVA) technique. Accordingly, there are three nonlinear-polynomial mathematical models developed for improvement factors of RLT, AF and PFE by considering the effects of the thermo-electro-physical parameters.
Experimental procedure
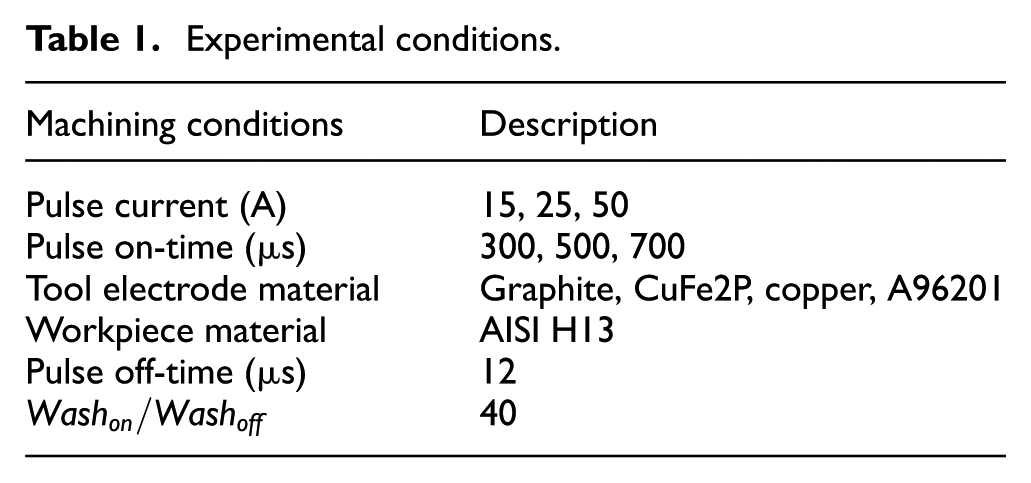
The experiments were carried out using TA-EDM 204H die sinking electro discharge machine with maximum open circuit voltage and current of 250 V and 75 A, respectively. High-strength AISI H13 steel that is commonly used in the molding industry in which manufacturing (EDM) of accurate core shapes by launching the lowest wear ratio of the tool electrodes plays significantly important roles is selected as the workpiece material in the experiments. Considering the need for making complex and accurate shape in this industry, the utilization of EDM is inevitable. Three levels of pulse current and pulse duration along with four levels of the tool electrode materials are applied as the machining input parameters in full-factorial design to investigate the effect of the thermo-physical and electro-physical properties on the tool wear. The machining conditions and levels of the input parameters are detailed in Table 1.
Experimental conditions.
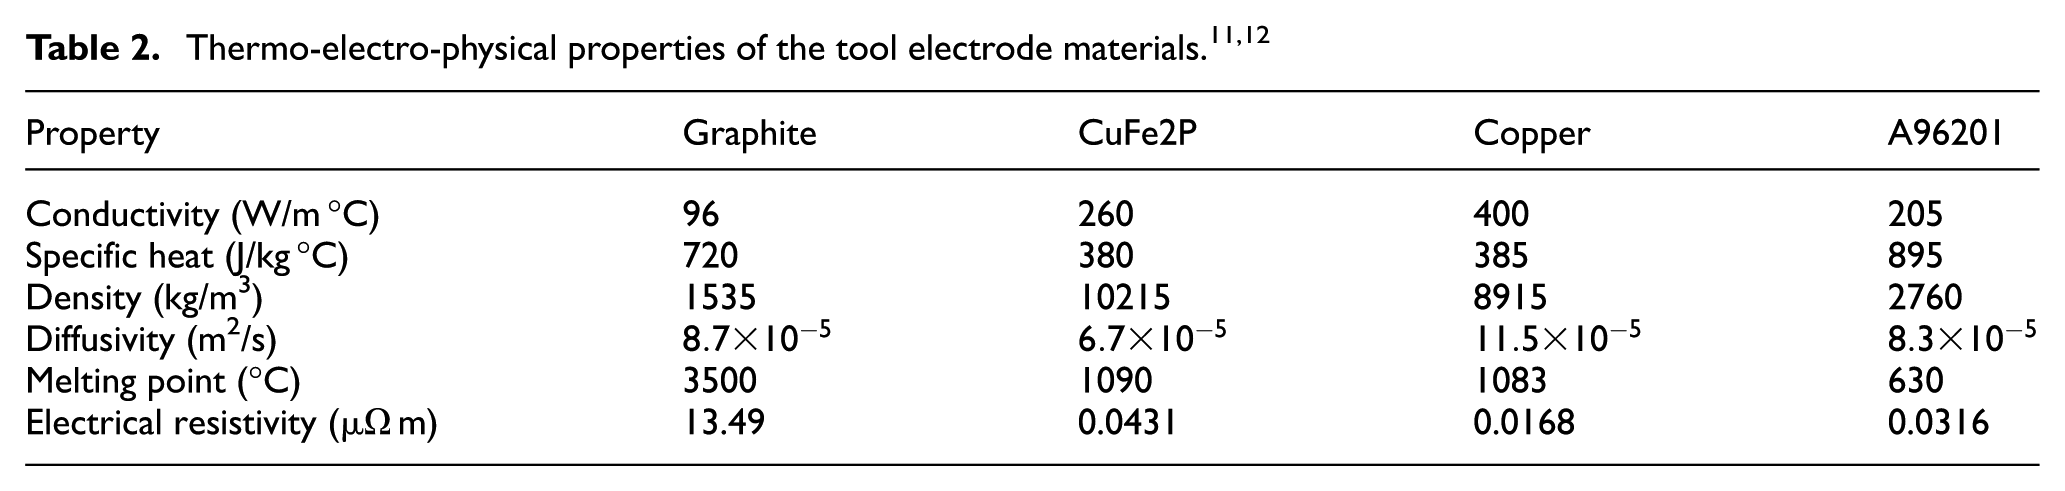
The physical properties of the tool electrode materials are given in Table 2. To estimate the input heat flux magnitude using FE model and inverse heat conduction (FEM-IHC) modeling technique, the tool electrodes were insulated and held using Teflon cylinder which located a K-type thermocouple on the tool surface to measure the temperature during the machining process. A TES 1384 data logger (with maximum storage capacity of 512 KB) was connected to the thermocouple as a thermometer to record the temperature history of the experiments. Peak current and pulse types were monitored during EDM process by employing Hitachi VC-6524 digital oscilloscope. D4Thermo V.8.0 user interface and a USB B-type cable were used to transfer the data to the processing unit. The data logging and temperature measurement unit in combination with tool electrode are shown schematically in Figure 1.
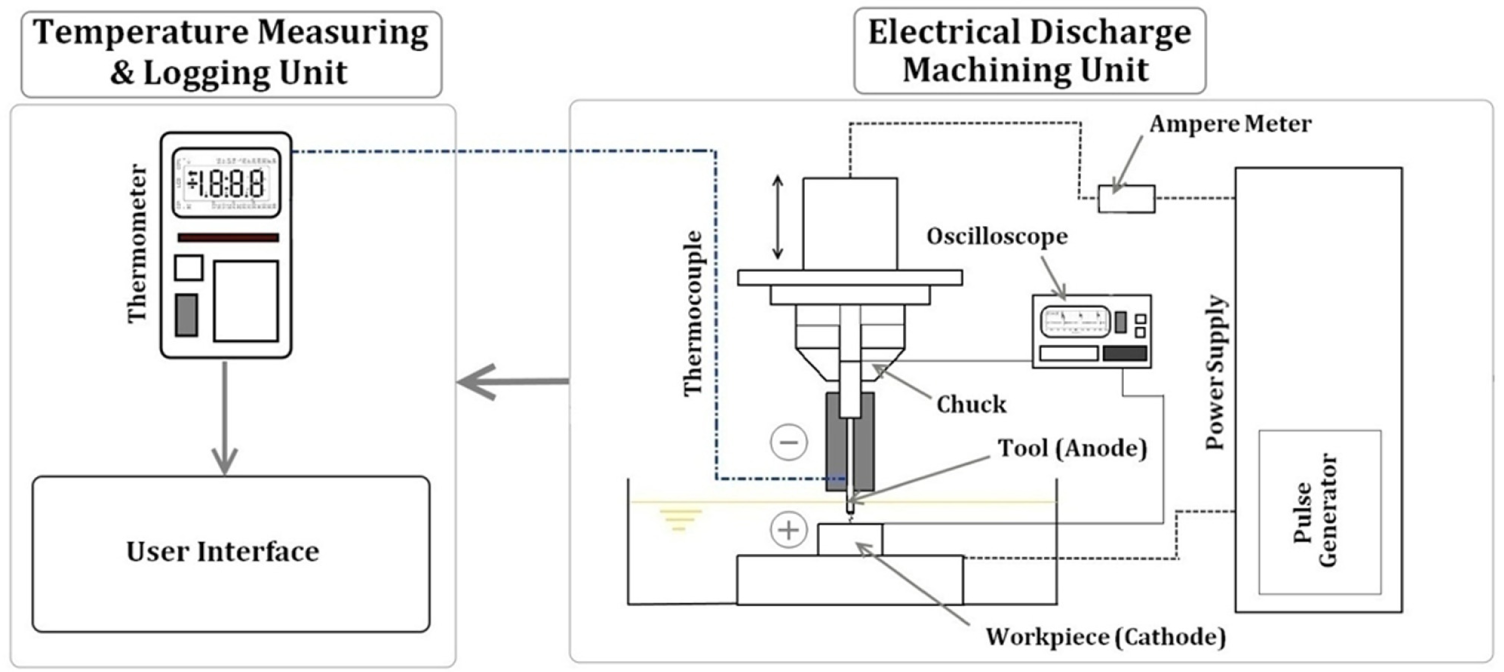
Schematics of experimental setup.
After the machining operation, the tool electrodes were cut cross-sectionally using AgieCharmilles CUT 1000 wire EDM (WEDM) machine. Afterward, the segments were polished and, subsequently, etched using ferric chloride and Keller etchants in the case of copper-based and aluminum-based alloys, respectively. Later, the images of the recast layer on the surface tool electrodes were acquired using Oxford Inca X-sight scanning electron microscope (SEM). The thickness of the recast layers on the surface of the tool electrodes was measured from the SEM images of the tool tip’s profile using Clemex Vision PE image analyzer software. The RLT figures are the average values and achieved from SEM photos on which layers are measured at 20 different consecutive points using the image analyzer software. Accordingly, the reported values of the RLT are the average values of the formed layer on the tool electrodes. Some typical measurements of RLT captured from SEM images are displayed in Figure 2.
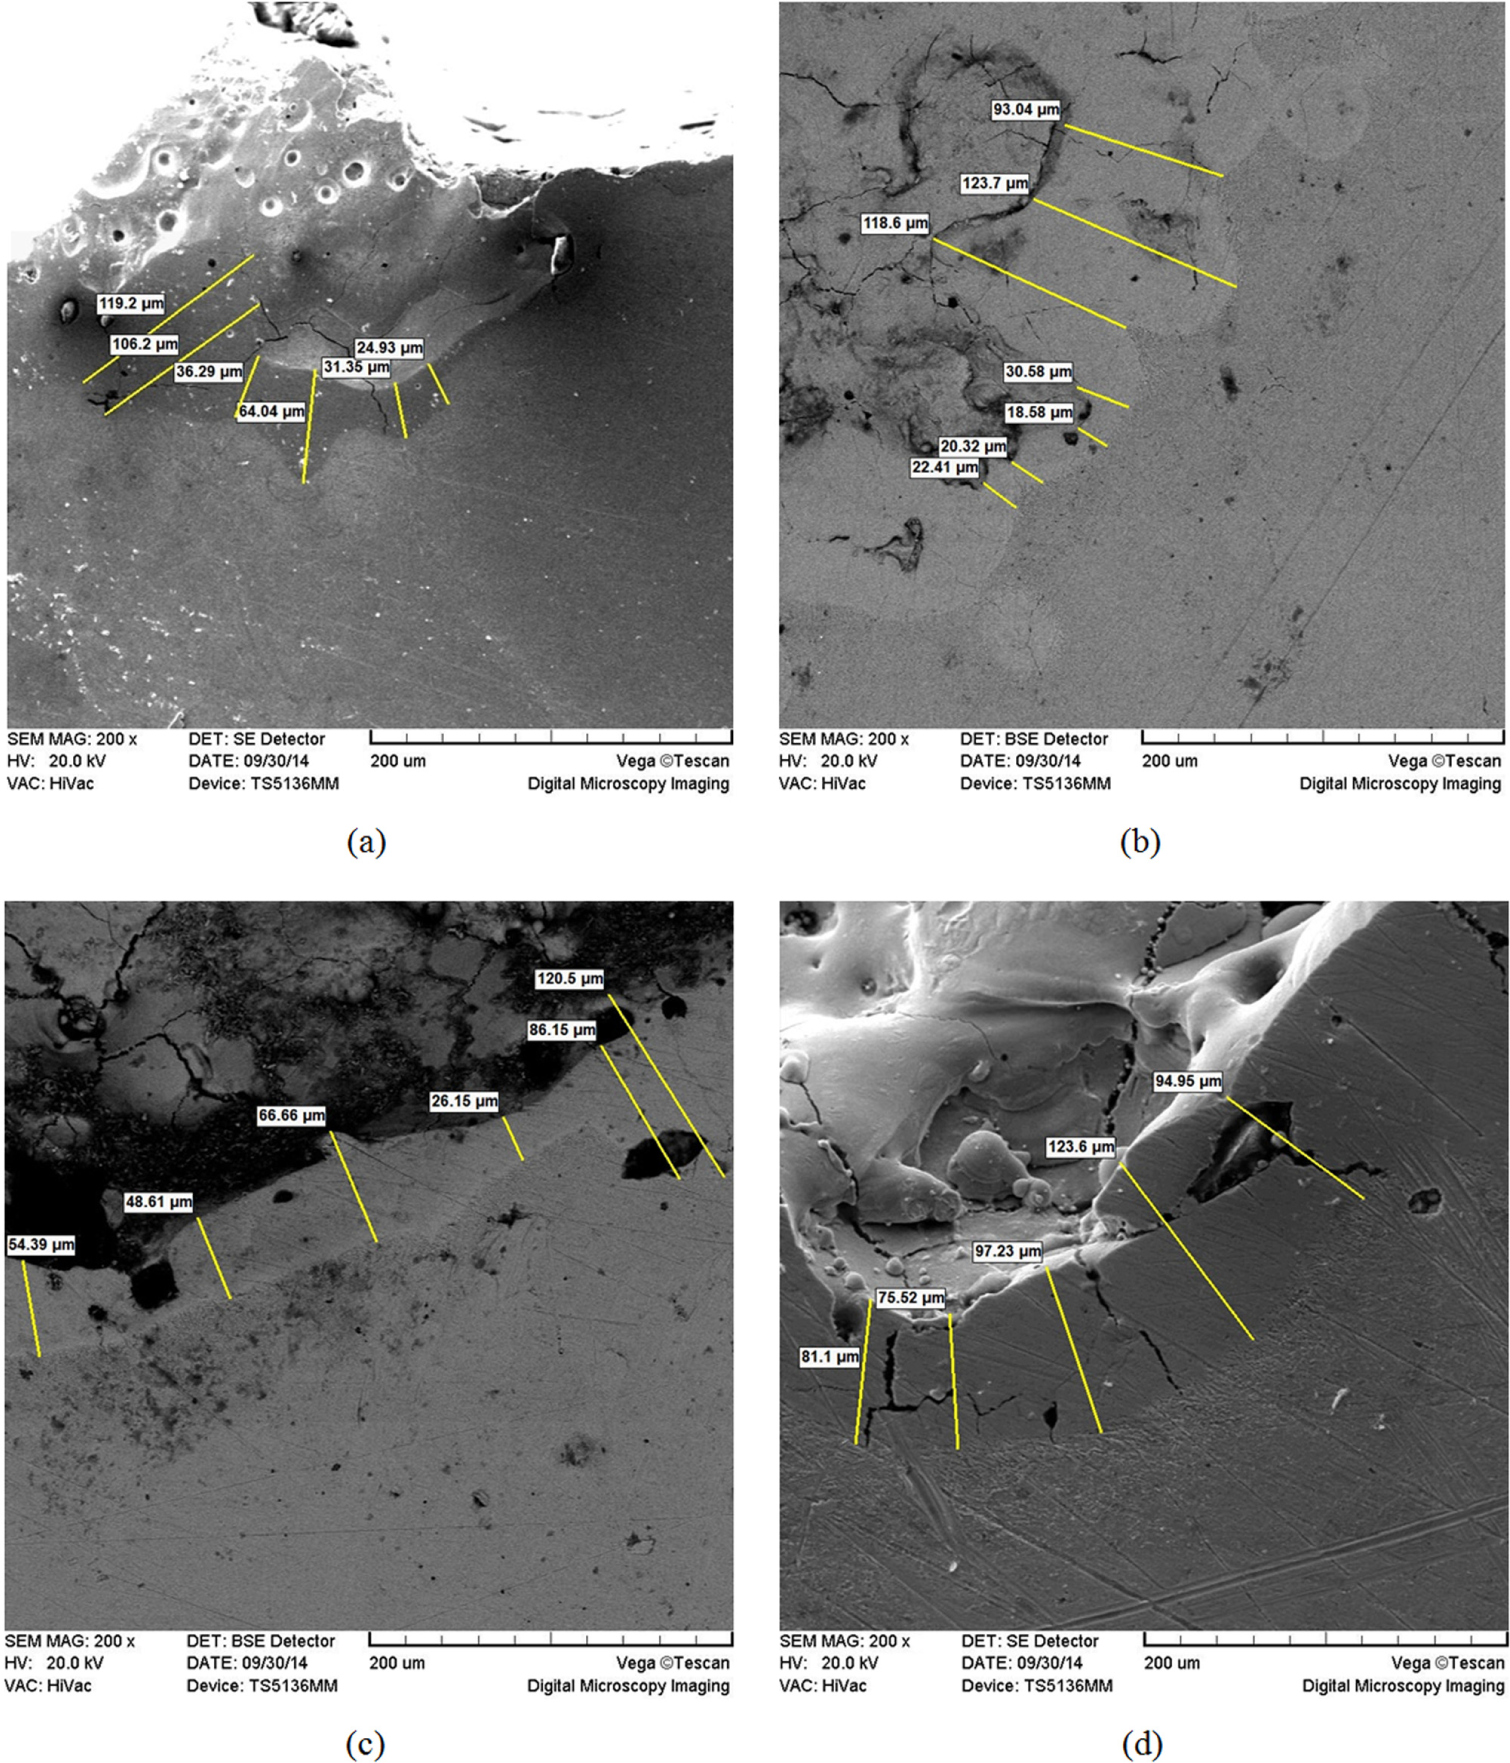
Typical SEM images of RLT measurement: (a) CuFe2P, (b) graphite, (c) copper and (d) A96201.
Numerical simulation
The EDM process has been modeled numerically using an IHC approach which was applied in combination with two different FEMs. In other words, each of the numerical procedures for the estimation of the tool wear had two mathematically different fundaments and outcomes. The FEM section of the developed models was aimed to estimate the tool wear magnitude per discharge and also to calculate temperature distribution during the machining process. Consequently, the FEM process was employed to quantify the heat flux boundary condition (BC) in combination with IHC section of the numerical model. ABAQUS FE package and MATLAB were used to model FEM and IHC sections of the numerical procedure, respectively.
In FE procedure, two different models were designed to fulfill two separate tasks. The first model was created to calculate the temperature distribution during every single discharge which was combined with IHC MATLAB program to estimate the heat flux BC and was called heat flux predictor (HFP) model. The second one was designed to simulate the temperature distribution within the machining process and, consequently, estimate the tool wear magnitude which was called tool wear predictor (TWP) model.
In both the FE models, HFP and TWP, the governing partial differential equation was three-dimensional cylindrical heat conduction equation which was discretized into DC3D8-type elements and solved after applying specified BCs. The cylindrical three-dimensional equation is given in equation (1) 13
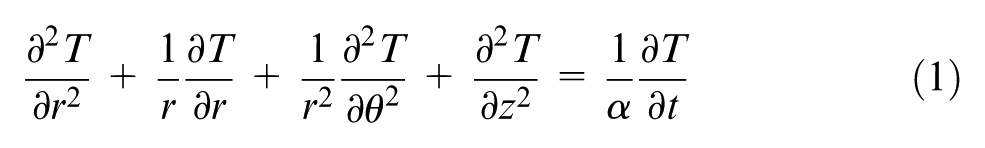
where T is the temperature; r,
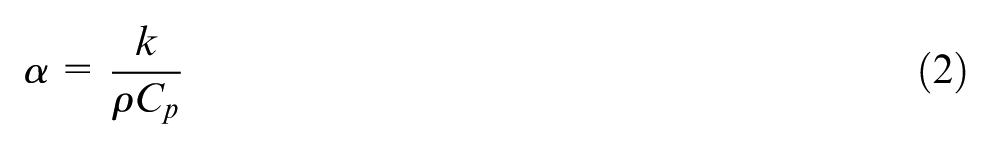
where k is the thermal conductivity coefficient,
The considered BCs are mathematically expressed as follows

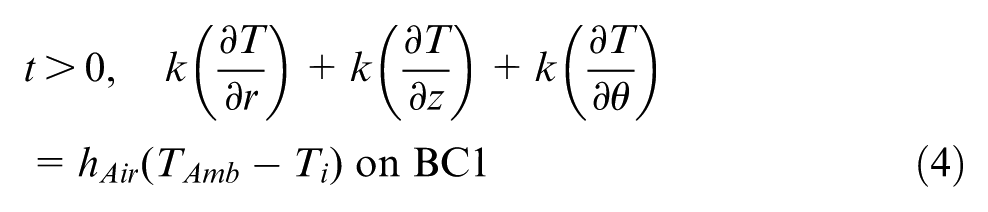
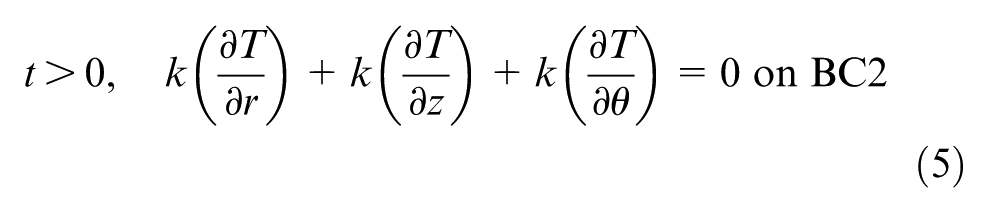
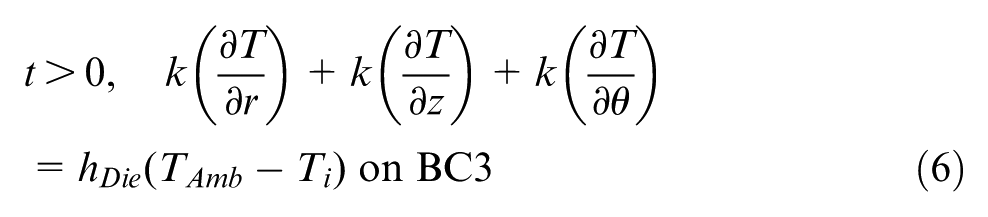
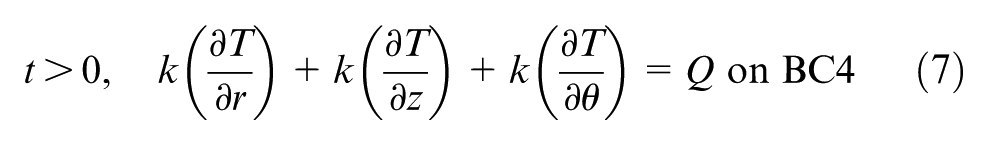
where
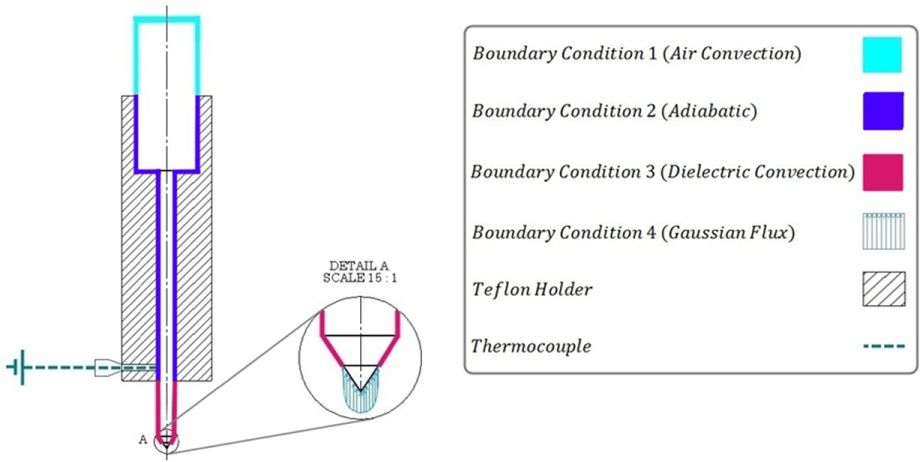
Boundary conditions of the tool electrode numerical model.
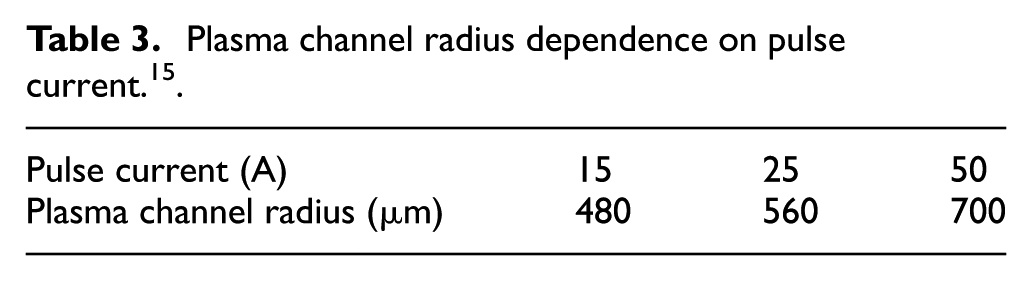
The Gaussian distribution of the heat flux
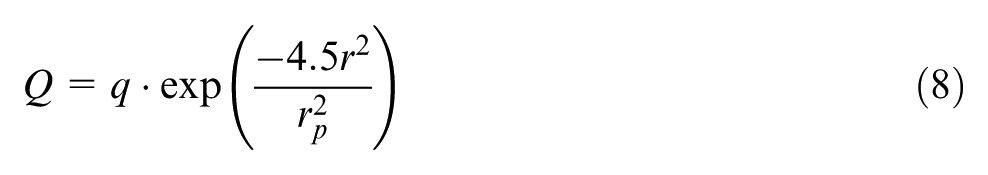
where
Plasma channel radius dependence on pulse current. 15
IHC procedure
IHC technique is an iterative process to modify the arbitrarily selected constant value of the unknown quantity of heat flux in equation (8). In this solution technique, the temperatures which were recorded during the experiments in combination with those that calculated from a numerical model are utilized to determine the constant factor of “q” in heat flux distribution equation. For this purpose, Levenberg–Marquardt parameter estimation method is employed. This method is a powerful iterative technique for nonlinear parameter estimation. This technique has been applied because of its simplicity and lower computations comparing with the others. Levenberg–Marquardt can be used when the number of parameters to be estimated is low.
16
Levenberg–Marquardt technique is based on minimizing the least squares norm and its solution flowchart is given in Figure 4.
16
In the flowchart,
An arbitrarily selected value is used in FEM (HFP) to calculate the temperature distribution in the tool electrode.
The obtained temperatures from HFP model along with the temperatures from the experimental stage are imported into the written script of IHC process (MATLAB program).
The least squares norm is calculated using the computed and measured temperatures.
A new constant parameter of q is estimated.
The calculation process repeats until the predefined stopping criterion is satisfied.
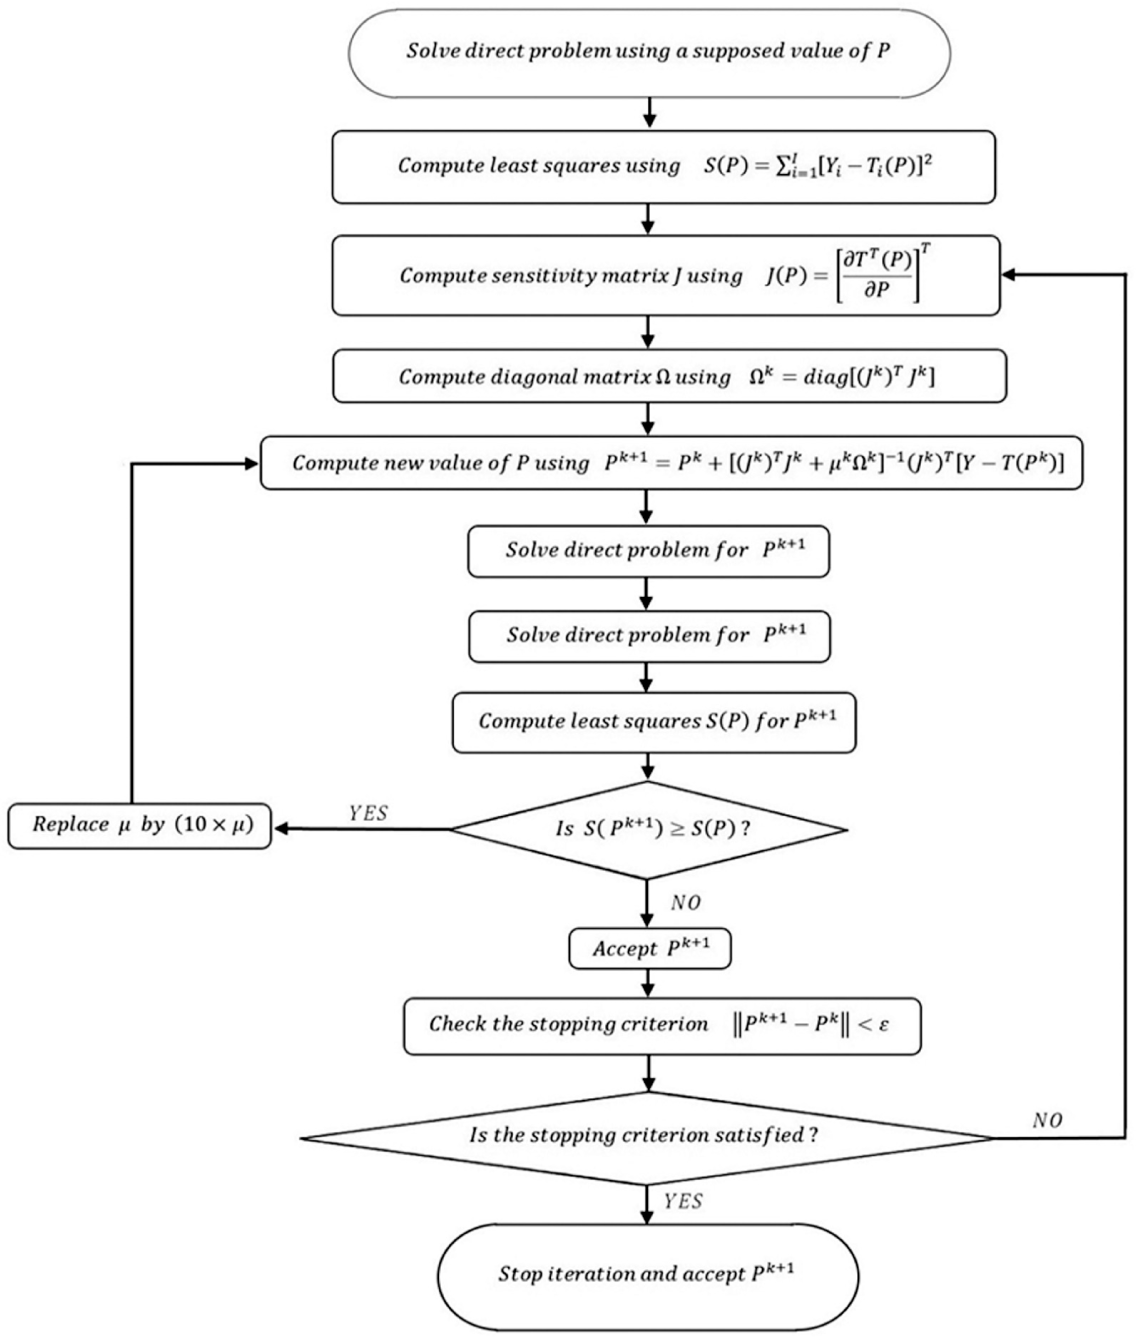
Levenberg–Marquardt solution technique flowchart.
The detailed flowchart of the FEM-IHC estimation procedure is displayed in Figure 4.
Calculation of AF, PFE and TW
The amount of energy transferred to the tool electrode is a fraction of total spark energy generated within a single discharge. AF indicates the portion of the thermal energy that is absorbed by the tool electrode. The magnitude of this ratio is associated with the thermo-electro-physical variables of the EDM process. 8 The fraction of the thermal energy, conducted to the tool electrode, is calculated using the following equation
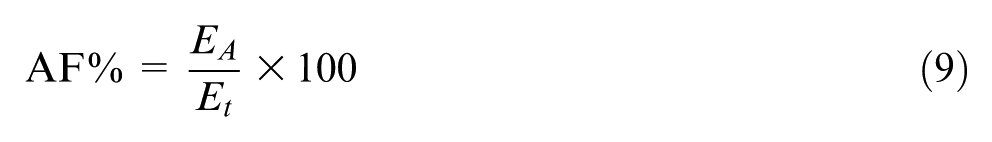
where EA is the amount of thermal energy transferred to the tool electrode, and Et is the total amount of energy generated within a discharge.
PFE is an indicator that determines the portion of the molten cavity removed after each discharge. This quantity causes the numerical models to include the effect of recast layer formation. The thermal and electrical characteristics of the machining process significantly affect the PFE factor 17 which is calculated as follows
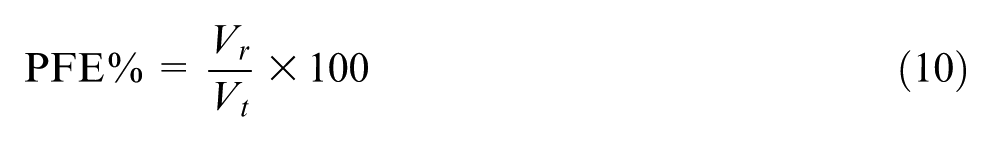
where Vr and Vt are the removed and total volume of the molten cavity, formed during one single spark, respectively. The volume of the crater that removed after the termination of the discharge can be expressed mathematically as follows
where
The tool wear is an indicator which determines the proportional reduction in tool mass after the machining process. The relative tool wear is numerically calculated using the following equation
where ρ, Pe and Mi are the density, the pulse duty efficiency and the initial mass of the electrode, respectively.
Mathematical models of the process
The results of RLT, AF% and PFE% are utilized to investigate the relationship between the machining input and output parameters. The obtained values are quantitatively analyzed to assess the significance of the machining input parameters including thermo-physical and electro-physical ones. Having this in mind, polynomial models are correlated by nonlinear regression approach. Main effect analysis precedes model specification to ensure that statistically significant parameters are included in the proposed models.
The general nonlinear mathematical models can be expressed for each of the dependent variables in full-factorial design of experiments as follows
where RLT, AF% and PFE% are the dependent variables. Additionally, XR1 to XR6, XA1 to XA9 and XP1 to XP9 are the independent variables of the recast layer, AF and PFE models, respectively.
Results and discussion
Mathematical model and evaluation of AF%
Pulse current, pulse duration and thermal conductivity are the most significant parameters in terms of AF% factor according to the results presented in Table 4 and main effect plots shown in Figure 5. Accordingly, it is of paramount importance to assess their interactive effects. Interactive effects of the determinant input parameters of AF% are displayed in Figure 6. As it is clear from this figure, the thermal conductivity coefficient intensifies the effect of the increase in pulse current and pulse duration parameters on AF% factor. This phenomenon can be explained by the fact that thermal conductivity enhancement results in rapid conduction of thermal energy in the tool electrode. On the other hand, the amount of produced thermal energy and the radius of plasma channel grow as the pulse duration and pulse current increase. This condition allows massive amount of heat to be conducted more rapidly into the tool electrode which intensifies the increase in AF% with pulse current and pulse duration enhancement.
The results of anode energy fraction (AF%).
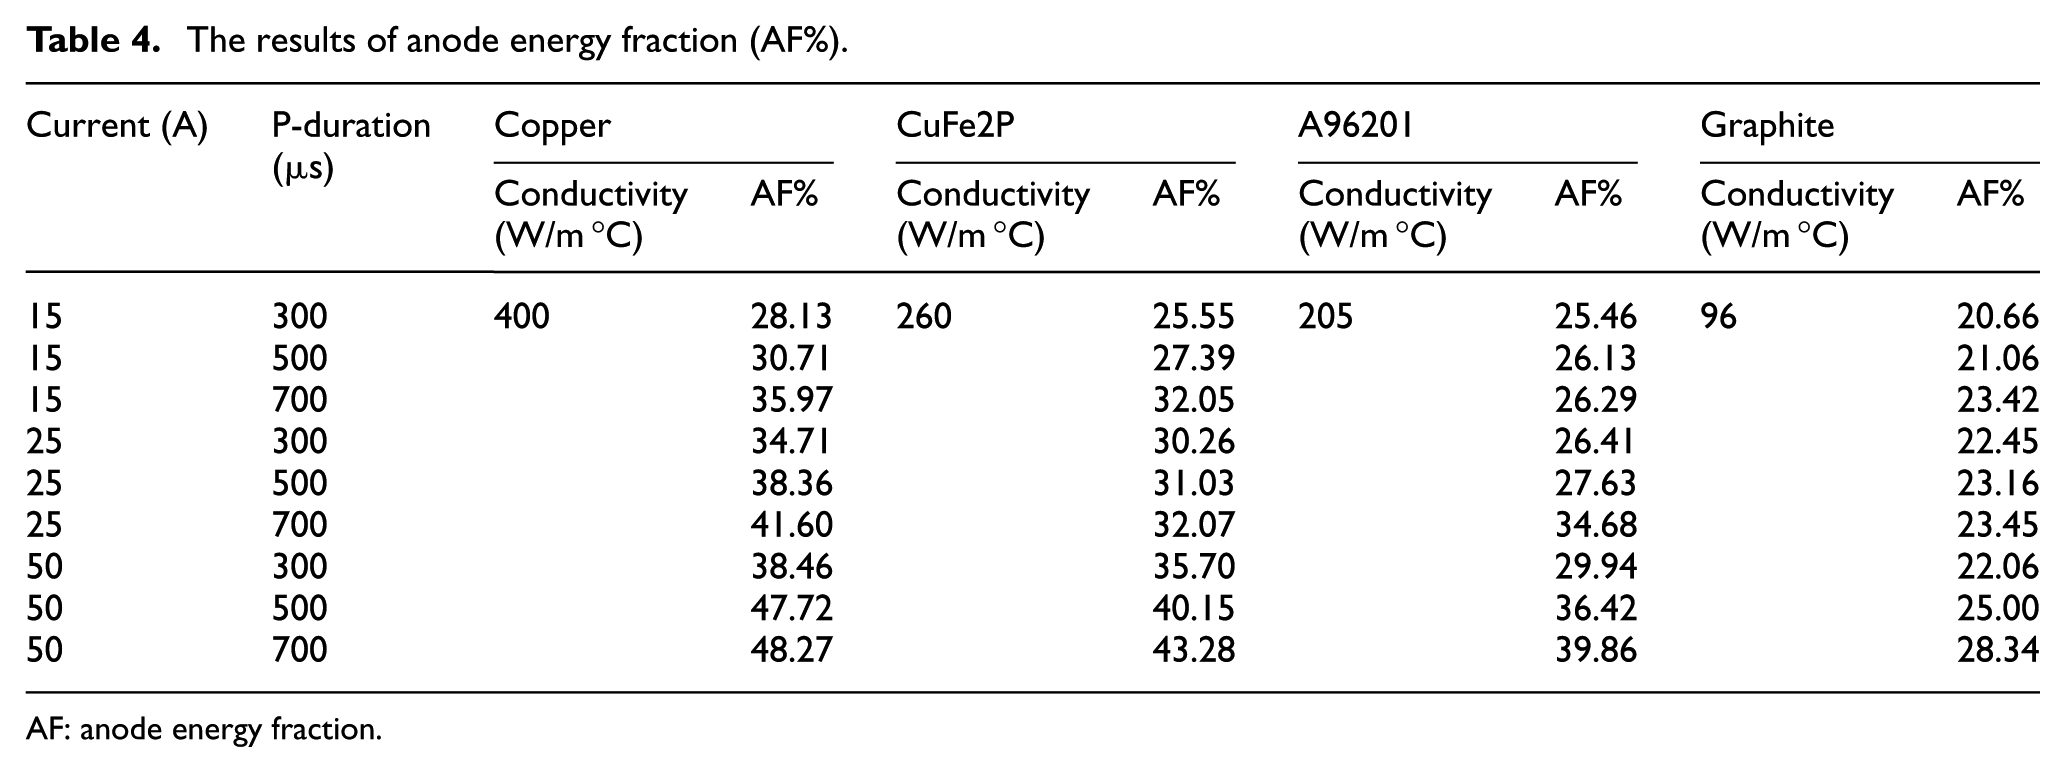
AF: anode energy fraction.
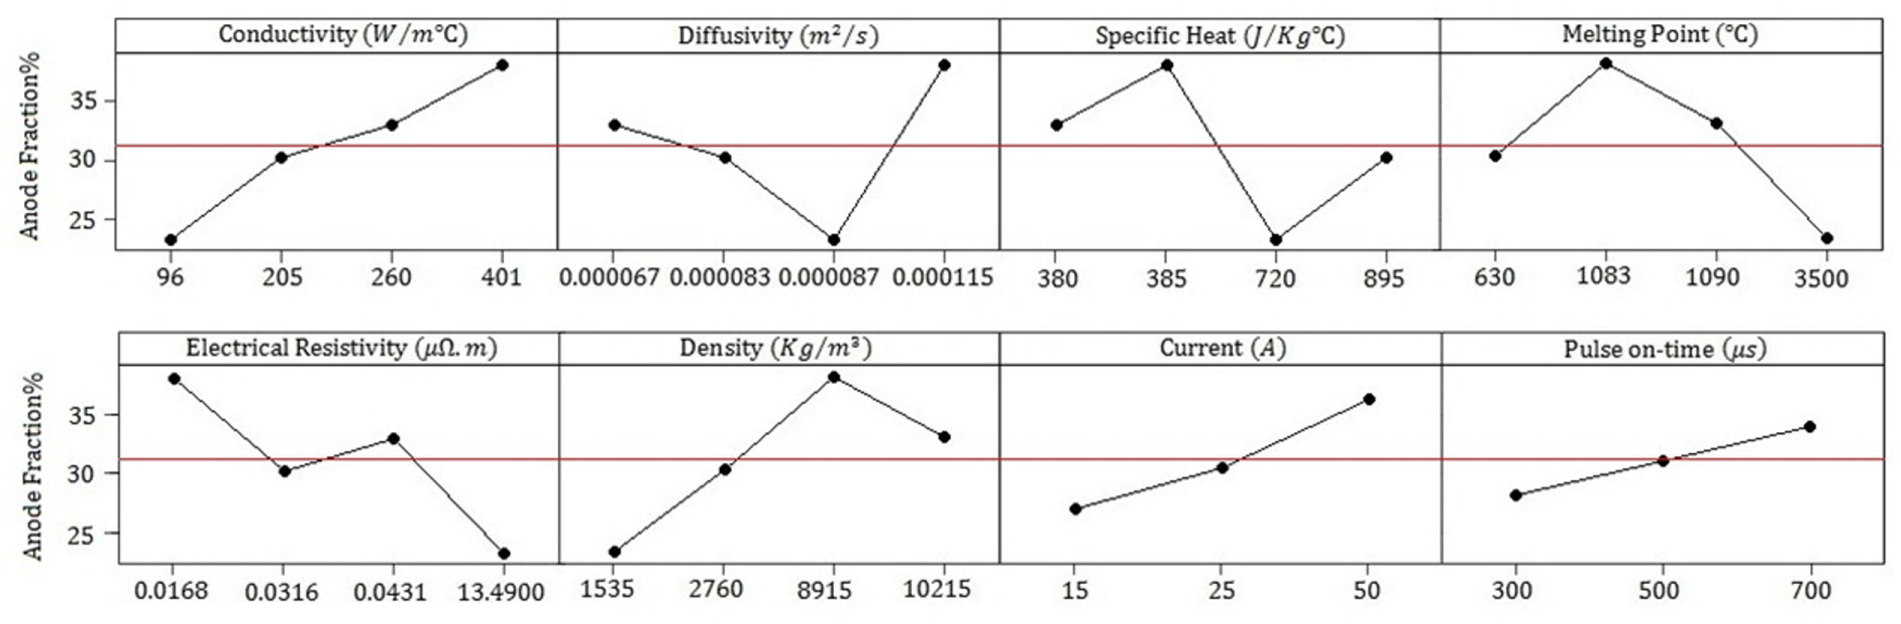
Main effect plots for AF%.
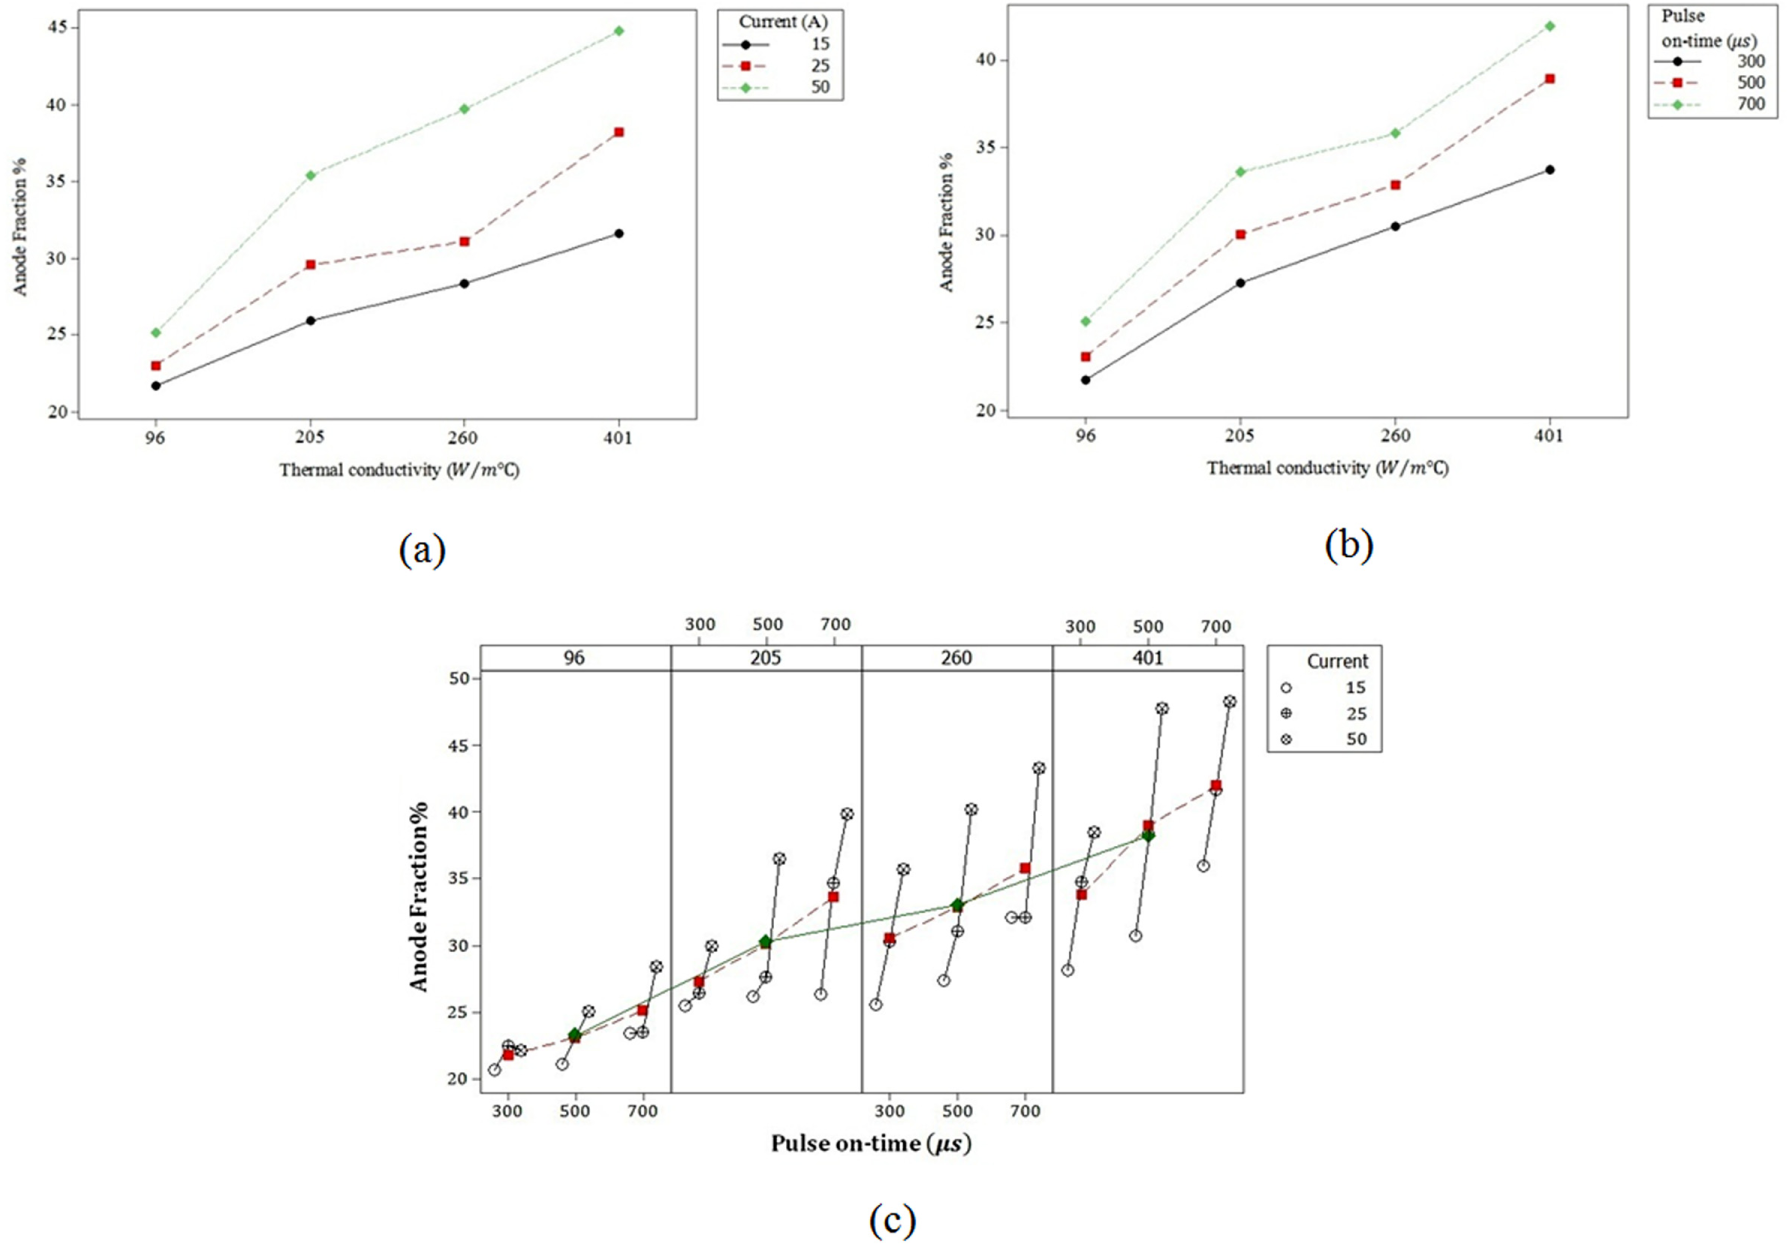
Interactive effect plots for AF%: (a) pulse current, (b) pulse duration and (c) all inputs.
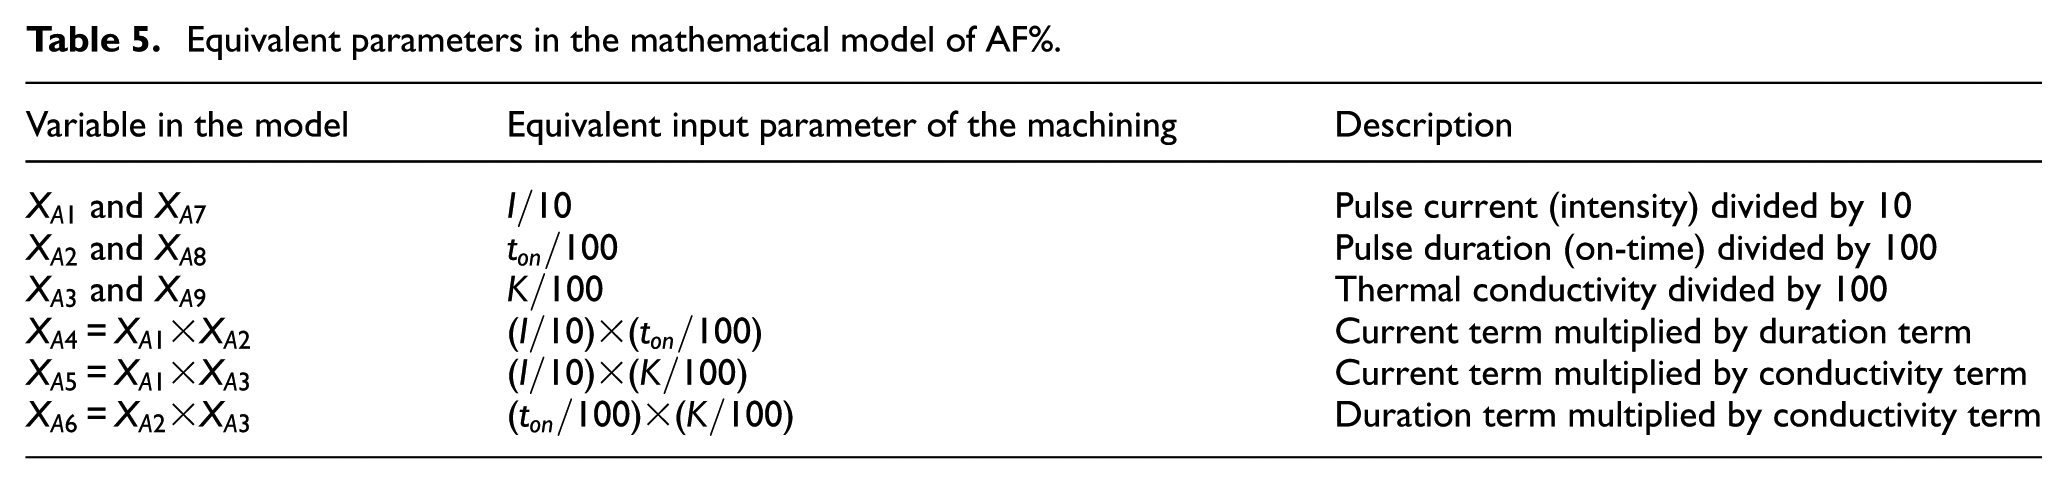
Considering the aforementioned major parameters and their significantly important interactive effects, the independent variables of the mathematical model can be defined as is detailed in Table 5. SPSS standard version software in combination with a MATLAB program was used to estimate the constant parameters of equation (16).
Equivalent parameters in the mathematical model of AF%.
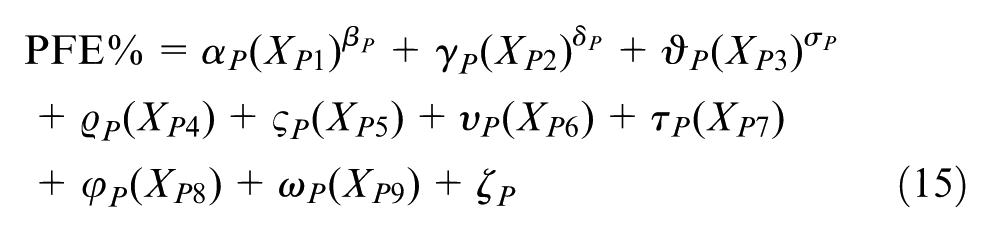
The correlated polynomial mathematical model for the prediction of the AF% value is as follows
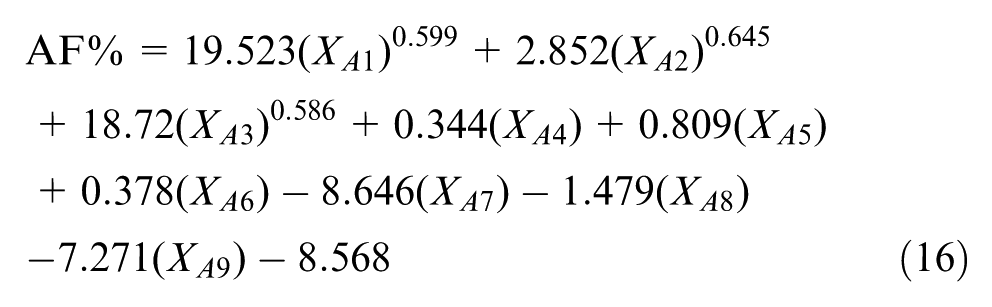
According to the calculations, the goodness-of-fit measure, R2, and its adjusted value,
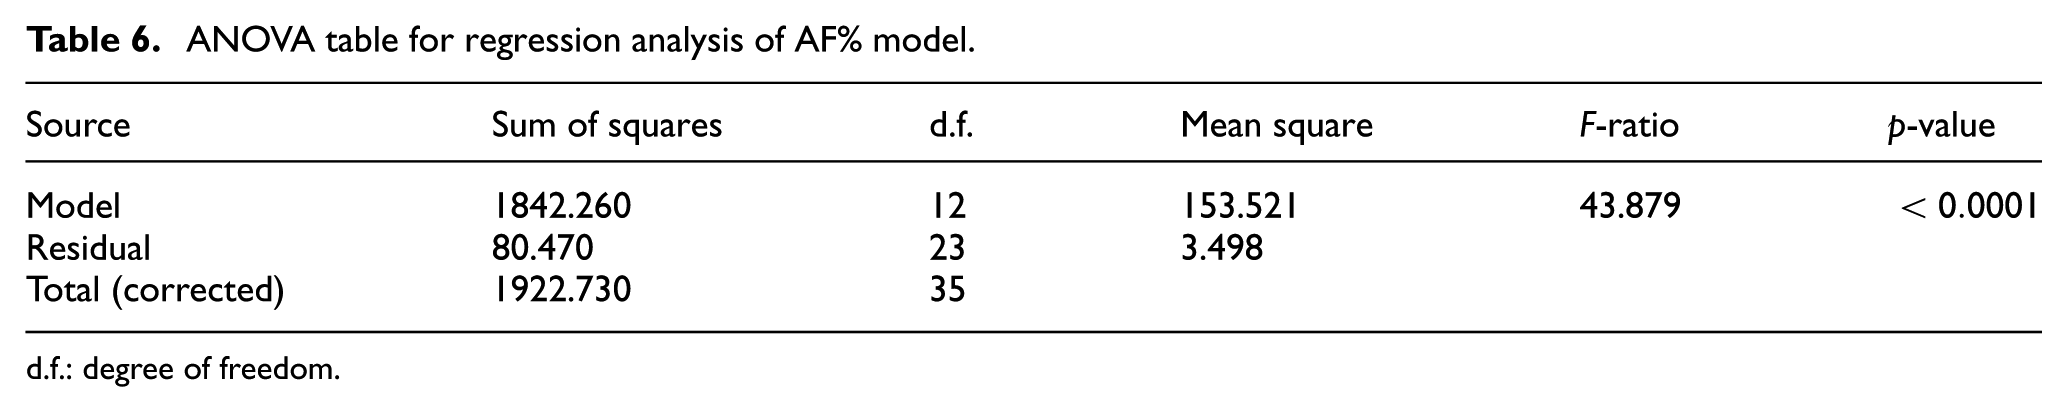
ANOVA table for regression analysis of AF% model.
d.f.: degree of freedom.
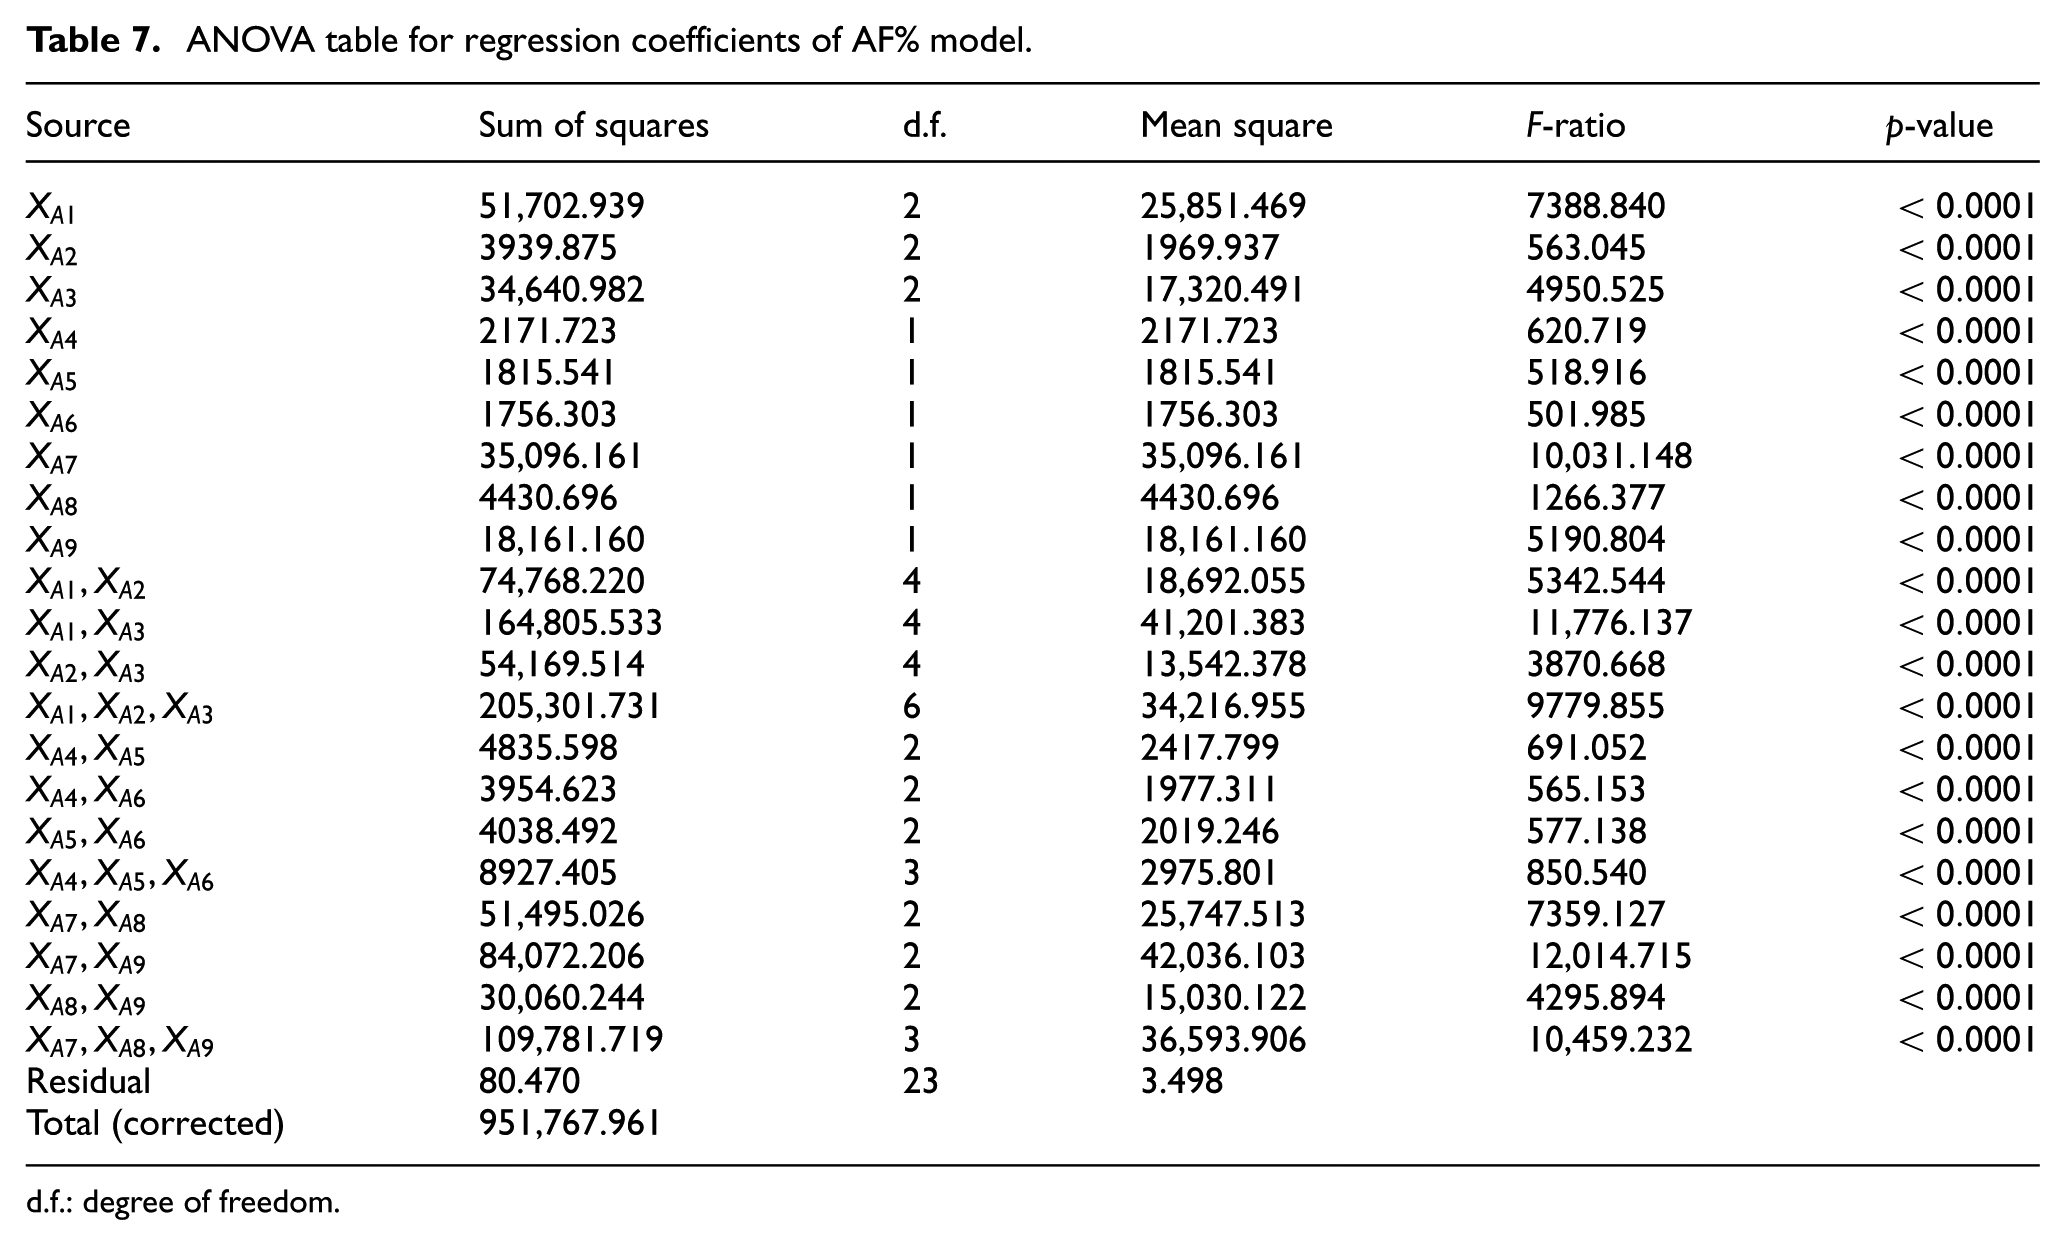
ANOVA table for regression coefficients of AF% model.
d.f.: degree of freedom.
According to the p-value in Table 6 (p < 0.0001), the model is extremely significant at confidence level of 99%.
Based on the presented details in Table 7, the considered parameters and their interactive effects are statistically significant at confidence level of 99%. In other words, the magnitude of p-value is <0.01 in assessing the adequacy of the model coefficients which indicates that the mathematical model is efficient.
Mathematical model and evaluation of RLT
The average values of RLT are reported in Table 8. As it is clear from the results, RLT depends on the thermo-electro-physical parameters. The main effect plots, illustrating the effects of eight different thermo-electro-physical parameters on the RLT quantity, are displayed in Figure 7. According to this figure, pulse current, pulse on-time and thermal diffusivity coefficient significantly affect the thickness of the recast layer formed on the machined surface of the tool electrode. The results indicate that the increase in pulse current, pulse duration and thermal diffusivity leads to the formation of the thicker recast layers. Additionally, the ratio of thermal energy conduction to its storage becomes large with an increase in thermal diffusivity, which leads to larger molten puddles. On the other hand, the fraction of molten puddle that is removed from the electrode depends on the difference in pressure between the plasma channel and the ambience.
The average of experimentally measured RLT values.
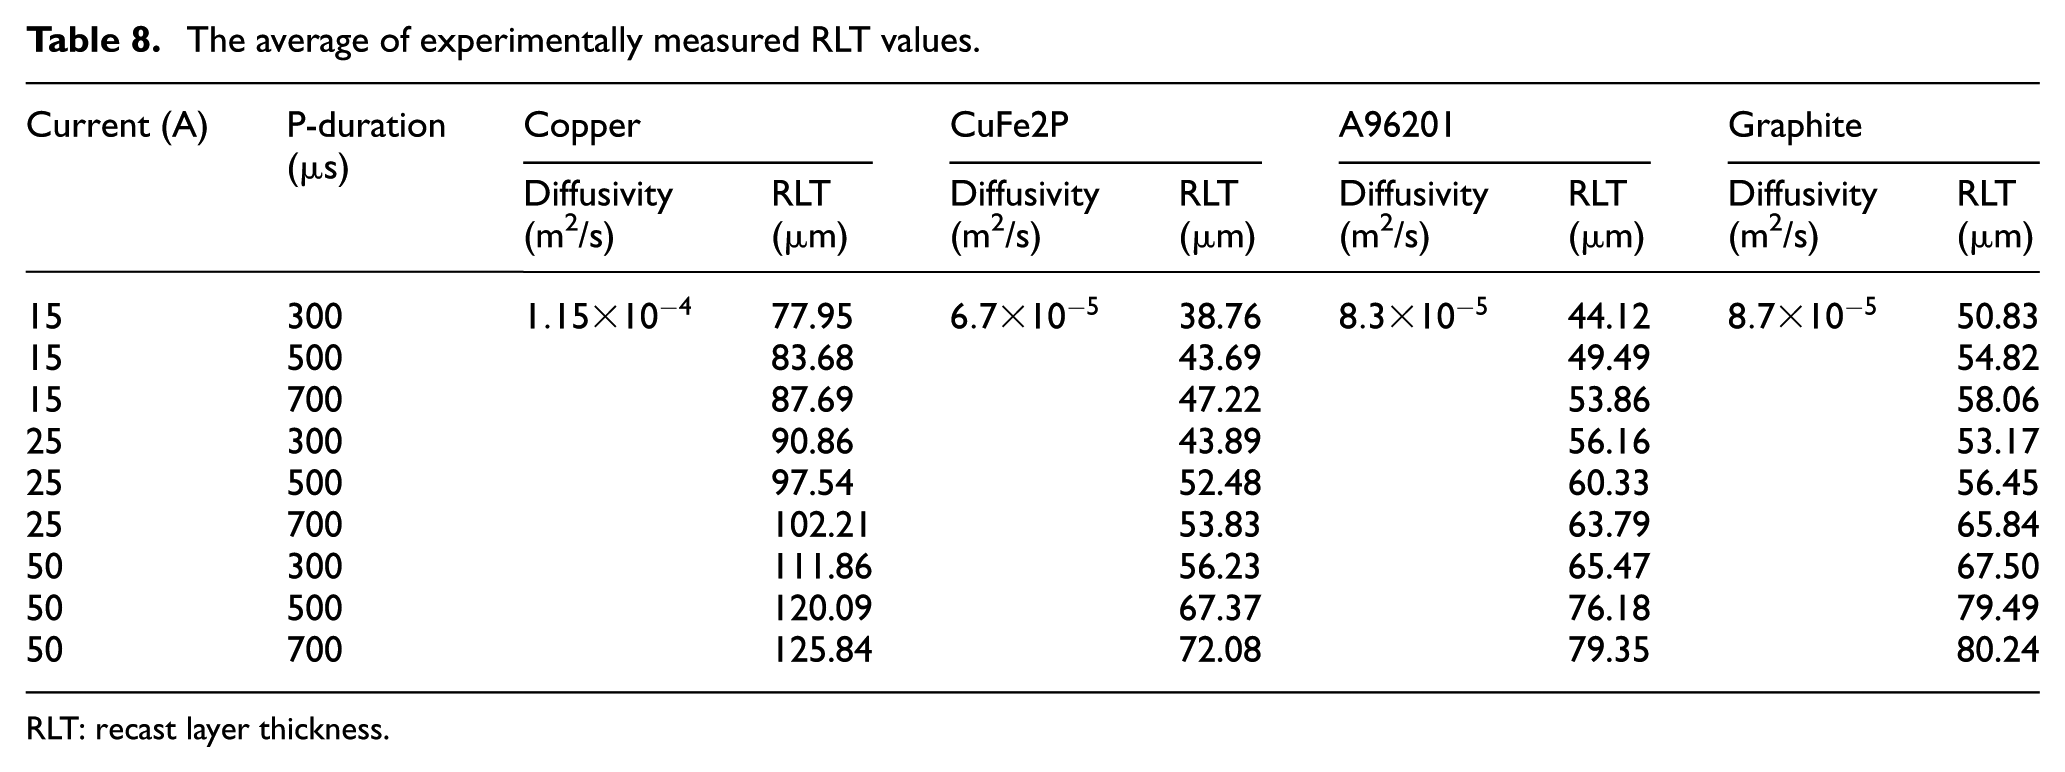
RLT: recast layer thickness.
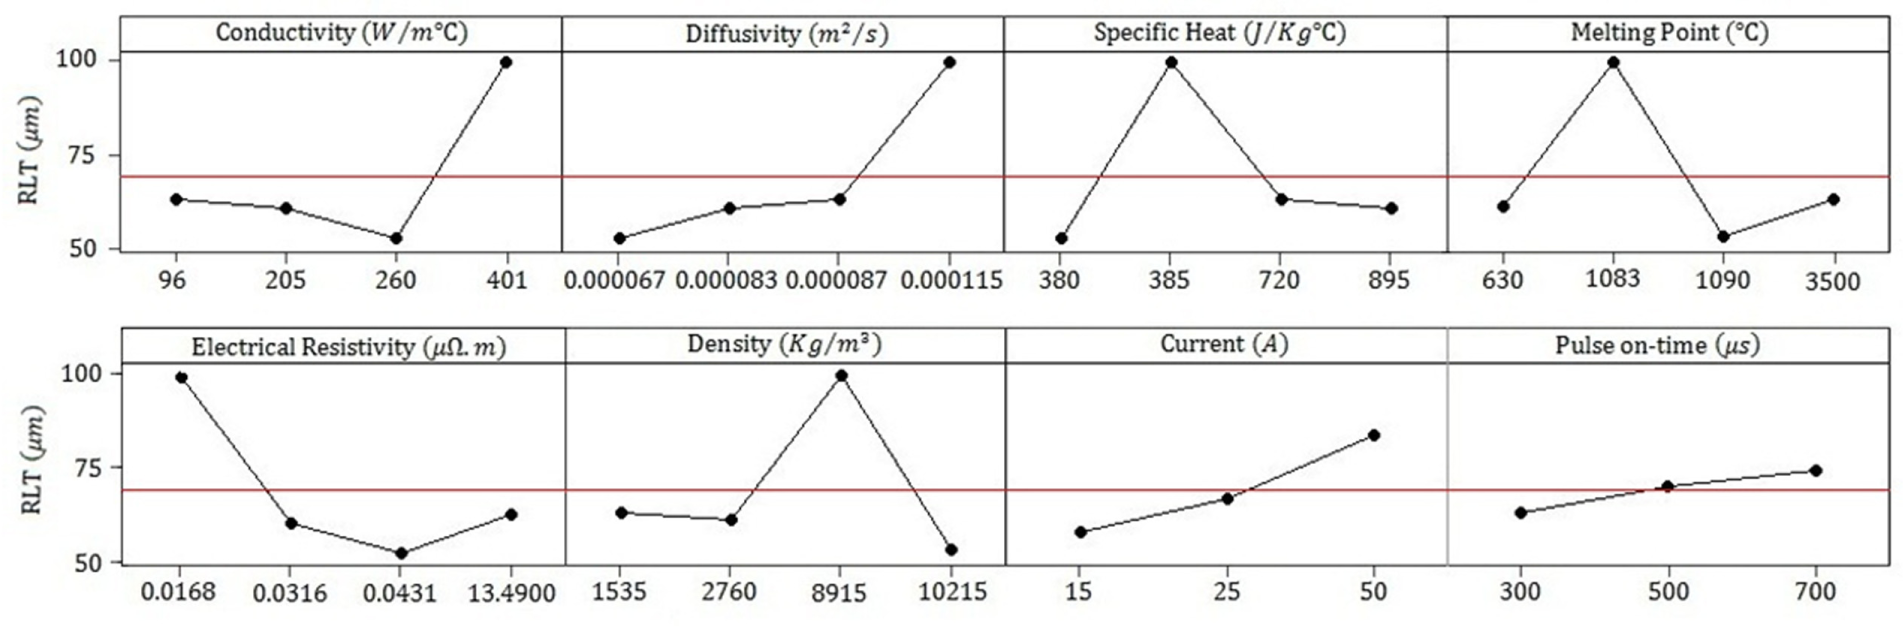
Main effect plots for RLT.
As pointed out above, the interactive effects of pulse current, pulse duration and thermal diffusivity coefficient must be analyzed to reach a comprehensive model which considers all the essential aspects on TW. Therefore, their interactive effects are displayed in Figure 8. According to the interval of the plots, as the magnitude of the input parameters is increased, the difference between the minimum and maximum values of the RLT becomes relatively large. This can be attributed to the fact that the growth of molten crater increases as the thermal diffusivity in combination with pulse current and duration is enhanced. Therefore, the amount of material removal remains almost unchanged due to constant pressure of plasma channel which is associated with the channel size; this leads to an extreme enhancement of the RLT value.
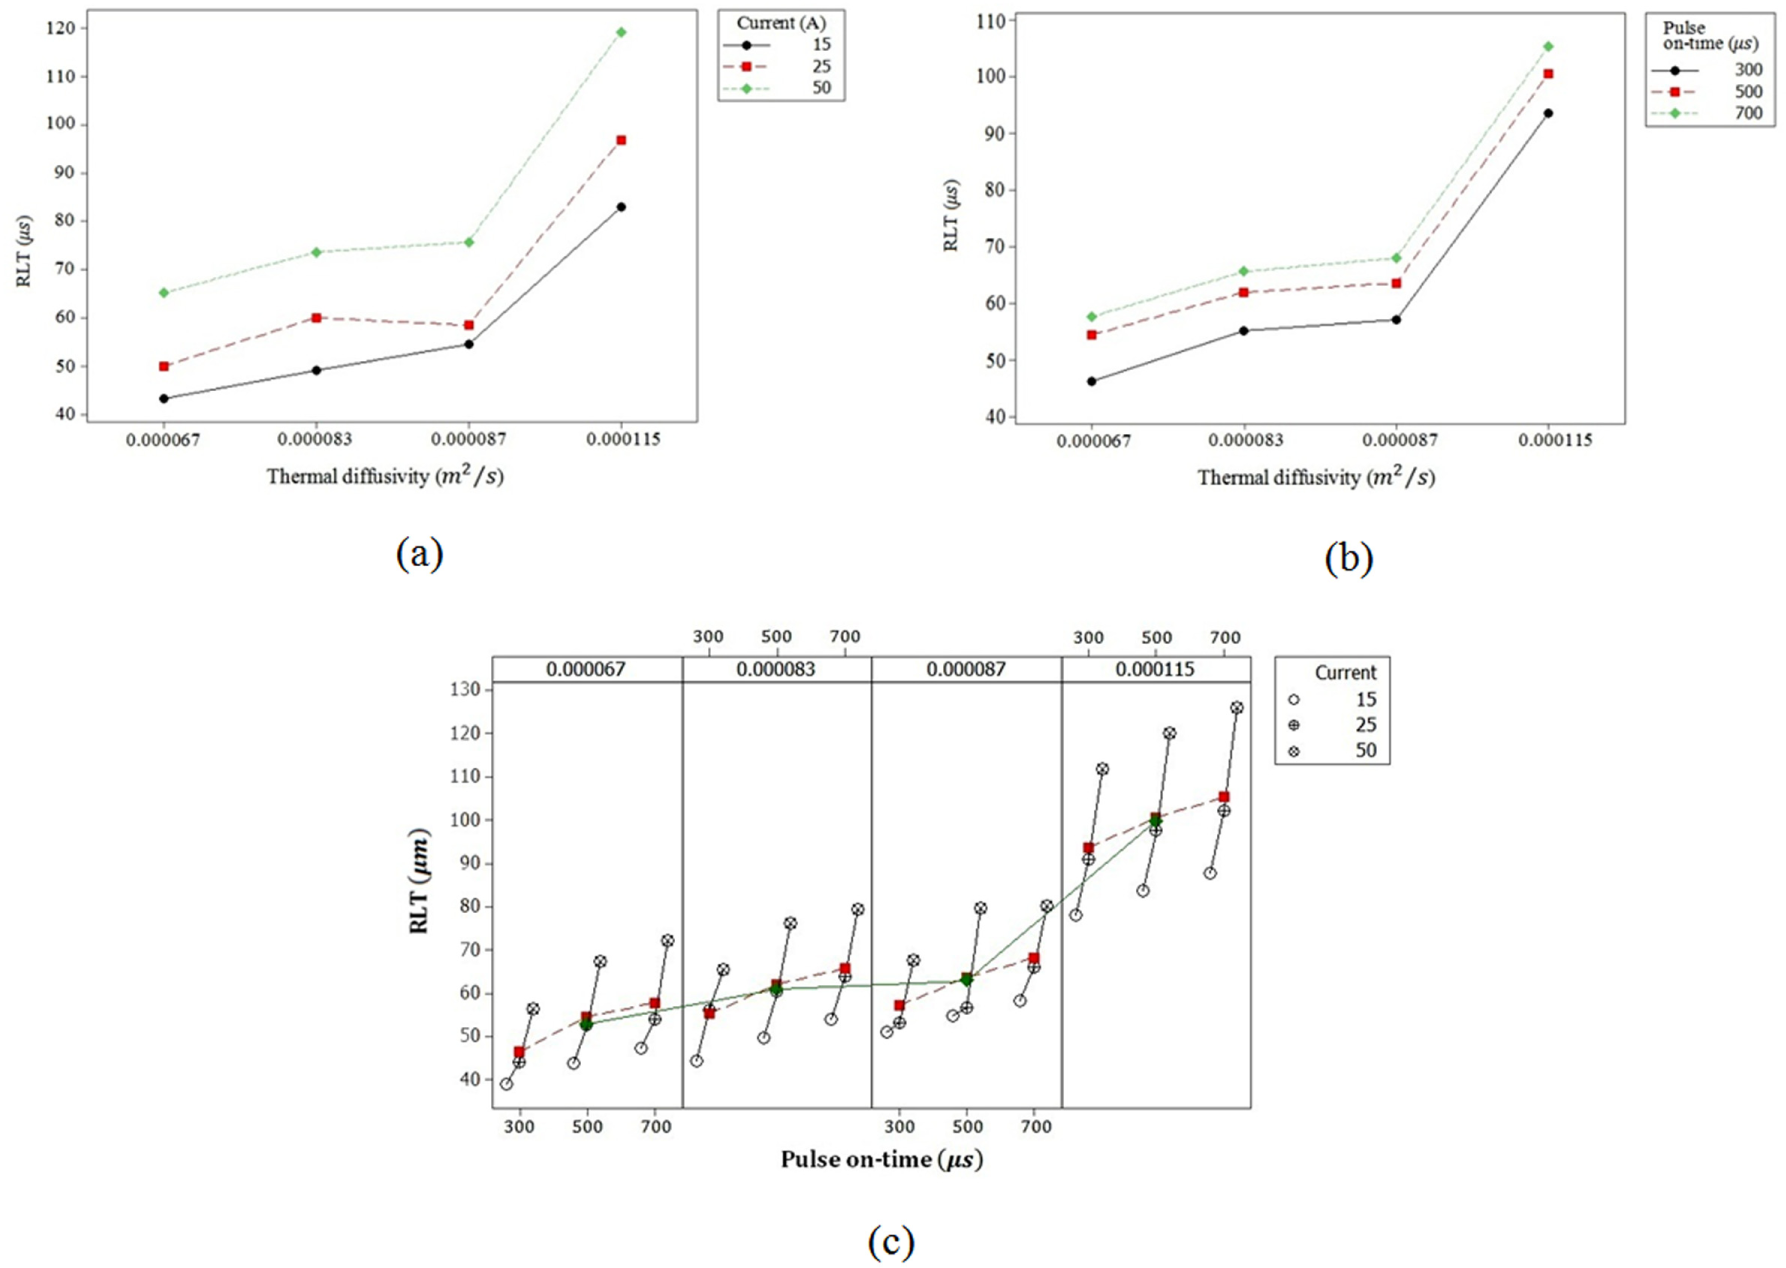
Interactive effect plots for RLT: (a) pulse current, (b) pulse duration and (c) all inputs.
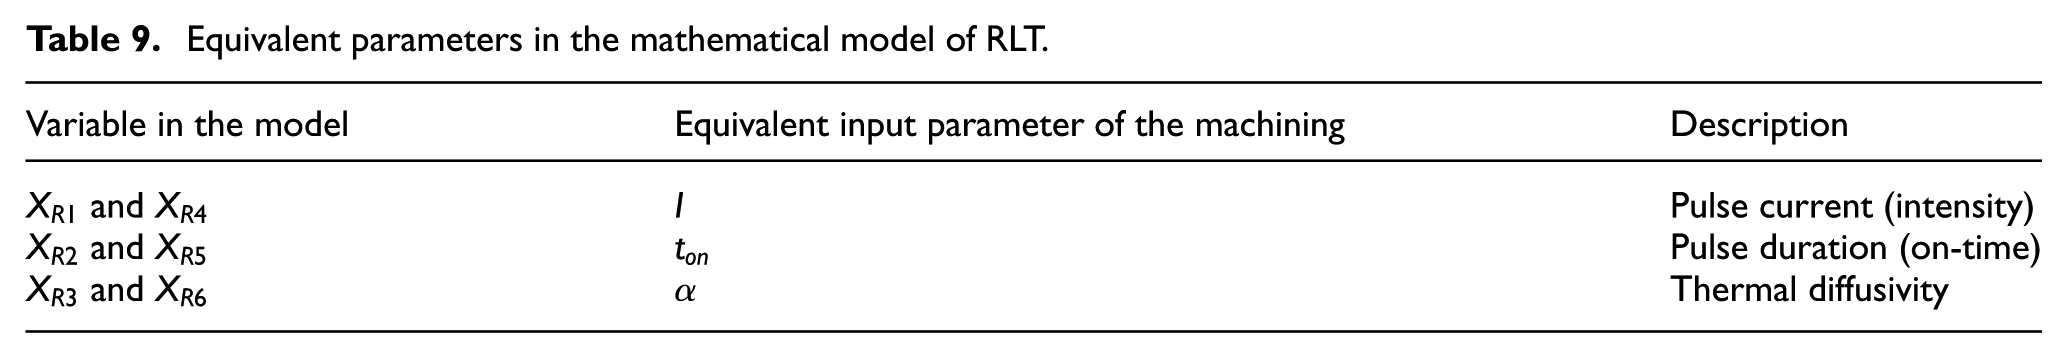
According to the above discussions, the independent variables of the mathematical model of RLT can be determined as given in Table 9.
Equivalent parameters in the mathematical model of RLT.
The correlated polynomial mathematical model for the prediction of the RLT value is as follows
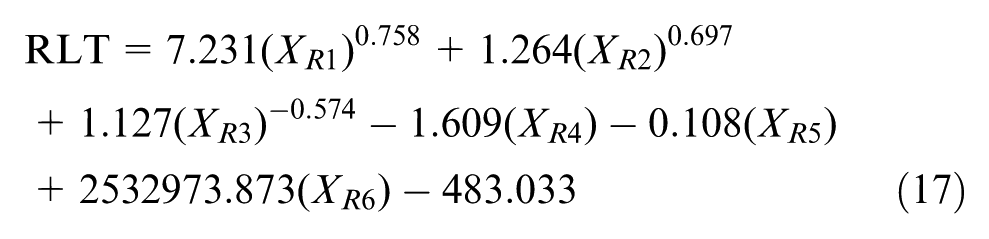
The values of 0.978 and 0.970 are obtained for R2 statistic and the adjusted R2,
ANOVA table for regression analysis of RLT model.
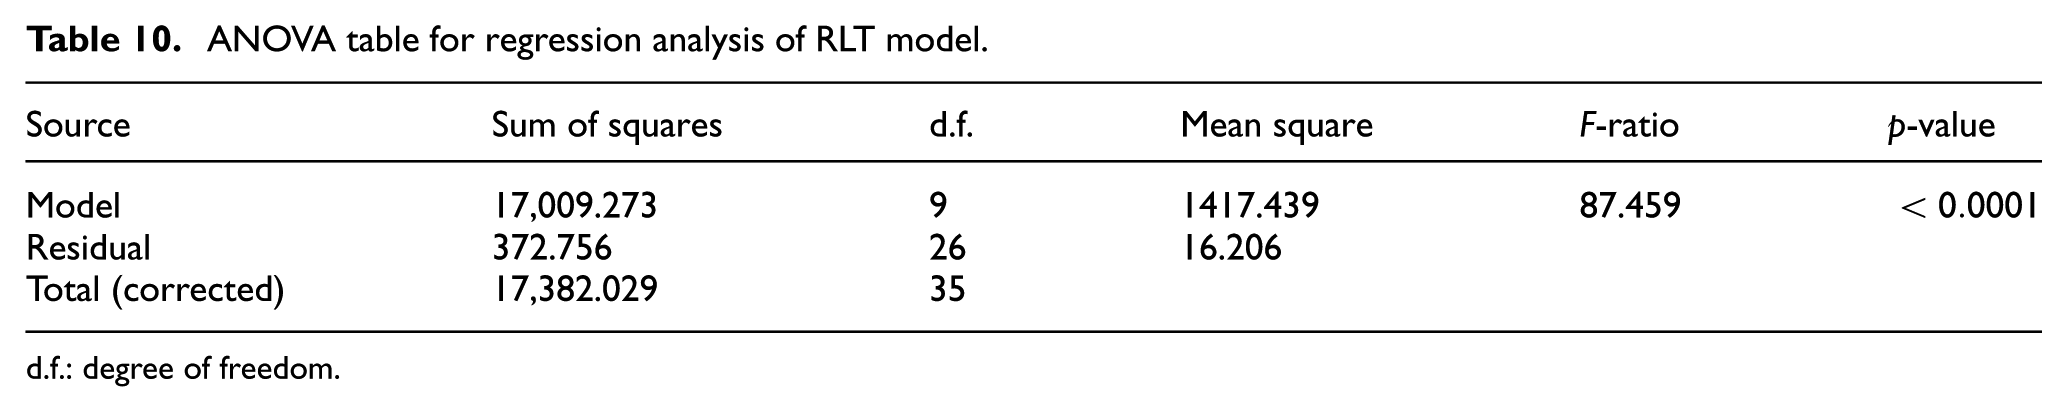
d.f.: degree of freedom.
ANOVA table for regression coefficients of RLT model.
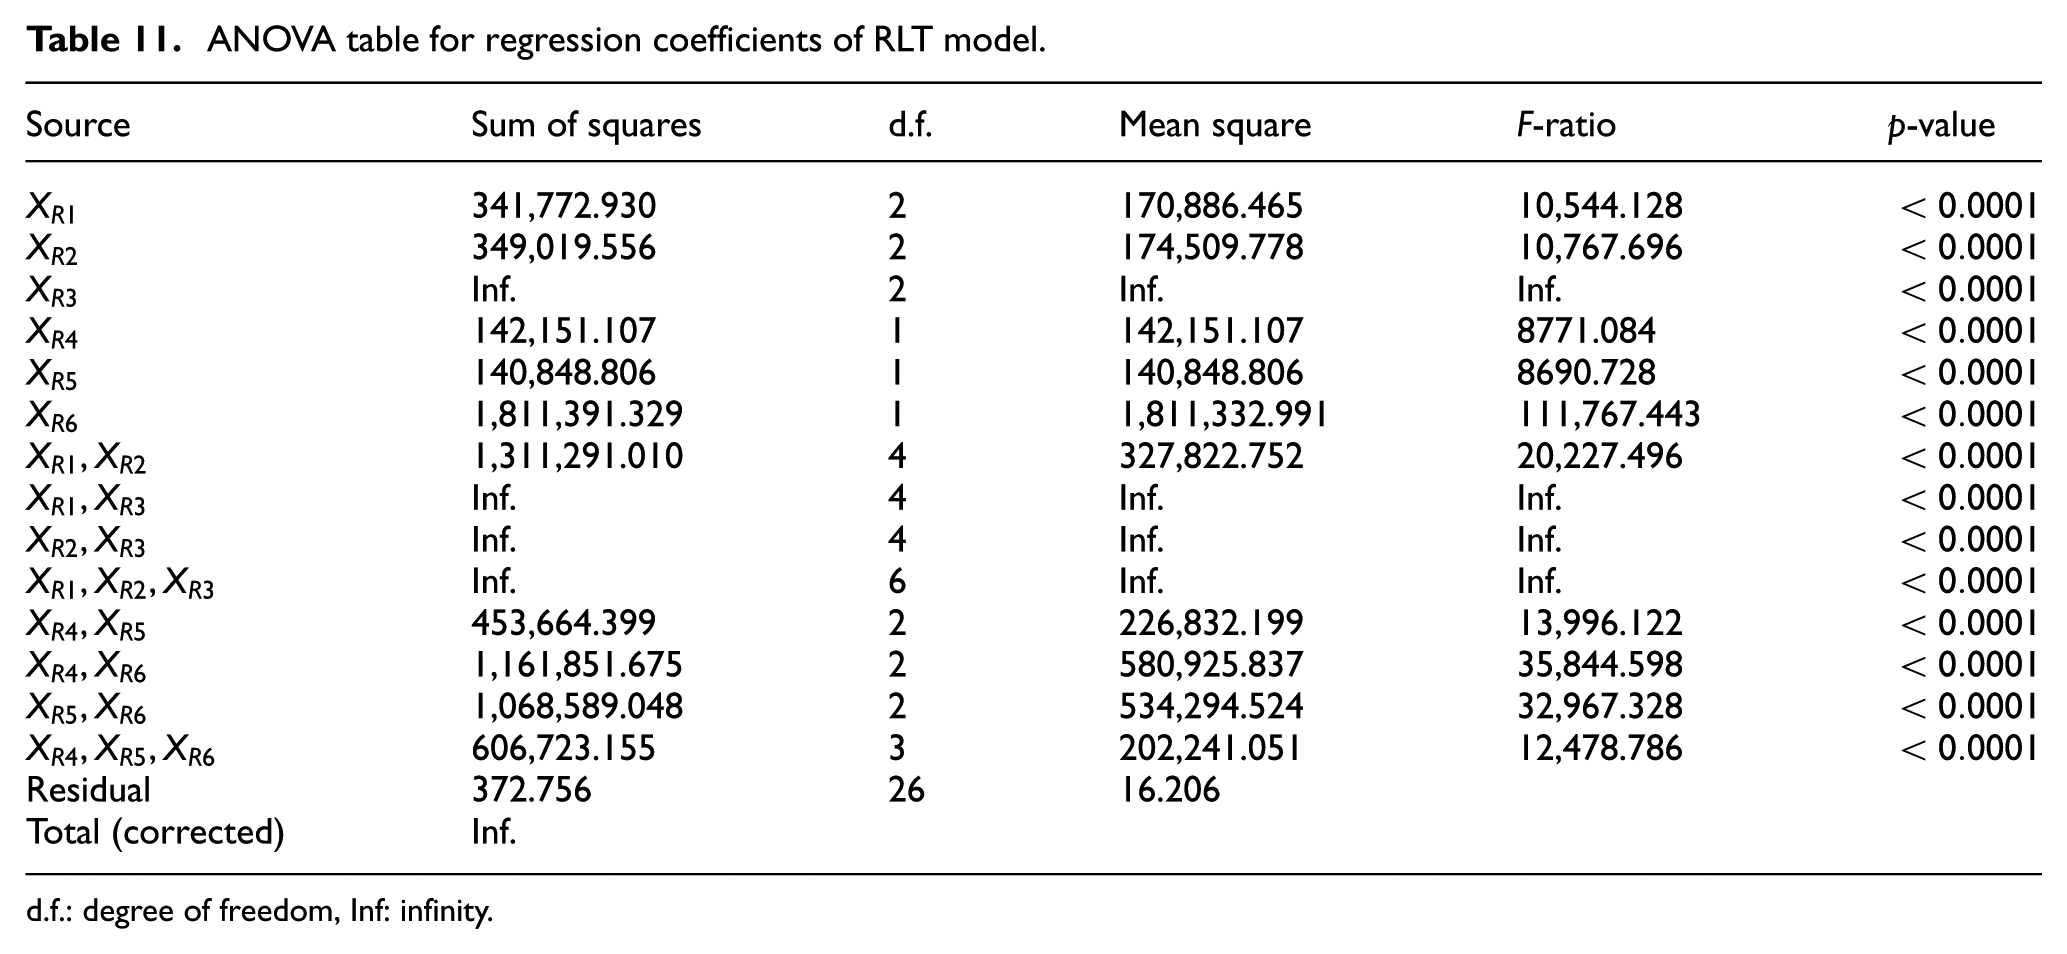
d.f.: degree of freedom, Inf: infinity.
According to the p-value in Table 10 (p < 0.0001), the model is extremely significant at confidence level of 99%.
Based on the presented data in Table 11, the considered parameters and their interactive effects are statistically significant at confidence level of 99%. In other words, the magnitude of p-value is <0.01 in assessing the adequacy of the model coefficients which indicates that the mathematical model is efficient.
Mathematical model and evaluation of PFE%
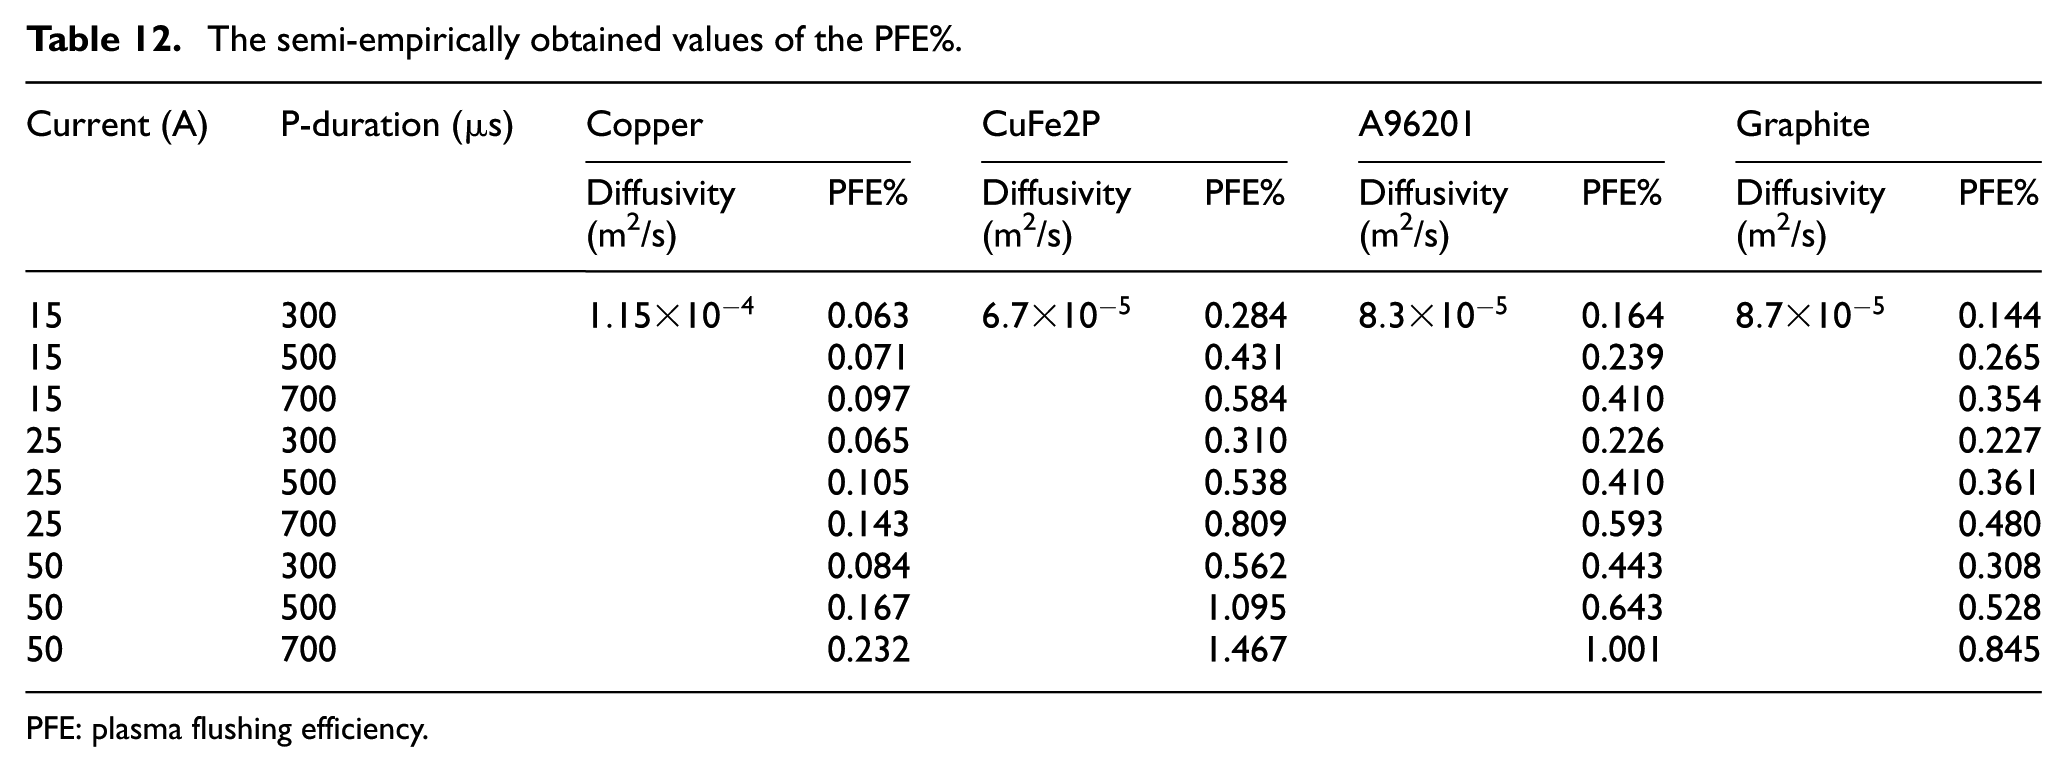
Table 12 represents the semi-empirical values of PFE which are calculated using equation (10). As it is apparent from Figure 9, the main effect plots for PFE factor, pulse current, pulse duration and thermal diffusivity are the most significant parameters in terms of PFE% variation.
The semi-empirically obtained values of the PFE%.
PFE: plasma flushing efficiency.
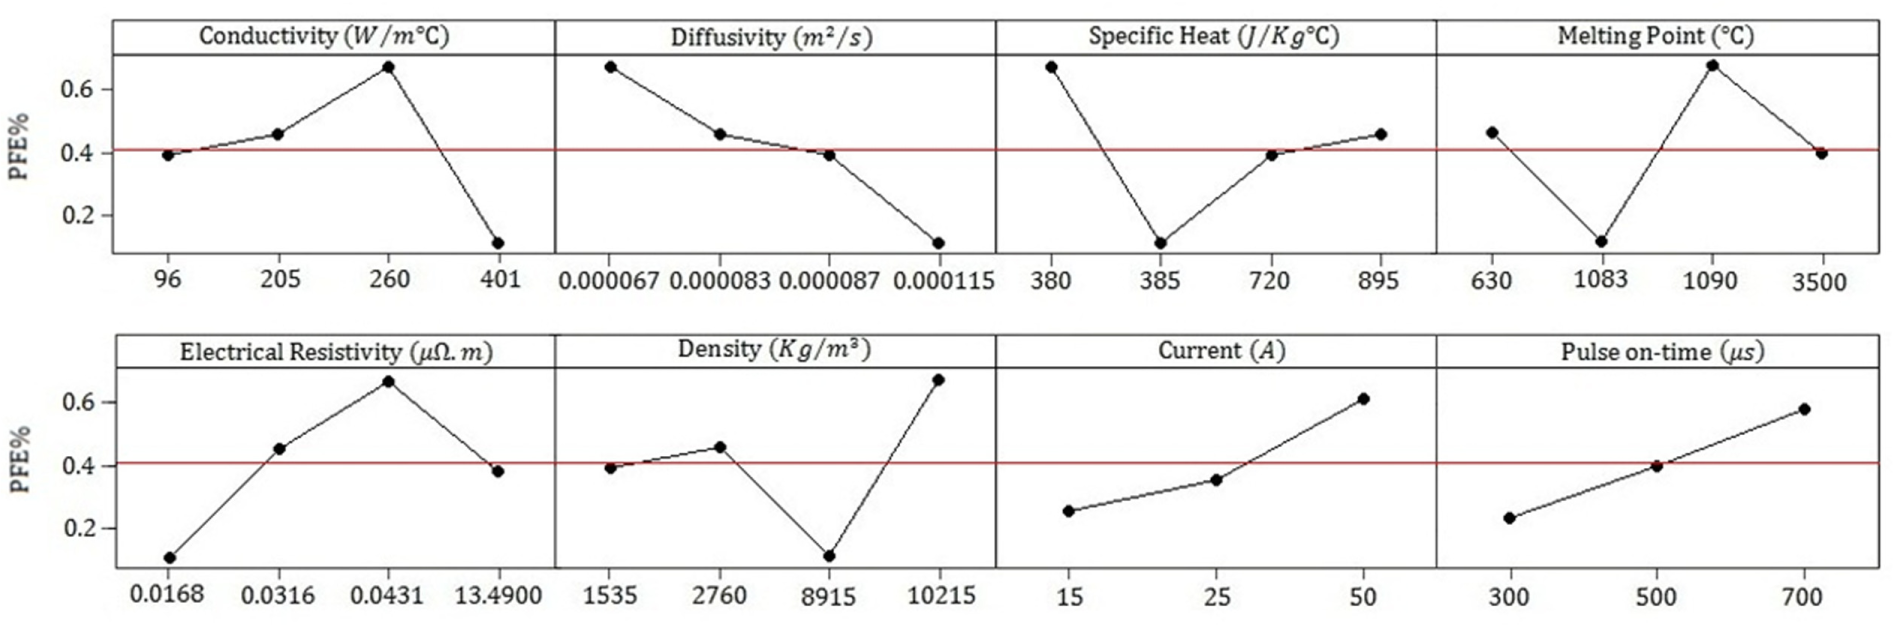
Main effect plots for PFE%.
The interactive effects of the major parameters on the PFE% are displayed in Figure 10. According to this figure, the value of PFE% is significantly reduced with thermal diffusivity reduction. However, the variation in the PFE% between the minimum and maximum values is intensified with the increase in the coefficient of diffusivity. This can be explained by the fact that as either pulse current or pulse duration increases, in combination with the increase in the thermal diffusivity coefficient, thermal energy dissipates rather faster which results in extremely large molten crater as shown in Figure 11. On the other hand, thermal diffusivity enhancement reduces the temperature, distributed within the molten puddle (see Figure 11). At these conditions, proportionally more fraction of the molten crater remains on the electrode at the end of each discharge and, consequently, PFE% factor becomes lower. This is consistent with the explanations for the variation in RLT (see section “Mathematical model and evaluation of RLT”).
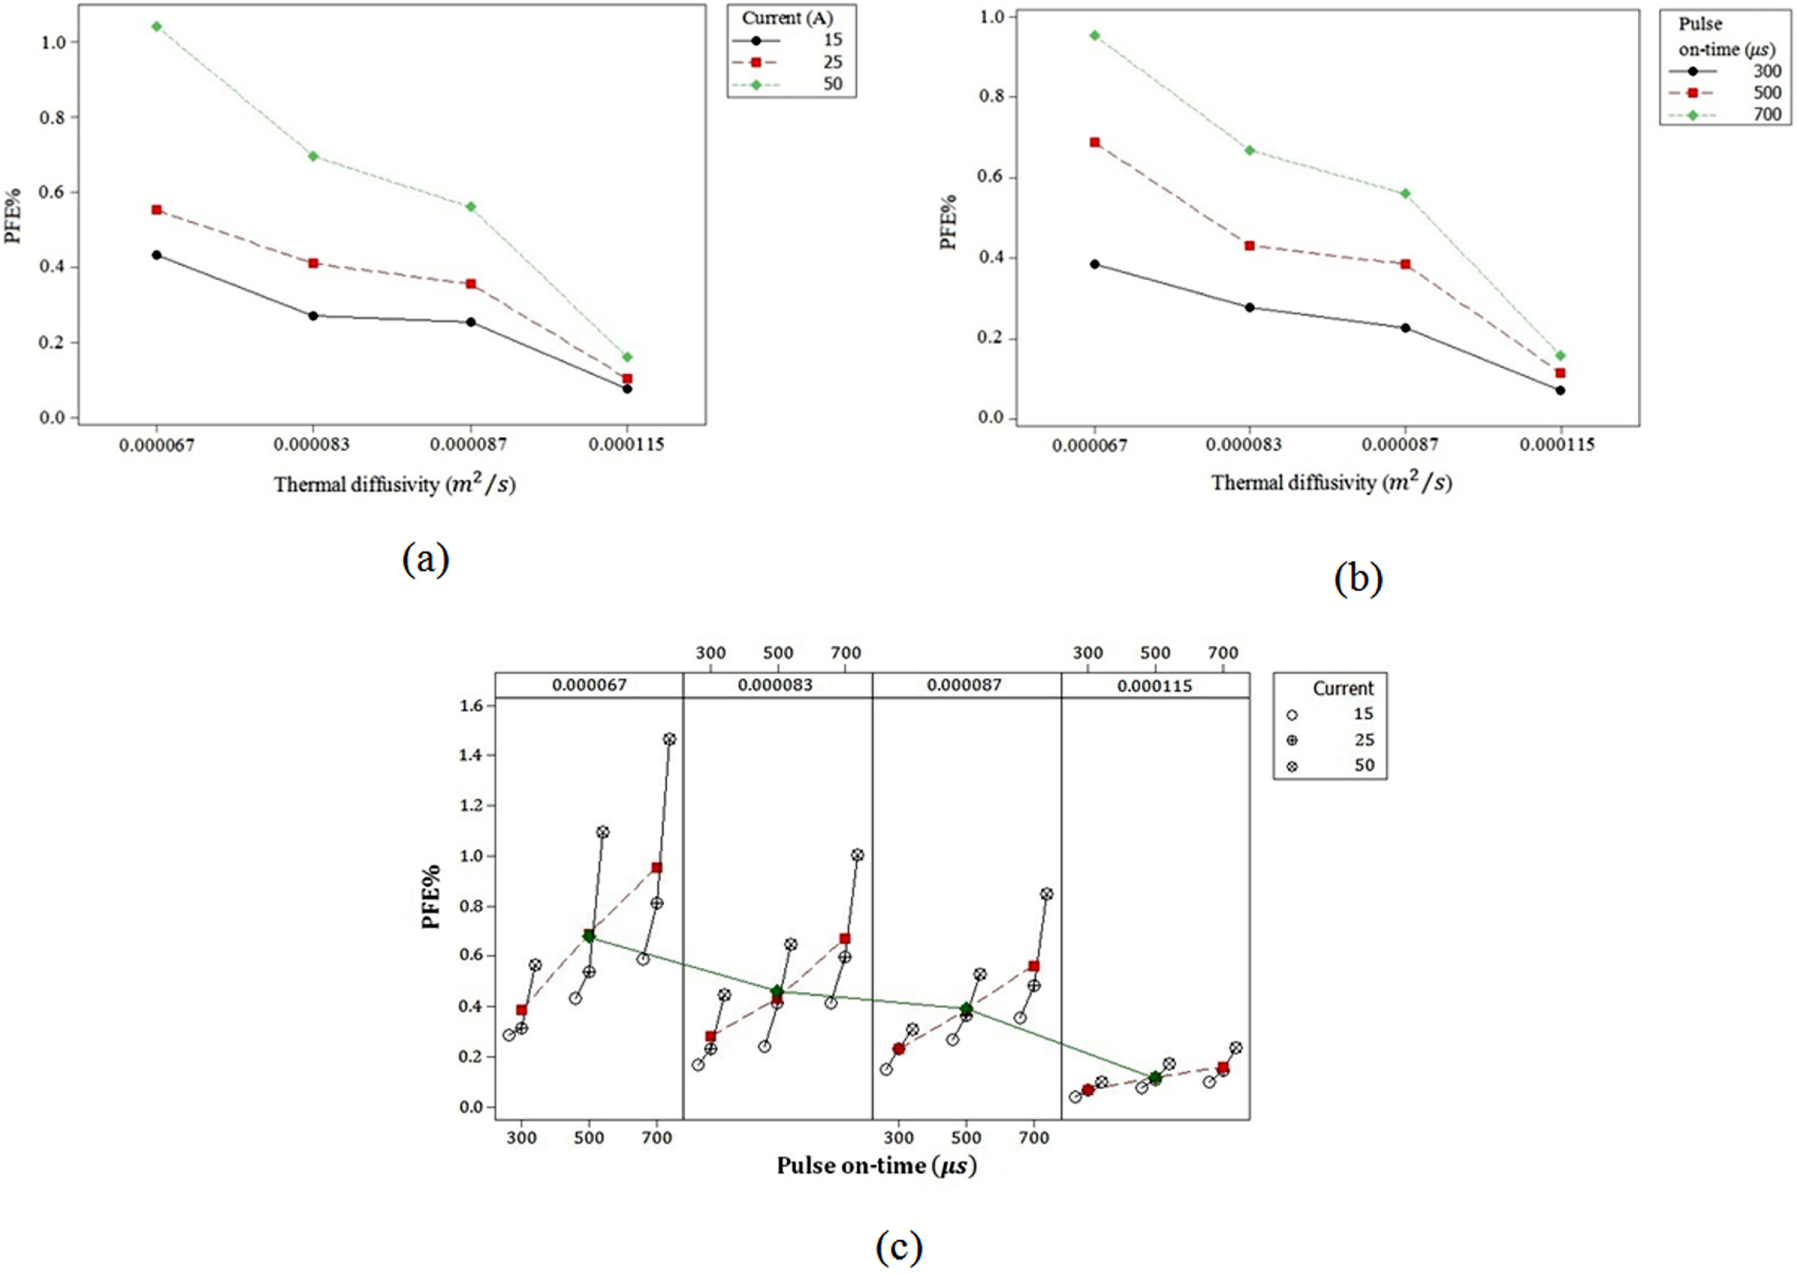
Interactive effect plots for PFE% factor: (a) pulse current, (b) pulse duration and (c) all inputs.
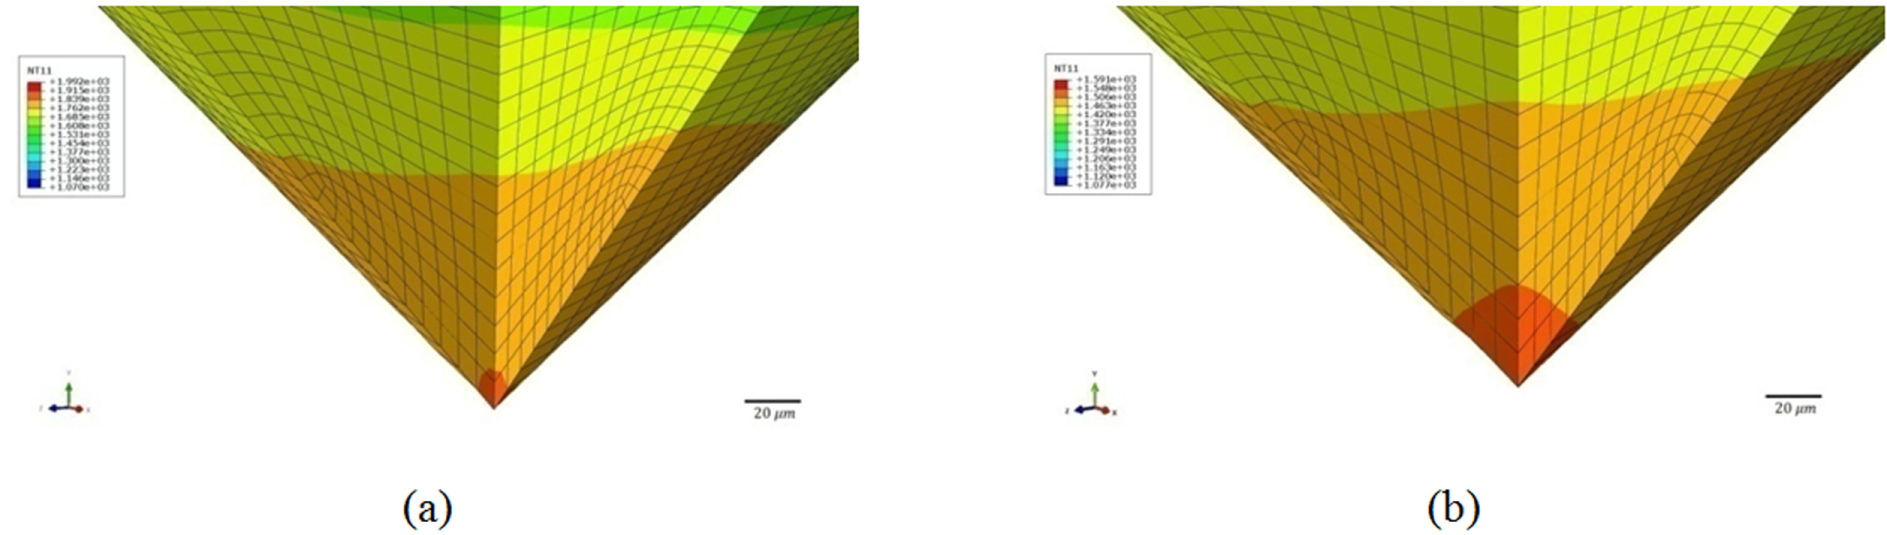
Temperature distribution in TWP model: (a) CuFe2P, current: 15 A and (b) copper, current: 50 A.
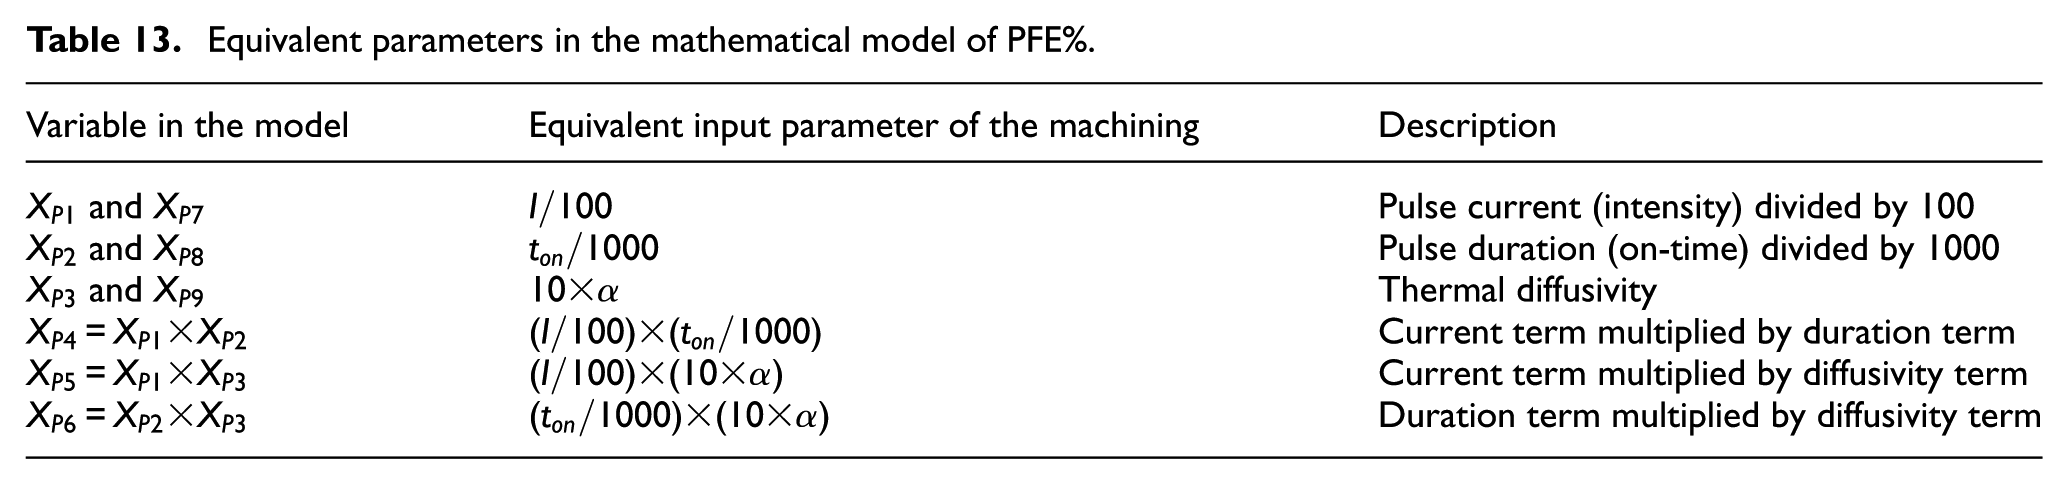
The independent variables of the mathematical model of PFE% can be considered as shown in Table 13.
Equivalent parameters in the mathematical model of PFE%.
The polynomial model of the PFE% is as follows
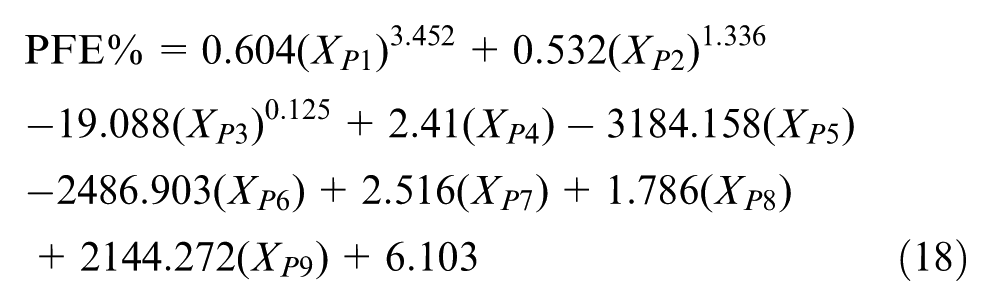
Regression statistics R2 and
ANOVA table for regression analysis of PFE% model.
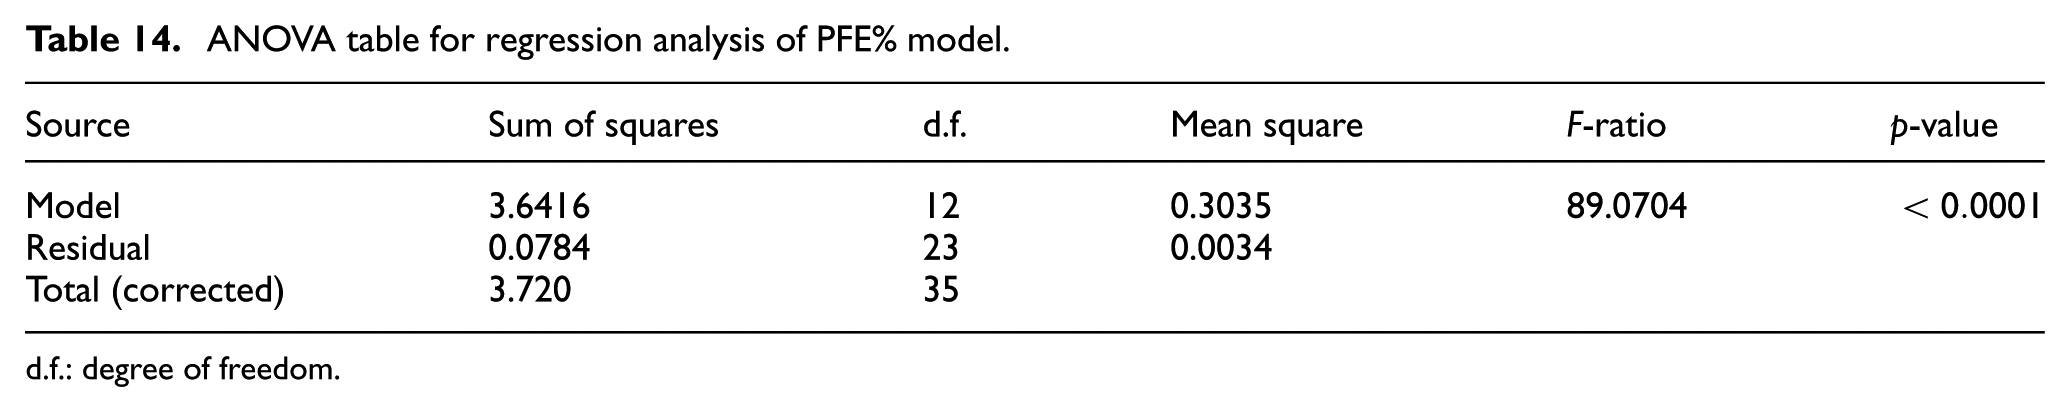
d.f.: degree of freedom.
ANOVA table for regression coefficients of PFE% model.
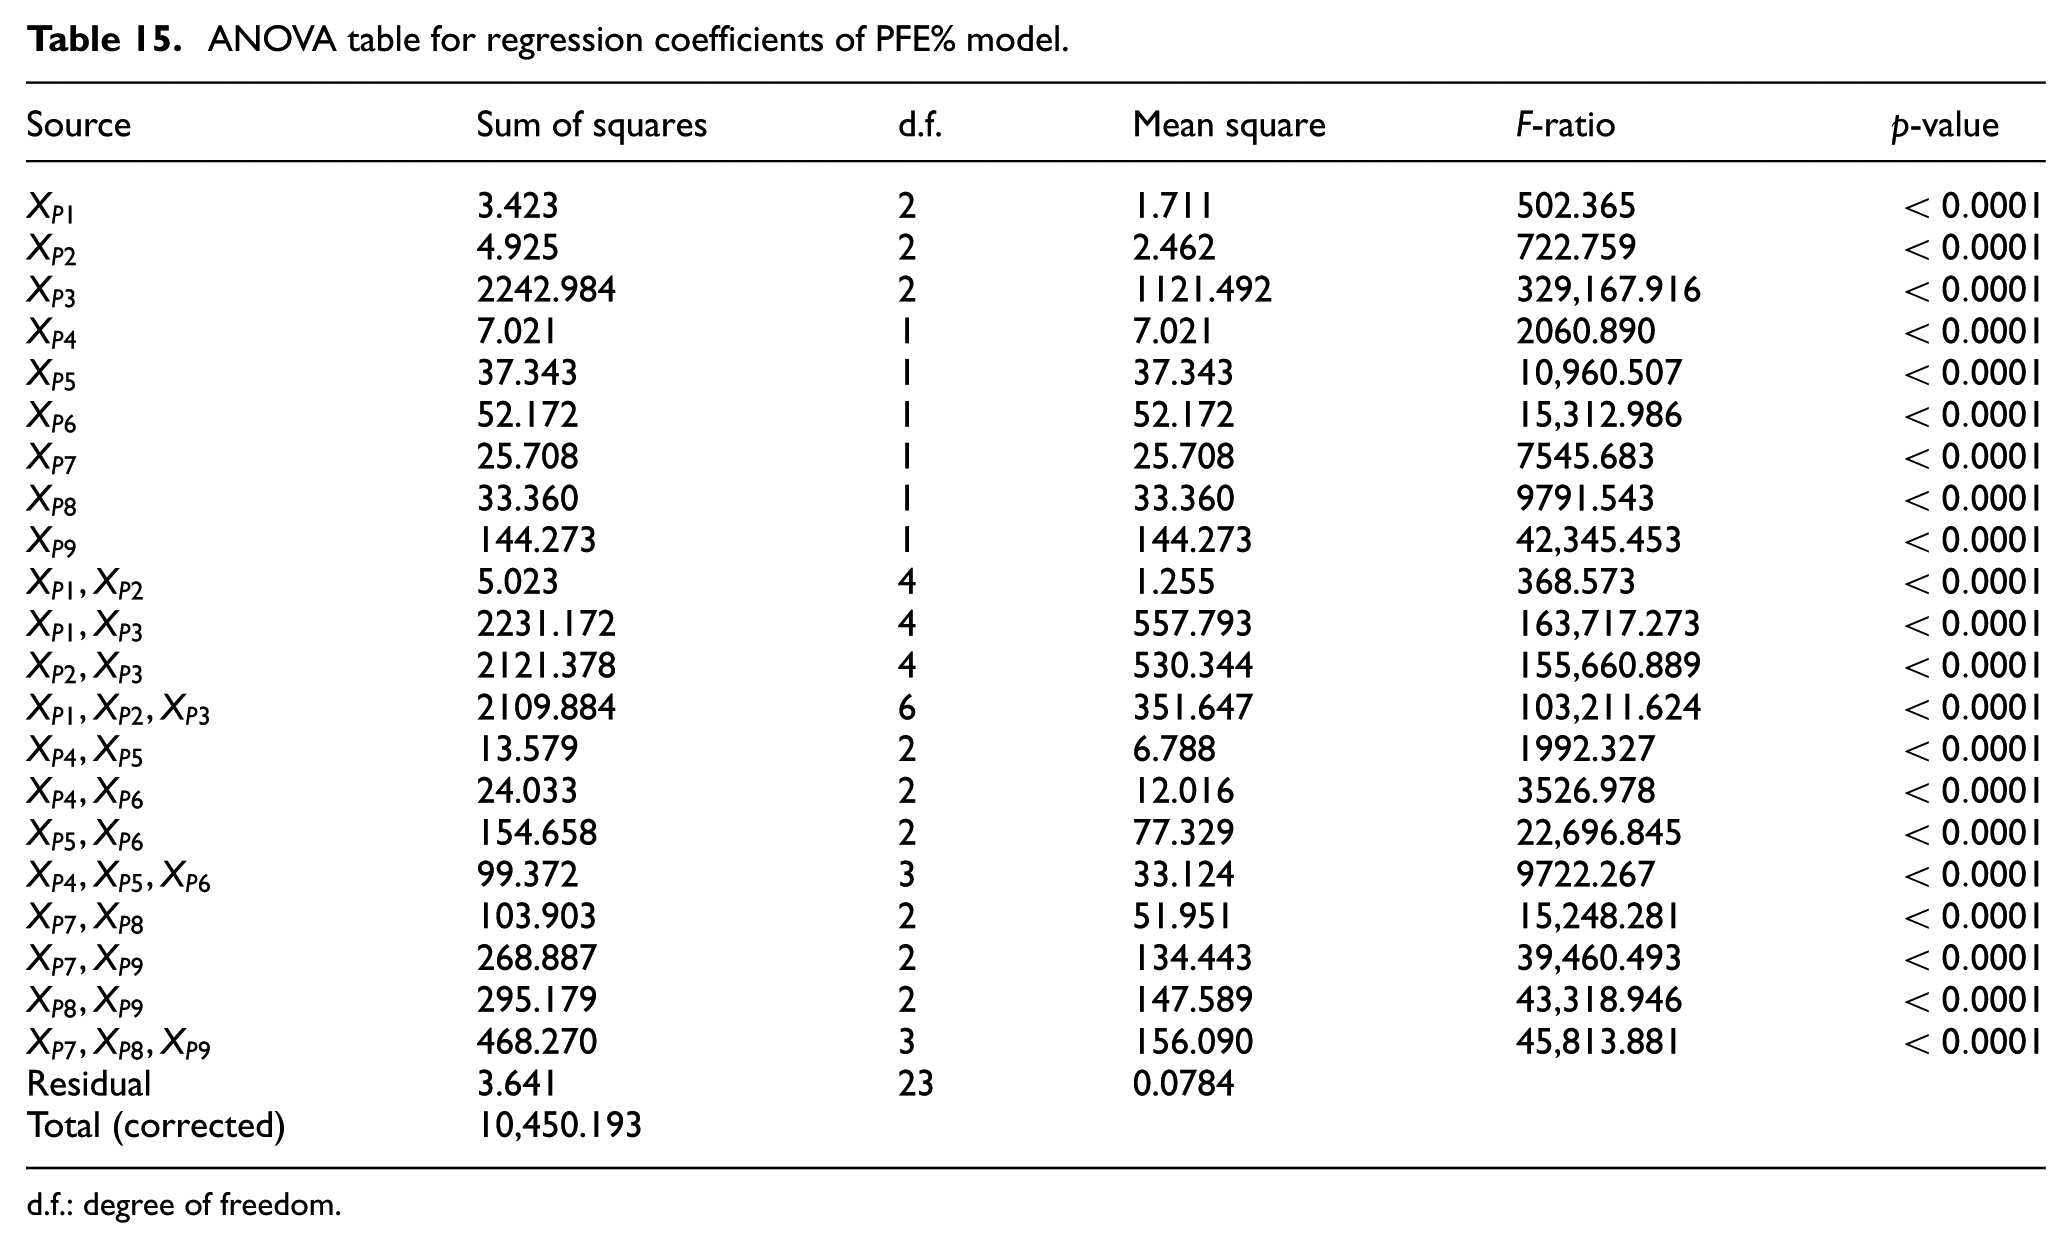
d.f.: degree of freedom.
It can be concluded from Table 15 that the model is extremely significant at confidence level of 99% because the p-value is sufficiently smaller than 0.01 (p < 0.0001).
Because the p-values in Table 15 are <0.01, it can be stated that the major parameters and their interactive effects are statistically significant at confidence level of 99%.
Mathematical model and evaluation of TW%
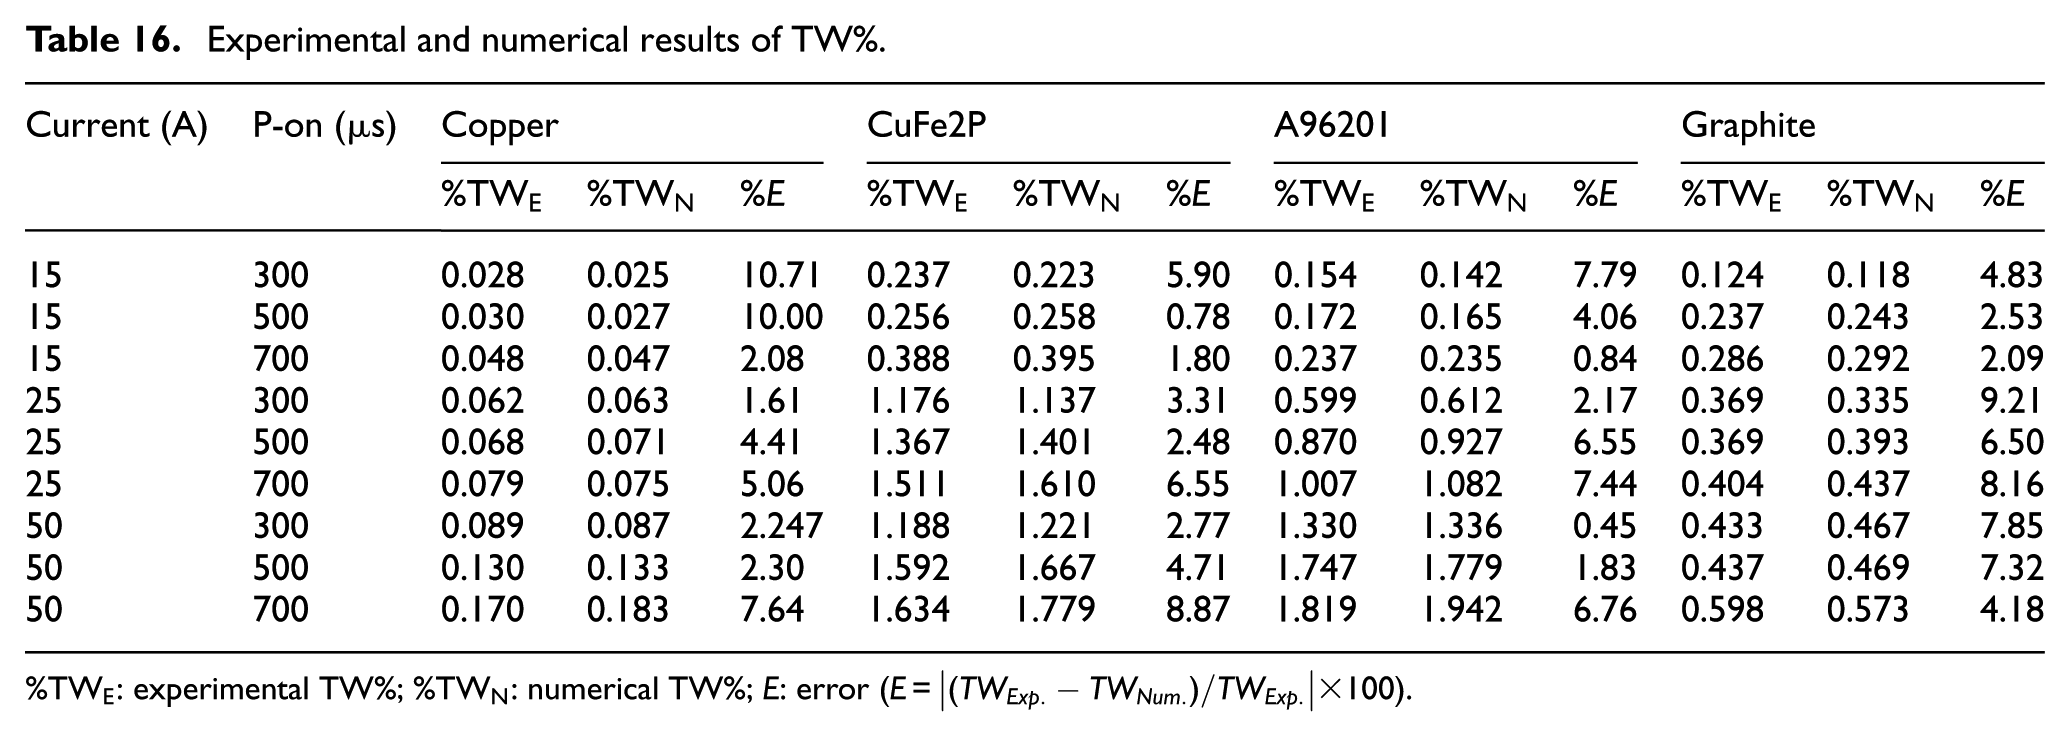
The experimental and numerical results of the tool wear are given in Table 16. Comparison of the numerical and experimental results indicates that the developed FEM-IHC technique can be effectively employed to predict the TWR with 4.83% average error. The ANOVA is used to test for the adequacy of the numerical model and is detailed in Table 17. The results of F-ratio and p-value tests prove that the model is statistically significant, and it fits well with the experimental result at confidence level of 99%. Additionally, R2 value of 0.994 indicates that the developed numerical model shows a reasonable agreement with the experimental data.
Experimental and numerical results of TW%.
ANOVA table for investigating the adequacy of the FEM-IHC technique in TW% prediction.
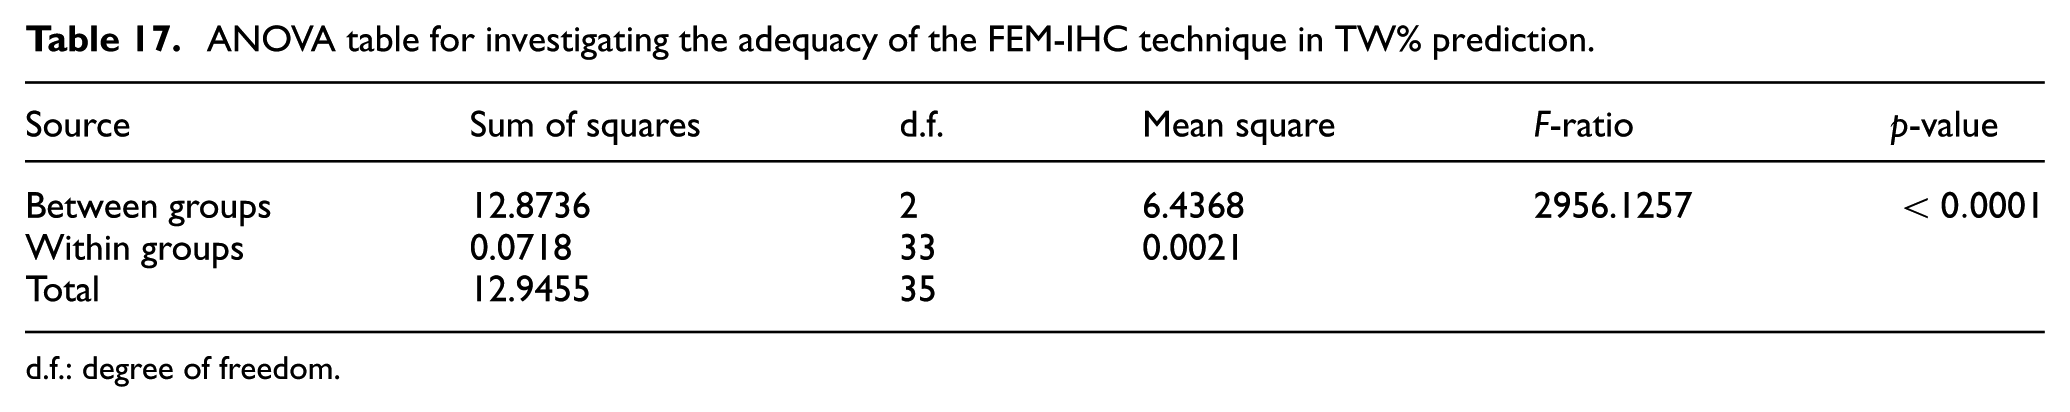
d.f.: degree of freedom.
The main effect plots for the TW% are shown in Figure 12. Based on this figure, pulse current, pulse duration and thermal diffusivity of the tool electrode are the major effective parameters in terms of TW% severity. This phenomenon can be clearly observed in Figure 13. This is because of high heat flux due to the increase in pulse current and duration, and because of low thermal energy conduction due to the decrease in thermal diffusivity. Larger heat flux and lower energy dissipation result in higher thermal energy concentration and higher temperature at the surface of the electrode which lead to higher tool wear magnitudes.
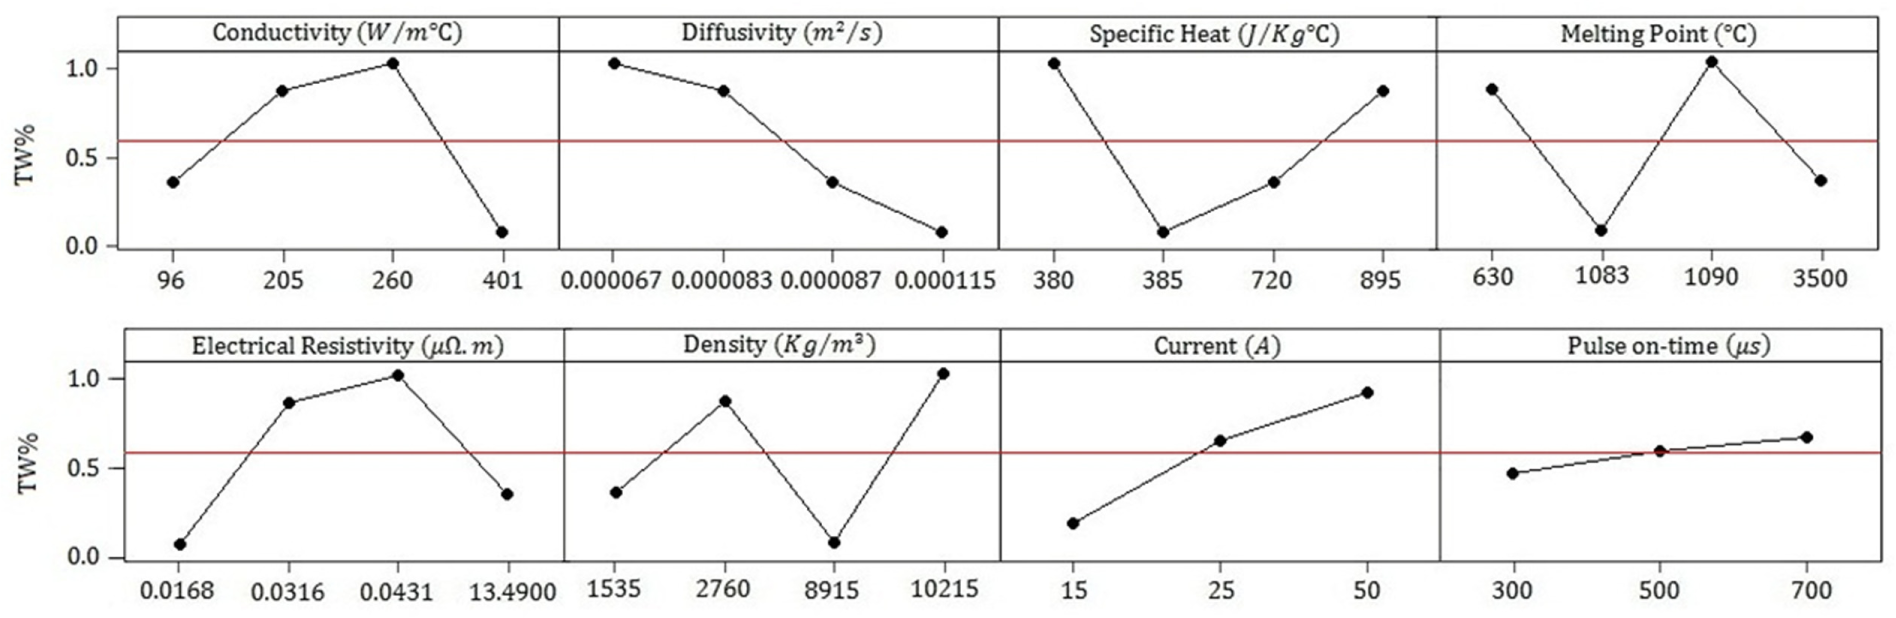
Main effect plots for TW%.
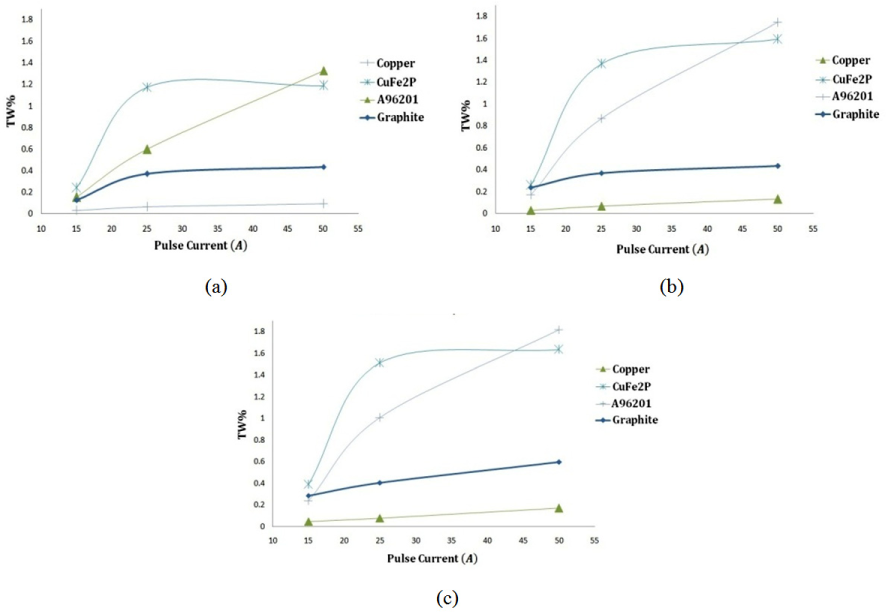
TW% variation with discharge current and duration in different electrodes: (a) duration: 300 µs, (b) duration: 500 µs and (c) duration: 700 µs.
The interactive effects of the major parameters are illustrated in Figure 14. The increase in current and pulse duration significantly affects the tool wear magnitude when the thermal diffusivity decreases. This is attributed to the fact that the increase in either pulse current or duration results in higher thermal energy production during discharge. The produced energy does not dissipate quickly through the tool electrode due to low value of thermal diffusivity. At these conditions, the temperature and extent of molten puddles increase, and accordingly, the removed fraction of molten crater becomes larger and the TW% increases.
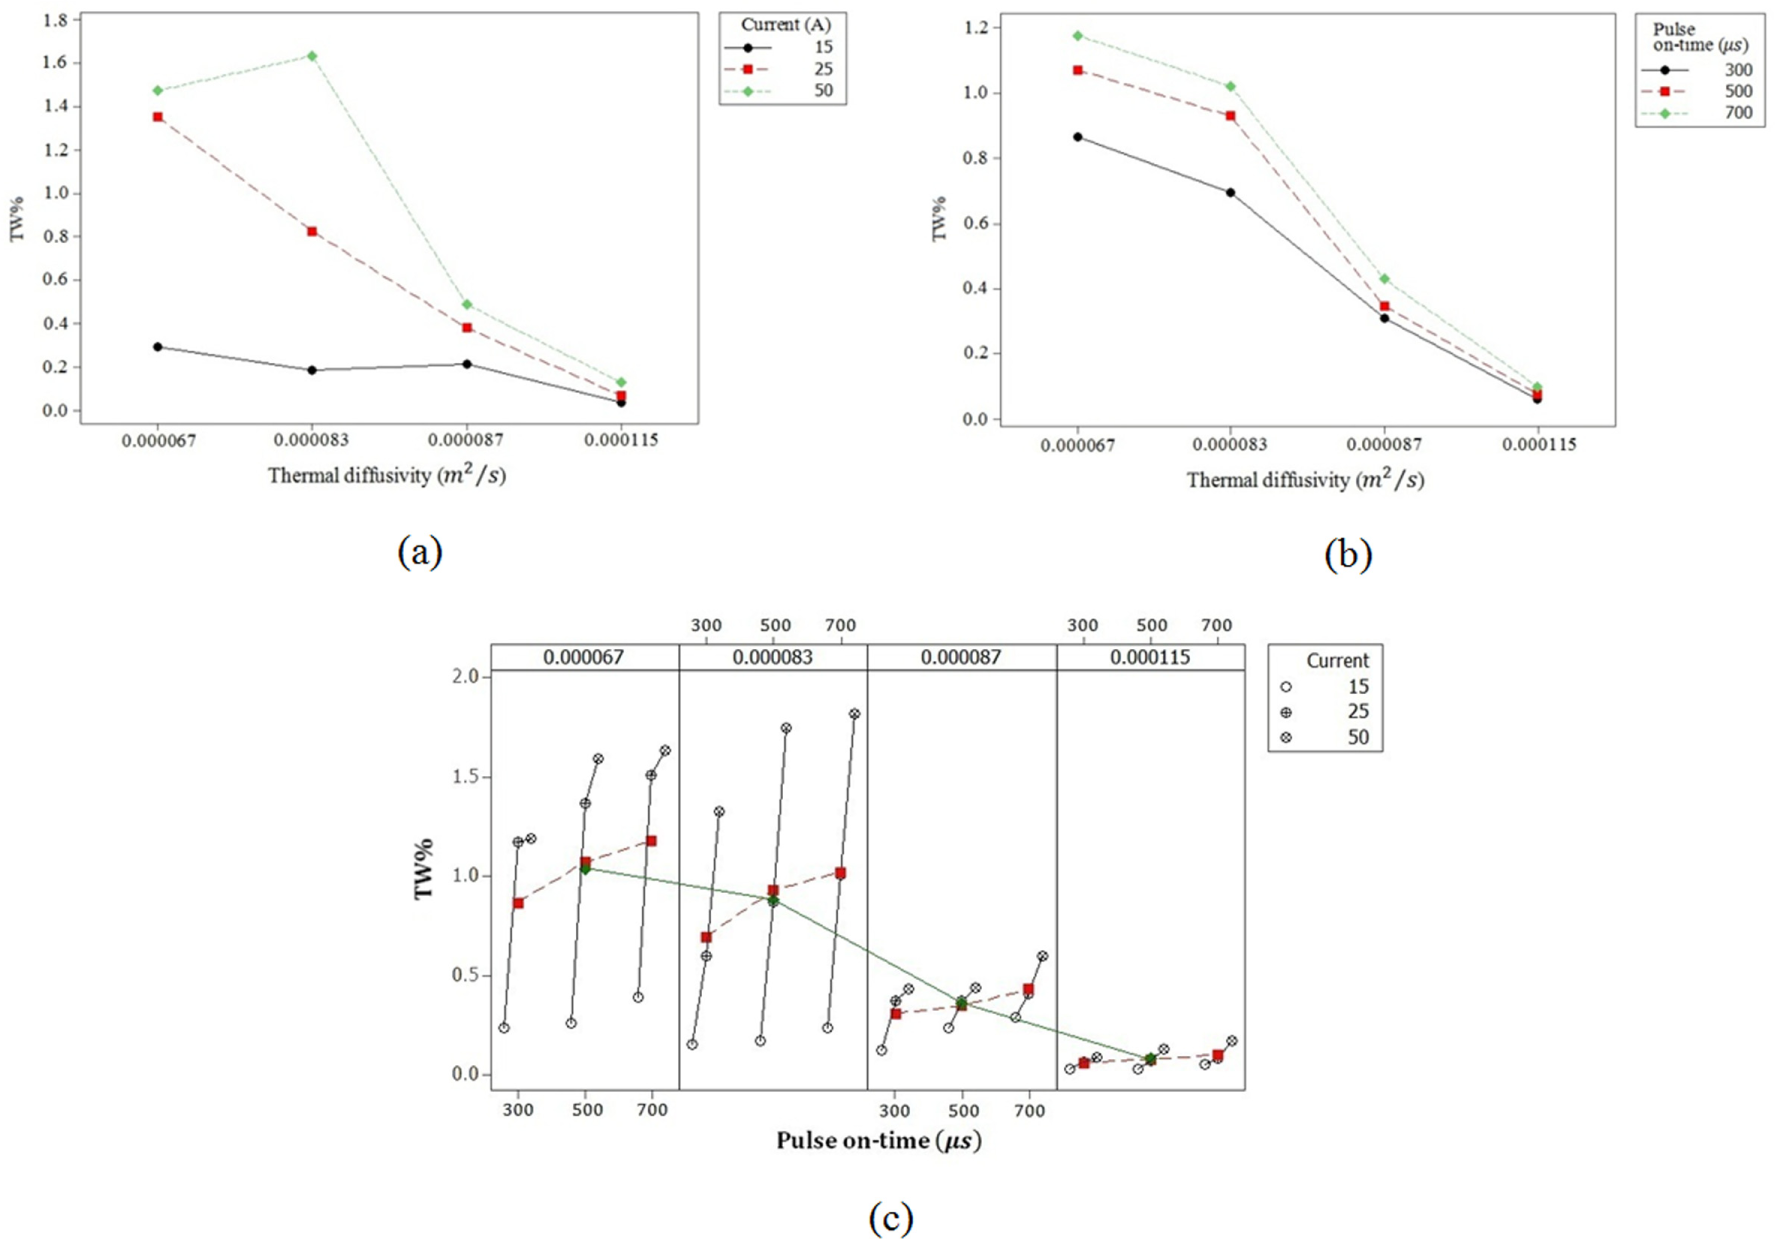
Interactive effects plot for TW%: (a) pulse current, (b) pulse duration and (c) all inputs.
According to the experimental, numerical and mathematical results and via comparing the effects of thermo-electro-physical conditions on the machining outputs, it can be concluded that the copper electrode is recommended from the tool wear efficiency aspect. Comparative analyses of the results indicate that performing machining operations with lower pulse on-time and current lead to lower wear condition of the tool electrodes. Additionally, the combination of copper tool electrode (higher thermal diffusivity), shorter pulse on-time and lower pulse current significantly reduces the tool wear and is recommended as the most efficient machining setting in finishing process. On the other hand, to perform rough machining operation without the tool wear consideration, the combination of the CuFe2P tool electrode, longer pulse duration and higher discharge current may be used.
Overall, through the comparative analyses between the experimental and numerical results, it can be concluded that the suggested analytical–numerical model is capable of properly estimating the tool wear ratio of the tool electrodes via considering direct and interactive effects of the thermal, electrical and physical variables of the EDM process.
Conclusion
In this study, a comprehensive numerical model, based on FEM-IHC method, is introduced to estimate the tool wear in the EDM process. In this technique, the individual and interactive effects of the thermo-physical and electro-physical parameters were taken into account and the improvement factors were modeled. The thermo-electro-physical variables affecting the tool wear and modeling improvement parameters are identified experimentally and statistically by performing the experiments with different pulse current, pulse duration and tool materials and by using ANOVA technique, respectively. The summarized conclusions are as follows:
According to the experimental and numerical results, thermal diffusivity of the tool electrode, pulse current and pulse duration parameters individually and interactively affect the tool wear extent significantly.
Comparison of the numerical and experimental data indicates that the developed FEM-IHC technique is capable of estimating the tool wear with average error of 4.83%.
The results show that the modeling improvement factors are extremely dependent on the thermo-electro-physical variables of the EDM process which significantly modify the numerical method to predict the tool wear magnitude precisely.
The model adequacy assessment techniques proved that the introduced mathematical model for AF prediction explains almost 96.9% of variance in the actual data, and the model predicts AF with 4.01% average error through considering individual and interactive effects of the major thermo-electro-physical parameters.
The correlated model of RLT accounts for 97.8% of the variability in RLT values and estimates the variable with 3.96% average error.
The modeling improvement factor of PFE% experimentally and statistically depends on thermal diffusivity, pulse current and pulse duration parameters and the introduced model fits with the semi-empirical data with 97.9% accounted variability.
Since the numerical results accurately coincide with the experimental observations, it can be concluded that the developed FEM-IHC technique can be employed to estimate the tool wear in a variety of thermo-physical and electro-physical variable combinations.
Footnotes
Acknowledgements
This study is indebted to Professor T.B. Navid Chakharlu for his advices. The authors of this article owe their deep gratefulness to Mr Younes Valipour Rozekhan, the chief of Poolad Technique workshop. Also, the authors thank Eng. Mirsadegh Seyedzavvar and Eng. Sina Akhbari for their indelible help. The authors also appreciate the help of Eng. Mohammadhossein Zarif, the technician of scanning electro microscopy laboratory of Sahand University of Technology.
Declaration of conflicting interests
The author(s) declared no potential conflicts of interest with respect to the research, authorship and/or publication of this article.
Funding
The author(s) received no financial support for the research, authorship and/or publication of this article.