
Abstract
The manufacturing industry is increasingly accountable for the environmental impact resulting from its activities. Research indicates that specific production processes within manufacturing plants generate significant environmental impact through energy consumption. To understand the consumption of energy in a production environment, it is necessary to outline the energy flow within the facility, along with the classification of energy usage and its relationship to processes and production outputs. It is also important to identify auxiliary (non-value added) energy within production as the area with the greatest potential for savings through changes in operational behaviour. This article introduces a practical process mapping methodology that combines energy management with value stream mapping. The methodology is based on ‘Lean’ manufacturing principles and on application to a couple of industry use cases has been shown to successfully illustrate the relationship between the energy usage and production activities for a particular value stream. Furthermore, the significant energy users in relation to the actual production process steps have been identified, and energy reduction opportunities of 42% and 50% have been quantified.
Keywords
Introduction
According to the World Energy Outlook Report (WEOR),
1
worldwide, industry consumes almost one-half of all commercial energy used and is responsible for roughly similar shares of greenhouse gases. Specifically from the report, manufacturing accounted for 37% of primary energy use worldwide in 2012 and for 40% of electricity consumption in Europe. In terms of energy consumption in industry, the WEOR
1
notes that
The industry sector is very complex, and a detailed understanding of the various processes or product types is necessary to monitor energy efficiency.
According to the 2014 Energy Efficiency Market Report, 2 even with the energy efficiency initiatives that are underway, it is estimated that worldwide energy consumption in industry will rise by another 20% between 2012 and 2020. With a growing energy demand and a requirement for diverse energy sources, there has been an increase in the regulatory and legislative activity intended to minimise the environmental impact from energy-use in industry. With this, the importance of energy efficiency has grown within manufacturing environments and it is now considered among other decision-making factors such as productivity, cost and flexibility. 3
To meet environmental legislative requirements, manufacturing industry must be capable of understanding its energy requirements, its energy consumption and the manner in which this is managed, particularly in the production environment. While there are various energy management tools available, these tools are complex and require large levels of data and technical expertise to use. 4 This article proposes a practical and less-complex methodology for the assessment of energy usage in a production environment. The methodology uses the ‘Lean’ manufacturing principle of value stream mapping (VSM) with energy management and upon application to a standard manufacturing site outlines the process flow, energy metering requirements, the technical services supporting the process and identification of the relevant process significant energy users (SEUs). The methodology allows a manufacturing company to visualise their production process from an energy perspective and determine the next steps for improvements in energy management and cost reduction.
Energy flows and classification in production operations
Production processes consume raw materials and transform them into products and wanted or unwanted by-products and often use a significant amount of energy to do so. Some of this energy is used for value-added activities embodied into the form and composition of products, while the rest of the energy is wasted in terms of heat losses and emissions. To understand the consumption of energy in a production environment, it is necessary to outline the energy flow within an industrial facility, shown in Figure 1 below, along with the classification of energy usage and its relationship to processes and production outputs.
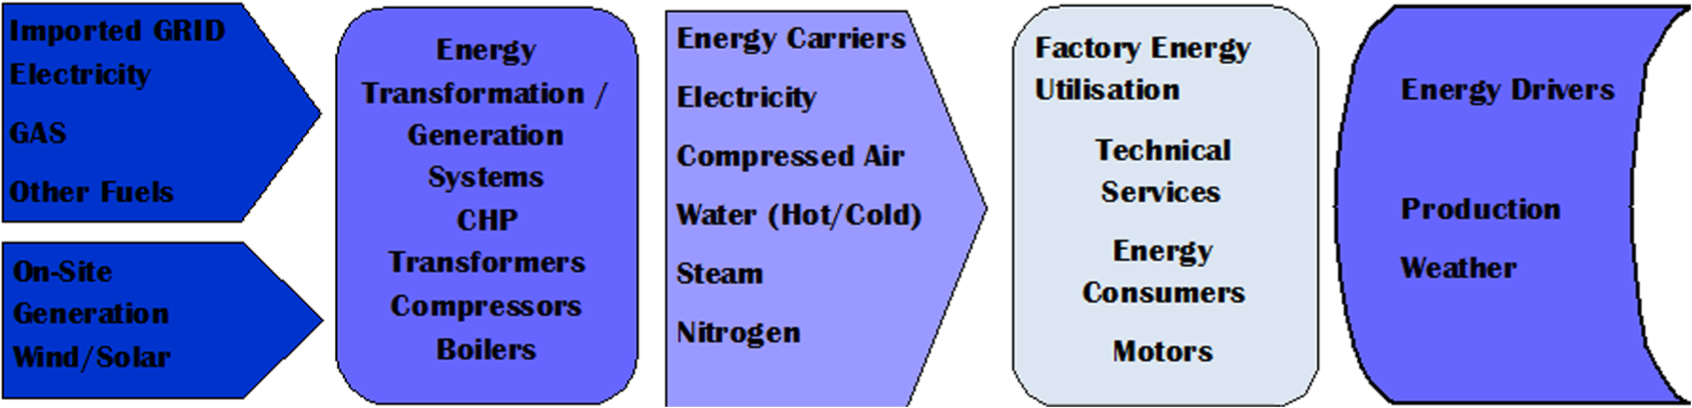
Energy flows in an industrial facility.
Previous research on manufacturing energy consumption has focused on developing more energy-efficient machines/processes. 5 However, the energy requirement for the active removal/joining of materials can be quite small compared to the background functions needed for the overall operation of the manufacturing system. Drake et al. 6 showed that there are significant amounts of energy associated with machine start-up and machine idling. As a result, in a mass production environment, more than 85% of the energy is used for functions that are not directly related to the production of parts. 7 Müller et al. 8 demonstrated in laboratory tests that only 8% of the energy consumption in a milling machine was used for the value-adding activity of material removal.
Salonitis and Ball 4 report that a common characteristic of almost all manufacturing processes (both conventional and non-conventional ones) is that even when the machine is idle, it is consuming more than 50% of its maximum power. This suggests that energy-saving efforts which focus solely on updating individual machines or processes may be missing a significant and perhaps bigger opportunity.
Other studies9,10 carried out in industries such as dairy, meat processing and textiles have focused on industrial energy use and energy efficiency particularly from upgrades of facilities and technical services with little attention focused on the energy usage at process and equipment level. Rahimifard et al. 11 conclude that the lack of understanding between production operations and energy usage prevents energy-efficient decision-making in real time and a more holistic mapping of the relationship between production and energy consumption is required.
A review of methodologies by Bunse et al. 12 for integrating energy efficiency performance in production management highlighted that most industrial companies still lack appropriate methods to effectively address energy efficiency in a comprehensive and practical manner. They summarised the reasons for the gap between industrial needs and scientific literature as primarily due to
The complexity of production sites that due to business needs operate more than one production process.
Production sites may produce various types of products, each with different energy intensity factors.
Specific energy consumption depends on the production rate and SEUs are typically viewed in isolation from production operations rather than in conjunction with it (i.e. cycle time and energy usage analysed together to determine process SEUs).
Comparing different installations (i.e. process equipment and technical services upgrades) using energy efficiency indicators can lead to misleading conclusions, when attempting to take all variables associated with energy efficiency into account.
The analysis of thermal energy is considerably more complicated in practice than the analysis of electrical usage. 12
Herrmann et al. 13 proposed work that focused on the optimisation of the process chain with the objective of securing the best electric energy efficiency. The Herrmann et al.’s study proposes a five-step approach to increasing energy and resource efficiency in industry using a simulation model. These steps include (1) analysis of production process chain, (2) energy analysis of production and its equipment, (3) energy analysis of technical building services, (4) load profile and energy cost/energy supply contract analysis and (5) integrated simulation and evaluation of the production system. 13 However, Herrmann et al.’s research was not extended to an industrial facility or practical application. Vikhorev et al. 14 propose a framework for advanced industrial energy management by continuously obtaining energy-related information and combining it with enterprise wide information (i.e. Manufacturing Execution System (MES)) to give real-time energy usage at each production asset for each defined operating state. Vikhorev et al. 14 also highlight the additional benefits of performance metric calculations in real time, in terms of problem diagnosis and resolution and providing good visual representations of data.
Seow and Rahimifard 15 provide a product perspective of energy monitoring and attribute the energy consumed by the product to both the process and the plant. According to the framework developed by Seow and Rahimifard, energy consumption in manufacturing can be categorised into direct energy (DE) and indirect energy (IE), which together constitute the embodied energy of a product. DE is the energy required to manufacture a product in a specific process and can be subdivided further into theoretical energy (TE), the energy necessary for actual value creation, and auxiliary energy (AE), the energy required by supporting activities for the individual machine/process. IE is defined as the energy necessary to maintain the production environment (lighting, heating, ventilation, etc.). 15 This approach has been extended by Mustafaraj et al. 16 with a more defined energy breakdown as shown in Figure 2. The energy breakdown is applicable to a large-scale manufacturing company, typically one with traditional precision manufacturing processes, where multiple products require equipment or processes from multiple value streams or strategic business units (SBUs). The proposed energy breakdown illustrates how the overall energy consumed by an industrial facility is divided into IE and DE. The IE consists of all energy used to maintain the building/facility working conditions, such as lighting and ventilation, required to enable operations to take place that are not directly used by production. The DE relates to the production-dependent energy. This is subdivided into value-added energy and AE. The value-added energy consists of the energy utilised by each process to carry out an operation that increases the value of the process, for example, the energy used by a milling machine to remove material from a product. The AE is the energy consumed by each process that is not necessarily contributing to the formation of a product, for example, idle running of the machine and supply of technical services during idle time. The proposed energy breakdown draws particular attention to the AE usage and the potential areas in the factory where energy-efficiency measures can be introduced based on operational and behavioural changes in production operations. This proposed energy breakdown allows decision makers a more holistic view of energy usage in an industrial facility, with the focus on the potential for reduction through behavioural and operational change.
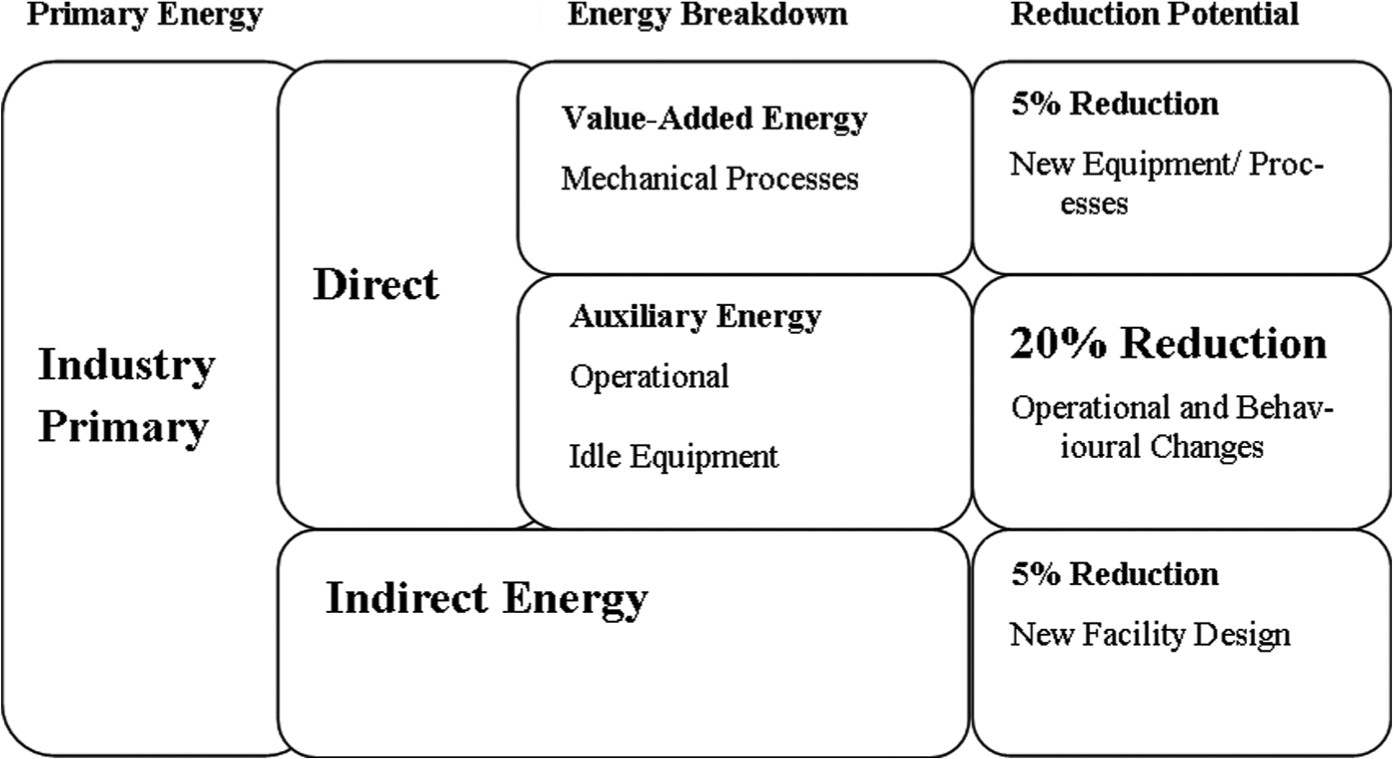
Proposed energy breakdown methodology.
Information from an industrial study 17 in Ireland established that the relative percentage of DE versus IE usage on a large manufacturing site was 57% (DE) to 43% (AE), respectively. In other words, 57% of the energy consumption went towards making the products, and 43% of the total energy consumption went towards supporting the production environment. The DE usage was then analysed into either the value-added energy or the AE. In this case study, the value-added energy accounts for 31% of overall energy usage, and the AE accounts for 26% of overall energy usage. 17 To identify this AE within a production environment for potential cost reductions, this article describes a practical methodology which is a combination of energy management and the lean principle of VSM.
Combining energy management and VSM
Energy management focuses on the systematic use of management and technology to improve energy performance in a selected site. VSM, 18 a widely used tool of lean manufacturing, is a type of symbolic model that graphically enables the end user to observe the material and information flow as a product or service travels through a value chain. The model represents the flow of products within the factory along with their consumption of energy and technical services at each process step. It allows the visualisation of all the manufacturing system, rather than just the equipment. 11 Wormak and Jones 19 suggest that one of the five key principles of lean thinking philosophy is to target the complete elimination of waste with the aim that all activities across a value stream create value.
Based on the principle that VSMs serve as a magnifying glass to view the whole manufacturing system, Fraizer 20 has proposed the use of the ‘concept of value’ and the VSM tool as a means of determining energy consumption in a current state. In particular, the work focuses on determining the energy characteristics of the process. Kayakutlu et al. 21 propose the use of Bayesian causal maps which incorporate probabilistic graphical models as a means of analysing VSM relationships. Bayesian networks causal maps 22 are the representation of thoughts in relation to a particular subject expressed in nodes and arrows, mainly constructed through interviews and analysis, representing the beliefs, values and expertise of decision makers of the particular subject discussed. Despite the fact that a Bayesian network has several advantages for making inferences, particularly for data with missing values, 23 it is a complicated technique that requires training and expert knowledge in the subject.
Paju et al. 24 suggest the concept of sustainable manufacturing mapping (SMM). This is based on the combination of VSM, life-cycle assessment (LCA) and discrete event simulation (DES) to provide a highly visual model that allows for the assessment of sustainability indicators in manufacturing. The main outcomes of SMM are described as goal definition, identification for sustainability indicators and modelling of current and future state process maps. Despite the robustness of the SMM research, the goal-oriented approach appears very complicated, as the assessment does not use the same indicators every time to carry out an evaluation. In larger multinational companies, where each value stream or SBU operate as ‘small factories,’ it could be difficult to compare performance against one another or even set targets for the company as a whole if the indicators are not standardised across the board.
Müller et al. 8 highlight that existing methods do not sufficiently deal with the dual assessment of the time and energy input referring only to the criteria of value-adding or not. Müller et al. 8 state that the energy used during a non value-adding process necessarily has to be regarded as waste (of energy). Despeisse et al. 25 identified that there are no tools or techniques that effectively show an integrated view of materials, energy and time in a manufacturing ecosystem model, and they describe how qualitative and then quantitative evaluation of resource flows over time is required.
The use of VSM and energy management has been trialled in certain industries in the United States. 18 This has been supported by the US Environment Protection Agency in the development of the ‘Lean, Energy and Climate (LEC) Toolkit’. 26 This toolkit provides strategies and techniques to improve energy and environmental performance in tandem with achieving leans goals such as quality, reduced waste and improved customer responsiveness. Despite the fact that the LEC toolkit provides significant information in relation to lean principles, energy monitoring and targeting, and greenhouse emissions management, the methodology and tools are still quite complicated and detailed knowledge of VSM is required to understand and use it.
The methodologies described above have limited application in practice due to the complexity and expert knowledge necessary for their implementation. While the process mapping methodology proposed in this article follows the basic principles of VSM and encompasses the concept that production is multi-dimensional and that system dynamics are critical to the evaluation of a production area, it is based on visual structures that are common place in production environments and provides managers and operators clarity on the direct and indirect factors that drive energy consumption in production.
Generic process mapping methodology
The primary aim of the proposed process mapping methodology, which is part of a Professional Doctorate research project for the first author (J.C.), is to effectively acquire production and energy data from a production environment that could be analysed to provide both steady-state and dynamic energy consumption and potentially provide a multi-dimensional hierarchical view of this energy consumption and cost directly related to production equipment.
The proposed methodology was designed around the following principles:
The methodology is not related or restricted to a specific case but generic in nature and applicable to diverse manufacturing types (i.e. continuous and discrete manufacturing).
The methodology pursues a holistic perspective of the relationship between manufacturing processes and energy consumption, including all relevant process and energy flows as well as their interdependencies.
The methodology is flexible so that it can be applicable to small- and medium-sized enterprises typically facing obstacles towards energy-efficiency measures and the use of simulation.
The methodology can provide multi-dimensional evaluation of improvement measures in all relevant fields of actions.
The methodology can adapt to an ever-changing production environment such as equipment relocation or process improvement.
The methodology consists of five main steps outlined below. These steps are generally applied to one value stream or SBU to create a process map but can be scaled up and/or aggregated to factory level, providing the overall production process and energy usage of a factory. Two necessary components are (1) a clear quantification of the unit costs of energy at different times of the day and week and (2) a schedule of the productive and non-productive times for the value stream:
Process step identification. Each process step in the production chain is identified and labelled according to production specifications or internal factory documents. Both the throughput (i.e. batch size) and the cycle time for each process step for each unit of manufacturing (i.e. cycle time/batch) are identified. Differentiation between automated and manual steps is highlighted, as manual steps are not considered unless determined to have a significant impact.
Process equipment identification. The equipment used for each process is then identified along with the quantity of equipment per step. This is critical as there may be a one-to-many relationship between the process step and process equipment although generally each product will only take one path through the process. Process equipment energy consumption data are then collected with temporary data-logging necessary in most cases. The electrical consumption provided by the manufacturer (typically referenced on the equipment plate or manuals) should be collected, as well as any thermal energy usage (i.e. steam to generate process heat).
Determination of SEUs. Based on the cycle time and the energy consumption data for each item of equipment, a list of process SEUs can be determined. It is critical to take into account the accurate cycle times, as the machine rating alone may not be suitable to assess the scale of the energy consumption involved from a product perspective.
Technical services identification. It is necessary to identify the technical services (compressed air, water, steam, nitrogen, dust extraction, etc.) used by each process step. These services require both electrical and thermal energy and should be accounted for as part as the energy usage of the process. As specific metering at the process step is not usually available, a method of allocating consumption of the technical services across the value stream must be developed.
Data collection. It is necessary to identify if there is sub-metering available at process level for both electrical and thermal energy. If energy meters are installed at this step then information can be gathered from the energy monitoring system. If meters are not in place, then it may be possible to use control information from variable speed drives (VSDs) or programmable logic controllers (PLCs) on the machines or to deploy sensors that can gather data on the behaviour of the process (cycle time, temperature, etc.). Machine data may be available from overall equipment effectiveness (OEE) databases and production data from Manufacturing Execution System (MES) databases.
The steps in the framework and some identified limitations and challenges are set out in Figure 3.
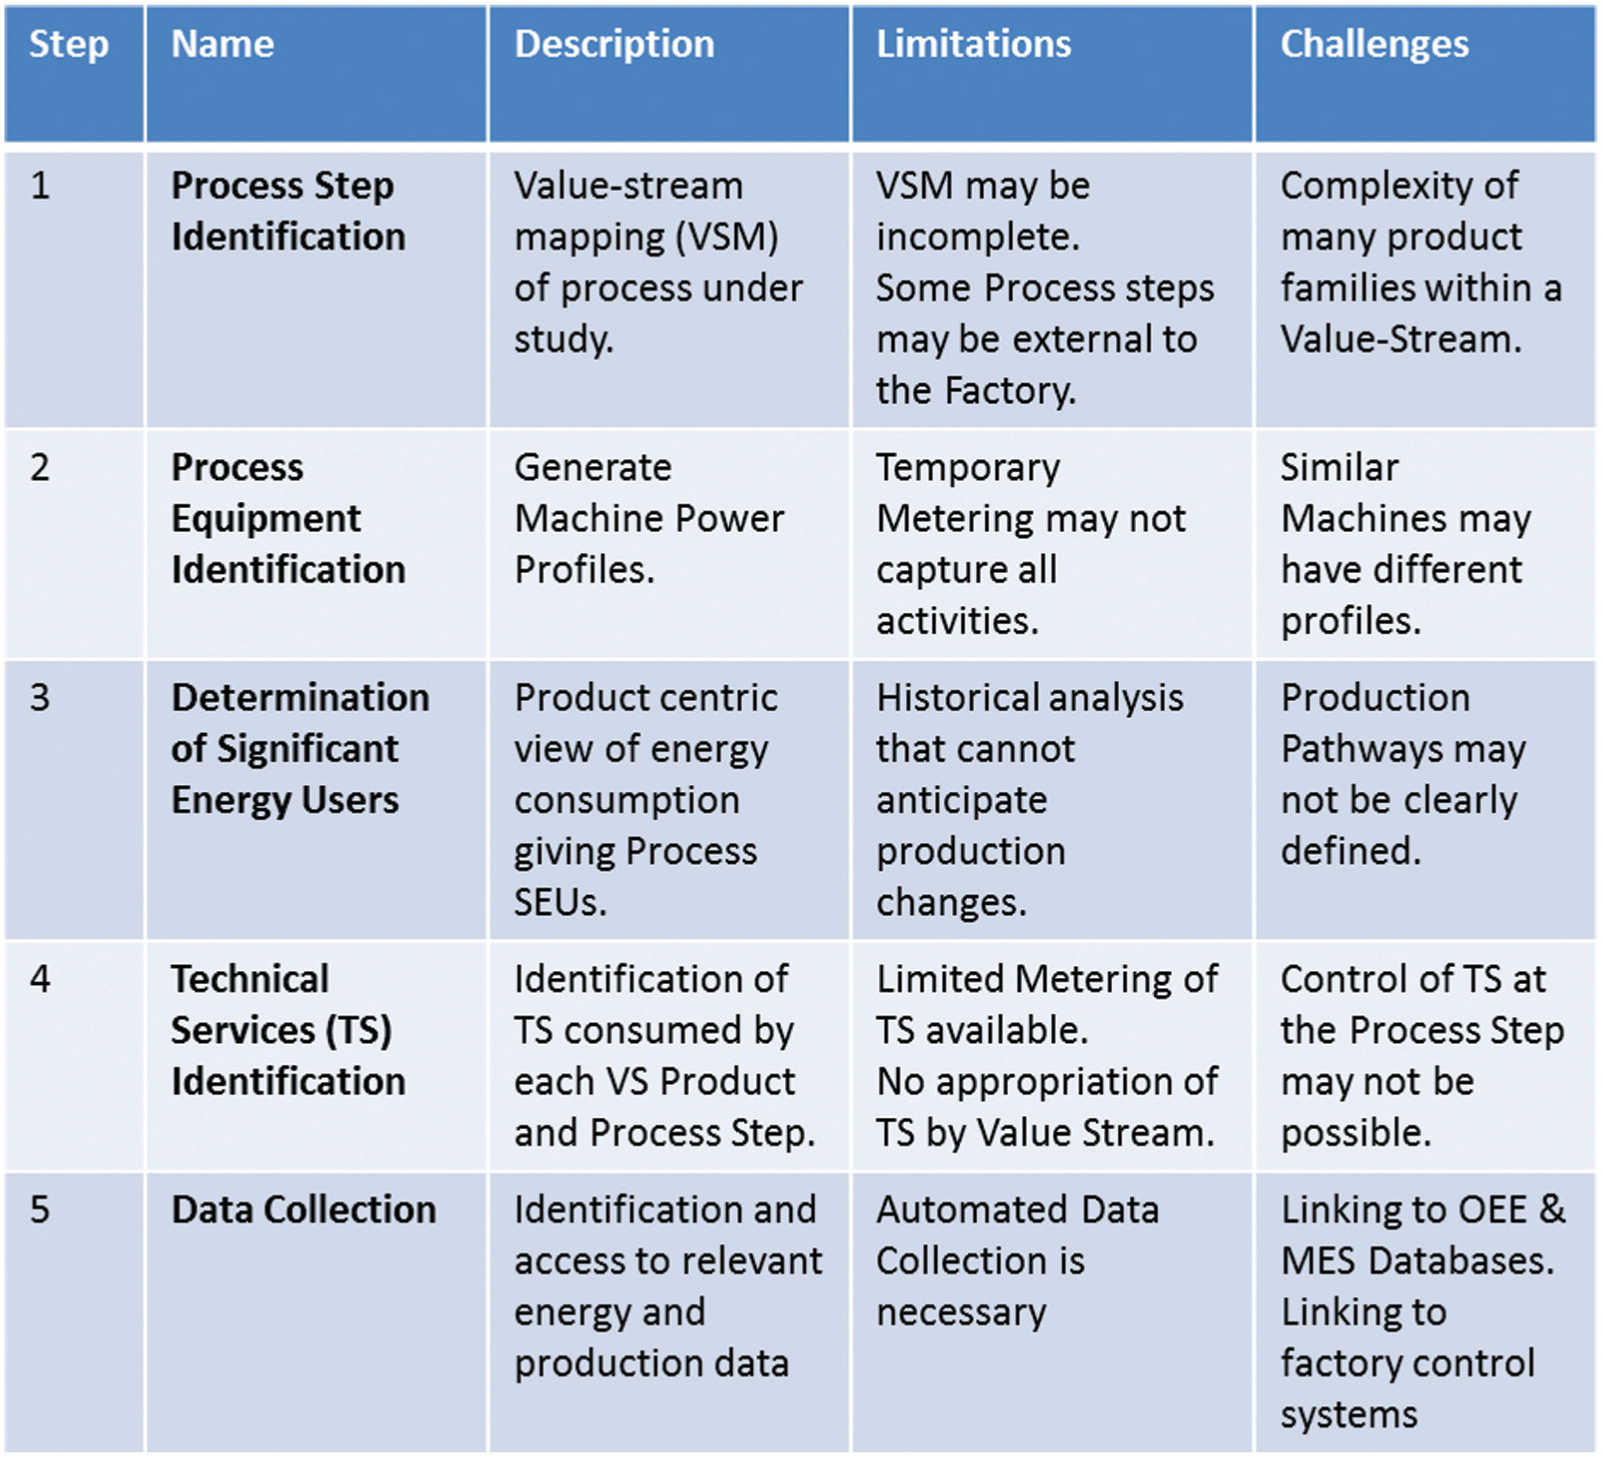
Framework steps, limitations and challenges.
The required data are collected by reviewing existing manufacturing specifications complemented with interviews from manufacturing personnel (i.e. production associates, supervisors and managers) along with other on-site investigations conducted to corroborate the information. The information is then entered into the model developed, shown in Figure 4, and the output is an energy and process map containing the five elements.
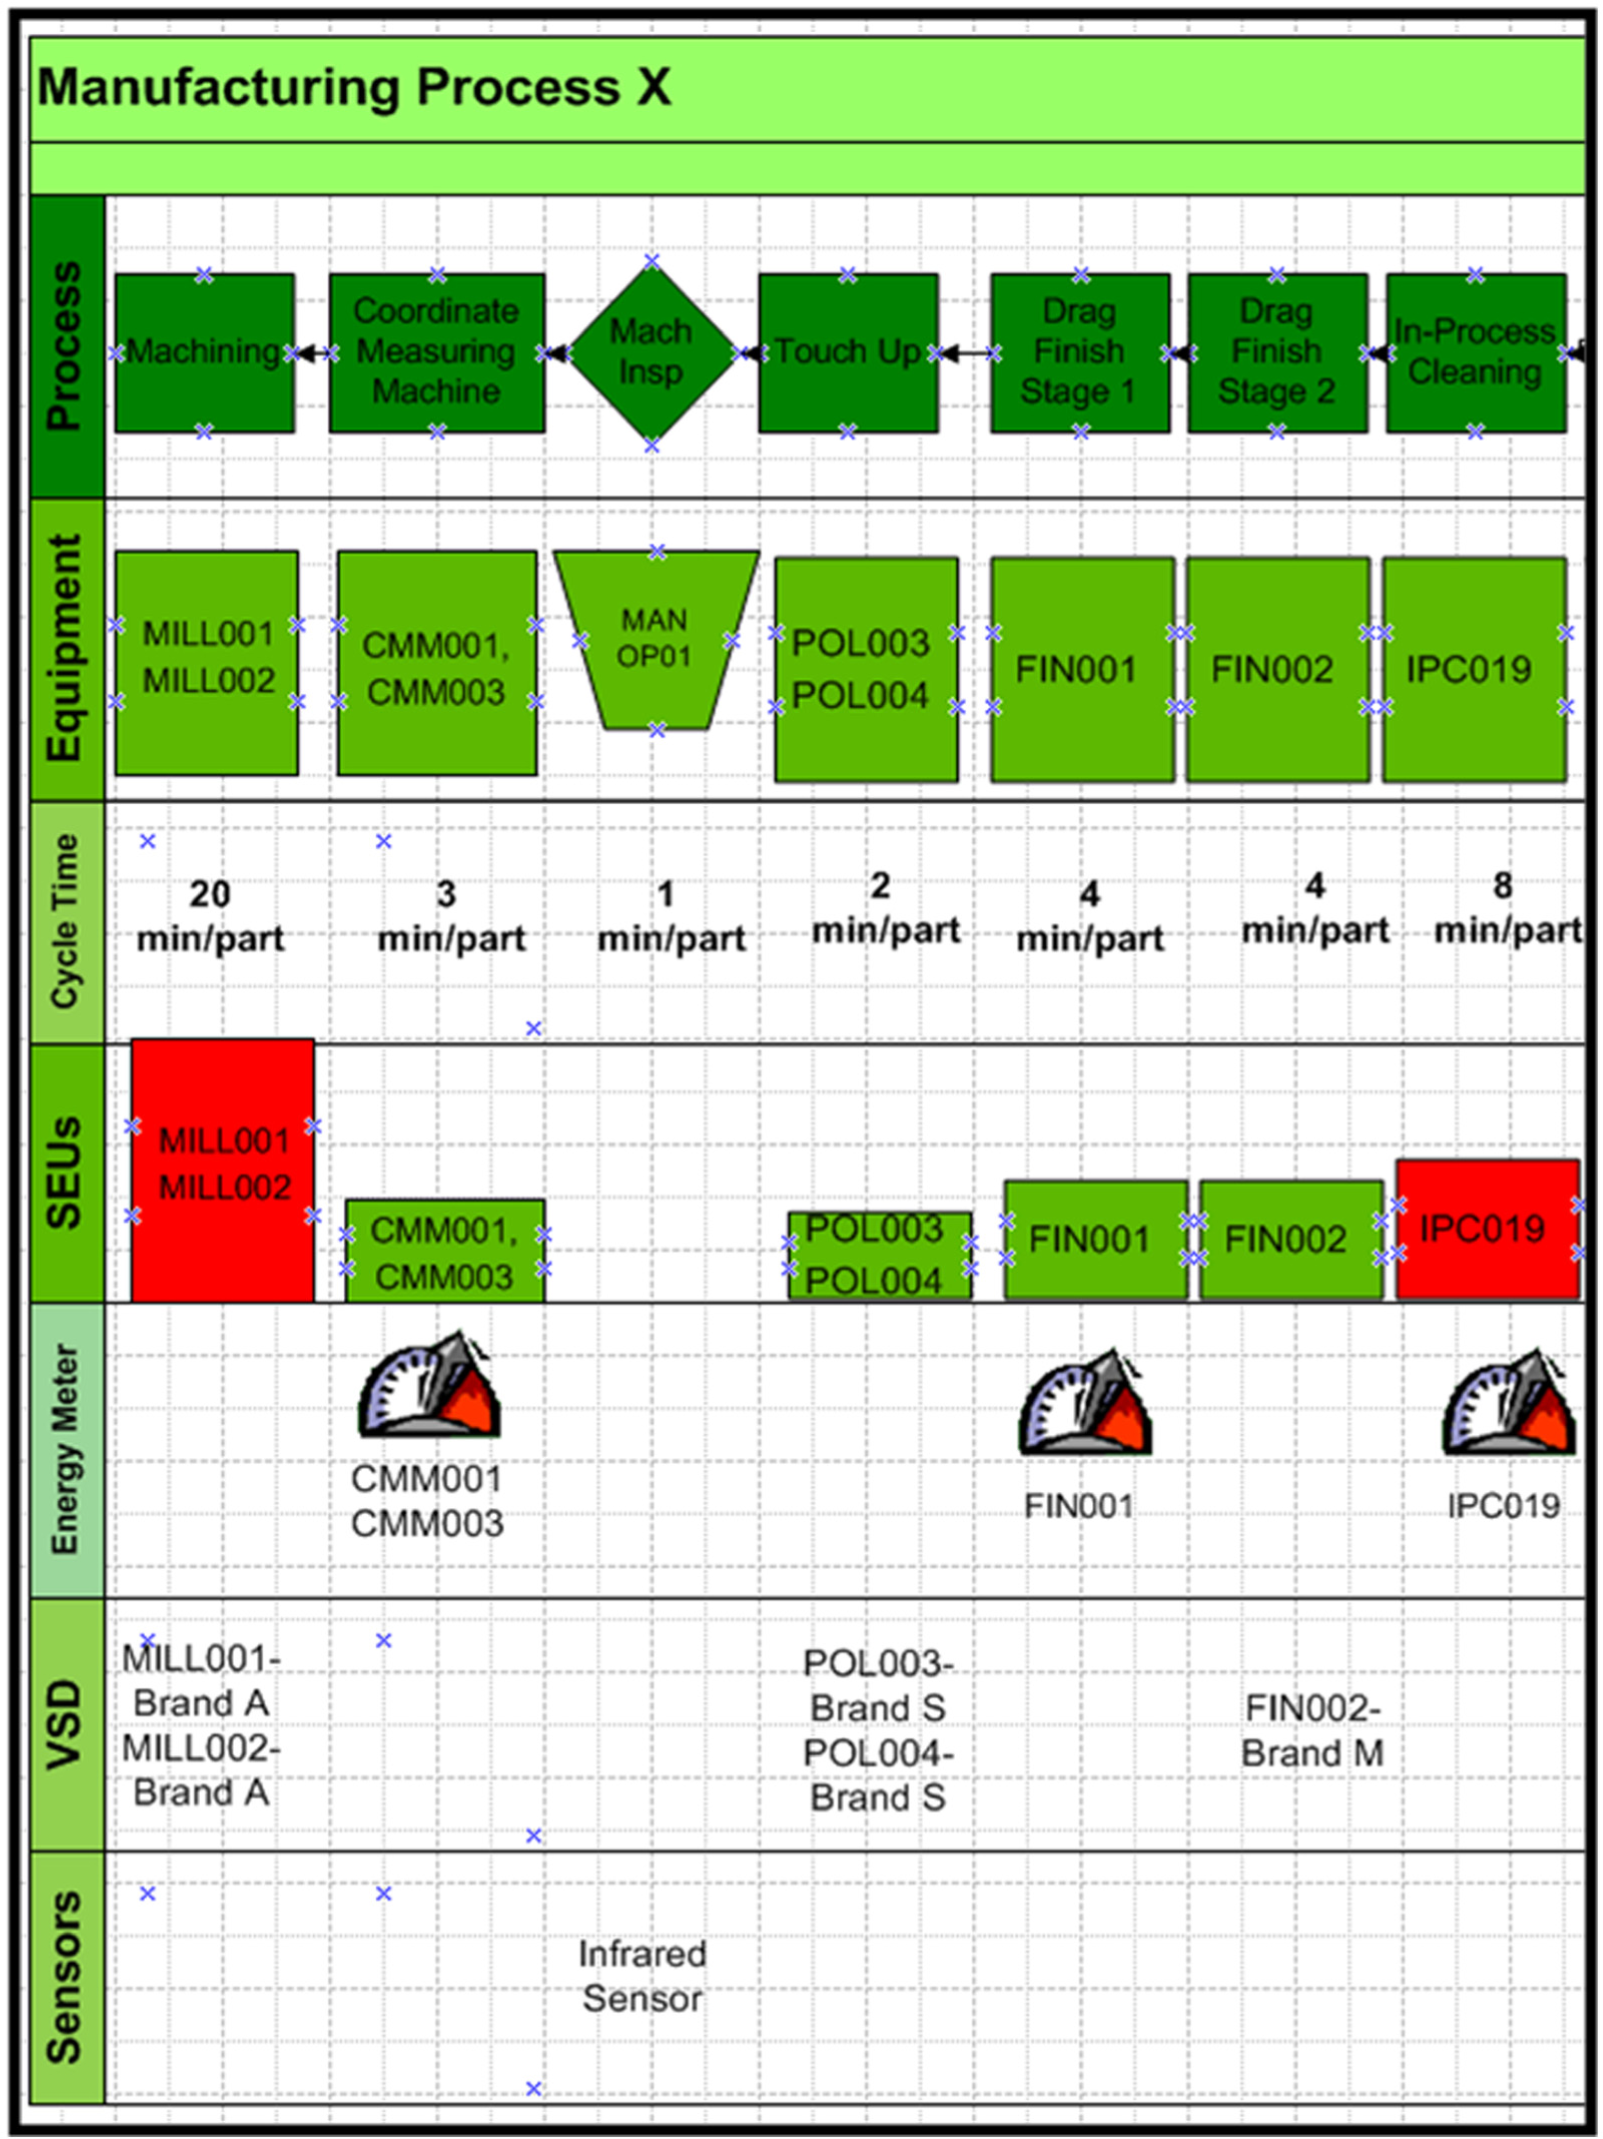
Example of model information and energy and process map.
By applying the steps to a production environment, the relationship between process, equipment and energy usage is highlighted and can be used to understand how manufacturing activities function within an industrial facility and how energy and manufacturing are interrelated. Uniquely, by incorporating product cycle time, the framework determines the process SEUs, hence identifying critical focus areas that warrant further investigation. By gathering data for machines that represent the various machine types used in the factory and the associated utilities, the analysis of the data collected can be used to generate machine power profiles and energy ‘signatures’. The power profiles serve 27 as a basis for a more in-depth understanding of the energy consumption of the machines and utilities associated with the machines. These profiles provide information of energy consumption, as well as a distinction between value-added energy (energy consumption when machine is performing an activity that adds value to the product, for example, milling) and the AE (energy used during idle times or for activities that do not generate value to the product). By understanding the energy use per machine, it is possible to calculate energy consumption across similar machines and estimate the total cost of energy consumed by the value stream (production line). Efficient management of operations then requires ongoing assessment through appropriate energy performance indicators (EnPIs), of which, Salonitis 28 states that the most relevant to compare and assess different process strategies is considered to be the energy consumed per product.
Implementing the methodology: case studies
The methodology was implemented on two sites: Site A – a discrete manufacturing facility and Site B – a continuous manufacturing facility. The site descriptions and outcomes of the implementation are detailed below.
Case study 1
Site A is a medical device manufacturing facility that consumes approximately 20 GWh of electricity and 15 GWh of natural gas annually. With the aim of reducing energy usage and costs, energy efficiency projects and renewable energy systems have been installed. These include a 450-kW biomass (wood chip) boiler, a natural gas combined heat and power (CHP) (900 kW) plant and a 3-MW wind turbine. While significant progress has been made at the facilities level, over 57% of the site energy is consumed by production processes. Hence, opportunities to target energy usage in their production operations exist.
Data were gathered for the five steps of the methodology described in section ‘Generic process mapping methodology’ by means of manufacturing floor visits and interviews with key personnel. The result was a visual representation of the process and energy relationship for the manufacturing area. In tandem, an industrial power study was conducted to attain power profiles for the machines in order to (1) understand the machines’ electrical consumption during productive and idle states and (2) ascertain the technical services such as compressed air, coolant, process water (de-ionised water) and dust extraction consumed at each machine station during productive and idle states. This confirmed the initial SEU calculations as well as highlighted the equipment that required further monitoring. The aggregated weekly electrical consumption profile for the plant, shown in Figure 5, clearly indicates the scale of week-end electricity consumption (20%) compared to production (7%) highlighting opportunities for savings. While this was known at a factory level, it was only through the new methodology that the excess use of electricity could be identified at a specific value stream and indeed at specific machines.
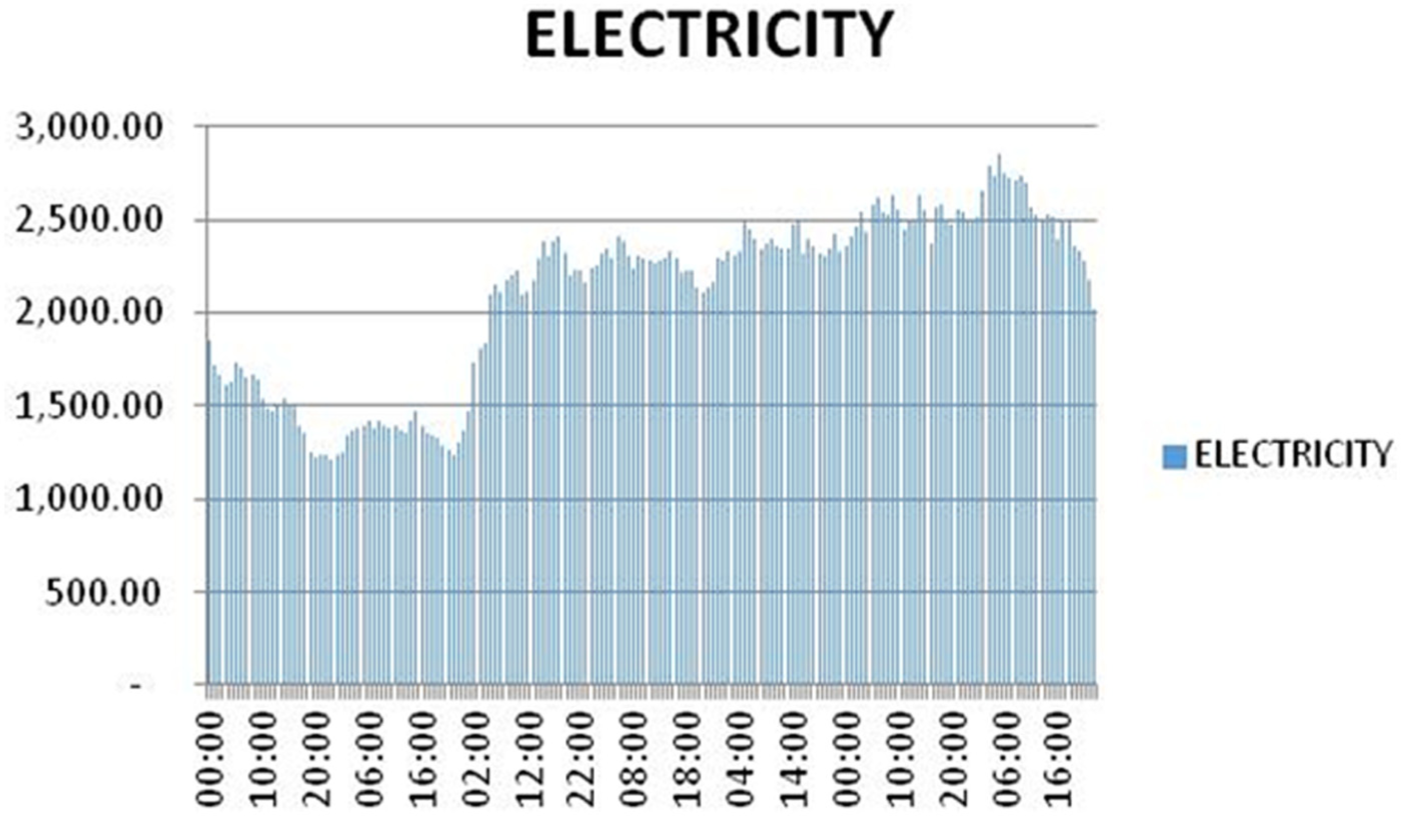
Aggregated weekly factory electricity profile.
Further analysis of the largest value stream in the facility showed an electricity cost of approximately €10,000 weekly with a 42% AE component. While it is unrealistic to consider that all waste can be eliminated, the goal of the study was to highlight where significant opportunities can be identified. A reduction by 25% in the value-stream AE through identified changes in operating procedures could save over €50,000 a year. The study clearly identified the grinders as the most significant energy users in the value stream with up to 66% of the electricity use each week. Thus, there is clear justification for sub-metering on the grinders and greater monitoring of their operations.
The greatest challenge in implementing the framework was the lack of available data on machines and an absence of sub-metering at the machine level. The company operates a fixed overhead policy to charge the cost of energy to the value stream regardless of any improvement (or dis-improvement) in actual energy consumption. The proposed framework gives the company an alternative approach to charge for energy that is transparent across the value streams and rewards improvement efforts. This requires some changes in the accounting practices in the company and the implementation of an energy-efficiency indicator for future monitoring of performance.
The results of the work also proved to be useful to the organisation, particularly for the acquisition of new equipment and the expansion of the manufacturing floor. It was particularly valuable (savings of over €100,000) when determining the correct size of the heating, ventilation and air-conditioning (HVAC) system and the electrical distribution panels for a new extension to the production facility.
Case study 2
Site B is a pharmaceutical and consumer goods global manufacturer that develops and manufactures the active ingredients of medical compounds for both clinical and commercial use. The facility consists of nine highly automated production buildings. Based on consumption data from 2013, the facility consumes a total of 60 GWh of energy, out of which 22 GWh are electricity and 38 GWh correspond to thermal energy. The facility has improved its energy performance from a total energy consumption of 100 GWh in 2006. While significant progress has been made at the facilities level, over 40% of the site energy is consumed by production processes.
The consumer health product building was selected to implement the methodology. Data were gathered for the five steps of the methodology described above by means of manufacturing floor visits and interviews with key personnel. The result was a visual representation of the process and energy relationship for the building which clearly showed how and where energy consumption was driven by production. Specifically, the work highlighted the extent that the process and HVAC chillers were SEUs.
Further analysis highlighted that the process and HVAC chillers were operated by fixed-speed fans, that the control of environmental factors in parts of the production process was not necessary at times, and that some re-design of the process was possible. The annual electricity cost to operate the chillers was over €100,000, and the study showed how changes in the operating controls and some minor structural works could produce annual savings of 50% or over €50,000.
One challenge in implementing the framework was the number of energy carriers (steam, chilled water, electricity, nitrogen) which made the energy analysis quite complex. Parts of the process are inherently inefficient as, due to the size of the site, the company has a piped supply of chilled water and of steam which are mixed to the specific temperatures needed for the process. Another significant challenge in implementing the framework was the lack of sub-metering at the process step. This was resolved through accessing data from the industrial control systems which was validated against temporary metered data. This provided sufficient data on the operations and eliminated the need for detailed sub-metering with a saving of over €80,000.
Conclusion – impact of the method on the factories
Energy management in manufacturing was investigated, demonstrating that to date most of the work has focused on the facilities side, primarily due to the complexity of categorising energy in production systems. The concept of ‘Embodied Product Energy’ was discussed, as well as an energy breakdown structure proposed by the authors that allows decisions makers to recognise, through a visual representation, the manner (where and when) by which energy flows through an industrial facility. The methodology draws particular attention to the AE usage (waste) and the potential areas in the factory where sub-metering is justified and where energy-efficiency measures can be introduced based on operational and behavioural changes in production operations. A model based on DE and IE analysis from a ‘product’ viewpoint has been extended to identify AE in line with ‘Lean’ principles in manufacturing. The methodology outlines the process flow, energy metering requirements, the technical services supporting the process and an identification of the significant (process) energy users. In large industrial facilities, up to 60% of energy consumption is directly consumed in production activities, although it has been shown that anywhere from 42% to 50% of this energy may be used for functions that are not directly related to the production of parts. This AE identified represents the best opportunity to gain energy savings and cost reductions through operational and behavioural changes at the lowest possible investment.
The methodology was implemented in two case studies and beneficial results are shown. The mapping has clearly identified gaps in energy data and highlighted specific equipment SEUs that should now be monitored. Furthermore, the methodology illustrated where VSD as energy meters could be used, thus avoiding the need for meters and reducing the overall cost of sub-metering. The development of a clear link between the temporal profile and the efficiency of the energy consumption by the specific value stream can provide full transparency in the cost of energy consumption and can provide positive feedback and reward improved performance by the value stream. The ability to link production and energy models is also a vital link in the future application of demand side management (DSM) to industry. Further work, in 2016, will involve implementing the methodology on another large value stream where limited sub-metering is available. The main purpose will be to identify the SEUs as well as to propose a strategic metering plan. The analysis of the AE will be extended to quantify, prioritise and verify the potential energy savings and the most suitable energy performance indicators developed to provide ongoing management of the production-specific energy consumption. This will allow both energy and production managers to identify opportunities for energy reduction using a common approach.
Footnotes
Declaration of conflicting interests
The author(s) declared no potential conflicts of interest with respect to the research, authorship and/or publication of this article.
Funding
The author(s) disclosed receipt of the following financial support for the research, authorship, and/or publication of this article: The research work is supported by Enterprise Ireland (EI), the Sustainable Energy Authority of Ireland (SEAI), Science Foundation Ireland (SFI) and the Industrial Development Agency (IDA Ireland) and has been carried out in collaboration with Limerick Institute of Technology (LIT), University of Ulster (UU), Innovation for Irelands Energy Efficiency Research Centre (i2e2) and the International Energy Research Centre (IERC).