
Abstract
Certified energy management systems suffer from a perception that they require exhaustive quantities of time and resources to operate, and that this time could be more beneficially spent saving energy through improvement projects. It is commonplace for processes such as energy performance indicator development, energy review and action planning to be implemented in manual and hence resource-intensive processes. No effective web-based tools currently exist to aid end users in processes. As part of an embedded study working with three large manufacturing companies, it was found that 5–75 days were spent implementing these three key aspects of a structured energy management system. Web-based solutions offer the potential to streamline the operation of these resource heavy components of energy management systems. This article focuses on the early stage development and beta testing of a web-based action planning and energy project visualisation tool which has been developed and tested on one of the embedded study participants. The results from this testing demonstrate a wiliness of the participant companies to engage with web-based tools to minimise their ISO 50001 resource requirements once they are designed in such a way as to facilitate ease of use.
Keywords
Introduction
Manufacturing processes use one or more physical mechanisms to transform a material’s form or shape utilising energy. The energy required for such operations is typically only partially transferred into a useful output (a machined part for example) with the remainder being transformed into product waste or residual heat during processing. 1 Based on 2014 figures, the manufacturing sector is a major consumer of energy worldwide with it accounting for circa 31% of primary energy use in total. 2 Worldwide industrial energy consumption was, in 2011, projected to grow to almost 72,000 ZW by 2030, this resulting in an average 1.4% per year increase. 3
Manufacturing companies have always been active in terms of energy efficiency improvement as it ties closely to their bottom line in terms of gross margin per product produced.4–7 Tools such as statistical process control (SPC), overall equipment effectiveness (OEE) and value stream mapping are used extensively throughout the manufacturing sector to reduce waste, limit downtime and maximise product value.8–11 More recently certified Energy Management Systems (EnMS) have been utilised to systematically integrate energy efficiency into an organisation. 12
The ISO 50001 EnMS standard was published in 2011, having been preceded by a number of national standards (e.g. Denmark: DS 2403:2001, Ireland: IS 393:2005, USA: ANSIMSE 2000:2008), as well as a European standard (EN 16001:2009) which ISO 50001 superseded and eventually replaced. 12 To date, the research community has only begun to analyse the effectiveness of EnMS standards.13–16 While the results of these studies indicate that an EnMS generally has a positive effect on carbon and ultimately economic performance, the effect is found to be stronger in the case of a certified EnMS. 12
One of the perceived downsides of certified EnMS, however, is the resource requirements required to operate them effectively. In keeping with other management systems such as ISO 90001 for quality, ISO 14001 for environmental and OSHA 18001 for health and safety, the ISO 50001 standard requires a company to implement documented processes to govern the operation of their operations, with particular attention to their significant energy users. In order to achieve this, companies must carry out an energy review to determine which areas of their organisation will be deemed as significant.
Once this is complete, they must then implement a series of controls to ensure that these significant consumers of energy are operated in as efficient a manner as is practicably possible. It is here that much of the company’s resource time is consumed in terms of the documentation of the energy review, the identification and operation of Energy Performance Indicator (EnPI) and the tracking of energy project savings to fruition to ensure that systems and processes are operated optimally.
A prescriptive step-by-step approach to implement an EnMS could help an organisation perform the required tasks through effective resource allocation. 17 There is therefore an opportunity to reduce this resource burden for companies through the use of web-based tools which can not only reduce the time required to implement and operate these certified systems but also standardise their implementation allowing more successful rollout within large globally located companies.
Section ‘How did the study participants implement the requirements of ISO 50001?’ of this article details the identification of the most resource-intensive sections of a certified EnMS via a study where a researcher was embedded in three large manufacturing sites to determine their individual resource requirements to maintain certification to ISO 50001. Section ‘Requirement analysis leading to proof-of-concept tools’ then describes the development of three proof of concept templates to achieve certification to three of the most resource-intensive sections of the standard based on the processes in place at the participant companies. Section ‘Web-based tool development’ describes the development of one of these templates into a web-based tool with section ‘Tool testing’ detailing some early results from the testing and evaluation of this tool by one of the study participants.
How did the study participants implement the requirements of ISO 50001?
Software tools to support the implementation of an EnMS
Current research in the IT-supported implementation and operation of the ISO 50001 EnMS standard are focused on two distinct areas: the identification of the gaps to certification state of a company wishing to implement the standard and the assessment of the gap to exemplar performance of a company’s existing EnMS via a maturity model assessment.18,19 There seems to be, however, a dearth of research into the tools required to help companies deliver on the specific requirements of the standard in a structured and repeatable manner.
Global companies are showing increasing interest in the use of ISO 50001 to standardise the way that their energy operations are managed throughout their community. Companies such as Dalkia 20 and Roadstone 21 have, in the last 5 years, moved to group certification models where a number of their Irish-based companies have come together under one umbrella to achieve certification to ISO 50001. This group model puts the onus on companies to maintain centralised management of their operations, therefore meaning that more than even before, standardised implementation and operation of key parts of the certified system are a prerequisite in terms of achieving certification.
From a commercial perspective, companies have at their disposal a suite of tools and ancillary systems to leverage from in order to deliver some of the clause deliverables as set out in the ISO 50001 standard in a repeatable manner. Table 1 details each of the main clauses of the ISO 50001 standard, the key deliverables contained in each clause and the commercially or academically available software tools currently available to support the delivery of the these deliverables.
Commercial and academic tools available to support the delivery of ISO 50001.
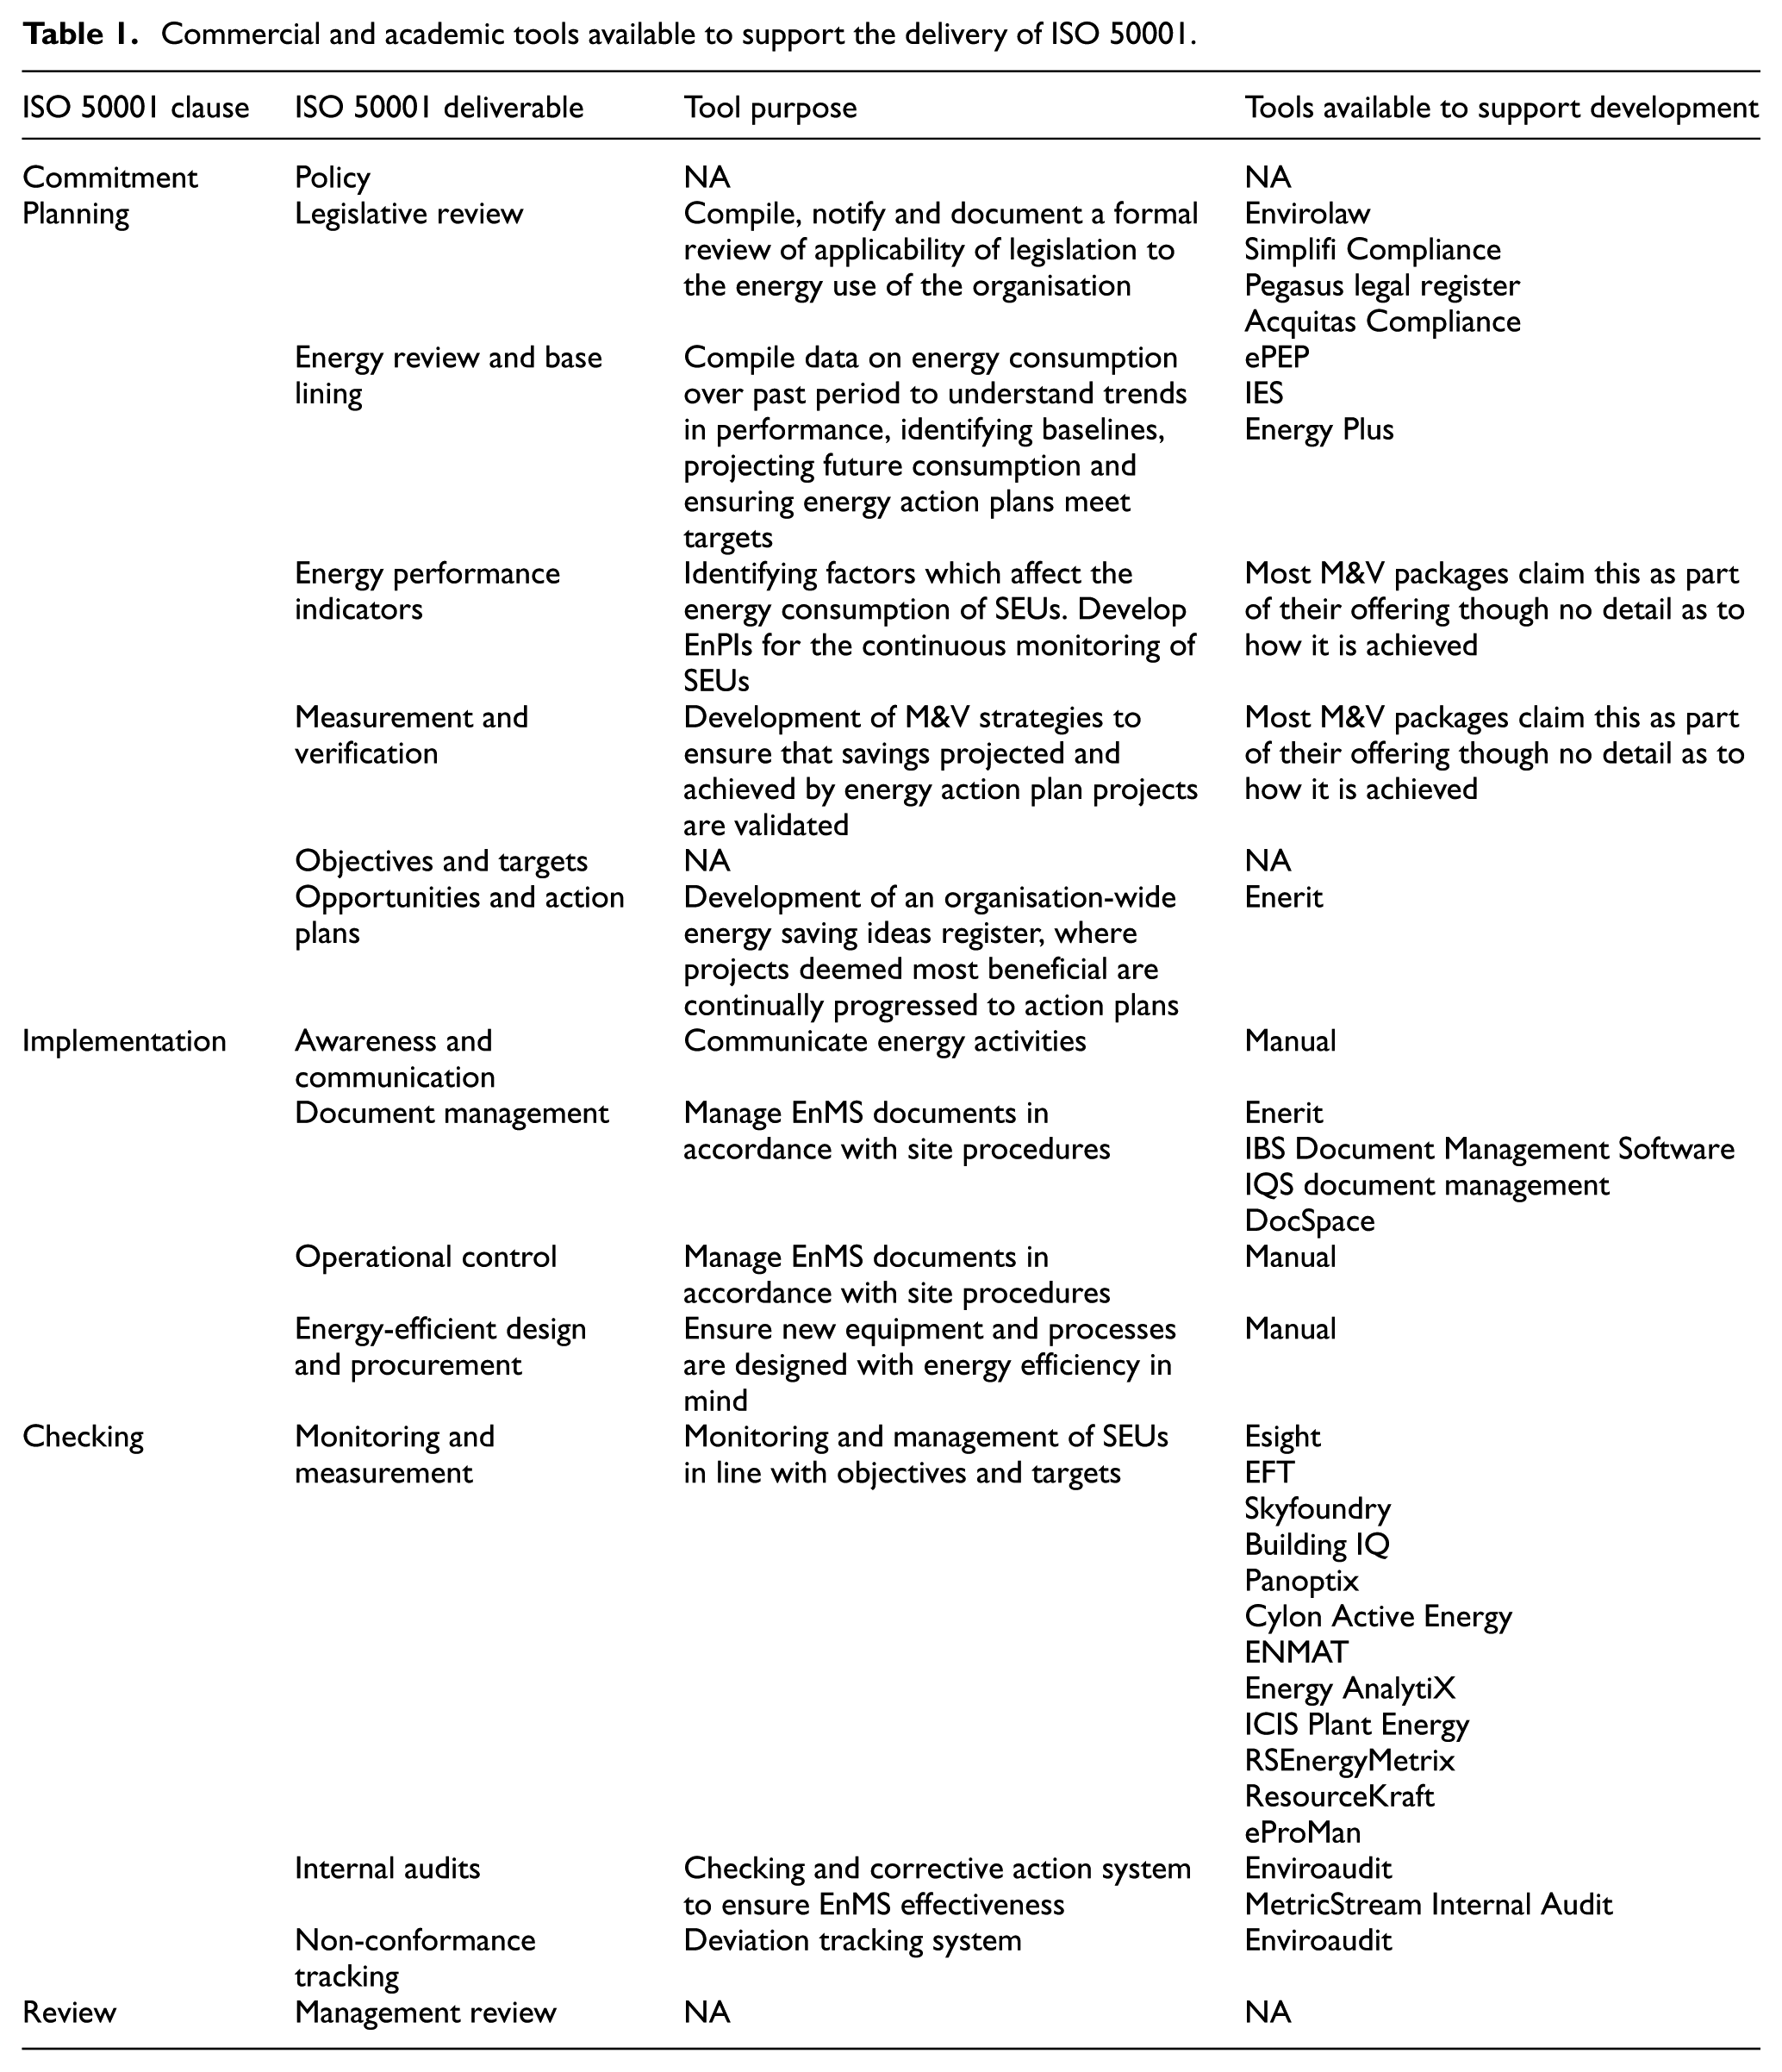
These tools, however, seem focused on the legislative, document management, audit management and monitoring and targeting sections of an EnMS operation. The more involved and bespoke to site operations elements such as the energy review and base lining, energy performance indicator development, action plan development and measurement and verification processes are largely devoid of any commercially available supporting web-based tools.
With a view to contextualising the use of these software tools, an embedded study was carried out in three large manufacturing sector companies to determine which of the commercially and academically available tools listed in Table 1 they utilised to deliver their EnMS requirements. Two of the three companies were certified to ISO 50001 (at the time of writing), while one was 6 months into a 12-month roadmap towards achieving certification. Table 2 details the results of this embedded study.
Tools utilised by three large manufacturing companies to support the implementation of ISO 50001.
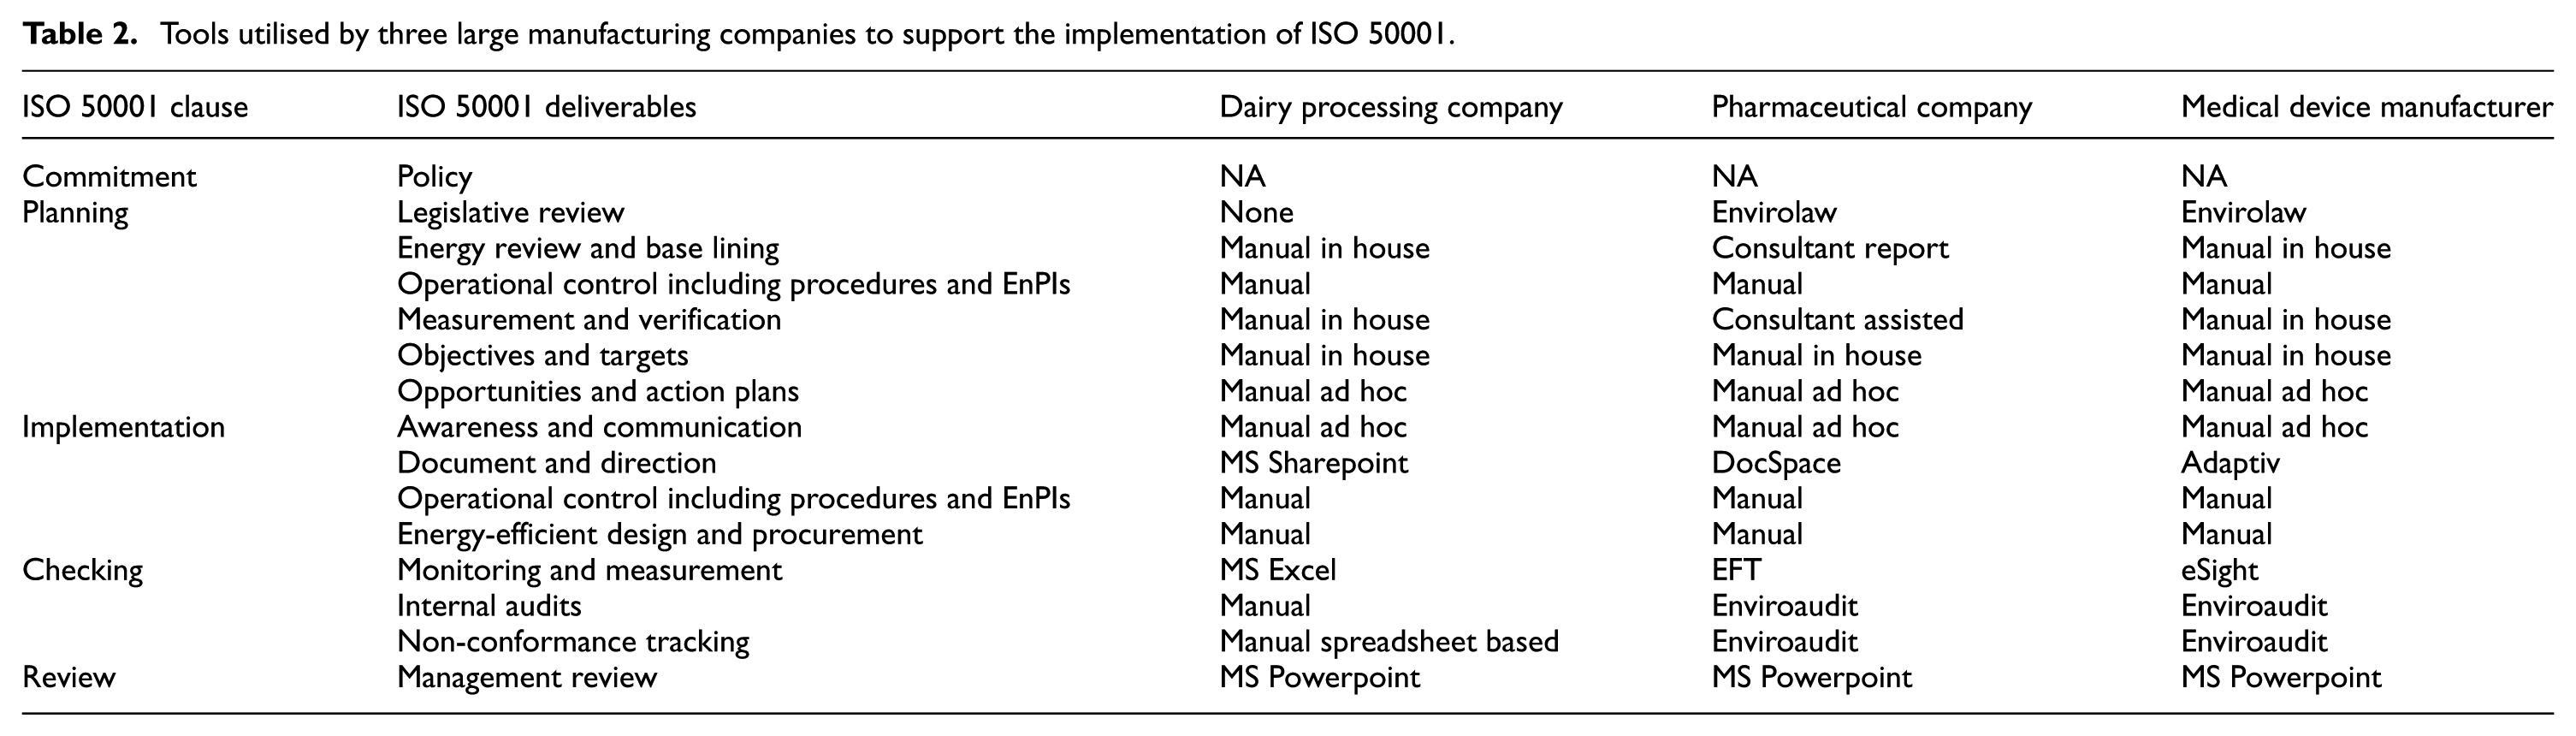
From Table 2, it is clear that software tools are utilised in the development of some of the key deliverables of ISO 50001, while in other areas, software tools do not either exist or have been deemed ineffective when compared to the either manual or spreadsheet-based work currently undertaken. As a case in point, one can observe from Table 2 that web-based or intranet-located monitoring and targeting systems (EFT and eSight) and document management systems (DocSpace & Adaptiv) are utilised by two of the three companies analysed as part of this embedded research to fulfil the requirements of the ISO 50001 standard in terms of effective monitoring and measurement, and document control. The other uses MS Excel for monitoring and targeting of energy consumption and MS Sharepoint for document sharing but not management.
This is in stark contrast to the lack of use of a software support tool in the review of energy performance and consequent base lining where none of the companies utilise a software tool. Instead, in this case, they use a mix of manual calculation, spreadsheet-based assistance and external consultant reviews to fulfil this requirement. This manual and bespoke process is time-consuming in its makeup, external vendor dependent and in many cases not repeatable outside of the group/process/owner for which it was developed, meaning that its rollout even within a company cluster would not be feasible.
Quantifying the time spent implementing and operating a certified EnMS
For the purpose of quantifying the time spent implementing the EnMS, it was broken down into 11 constituent sections (as detailed in Figure 1). The quantity of time (to the nearest 5-day block) that the energy lead or another responsible person within the company spent on each of the 11 sections was then quantified. In order to quantify the time spent on each, the energy manager/EnMS lead or similar in each of the three companies was interviewed to understand the exact process that they followed in achieving each.
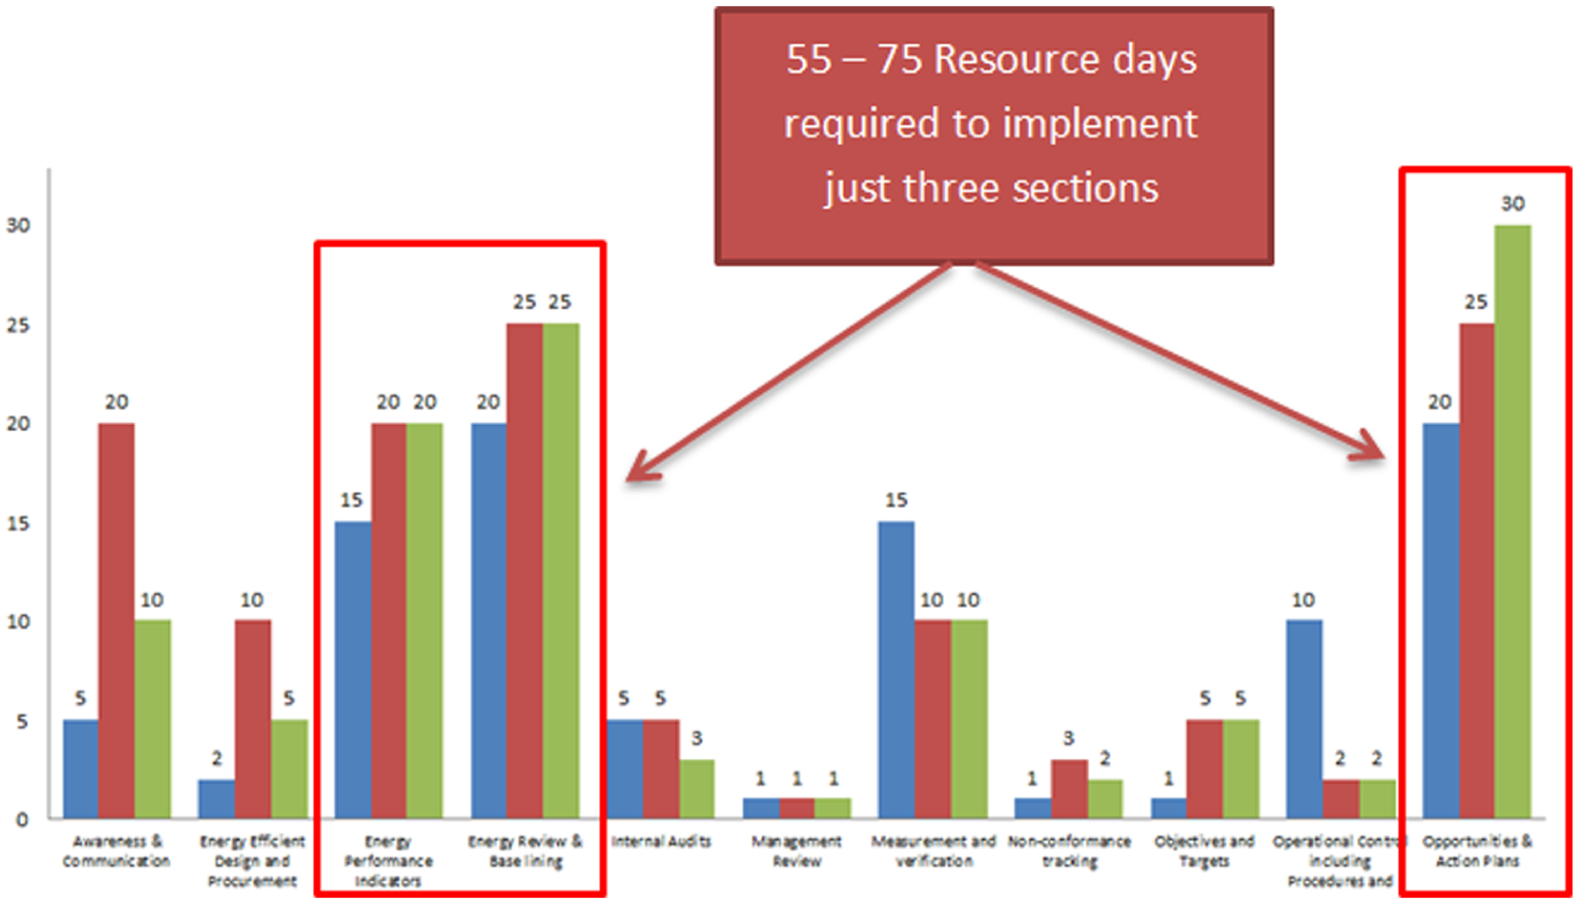
Survey results of three large manufacturing companies detailing the resource days required to implement ISO 50001 deliverables.
For example, if one were to quantify the time spent developing energy performance indicators, the energy manager’s initial response typically only took their immediate actions into account and not the affect that action had downstream of them in terms of the time spent by personnel reporting to them in delivering the required results. For example, often work such as data manipulation to enable the required visualisation was undertaken manually using spreadsheet-based tools or similar: work which the line manager only saw as an output with little understanding of the difficulty in delivering this output in terms of time consumed.
Significant time is spent by each company’s resources in the development of the energy review and base lining, EnPIs, opportunities and action plans. In total, the companies who constituted this embedded study spend between 55 and 75 days developing bespoke, highly manual, and in many cases not either easily replicable or cross site repeatable methods of fulfilling these requirements of ISO 50001.
During the embedded research, some of the reasons given by company personnel for the use of these company-specific and thus bespoke manual methods of data analysis were the lack of available tools to undertake the analysis, the lack of available data in an automated manner to integrate with existing tools even if they did exist and the speed of analysis in terms of existing knowledge levels without the need to engage a subject matter expert. In the opinion of the authors, these bespoke methods are both time-consuming and difficult to scale to other individuals in the same company or to sister sites in the same larger organisation. They are also heavy in terms of data input and thus potentially error laden due to their manual nature. An opportunity for improvement therefore exists to collect, analyse and document data in an easily consumable manner utilising web-based tools where possible.
Requirement analysis leading to proof-of-concept tools
Based on the results of the embedded research as displayed in Figure 1, the three most labour-intensive components of ISO 50001 were selected to be progressed to proof-of-concept phase. These were the energy review, action plan development and EnPI analysis, which together required between 55 and 75 days to implement based on the data gathered from the participant companies.
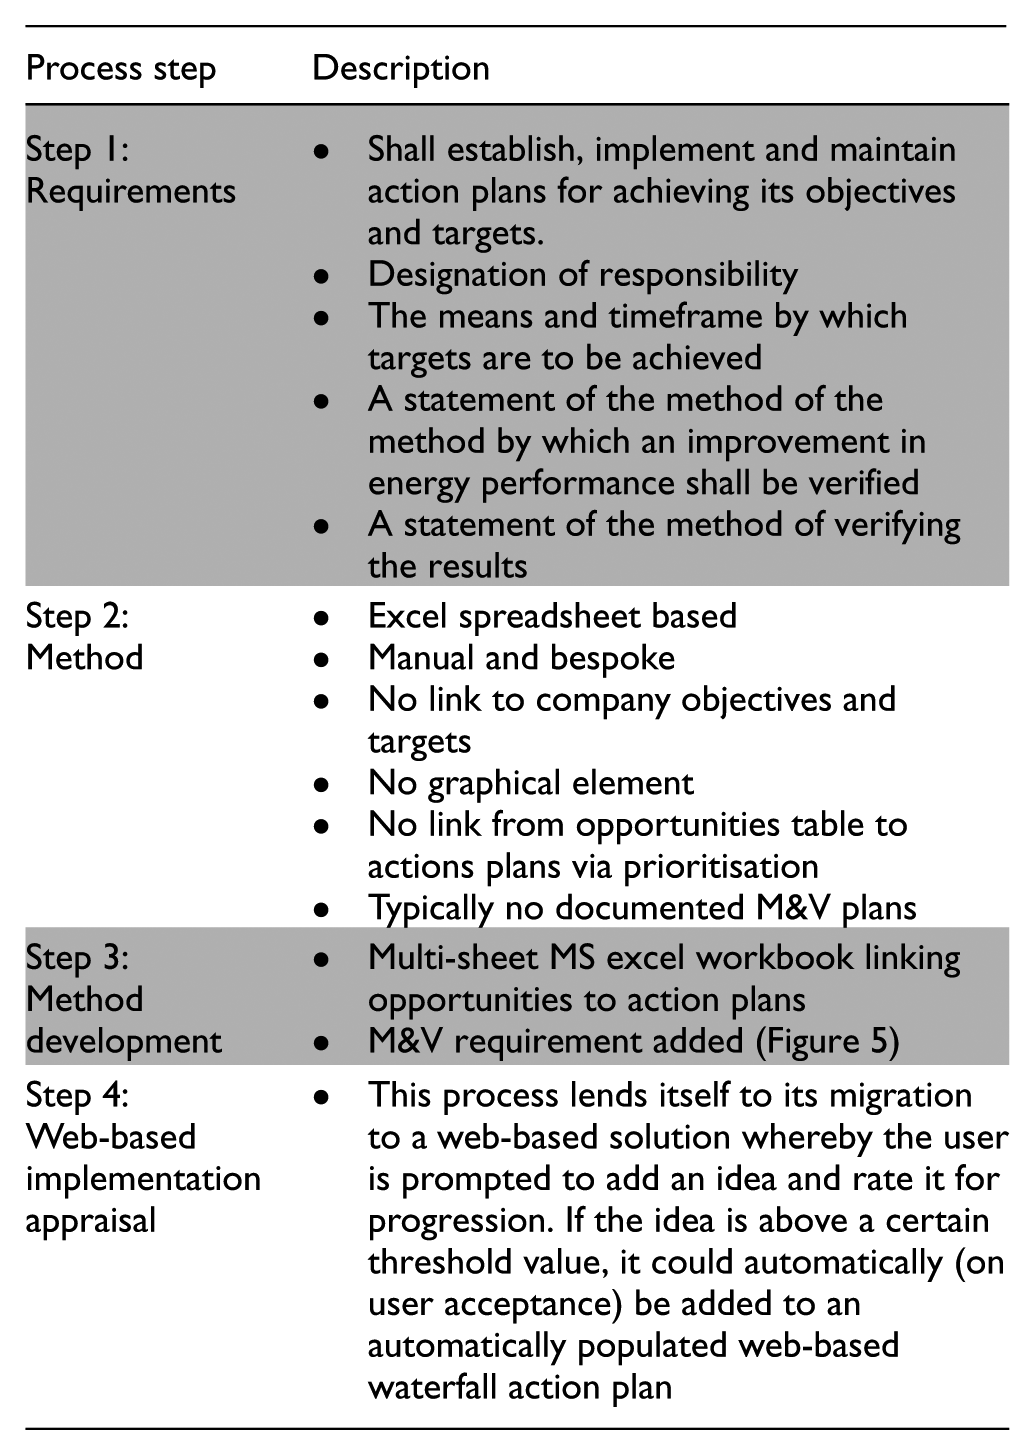
This research sought to standardise the methods by which companies sought to demonstrate compliance in each of these three areas, while also reducing the resource burden using a standardised software-supported approach. In order to achieve this goal, the authors developed a process (Figure 2) whereby each of the three key sections have been distilled to their core requirements in terms of ISO 50001 certification with a view to developing a template which would serve as a proof of concept before developing a full software-supported implementation. This four-step process is now expanded for each of the three resource-intensive areas over the subsequent sections.
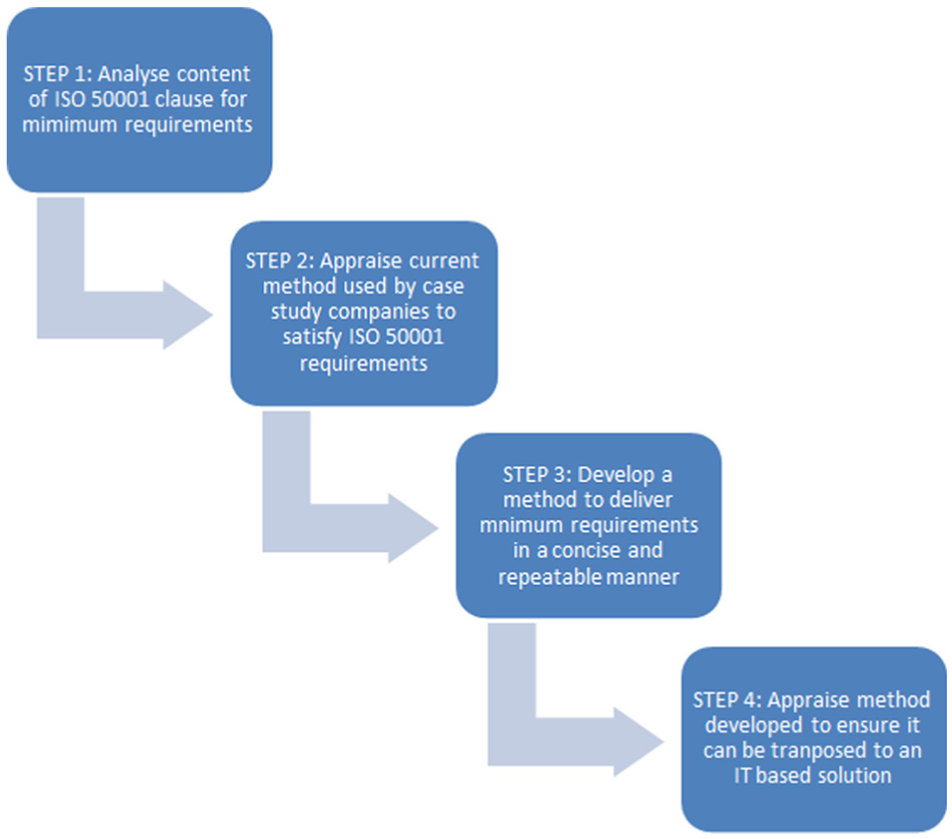
ISO 50001 application requirement analysis method.
The energy review
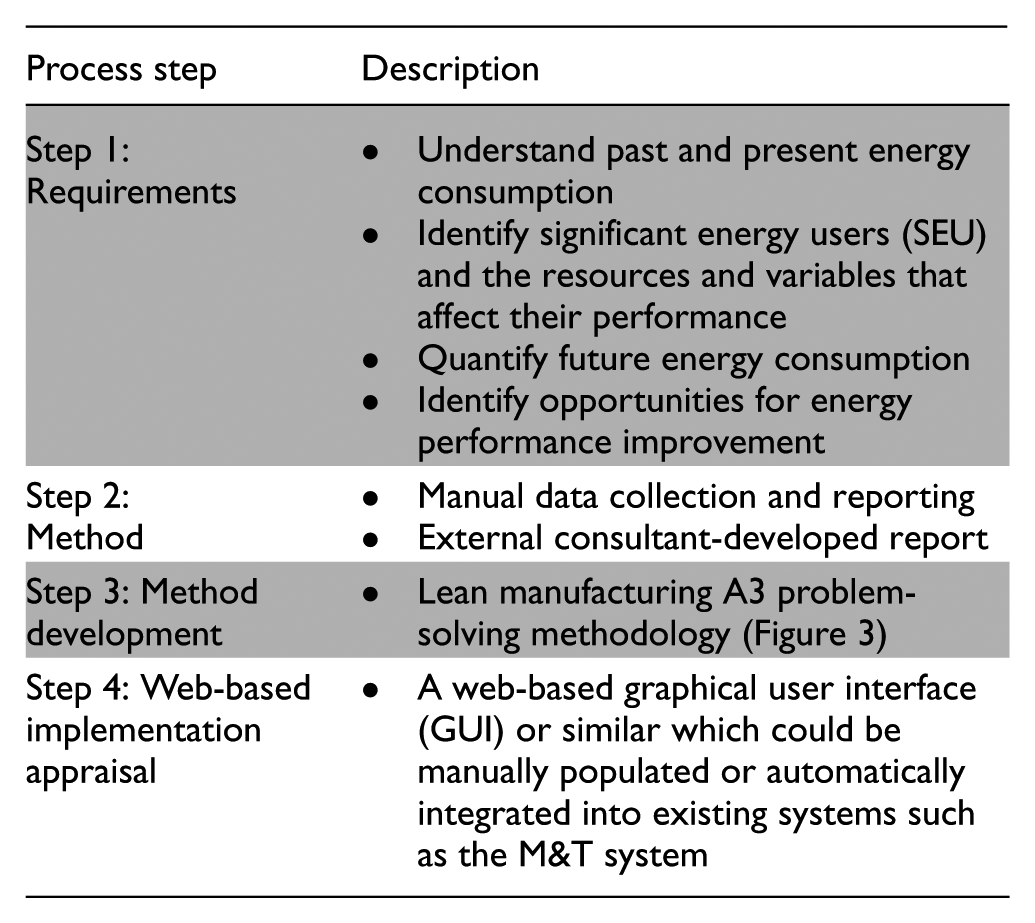
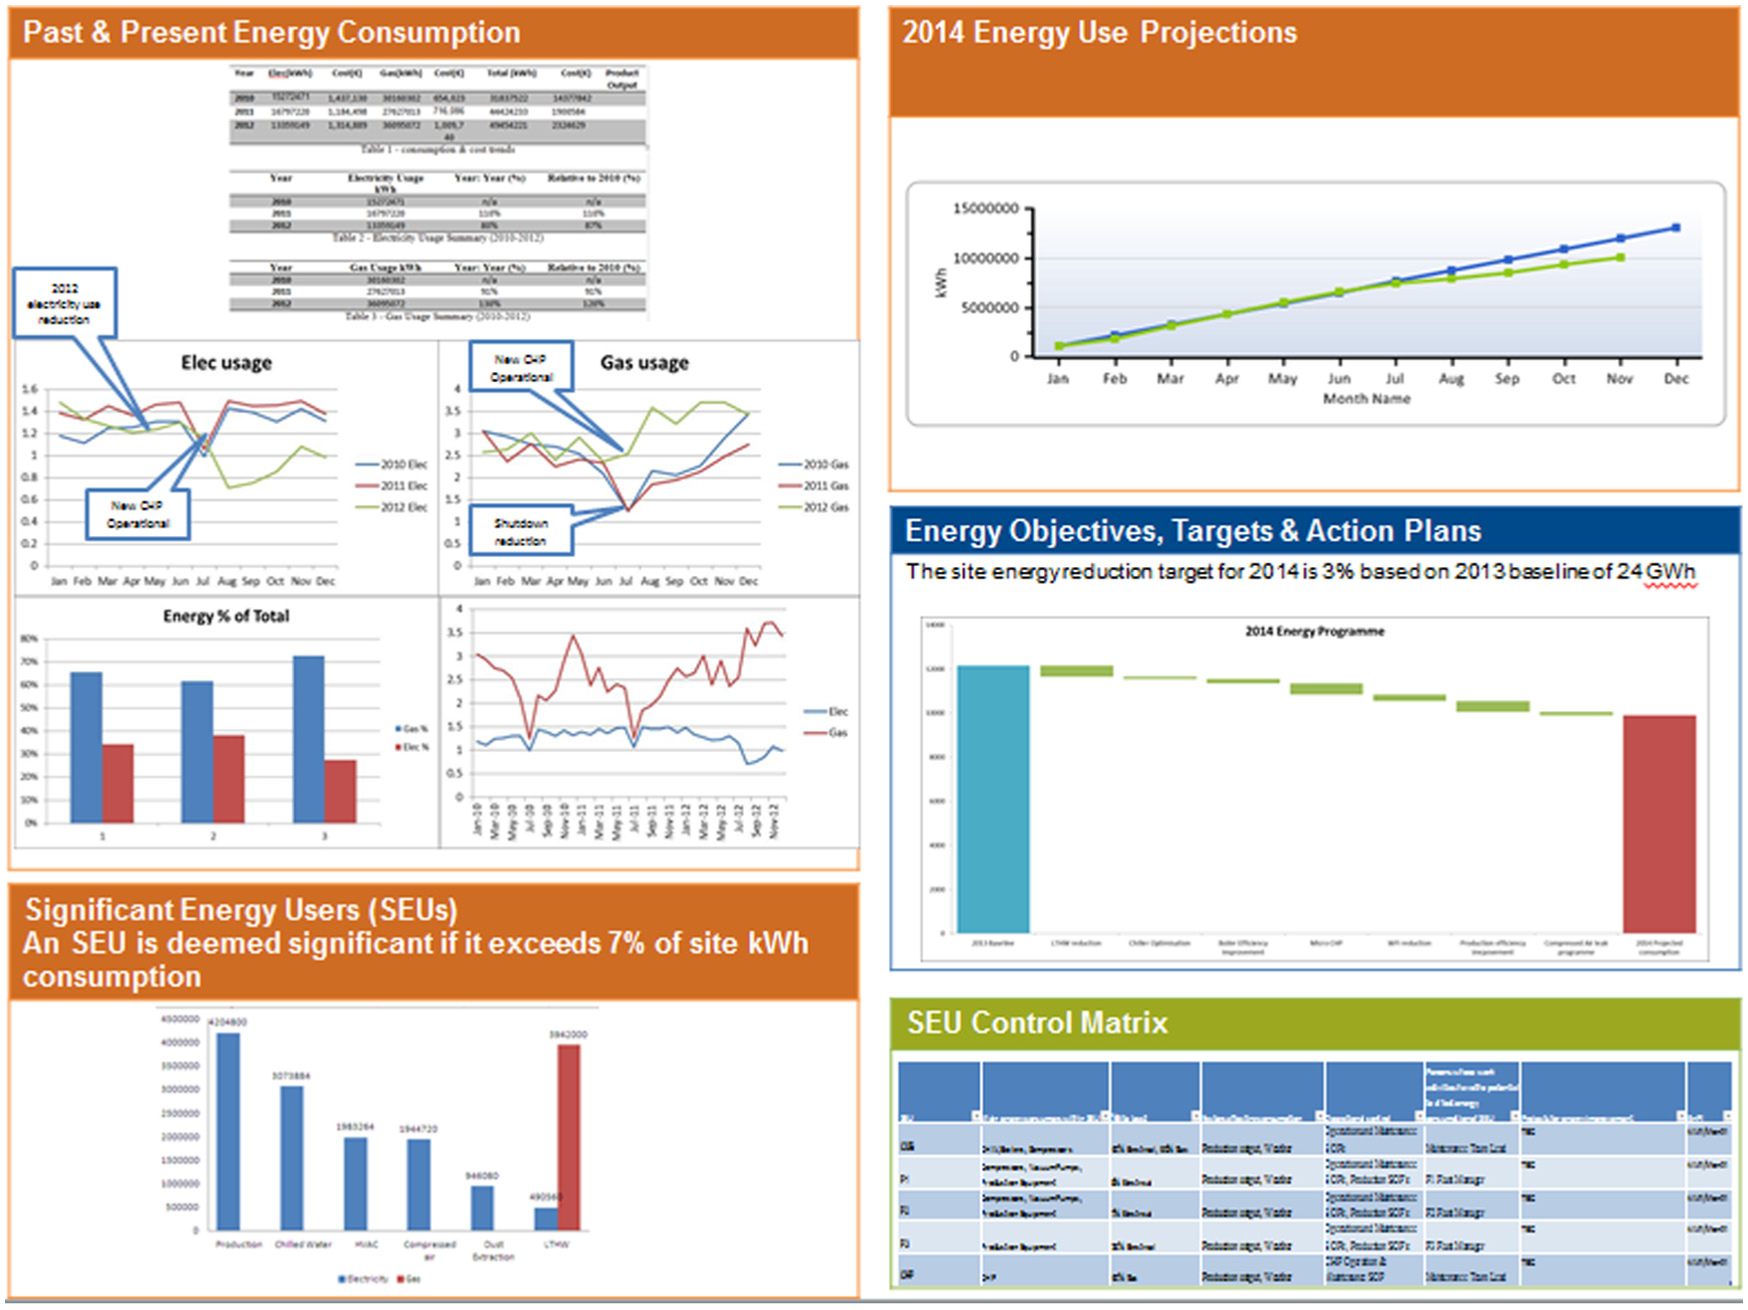
Energy review A3.
Energy performance indicator development
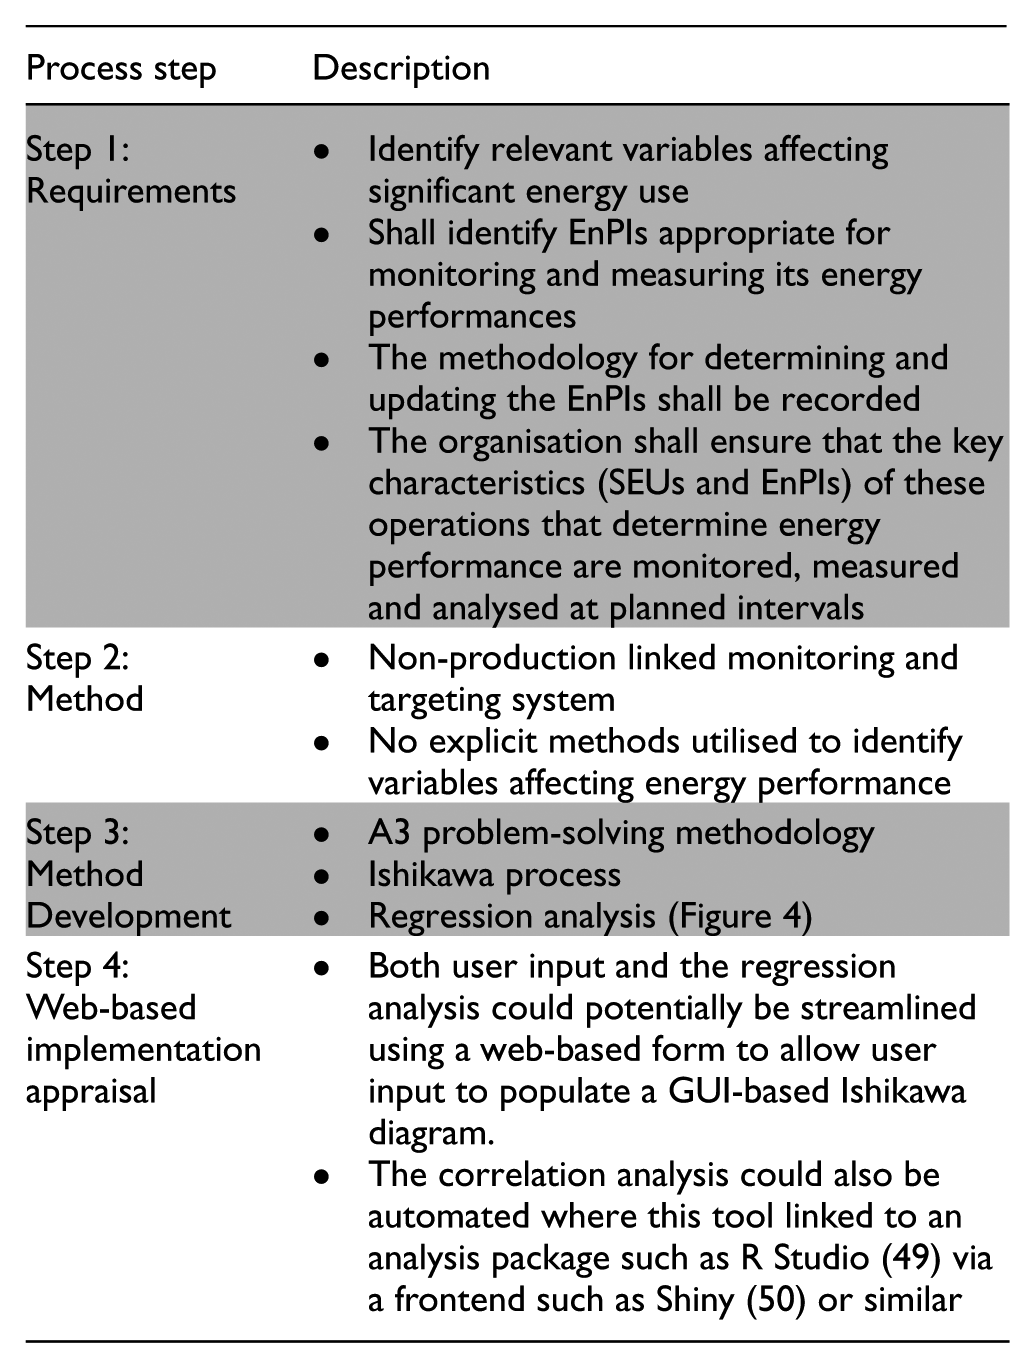
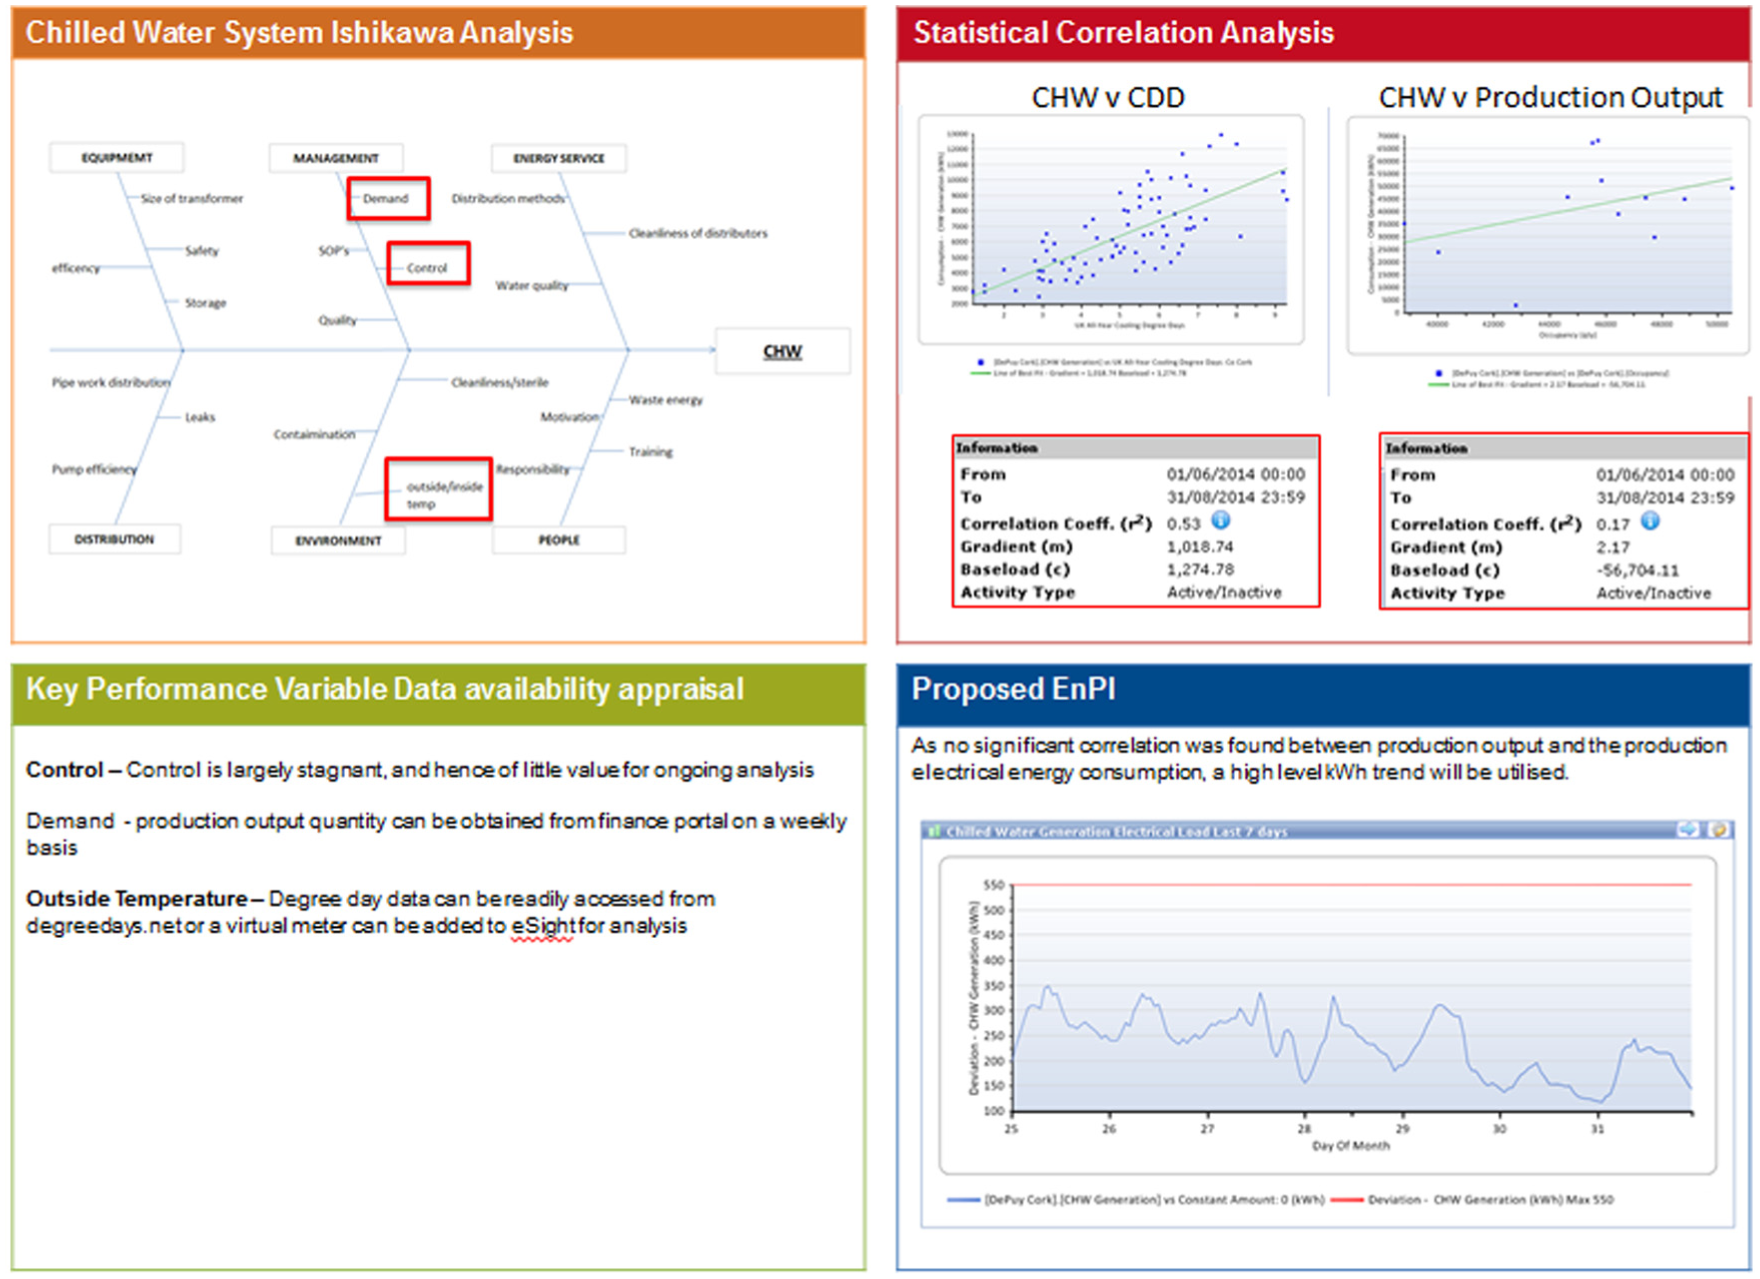
The four-panel EnPI A3.
Action planning
MS Excel-based opportunities and action plan tool.
Conclusions of proof-of-concept phase
By developing a structured and consistent approach to satisfying the requirements of the aforementioned clauses of the ISO 50001 standard, significant time savings could potentially result. The potential to standardise these activities for dissemination within a larger organisation also became apparent as end users could now fill out the template with the required base information in an organised and repeatable manner.
The next step in developing the proof-of-concept tools further was to migrate one to a semi-automated web-based solution potentially using a batch data upload process to test its operation. This would result in improvements over the manual method of operation:
The time required to deliver the requirements of the standard would be significantly reduced due to the tools leveraging on existing company data.
The analysis would be carried out by the software in a formalised and repeatable manner without the end user having to acquire knowledge to implement it.
The web-based rollout would ensure that group certification within one organisation would be consistent and auditable in an efficient manner
Section ‘Web-based tool development’ outlines the major steps in the development of one of the aforementioned tools.
Web-based tool development
In order to progress from a template-based manual process to a web-based semi-automated process, a decision was taken to progress the development of one of the three tools described in the previous section. As the opportunities and action planning tool was usually populated from a single spreadsheet, it lent itself to a batch upload or similar simplified data entry model making it in theory easier to develop than the more involved (in terms of the number of data sources) other tools.
The proposed architecture for the development of the action planning tool is displayed in Figure 6. It details a user input data from a CSV file format via an upload button. These data were then parsed via the data processor to a TSV file stored on an Amazon cloud-based server. From here, the TSV file is displayed via the D3 library on user prompt as a waterfall chart. The key information relating to ownership of an action plan item, energy savings projected and target delivery date would be displayed on rollover by the user.
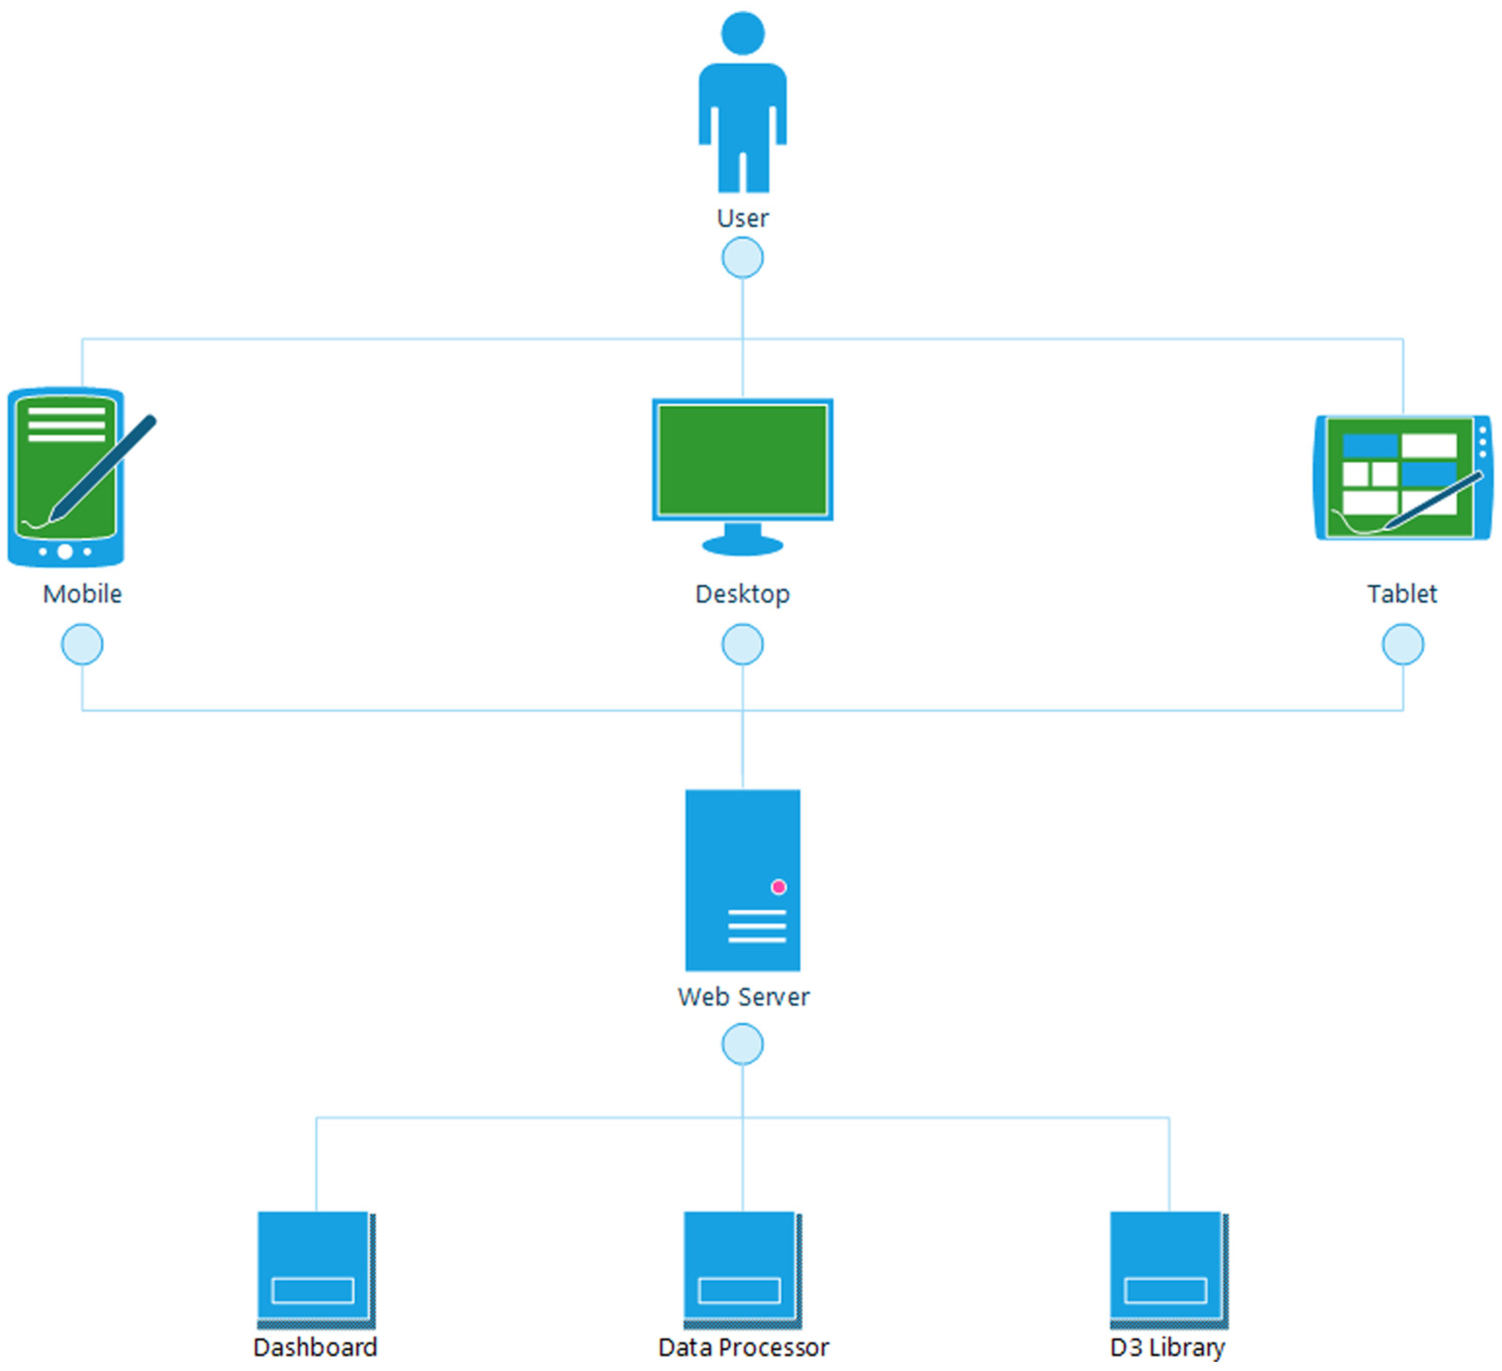
Action plan tool system architecture.
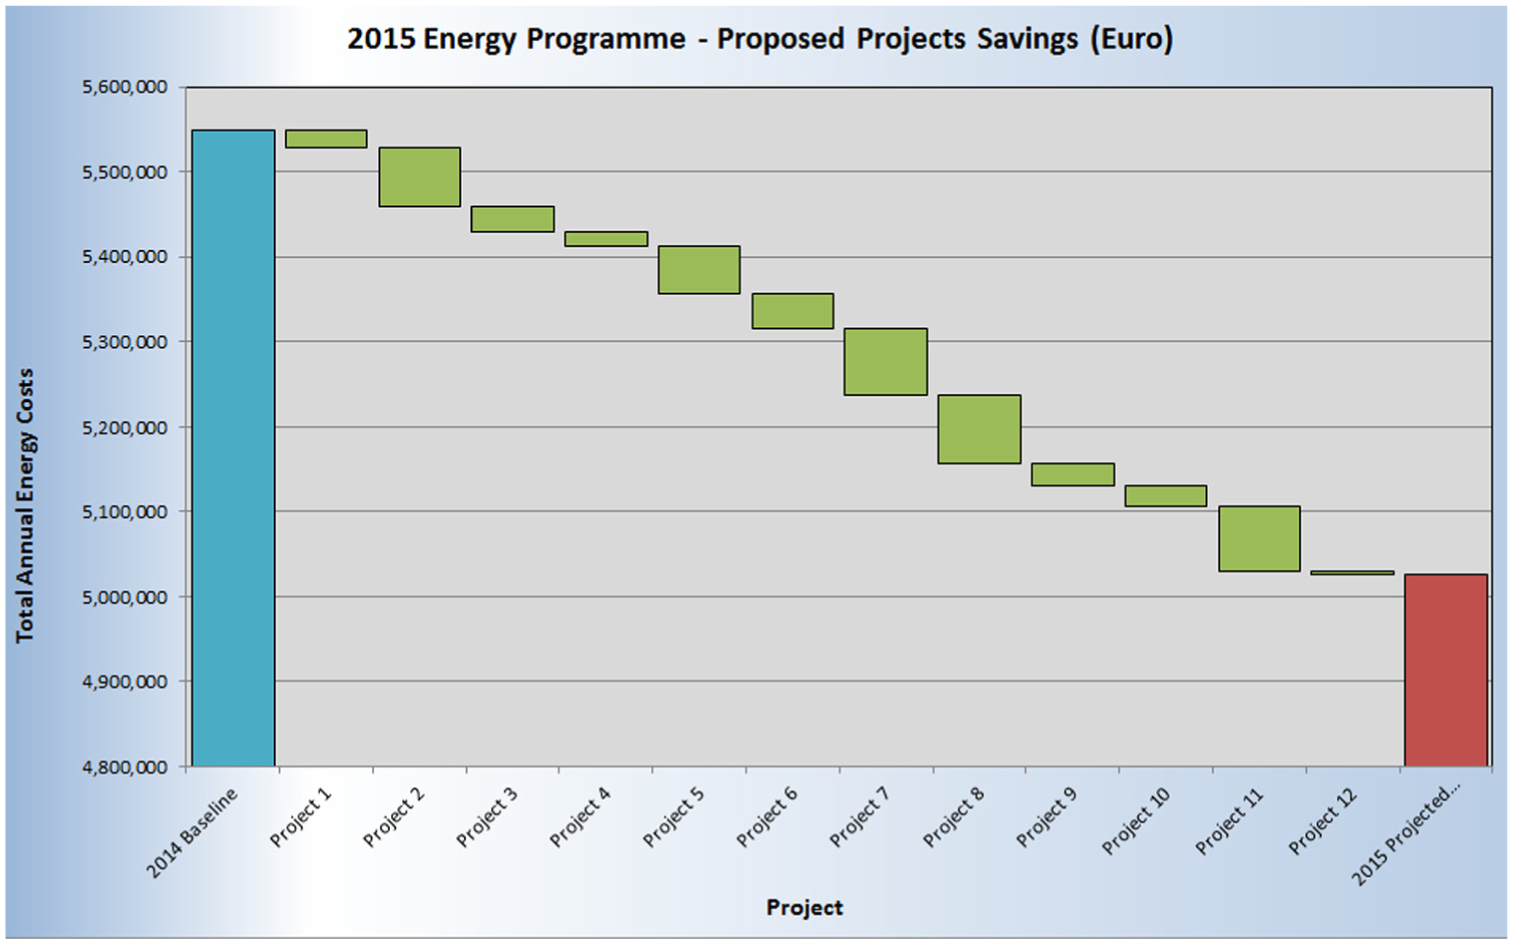
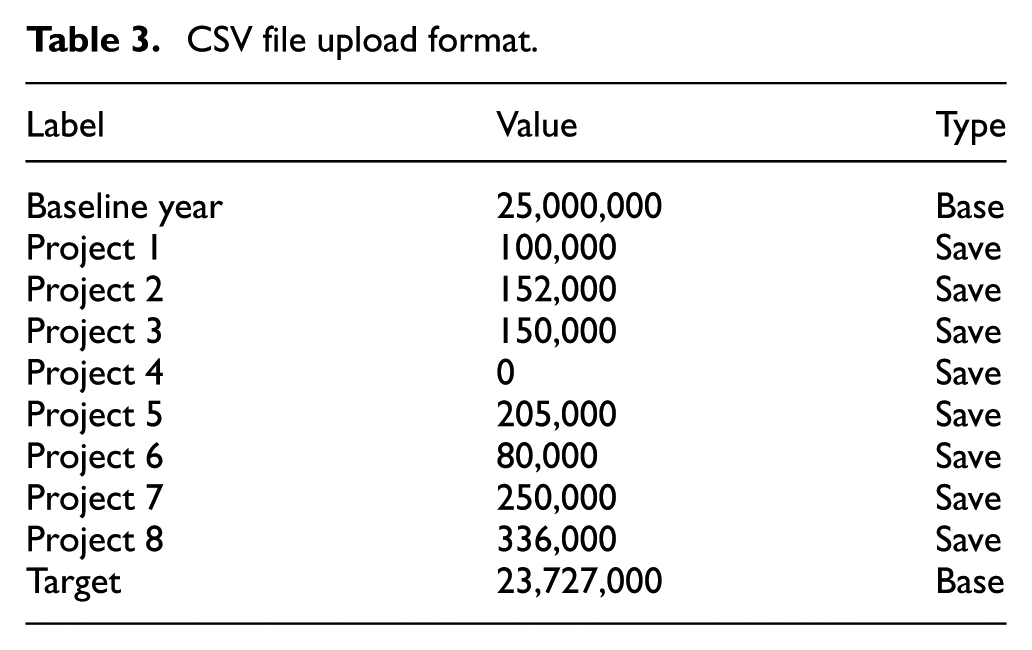
Figure 7 details the steps required to display the results in a browser in a unified mark-up language (UML) sequence diagram from a CSV file upload. The CSV file content was standardised in order to ensure data consistency and is displayed in Table 3. The type is set to ‘base’ for the baseline and target bars and to ‘save’ for each individual project to be subtracted from the baseline to reach the target.
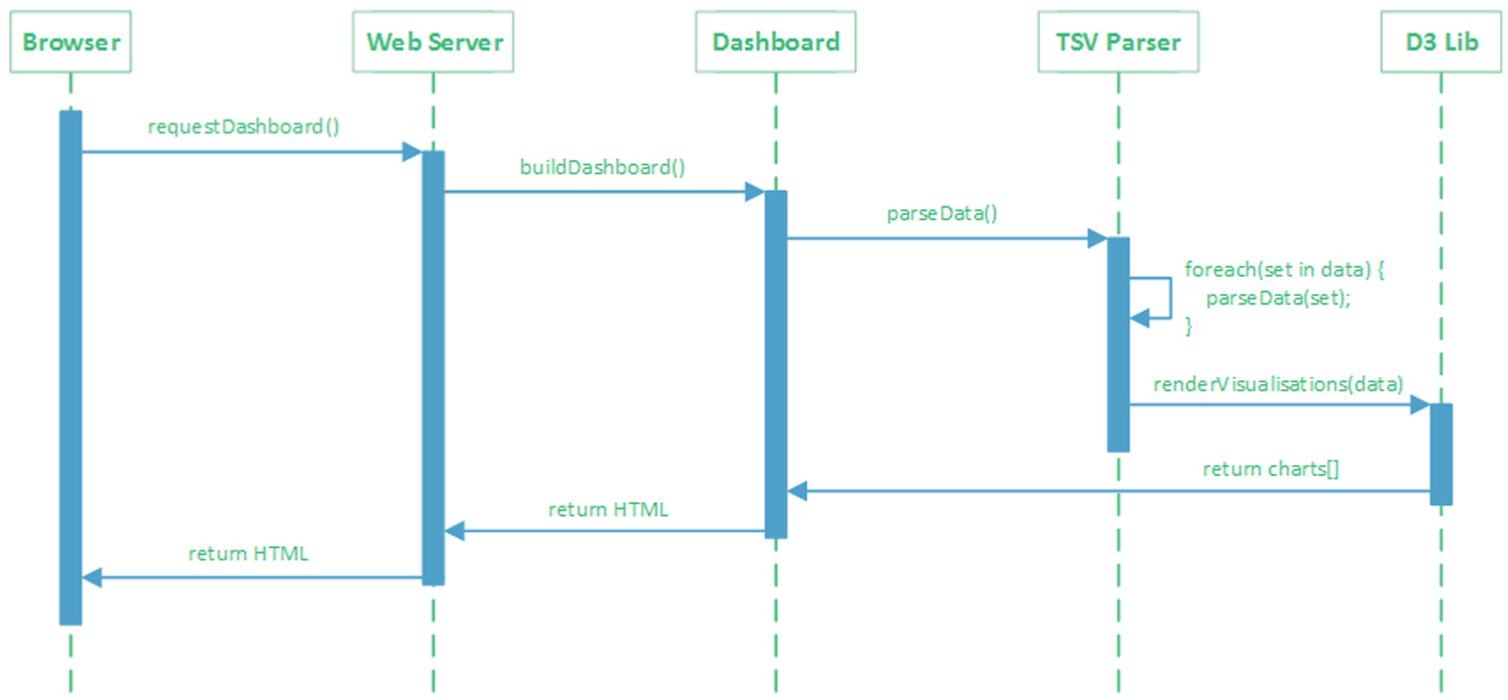
Sequence diagram.
CSV file upload format.
The decision to move to a browser-based tool was taken to ensure that cross-company compatibility would be maximised and that via the cloud computing model, any processing of data could be undertaken centrally rather than locally on each instance of the tool. Effective visualisation of large amounts of data can play an influential role in decision-making and planning in industry. Currently, there exist a number of graphics tools for web-based data representation. The usefulness of these tools is defined by characteristics such as cost, licenses, support, documentation, user interaction, complexity and cross-platform compatibility (both browser and device). For this project, four possible data visualisation methods/tools were considered, as outlined in Table 4.
Display technology selection.
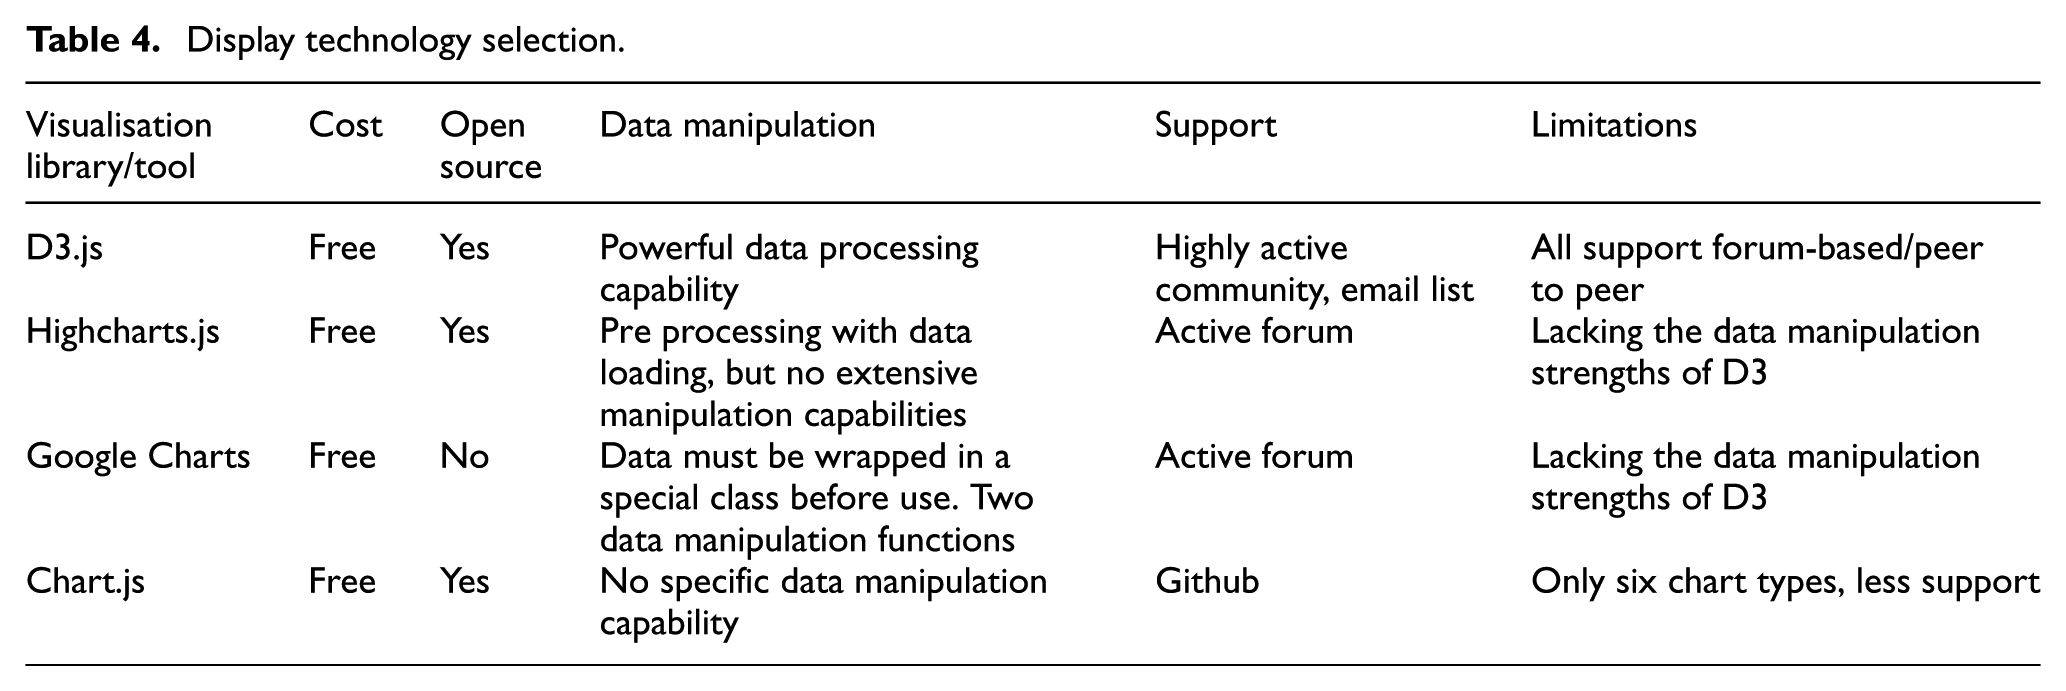
Based on the analysis documented in Table 4, it became clear that the vast majority of graphics libraries could be used to create impressive visuals. Many are open source and free to use. Most have many different chart types and extensive sets of examples. Nearly, all are able to use and display live data from a source. However, another important aspect to visualising the data, processing it to be ready for display and manipulating the data once it is rendered onscreen is handled much better by some tools than others.
This is where D3.js stands out. It is not only an incredibly powerful tool for graphical representation of data but also allows swift and easy access and manipulation of that data. It combines the strengths of a graphics library with that of a data processing library, making it a good choice for data visualisation. A decision was taken to progress the use of the D3 visualisation library as a prebuilt waterfall chart library existed which could be extended based on the requirements of this particular use case. The D3 library was also mobile-device compliant which though not a critical user requirement was seen as an advantage.
Tool testing
Once developed, the action planning pilot tool (Figure 8) was alpha tested by researchers not working on the project within the Intelligent Efficiency Research Group (IERG). Based on this testing, some design changes were made to the GUI to ease the users’ understanding of the data. The axes were linked to the projected target to ensure all project savings appeared adequately onscreen. The rollover content was also revised to ensure it only delivered key information. A decision was also taken to store snapshots of uploaded data as separate TSV files to allow the user to cycle between the latest and previous versions of the waterfall chart without overwriting data. This decision was taken in place of implementing a full database solution due to the relatively small size of the application and the pilot nature of the testing.
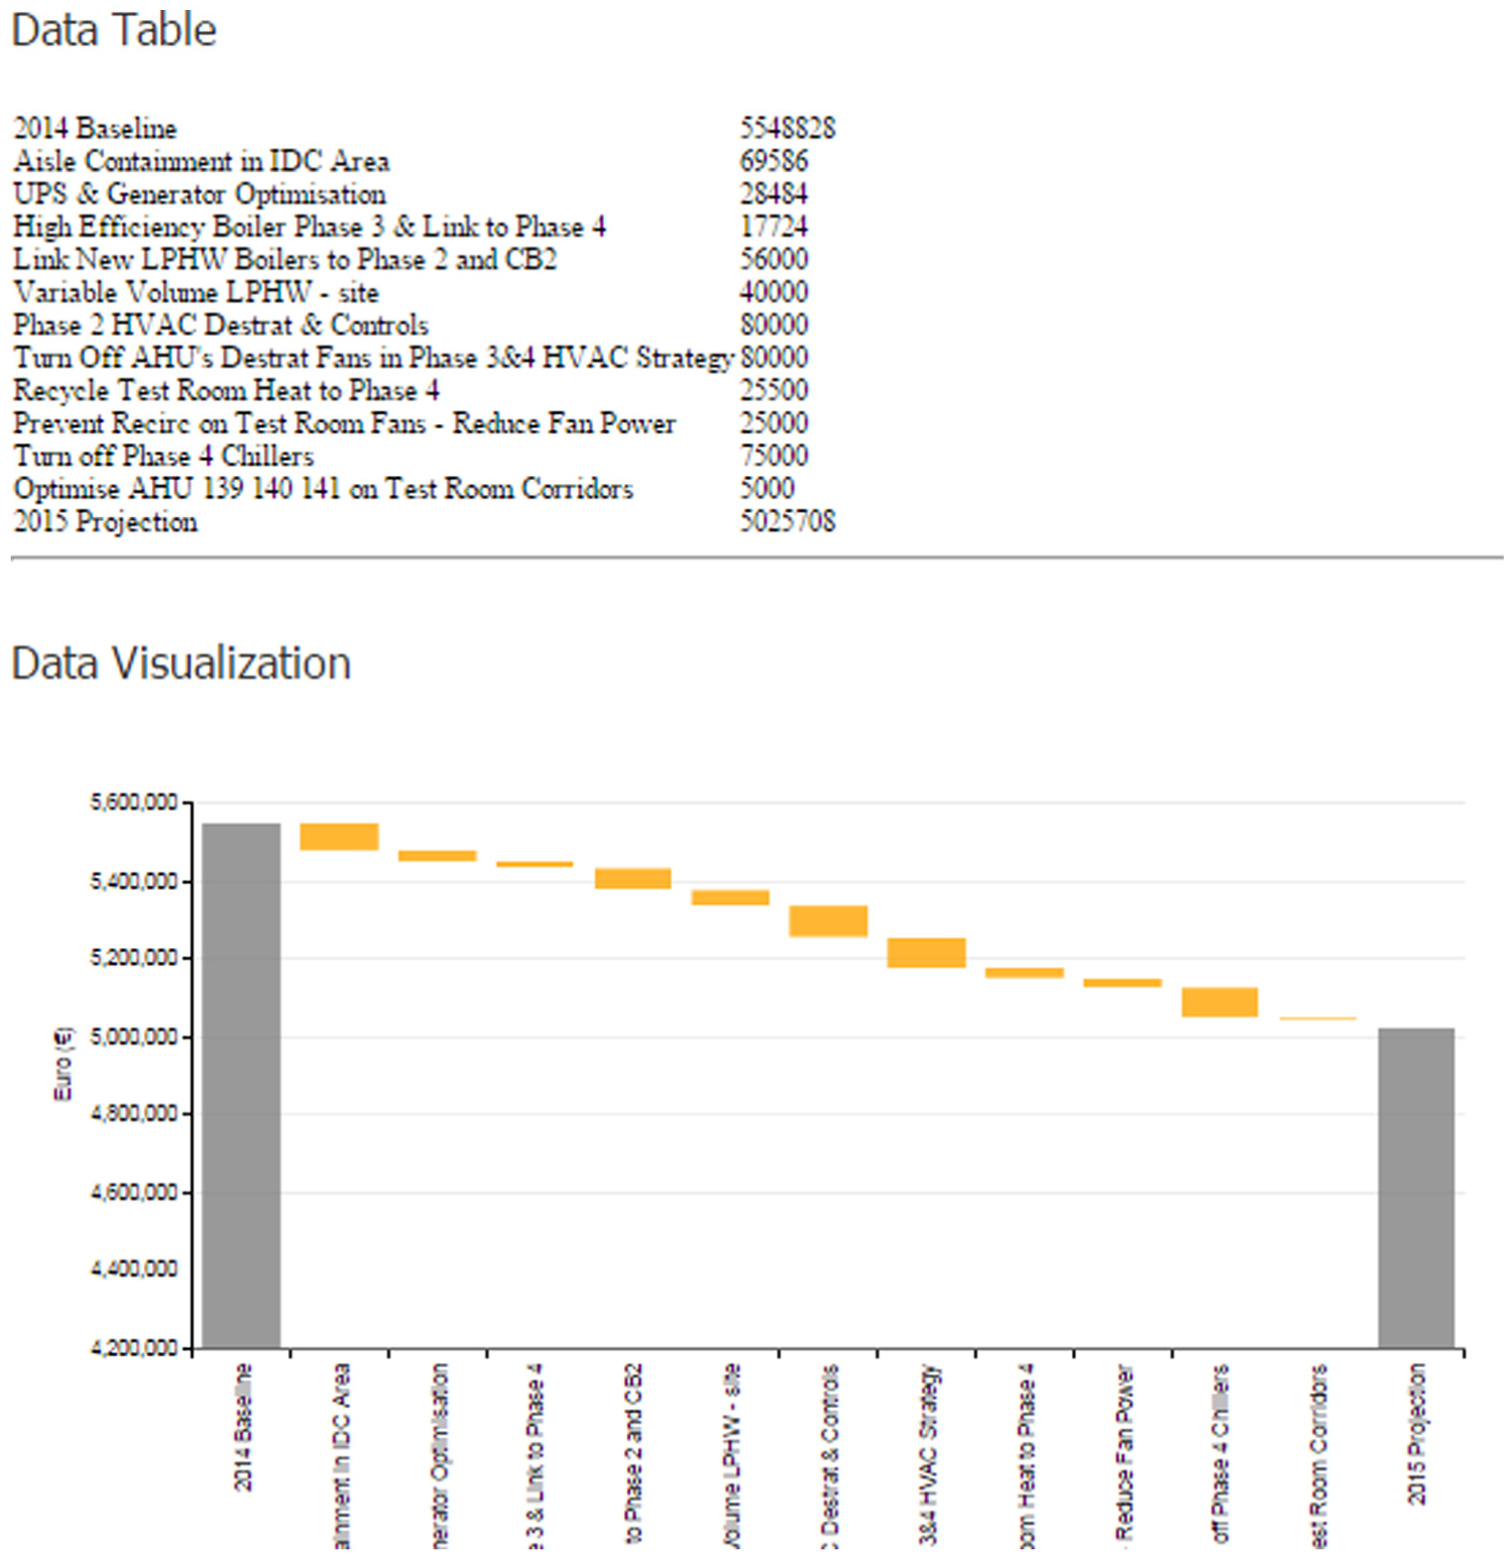
Screenshot of action planning tool GUI and waterfall chart output.
Once the changes recommended during the alpha testing were complete, the beta application was made available to one of the participant company energy managers. They had no knowledge of any of the development decisions taken and were only privy to the high-level idea behind its development. In order to gauge the results of the beta test process, a number of metrics were proposed:
Time taken to input all data and achieve a complete waterfall (recorded in minutes);
Perceived ease of use (subjective as a number from 1 representing very difficult to 10 representing very easy);
Effectiveness of visualisation in communicating action plans (subjective as a number from 1 representing very difficult to 10 representing very easy);
Likelihood to utilise tool in place of current system (subjective as a number from 1 representing not at all to 10 representing most definitely).
The results of the beta test are detailed in Table 5.
Beta test results.
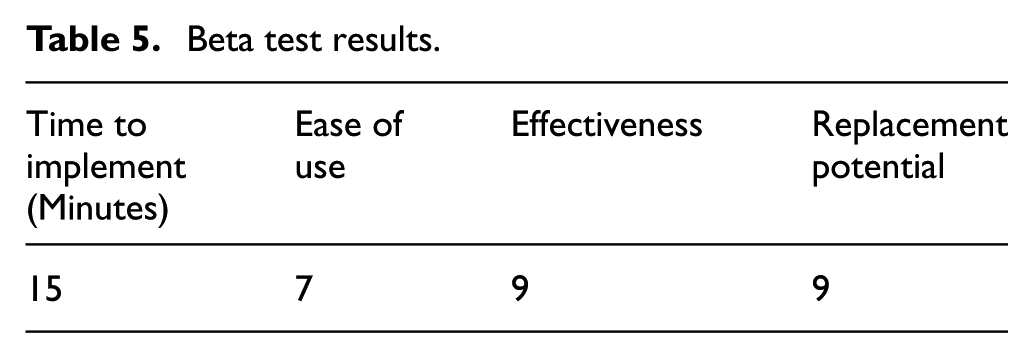
The time to implement metric is not directly related to the time to implement and operate days figure detailed in Figure 1, as the new action planning web-based tool has not been in use over a prolonged enough period of time to measure its effectiveness in this regard. It does, however, illustrate how quickly a company can upload data to the tool for visualisation, something that was often not progressed previously.
The effectiveness and replacement potential scores are very positive and potentially reflect the speed of implementation and more visual reporting structure of the waterfall display chart compared to the pre-existing excel spreadsheet-based data. The ease of use score of 7, though positive, is significantly lower than the other results. Having spoken to the end user at the company where the tool was under beta test, it would appear that the tool was very intuitive in its makeup to use, but due to its early stage development did have some quirks in terms of a requirement to enter data in a certain format in the CSV file which is uploaded to the web-based D3 library for visualisation which caused some issues with the user.
This along with the need to add some other information such as means and timeframe of project implementation, responsibility outline and M&V plans will form part of the future work to make this tool fully compliant with the ISO 50001 standard. The tool, however, shows enough potential in terms the feedback elicited from the participants’ companies to warrant further development.
Conclusion
A significant opportunity exists to develop web-based tools to support the implementation of key requirements of the ISO 50001 standard. Three companies, who took part in an embedded research study, were found to spend in excess of 70 resource days undertaking just three key requirements of the ISO 50001 standard.
As part of this research, a standardised approach has been developed to fulfil the requirements of each of the three key areas of the ISO 50001 standard identified as resource intensive. Of the three templates developed to deliver the requirements of the standard, the action planning tool was selected for progression to a web-based tool for pilot testing. This web-based tool was beta tested by one of the participant companies to determine its effectiveness.
It was found to be far more intuitive to populate than the existing excel-based spreadsheet currently utilised by the energy manager onsite. The graphical output (waterfall chart) was also found to be extremely useful by the site-based energy manager particularly when reporting out to senior management locally and globally. The fact that the system was web-based and accessible by the entire organisation in a controlled and secure manner also appealed to the energy manager as a move to central reporting is currently underway and this tool would fulfil the company’s requirements in this regard.
In summary, the action planning tool has shown potential for further development. With the research study participant companies spending between 20 and 30 days annually at significant resource cost operating their current action planning processes, there is scope for web-based tools to improve inherent processes and hence reduce the cost to operate the overall EnMS.
Footnotes
Declaration of conflicting interests
The author(s) declared no potential conflicts of interest with respect to the research, authorship and/or publication of this article.
Funding
The author(s) disclosed receipt of the following financial support for the research, authorship, and/or publication of this article: This study was supported by the Science Foundation Ireland (SFI) and the Marine & Renewable Energy Ireland (MaREI) Research Centre, without whose support, this research could have not been undertaken.