
Abstract
In the present investigation, an effort has been made to explore the outcome of cutting parameters (cutting speed, feed and depth of cut) on surface roughness parameters (Ra, Rz) and cutting force (Fc) using solid carbide end mill cutter. During the existing study, a novel fuzzy technique for order preference by similarity to ideal solution, grey relational and response surface analysis technique is utilized to find out the optimal settings of computer numerical control milling process parameters with an endeavour to improve the quality of the machined surface. Hence, generating optimum surface roughness values are essential to obtain high productivity in the manufacturing of different machined parts. In this article, the first motive is to investigate computer numerical control milling of Al-4.5%Cu-TiC metal matrix composite developed by in-situ technique using fuzzy technique for order preference by similarity to ideal solution and grey relational analysis to find out optimum cutting parameters. The second motive is to verify using response surface analysis mathematical model depending on cutting parameters of surface roughness and cutting force in milling. The potentiality of the developed model is proved by analysis of variance technique. The analysis of variance result shows that the depth of cut is the leading process parameter affecting the surface roughness and cutting force values.
Keywords
Introduction
Metal matrix composites (MMCs) offer attractive opportunities for latest product design because of having better properties as compared to different conventional engineering materials. A number of useful properties of MMCs are high strength and stiffness, lower coefficient of thermal expansion, increased wear resistance and dimensional stability at a elevated temperature. In aluminium metal matrix composites (AMCs), aluminium/aluminium alloy is the matrix and other phases are reinforcement, such as TiC, Al2O3, SiC, B4C and Gr.1,2
There are several techniques available to produce MMCs, for example, powder metallurgy, squeeze casting, stir casting, pre-form infiltration, spray deposition and compocasting.3–5 Stir casting technique is commonly accepted owing to its simplicity, flexibility and its easy applicability to different large quantity productions. The titanium carbide (TiC) reinforcement is more attractive due to its fine wettability with molten aluminium, low density, low chemical reactivity, high hardness and elastic modulus.6,7
The in-situ MMCs have gained significance owing to superior wettability and contamination-free reinforcement which gives a strong bonding with the metal matrix.8,9 The function of interfacial reaction in MMCs is very significant as it can influence the way load is transferred at the interface which eventually influences the mechanical properties. In in-situ composites, the reinforcement phases are produced within the parent matrix, controlled by a variety of process parameters for, instance, holding time, melt temperature and atmosphere. 10 In automobile sectors, the Al-based MMCs are used to make brake drums, cylinder blocks, cylinder liners, drive shaft and so on. They are also extensively used to construct structural parts, drive shaft, rotor vanes, rotor plates and so on in the aerospace industries.11–14
Although most composite materials are moulded or formed close to near net shape, the machining process could not be eliminated completely since it provides the preferred dimensions, shape and surface finish. Milling is the most general and flexible technology for machining process categorized by a wide range of metal cutting ability, which places it in a vital role in manufacturing industry. 15 In recent years, a variety of experimental, statistical and simulation model studies based on different experimental design and analysis of different experimental methods for the modelling of surface roughness and cutting forces occurred in different machining of a variety of composite materials were carried out. A number of the literature studies are given below.
Palanikumar and Karthikeyan 16 indicated that in order to machine Al–SiC composite, the surface roughness has got influenced by the feed rate, cutting speed and the volume fraction of SiC particles. Basheer et al. 17 reported that in different precision machining of MMCs, the roughness of the finished machined surface is drastically influenced by the size of reinforcement particles. It is been found that its magnitude depends on its feed and tool nose radius. Hocheng et al. 18 observed the machining characteristics for instance discontinuous chips, low cutting forces, a lesser amount of tool wear and low power consumption in machining of Al-graphite composite. Krishnamurthy and Sridhara 19 obtained significantly reduced cutting forces during machining of Al–SiC–Gr hybrid composite, compared to Al–SiC composite. This is owing to the presence of graphite particles in Al–SiC–Gr hybrid composite, which reduces the friction developed at the machining interface. Rai et al. 20 investigated formation of chips and measured cutting force generated during shaping operation of Al–TiC MMCs produced by the in-situ technique and compared with Al–TiAl3 composite and Al–Si alloys. It was observed that there was enhancement in the quality of the machined surface with augmented amount of TiC particles in the composite. The cutting force for Al–TiAl3 composite and Al–Si was greater than that for the Al–TiC MMC. Anandakrishnan and Mahamani 21 studied the machinability behaviour of in-situ Al-6061-TiB2 MMCs prepared by flux-assisted synthesis technique. Flank wear, cutting force and surface roughness were found to be higher with a higher value of depth of cut.
In the literature, the most frequently applied techniques available for doing optimization of different materials are Taguchi technique, response surface methodology (RSM), artificial neural network (ANN), scatter search technique, genetic algorithm, fuzzy logic approach and grey relational approach and so on. 22 Ankita et al. 23 applied fuzzy-based desirability function for doing optimization of various bead geometry parameters of submerged arc weldment. Kovac et al. 24 predicted surface roughness using the fuzzy and regression model analysis technique. Deng 25 introduced a grey system to deal with incomplete and uncertain outputs. This system also seemed to solve the complex inter-relationships between multiple responses. Grey relational analysis (GRA) is used mainly for doing multi-response optimization to obtain related level of input process parameters for superior performance characteristics.26,27 This method is used for performing optimization in several applications such as drilling, 28 turning, 29 milling,30,31 Electric Discharge Machining (EDM)32,33 and different welding processes.34–36
Asilturk and Neseli 37 worked on multi-response optimization of computer numerical control (CNC) turning process parameters using Taguchi method with response surface analysis (RSA). Neseli et al. 38 have worked on optimization of different tool geometry parameters for turning operations using RSM. Yildiz 39 has presented a new hybrid teaching-learning-based optimization (TLBO) algorithm and Taguchi’s method, applied to two case studies of multi-pass turning operations. The results were being compared with particle swarm optimization (PSO), hybrid genetic algorithm (GA), GA, scatter search algorithm, Hooke–Jeeves pattern search algorithm and integrated simulated annealing method, where TLBO has given better solutions.
Yildiz 40 has introduced a hybrid differential evolution algorithm to solve multi-pass turning operation problem. The comparison results confirmed the superiority of the hybrid algorithm. Yildiz 41 had also developed a new hybrid differential evolution algorithm technique to minimize the cost of production of multi-pass turning operation. The results exposed that the hybrid approach is better than other non-conventional algorithms. Yildiz 42 used cuckoo search algorithm in milling optimization, and results were being compared with different optimization techniques such as immune algorithm and Ant Colony Optimization (ACO) algorithm. Yildiz 43 also used artificial bee colony (ABC) algorithm to optimize the cutting parameters of multi-pass turning operation. The found results were being compared with earlier published papers in literature. Yildiz 44 also has applied an optimization approach to solve a case study of milling operation. The found results were being compared with other optimization techniques. Majumder 45 had used GA, simulated annealing and PSO technique in combination with neural network for predicting the optimum parameters of EDM process.
Several researchers had worked on the optimization of milling process parameters. Wang et al. 46 have presented a novel methodology relating to GAs to find optimum cutting parameters of single-pass milling operation. Kuram and Ozcelik 47 used Taguchi technique to find out the optimum micro-milling parameters of Ti6Al4V titanium alloy and Inconel 718 material by finding the influence of spindle speed, depth of cut and feed on the tool wear, surface roughness of the surface machined and cutting forces generated. To predict the response parameters, regression equations were also developed. Dikshit et al. 48 have used composite desirability function and TLBO algorithm to determine the optimal cutting parameters of ball end milling process. To analyse the effect of the input parameters on the responses, analysis of variance (ANOVA) was carried out. Onwubolu 49 has used tribes for finding out the optimum cutting parameters in single-pass milling operation, using the contribution effect of all machining performance for milling operation and also compared the results with previously published results in the literature. Babu et al. 50 have used RSM for studying the condition of the cutting tool by doing analysis of the surface roughness and the vibration of the cutter.
Motivation of this study
In recent times, optimization of process parameters of any machining process is getting more attraction of the researchers in order to improve quality of the finished product with a minimum cost associated in it. However, many methods for choosing optimal parameters do not assess each parameter. It is expected to maintain the values of surface roughness and cutting forces at the minimum and to manage unwanted machining results, for instance, poor surface roughness. Simultaneously, finding surface roughness and cutting force values are significant for maintaining production in the suitable tolerances with decreasing production costs. With the aim to minimize the surface roughness and cutting force, an optimal setting of input parameters is essential. The existing literature review exposed that there is no implementation of fuzzy technique for order preference by similarity to ideal solution (TOPSIS) approach for doing process parameter optimization of in-situ Al-4.5%Cu-5TiC MMC in CNC milling machine. Thus, it would be a novel approach to prepare an in-situ Al-4.5%Cu-5TiC MMC by stir casting technique and using fuzzy TOPSIS method to establish the optimal machining parameters for CNC milling machined part for optimization of response parameters such as cutting force and surface roughness. This study thus uses a new technique for choosing optimal cutting parameters, fuzzy TOPSIS technique and GRA to optimize the machining parameters in CNC end milling of Al-4.5%Cu-TiC MMC. Subsequently, in the second phase, a surface roughness and cutting force prediction model is generated using RSA. Hence, fuzzy TOPSIS approach provides a feasible solution to establish optimum setting of machining parameters with multi-performance characteristics.
The high-speed CNC milling process parameters
Cutting parameters
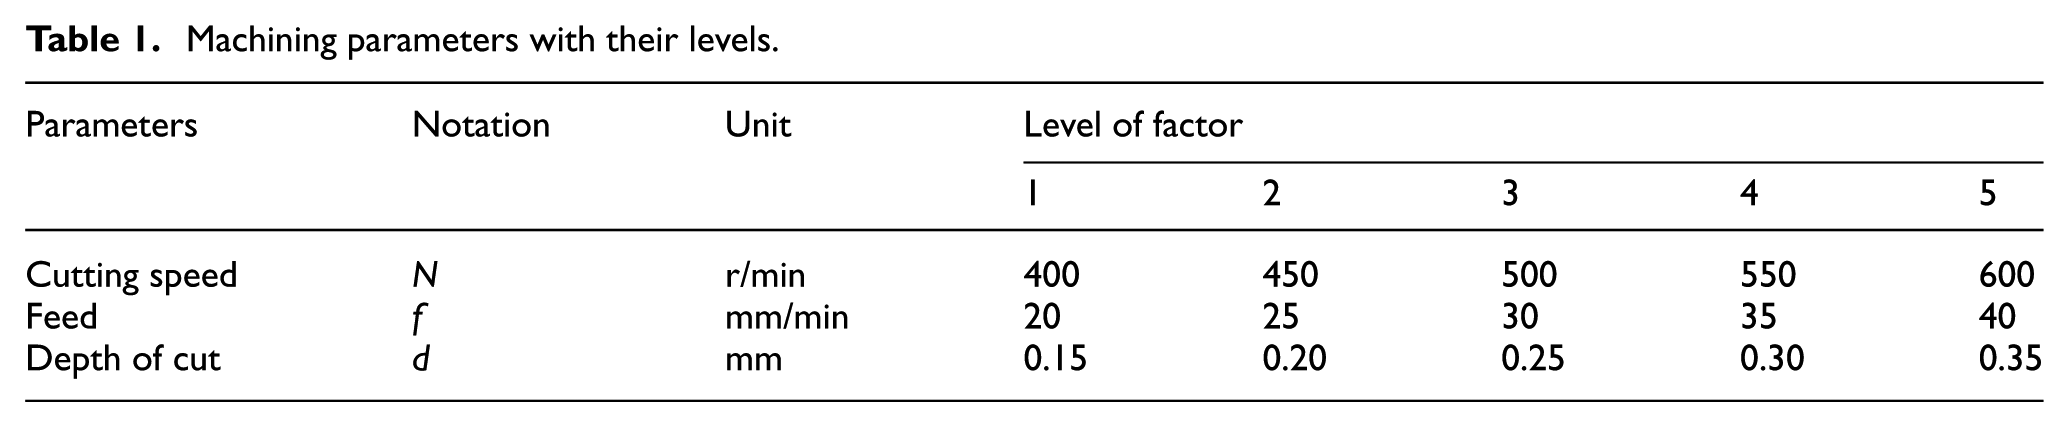
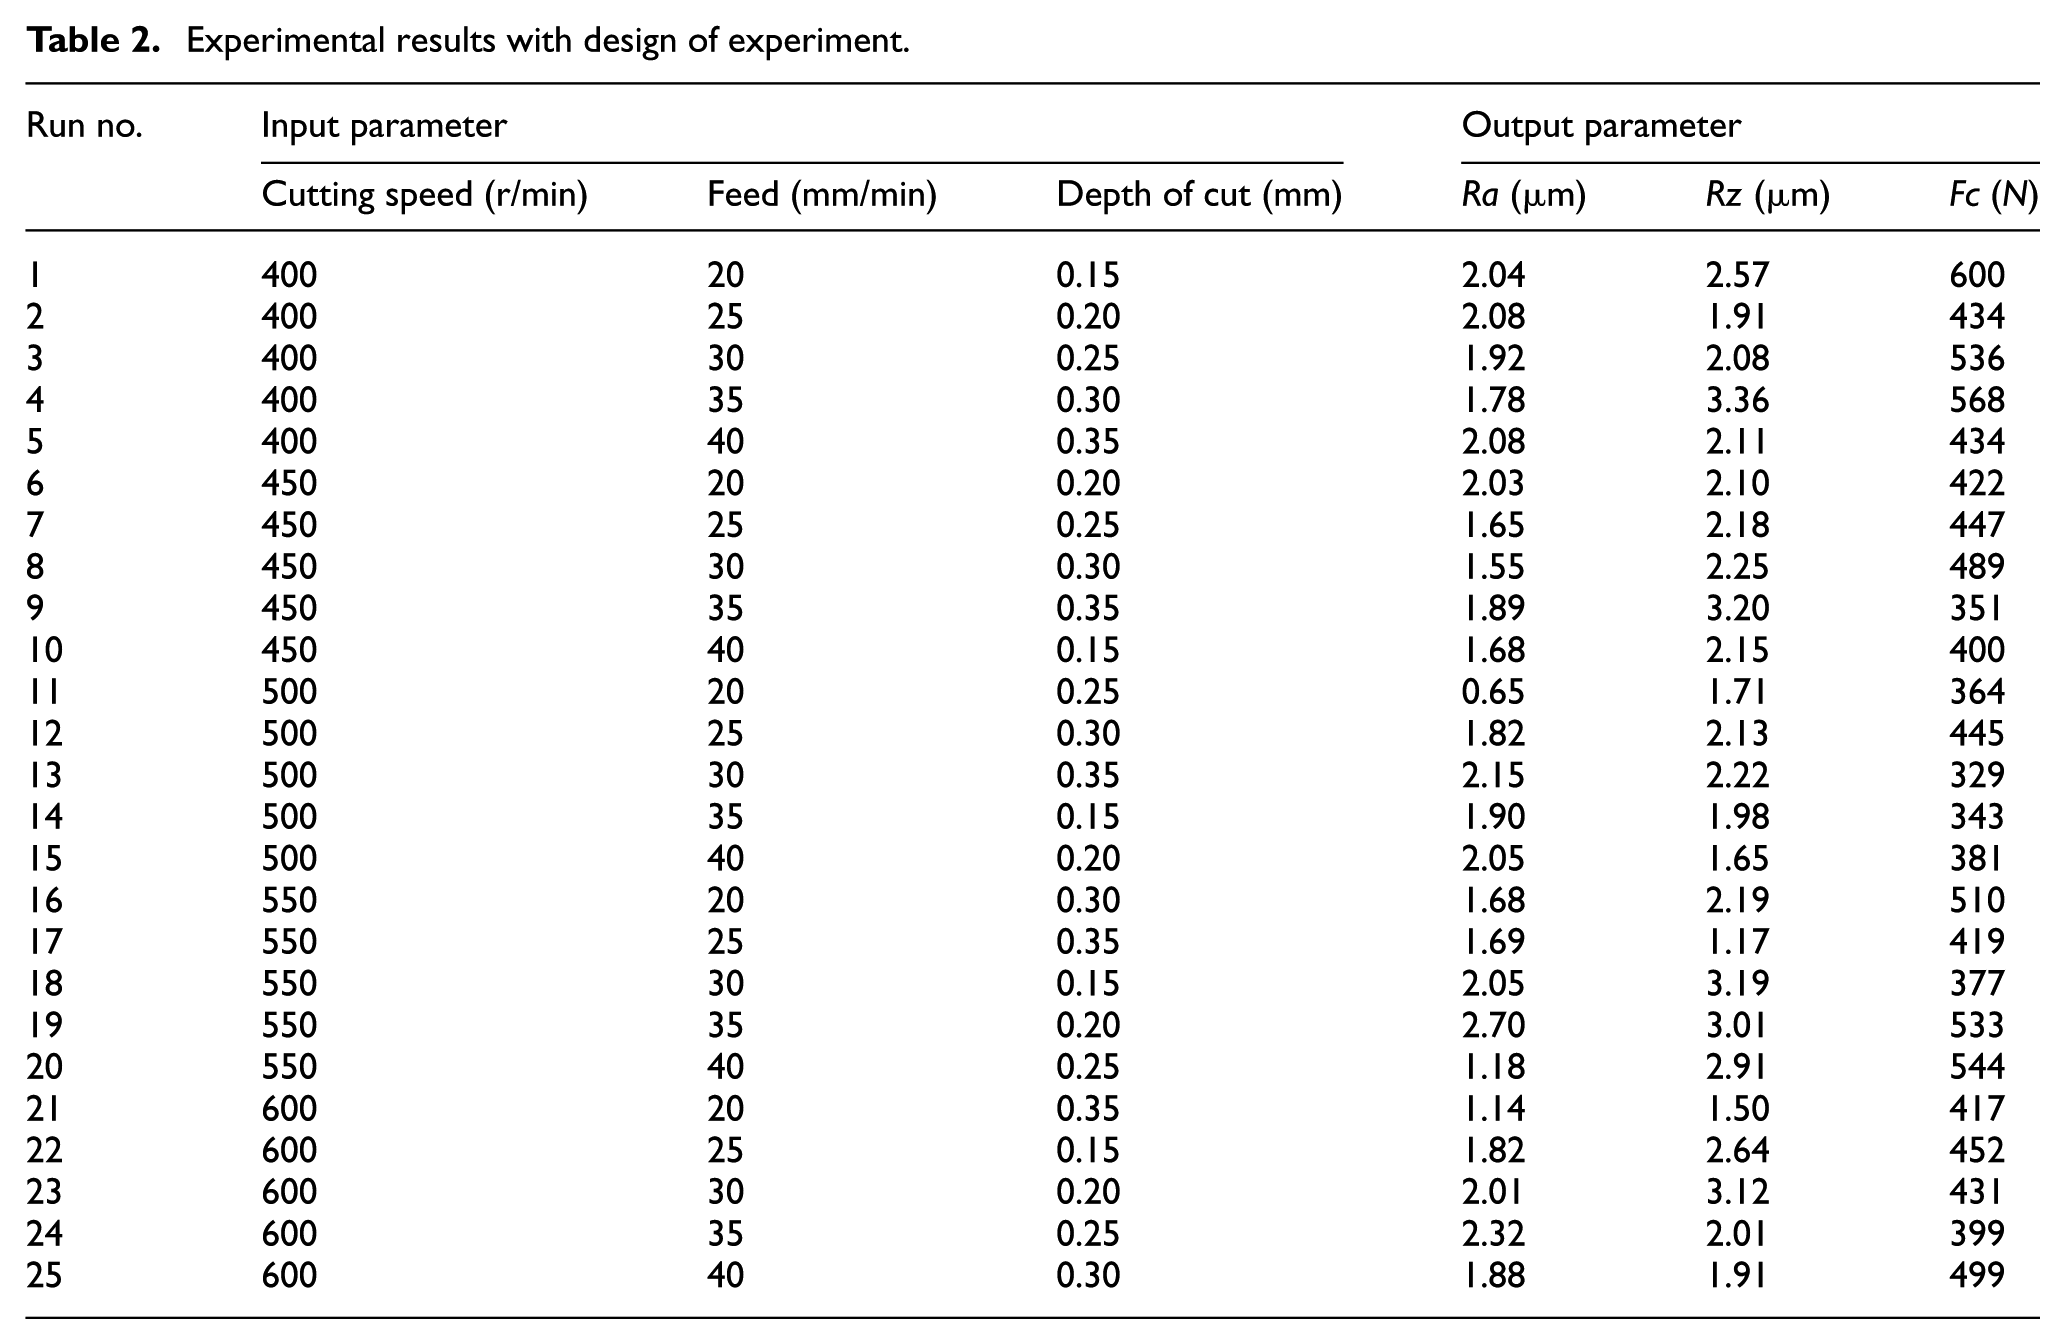
The process parameters taken for the present investigation are shown in Table 1. An L25 orthogonal array design is chosen, and five different levels to each cutting parameter are selected (Table 2).
Machining parameters with their levels.
Experimental results with design of experiment.
Experimental details
The material used in this experimental study is Al-4.5%Cu-5TiC MMC. Al-4.5%Cu-5TiC MMCs were prepared at a temperature of 1250 °C by an in-situ technique in an induction furnace. Titanium rod (99.8% purity), activated charcoal powder (average size 150µm), commercial pure aluminium ingot (99.9% purity) and copper rod (99.8% pure) were used as the charge materials. In an induction furnace, at first, pure aluminium (Al) ingot was melted in a crucible made of graphite material at a temperature of 685 °C, afterwards pure copper (Cu) was added to the hot molten aluminium at 800 °C and using a graphite stirrer, the mixture was continuously stirred. After that, pure titanium (Ti) was added to the hot liquid material at 1000 °C, and the mixture was continuously stirred in the crucible. At a temperature of 1100 °C, activated charcoal powder was added to the Al–Cu–Ti melt and it was hold for 5 minutes to let the event of the reaction thereby forming TiC inter-metallic particles in the melt and simultaneously the mixture was continuously stirred. A small amount of potassium fluoride and sodium fluoride were used as a flux cover in order to eliminate the oxide film formation from the molten metal surface and for acting as a protecting barrier to gas absorption and to make possible impulsive incorporation of the particles into the melt.51,52 Afterwards, the hot liquid melt was cast into rectangular metallic mould (30 mm × 30 mm × 80 mm) to perform the CNC milling process. A solid carbide end mill cutter of length 75 mm, diameter 8 mm, having four number of flutes, 25 mm flute length, was used for machining Al-4.5%Cu-5TiC MMC in CNC milling machine in dry condition, as shown in Figure 1.
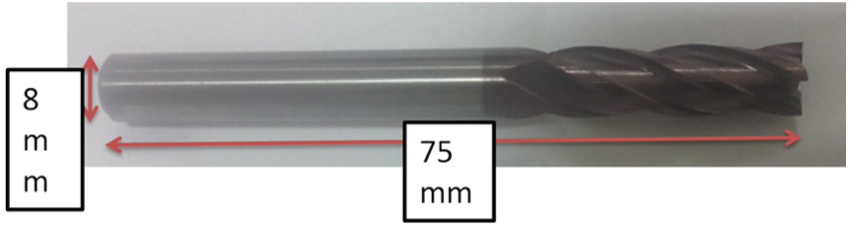
Solid carbide end mill cutter.
The experimental work was carried out at CNC & Robotics Lab, National Institute of Technology, Agartala, on a high-speed CNC milling machine manufactured by MTAB Engineers Pvt. Ltd. The cutting force in the direction of the tool travel (Fc) was measured with a dynamometer. Surface roughness was measured using a three-dimensional (3D) profilometer at 20× magnification and at 4.7 mm cut-off distance. All the corresponding measurements were repeated five times. The experimental set-up is shown in Figure 2.
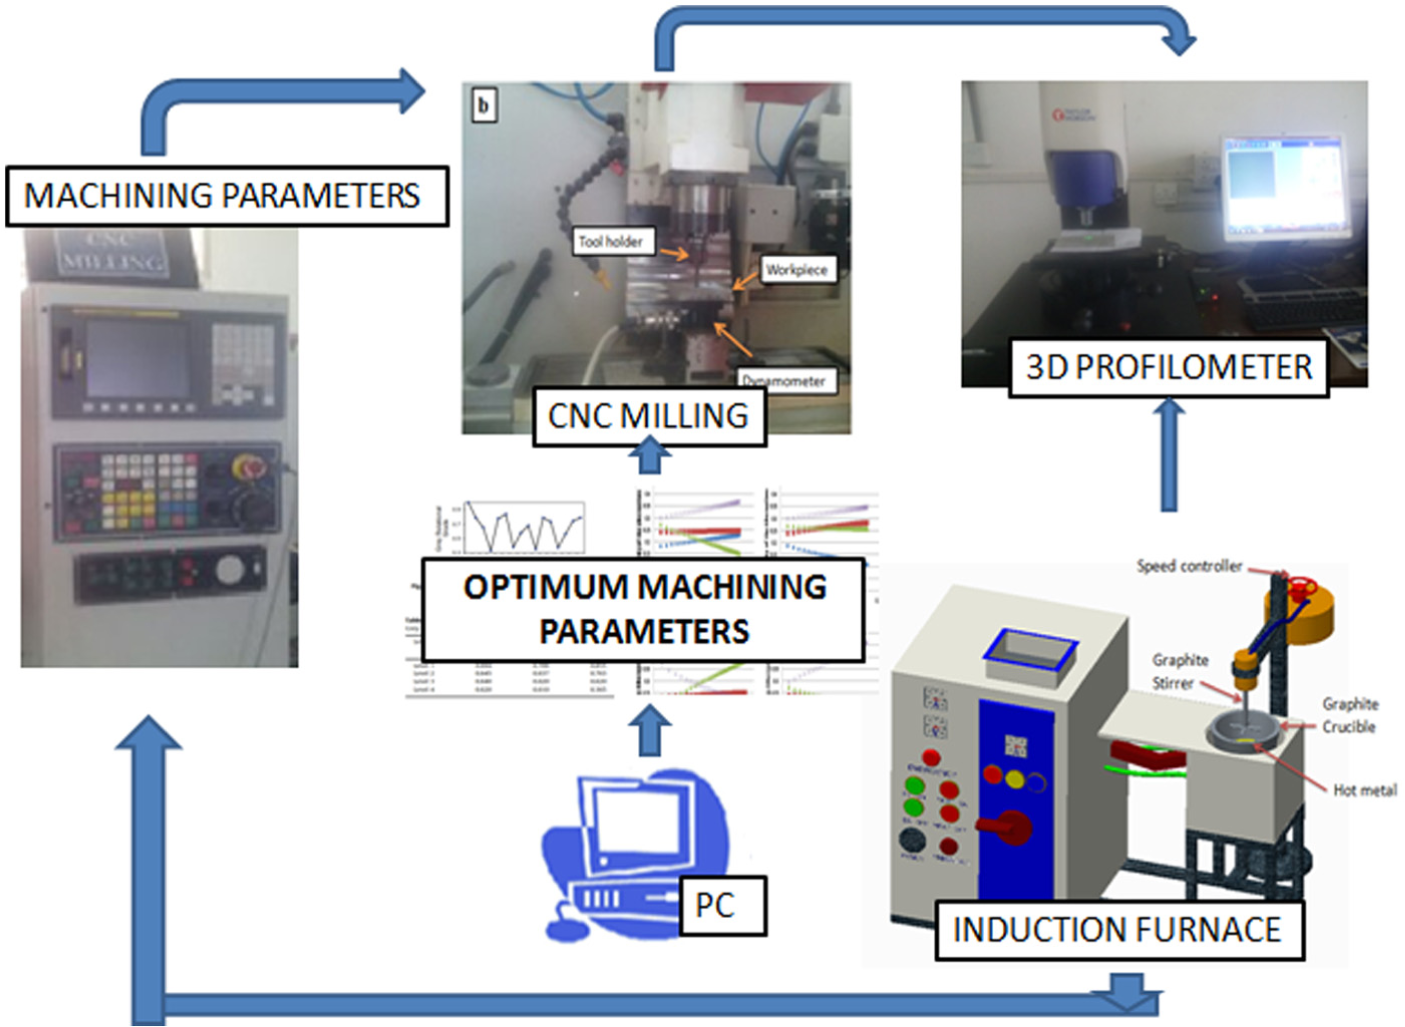
Experimental set-up.
Design of experiments
RSA
RSA is a well-known approach to the optimization of the input parameters based on physical experiments, simulation and experimental observations. These models need to be assessed statistically for their competency, and then they can be used for an optimization of the model. 37 The RSA problems have a functional relation among responses and independent variables, and this relation is explained using the second-order polynomial model given below 53
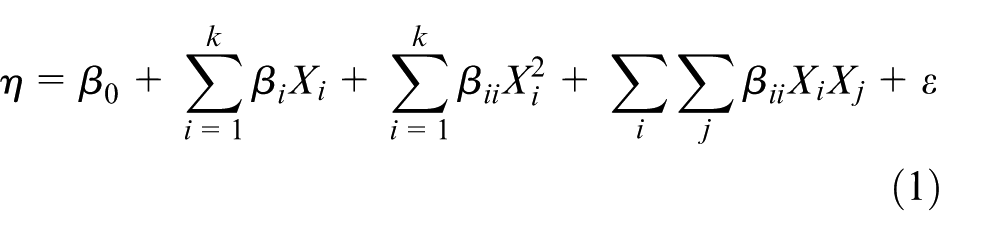
where η is estimated response,
GRA
Although the Taguchi method is used for optimization of the single response characteristic, the GRA is used for optimization of the multiple outcomes. Hence, the GRA method is more complicated.54,55 In GRA, the total optimization process is carried out in the following three phases.
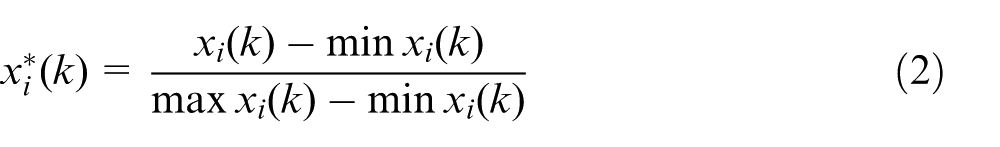
In the first step, the measurement values of centre line average roughness (Ra), average maximum height of the profile (Rz; shown in Figure 3(a)–(b)) and cutting force (Fc) are normalized in the range of 0–1. This process is identified as grey relational normalization. Such normalization is essential since the range and the unit in one response may differ from the others. If the response is of ‘higher-the-better’ type, equation for normalization is as follows
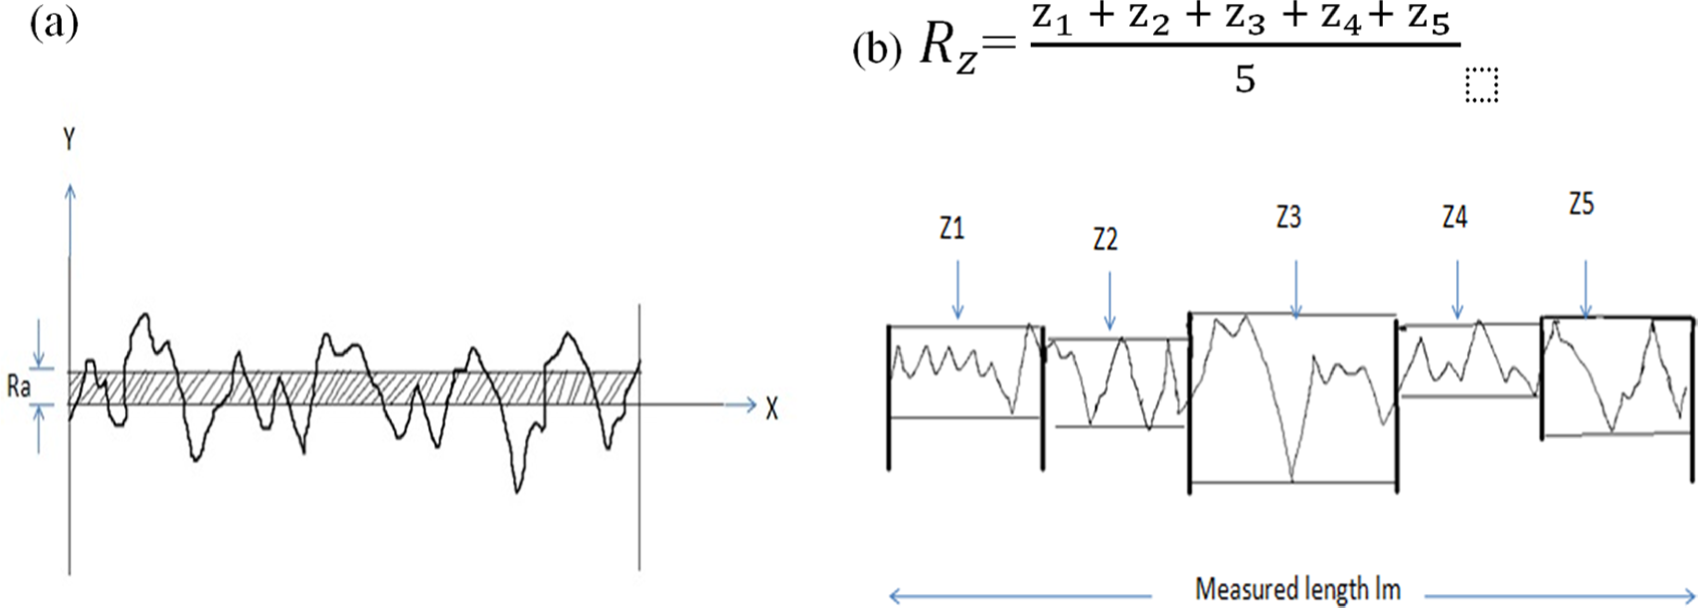
Pictorial representation of surface roughness, Ra (a) and Rz (b).
If ‘lower-the-better’ criterion is to be chosen, then the following equation is to be utilized for normalizing the consequent data
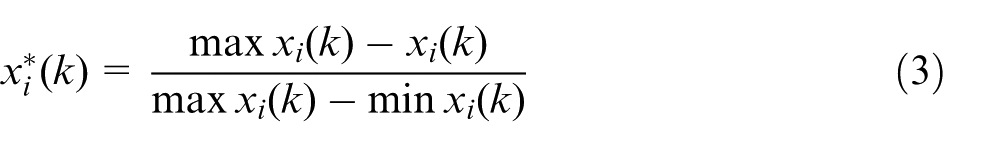
where
where
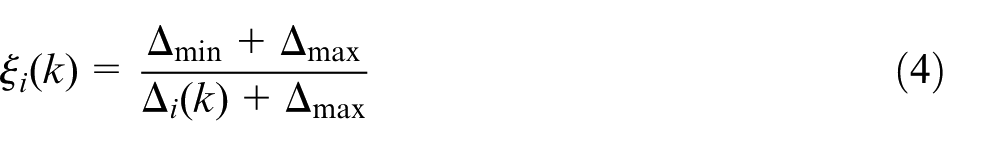
In the third step, the grey relational grade (GRG) is computed by doing average of the GRC related to each performance characteristics. This degree is approximated with the following equation
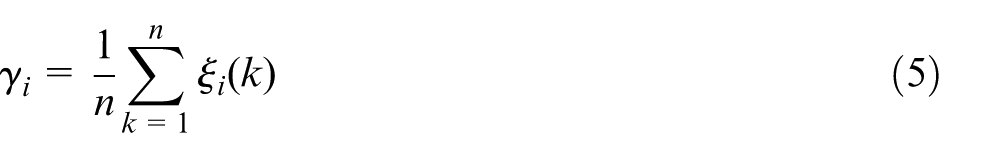
where
Fuzzy theory
The fuzzy concept definition is relevant for understanding the TOPSIS and has been adapted from these sources. These definitions are as follows.
A fuzzy set
A trapezoidal fuzzy number is being represented as
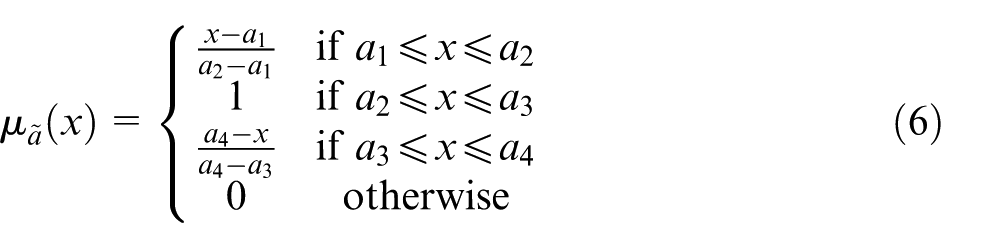
where
The distance between the fuzzy trapezoidal numbers: let
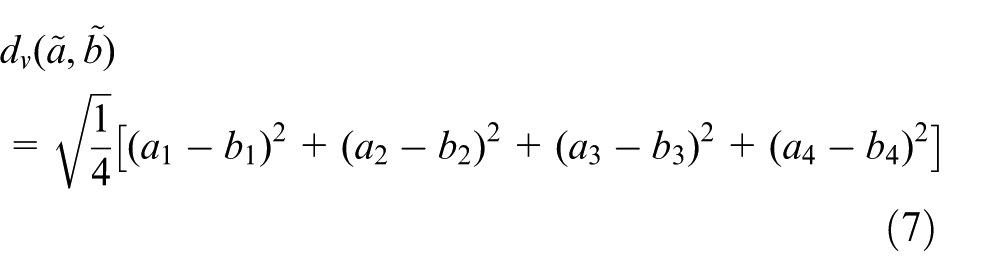
The vertex method is effective and simple to calculate the distance among two trapezoidal or triangular fuzzy numbers. According to the vertex method, two trapezoidal numbers
Fuzzy TOPSIS technique
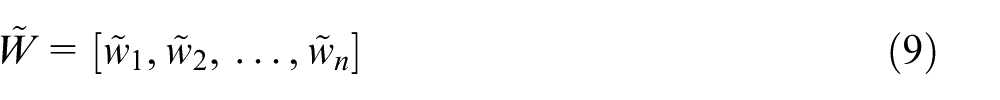
The fuzzy TOPSIS technique displays successful practice samples, particularly in practical problems where individual opinions and convictions are expressed by linguistic data. In the fuzzy TOPSIS method, linguistic scores that each choice receives from all the criteria are used in the configuration of a fuzzy decision matrix and the normalized fuzzy decision matrix. Fuzzy positive and fuzzy negative best solutions are obtained by taking into concern the rates of all criteria. At this point, the distance coefficient of every option is calculated, and in this way the preference order of the alternatives is considered in line with the criteria specified. In the fuzzy TOPSIS method, the fuzzy significant weights of the criteria (wj; j = 1, 2, …, number of criteria (n)) and the fuzzy rating of alternatives at criteria (wij; i = 1, 2, …, number of alternative(m), j = 1, 2, …, number of criteria (n)) are inputs that are positioned in a matrix form. The total fuzzy TOPSIS process consists of the following steps: 56
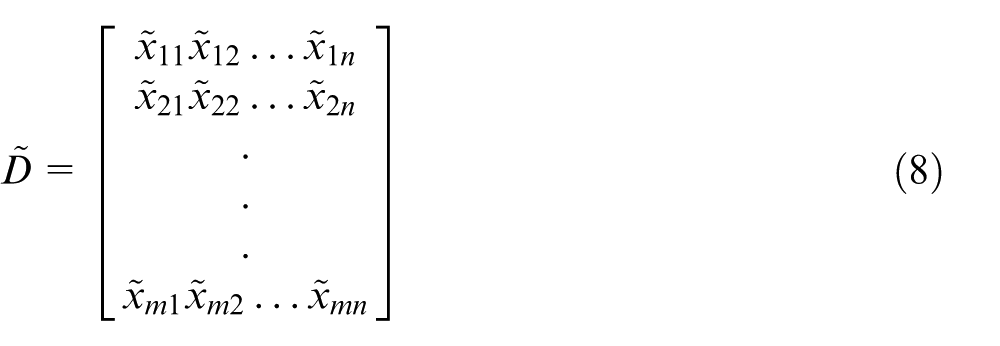
Step 1. Inputs are expressed in decision matrix as
Step 2. Calculation of the normalized fuzzy decision matrix
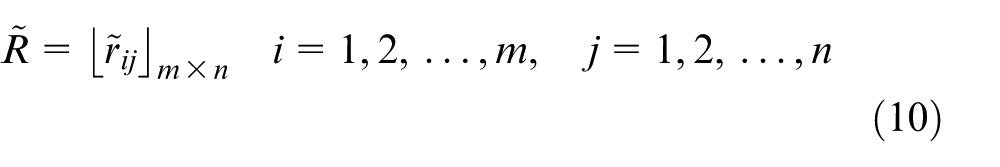
For the beneficial criteria, normalized value
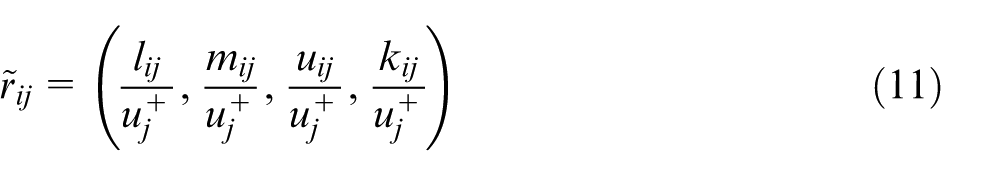
where
Correspondingly, normalized value
where
Step 3. Calculation of the weighted normalized fuzzy decision matrix is
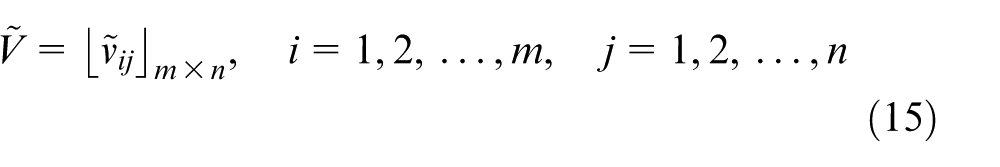
By considering the different weights of each criteria, the weighted normalized decision matrix is computed by doing multiplication of the importance weights of evaluation criteria and values in the normalized fuzzy decision matrix. The weighted normalized fuzzy value
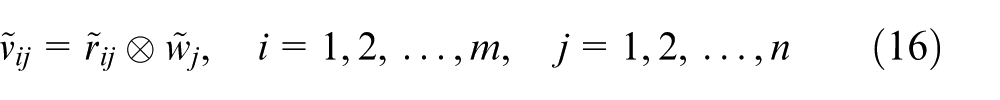
where
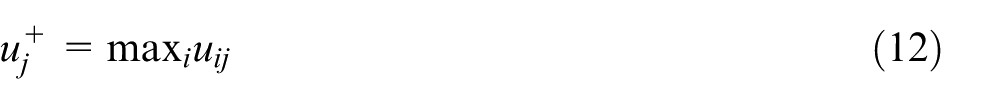
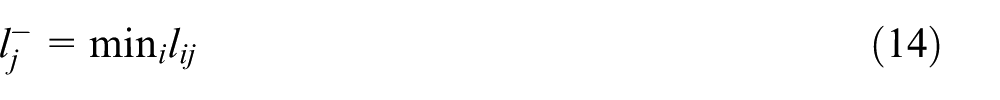
Step 4. Identification of the fuzzy positive ideal solution and the fuzzy negative ideal solution
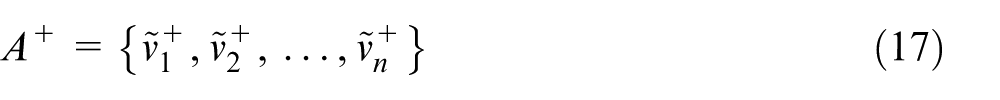
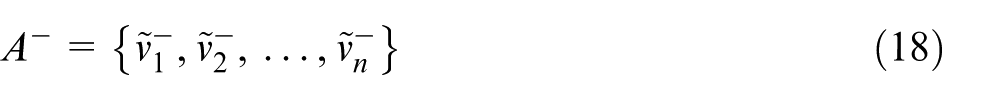
where
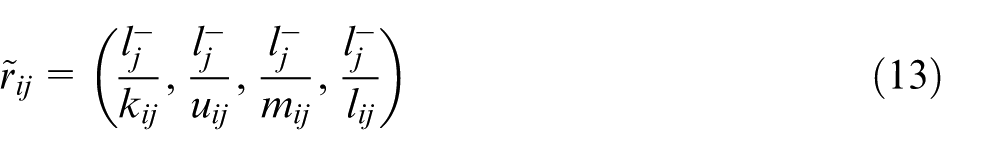
Step 5. Calculation of the distances of every alternative to the fuzzy positive ideal solution and fuzzy negative ideal solution using

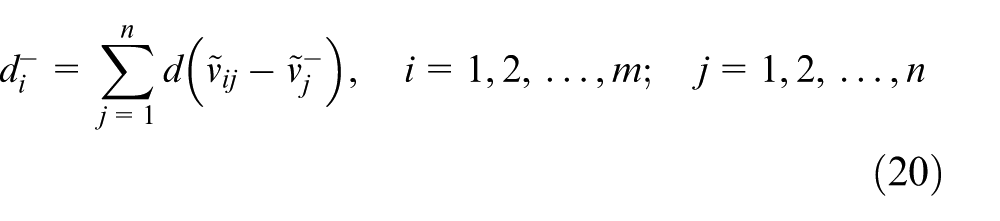
where
Step 6. Calculation of the relative closeness to the ideal solution. The relative closeness of the alternative Ai is calculated as
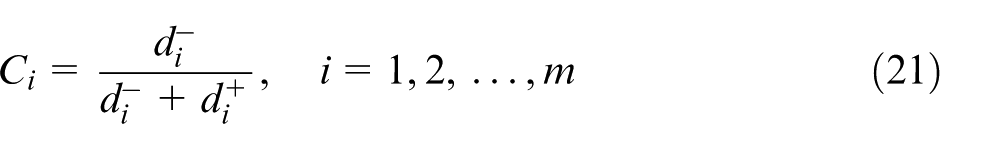
where
Step 7. Rank the preference order. Decide an alternative with maximum
Analysis and discussion
Calculating the GRCs
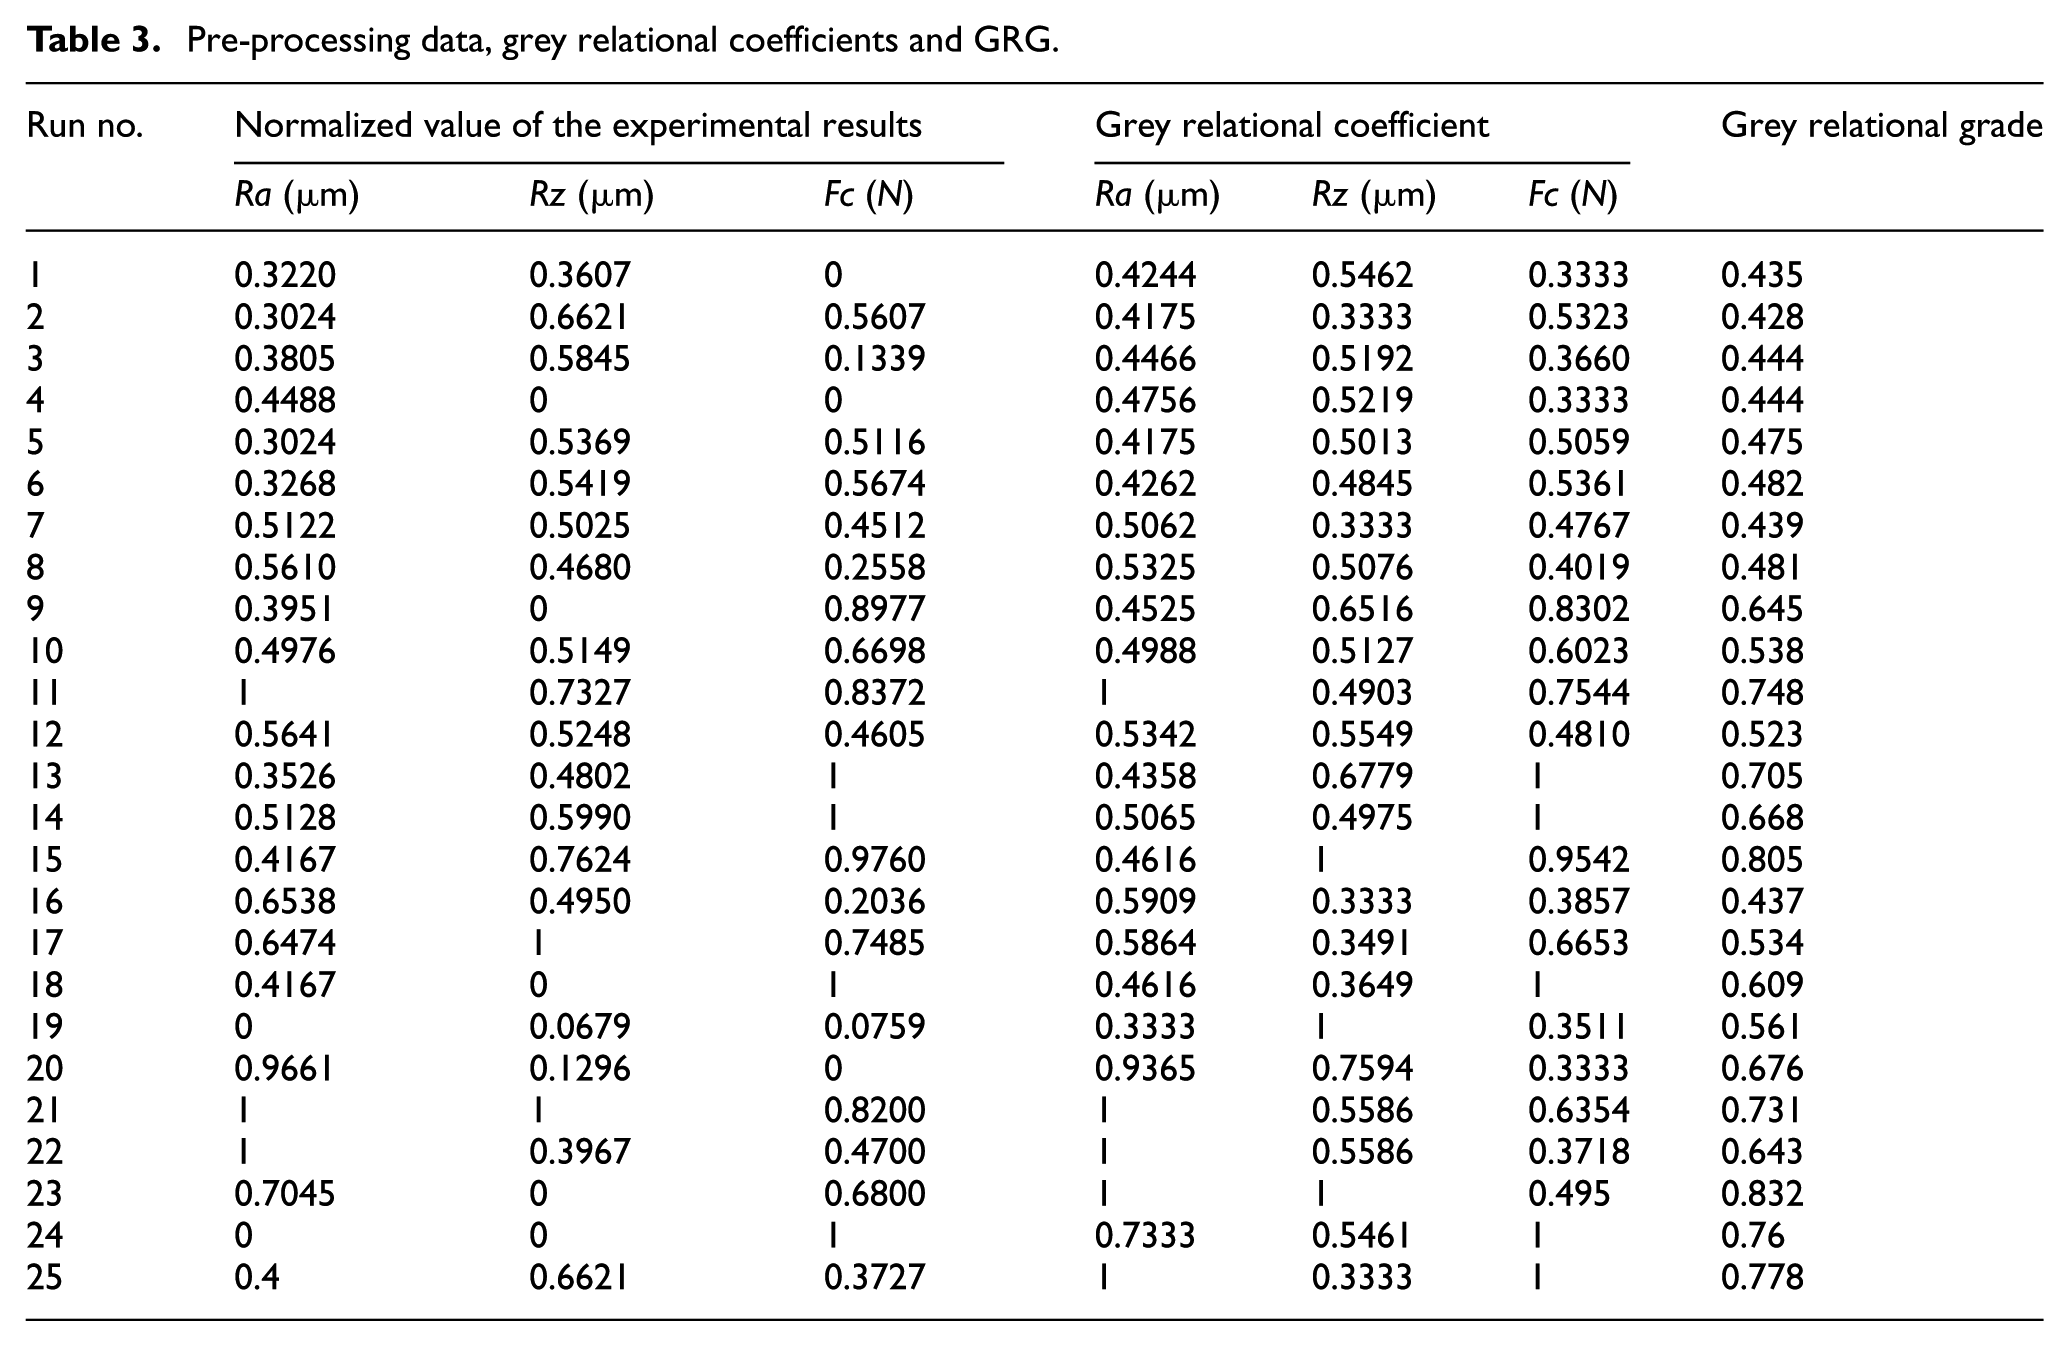
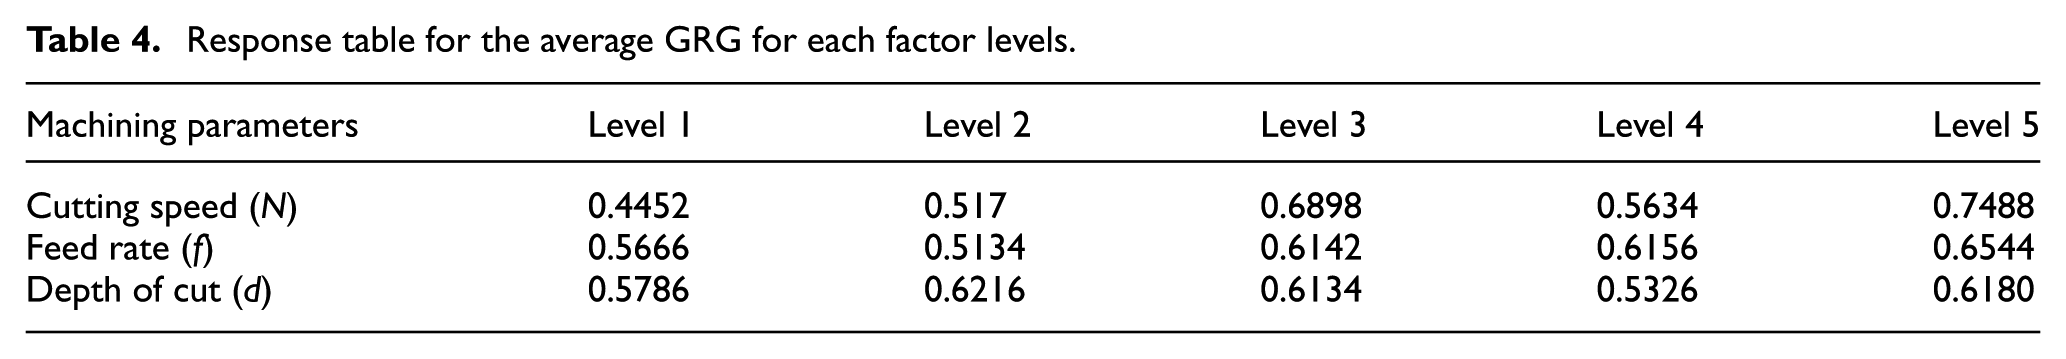
The experimental pre-processed data, GRCs and the overall GRG for every combination of parameters are given in Table 3. For all the response parameters, ‘lower-the-better’ criterion is chosen. The GRG, having the highest value, is always preferred. It is being found that experiment number 23 has the highest GRG of 0.832, as shown in Table 3 and Figure 4. Hence, the 23rd number of experiment gives the best multi-performance characteristics among the 25 experiments. In this article, the response table is used to calculate the average GRGs for every factor level, as illustrated in Table 4. The GRG represents the level of correlation between the reference and the comparability sequences; the larger GRG means the comparability sequence exhibits a stronger connection with the reference sequence. According to this study, one can select a combination of the levels that give the largest average response. In Table 4, the combination of cutting speed at level 5, feed rate at level 5 and depth of cut at level 2 shows the largest value of the GRG for the factors N, f and d, respectively. Hence, N5f5d2 with a cutting speed of 600 r/min, feed of 40 mm/min and depth of cut of 0.20 mm is the optimal parameter combination of the CNC milling operations. The effect on Ra, Rz and Fc factor levels is shown in Figure 5.
Pre-processing data, grey relational coefficients and GRG.
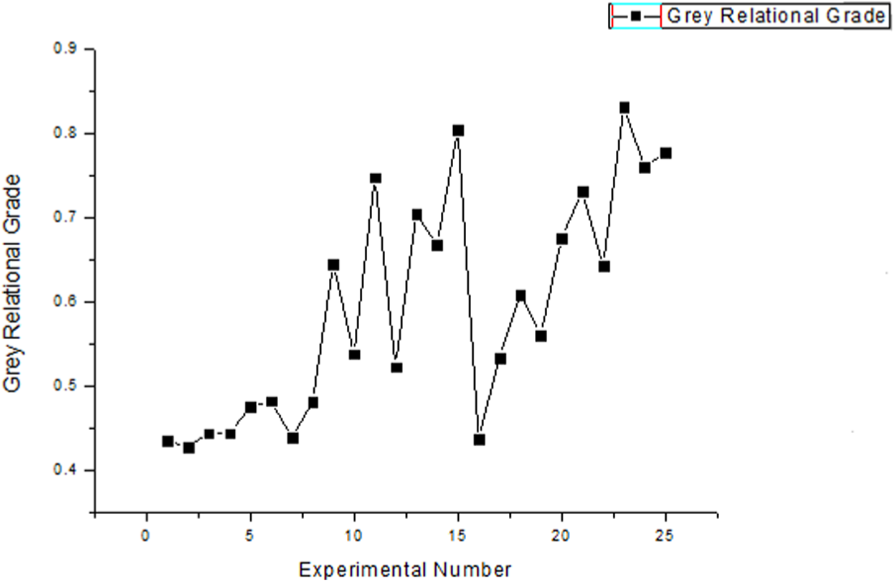
Grey relational grade versus experiment number.
Response table for the average GRG for each factor levels.
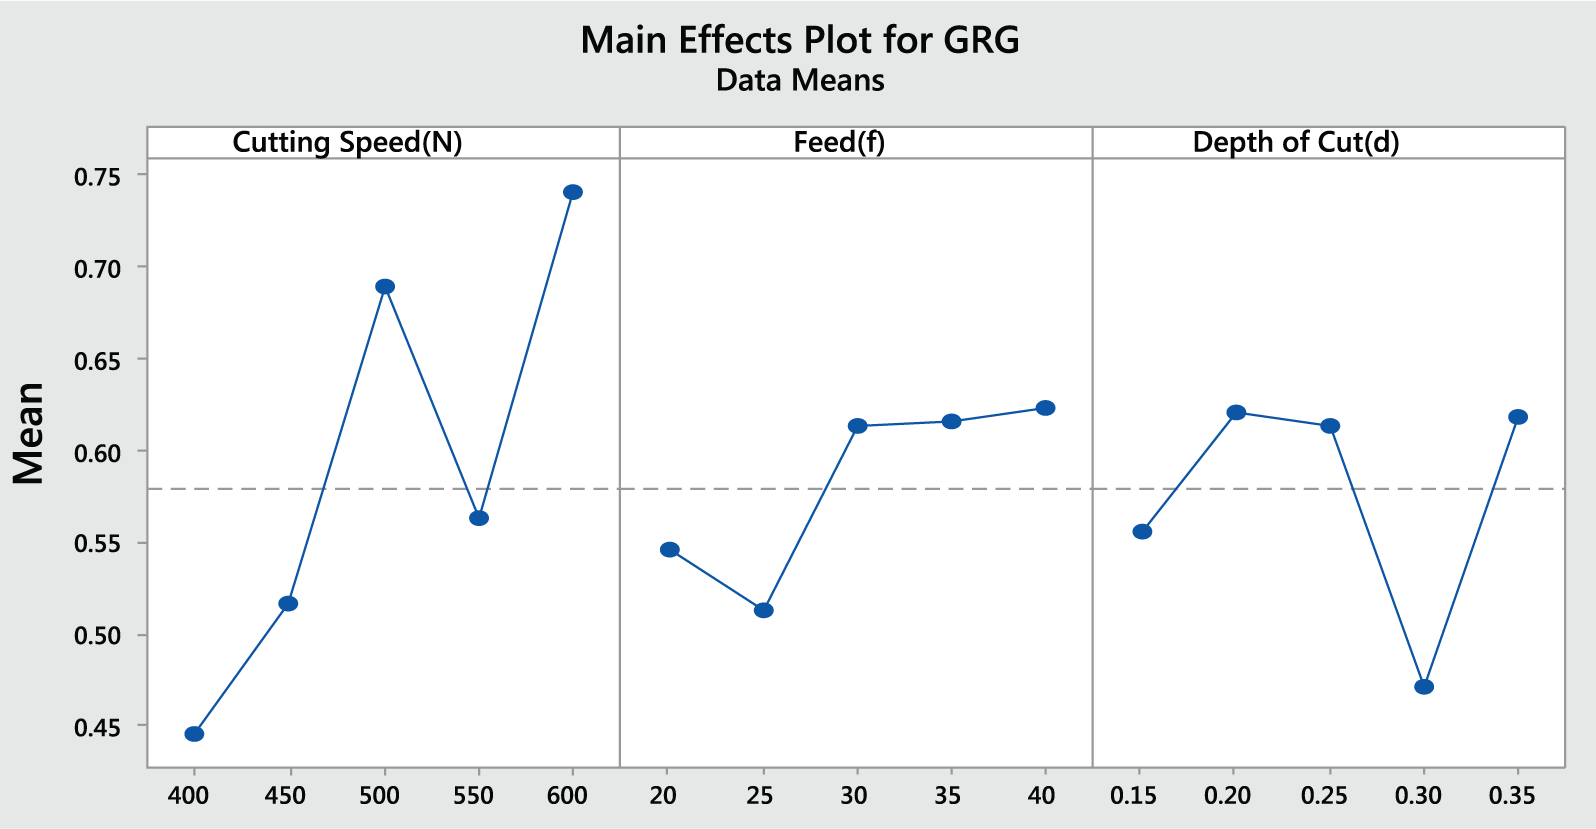
Effect on Ra, Rz and Fc factor levels according to the grey relational analysis.
The Fuzzy TOPSIS analysis
The best Ra, Rz and Fc values, depending on the optimum cutting parameters, are examined in this section using the Fuzzy TOPSIS technique. After the determination of the criteria and the hierarchy, an alternative experiment used the linguistic variables in Table 5 for determining significant weights of the supplier selection criteria (Table 6).
The linguistic variables for importance weight of every criteria.
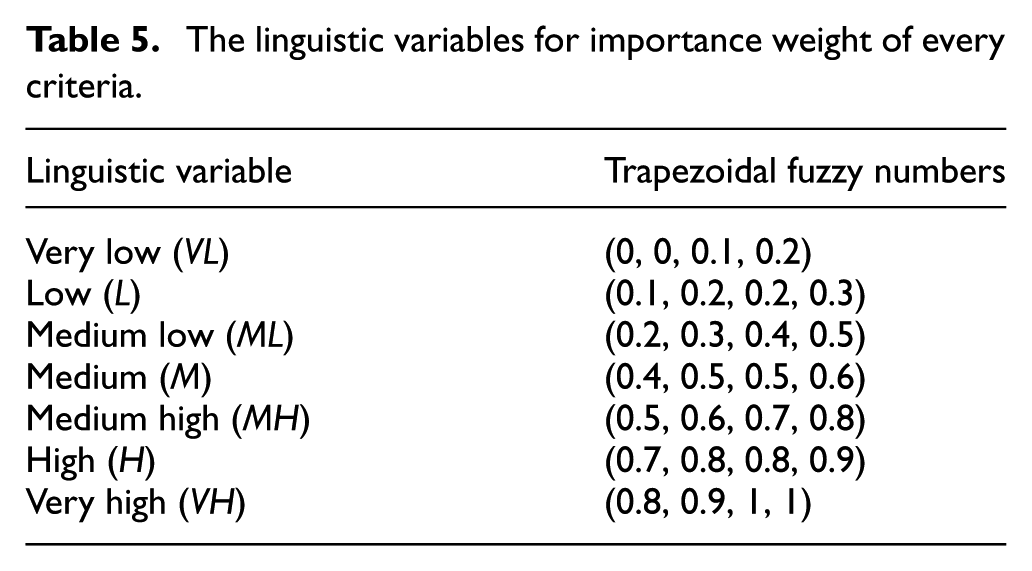
Importance weights of the criteria.
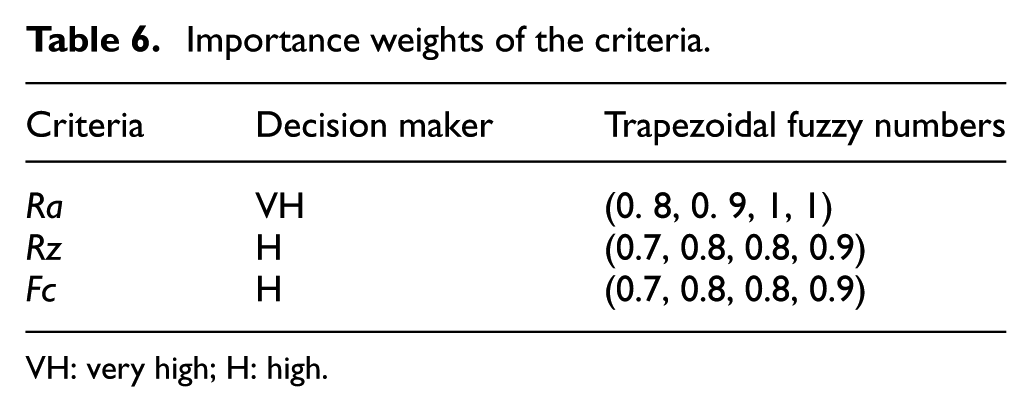
VH: very high; H: high.
After that, the decision makers performed a rating of the alternative experiment with the help of linguistic variables in Table 7 along with the experimental results.
Linguistic variables for the rating.
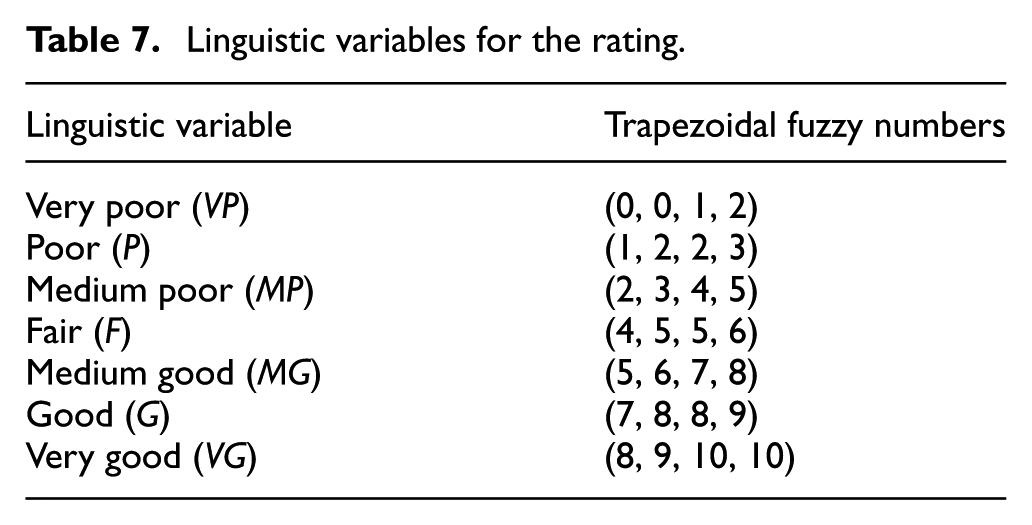
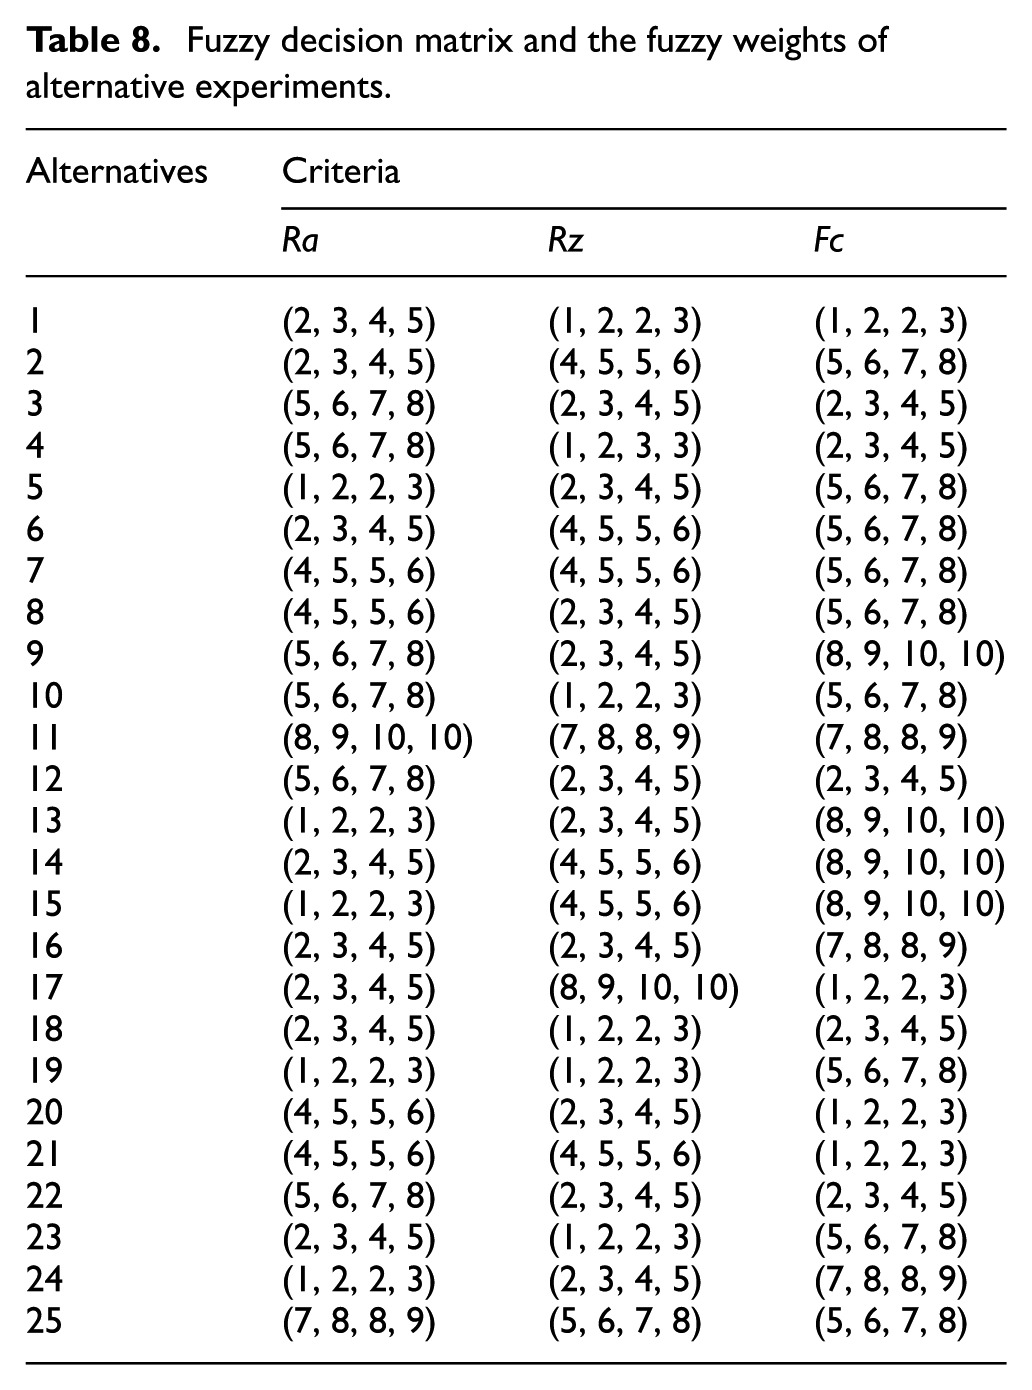
Table 8 (fuzzy decision matrix) is formed by the conversion of linguistic assessments, which belong to Table 7, into the trapezoidal fuzzy numbers. The fuzzy decision matrix, as shown in Table 8, was being normalized with the help of equation (11). Every values included in this matrix were multiplied with the relevant criterion weight.
Fuzzy decision matrix and the fuzzy weights of alternative experiments.
Distances from fuzzy positive ideal solution (
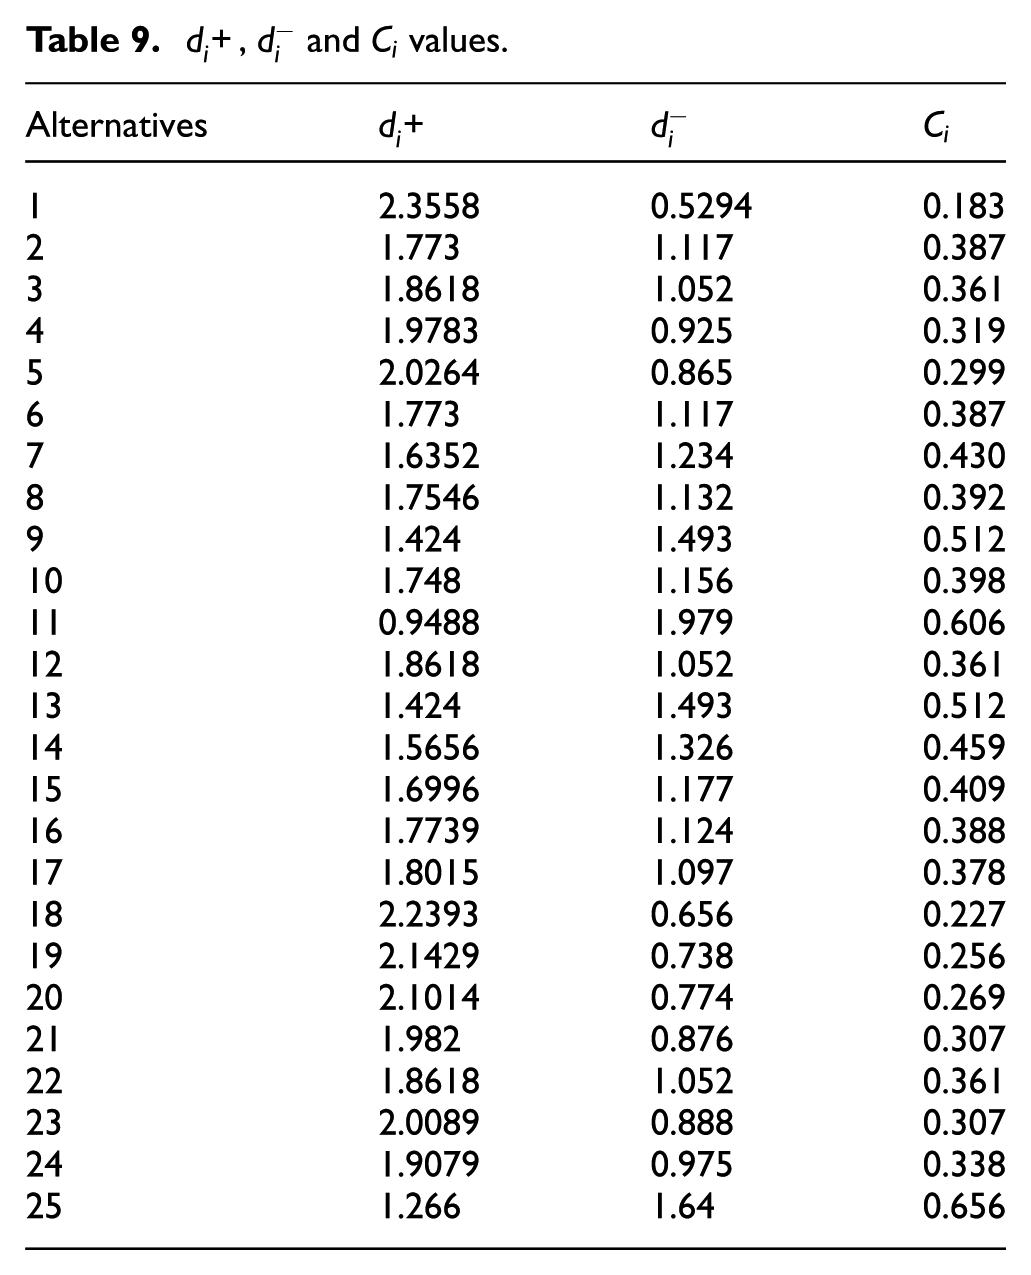
It is being understood that ‘25’ is the best experiment among the other experiment numbers and ‘1’ is the alternate that can be preferred last owing to proximity coefficients are: 25 > 11 > 25 > 9
ANOVA
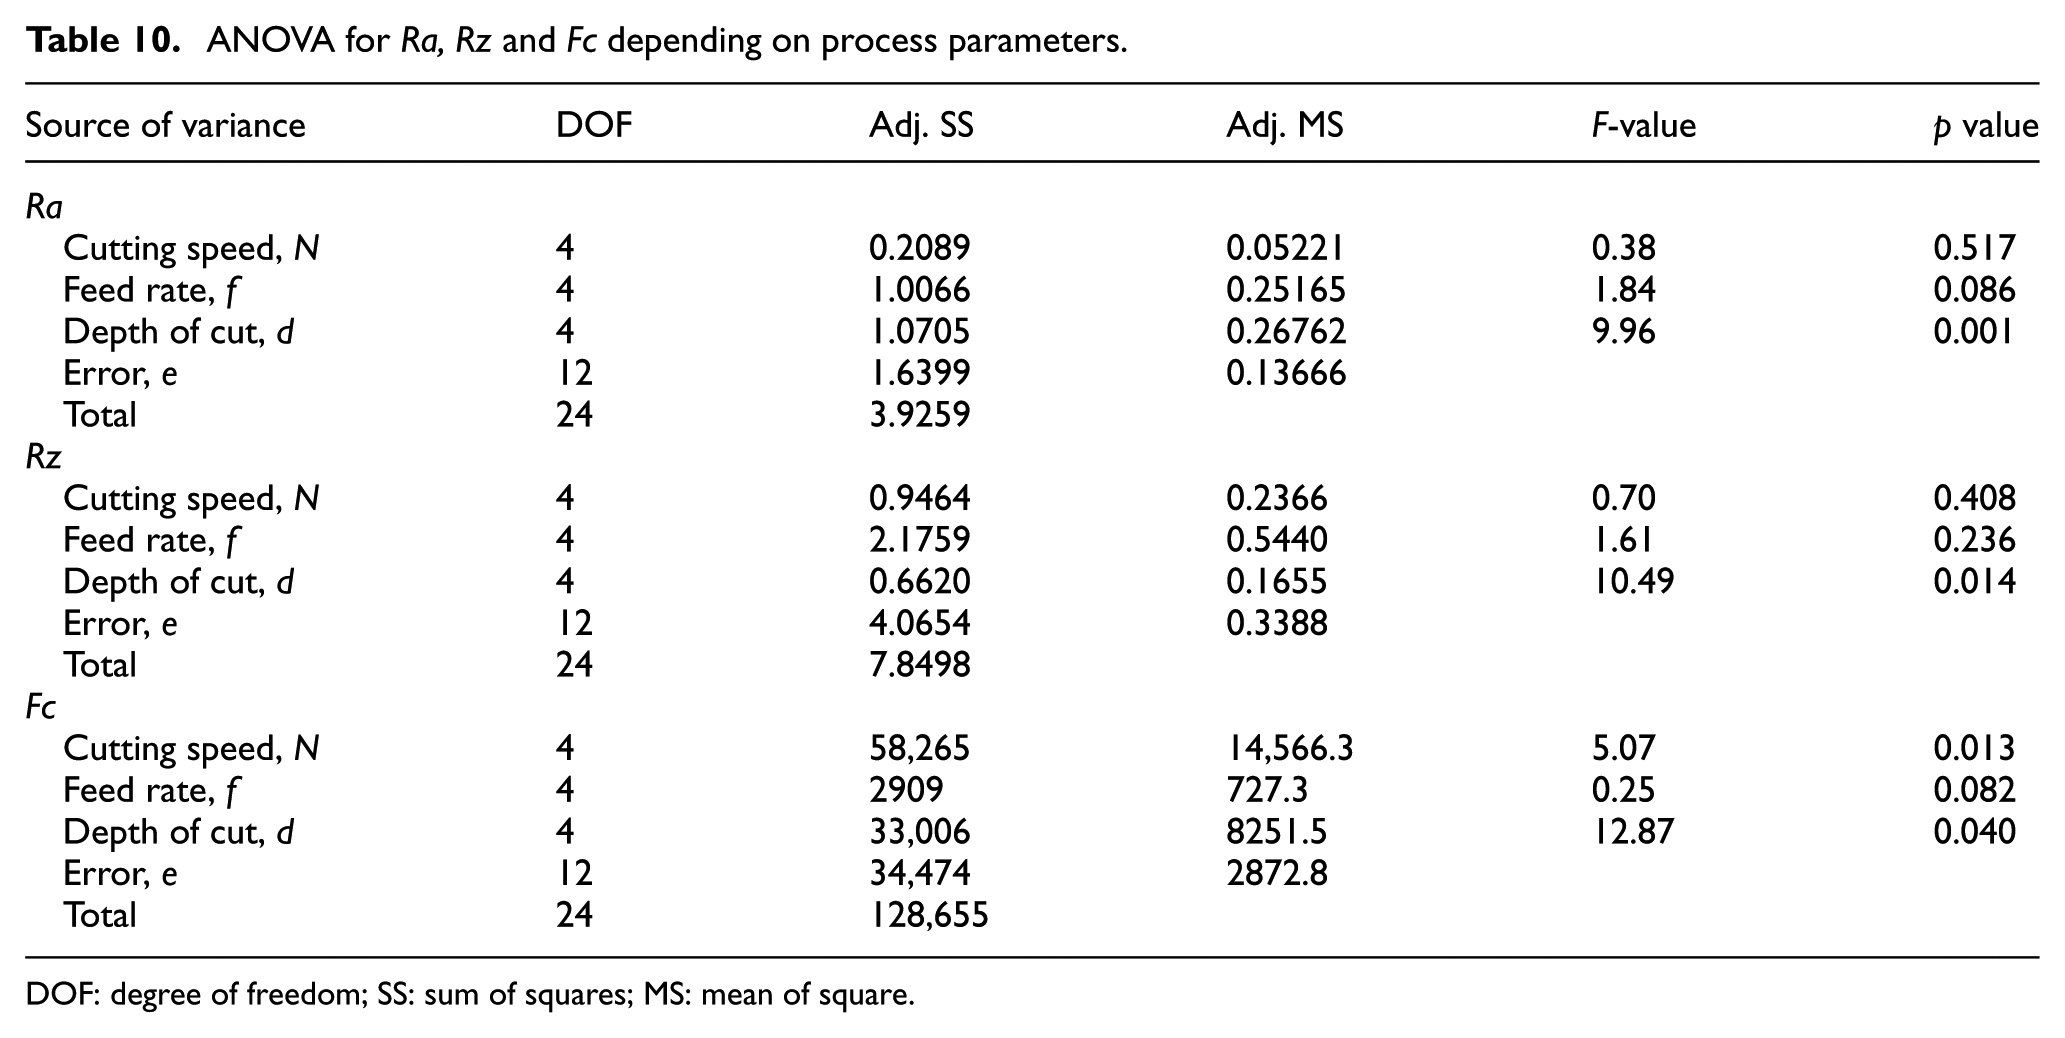
ANOVA is performed for finding out which machining parameters are statistically important at Ra, Rz and Fc. The ANOVA p values for all the machining parameters are shown at a significance confidence level of 95%. Fisher’s F-test is used to find the change in which machining parameter has an important effect on GRG. Larger the F-value is the change of process parameter having more strong influence on the performance characteristic. The ANOVA results are shown in Table 10. As it has been noted in the ANOVA table of GRG, the p value of the depth of cut for Ra, Rz and Fc and the cutting speed for Fc is less than 0.05. This indicates that the depth of cut has the most significant effect on Ra, Rz and Fc, and cutting speed has the most significant effect on Fc due to its highest contribution among the other process parameters.
ANOVA for Ra, Rz and Fc depending on process parameters.
DOF: degree of freedom; SS: sum of squares; MS: mean of square.
Response equation for the surface roughness and the cutting force
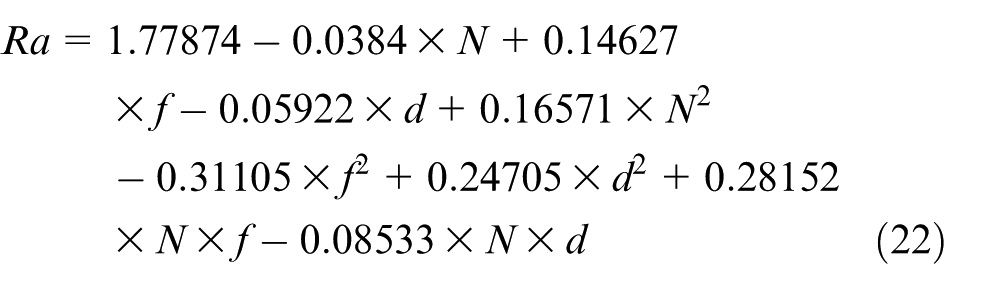
An average surface roughness prediction model according to the machining parameter values was being developed by the RSA. The RSA is a method that uses a combination of the statistical and the mathematical techniques for the development and the optimization of the process parameters. The RSA optimizes the maximums and minimums or makes nominal the response using polynomial model of first order or second order. A quadratic polynomial Ra, Rz and Fc model depending on the cutting speed (N), feed (f) and depth of cut (d) are obtained as shown below. Figure 6 shows the comparison of the measured and predicted surface roughness parameters Ra, Rz and cutting force Fc values
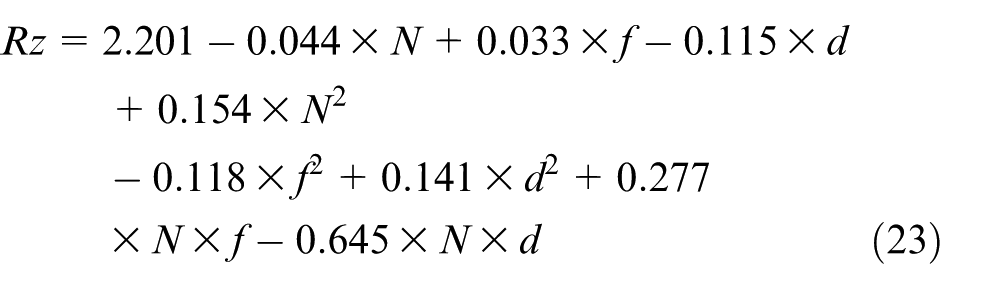
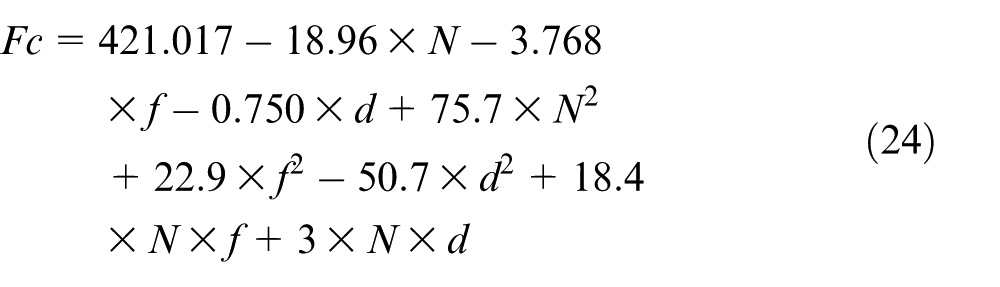
Comparison of measured and predicted (a) Ra, (b) Rz and (c) Fc (c) values.
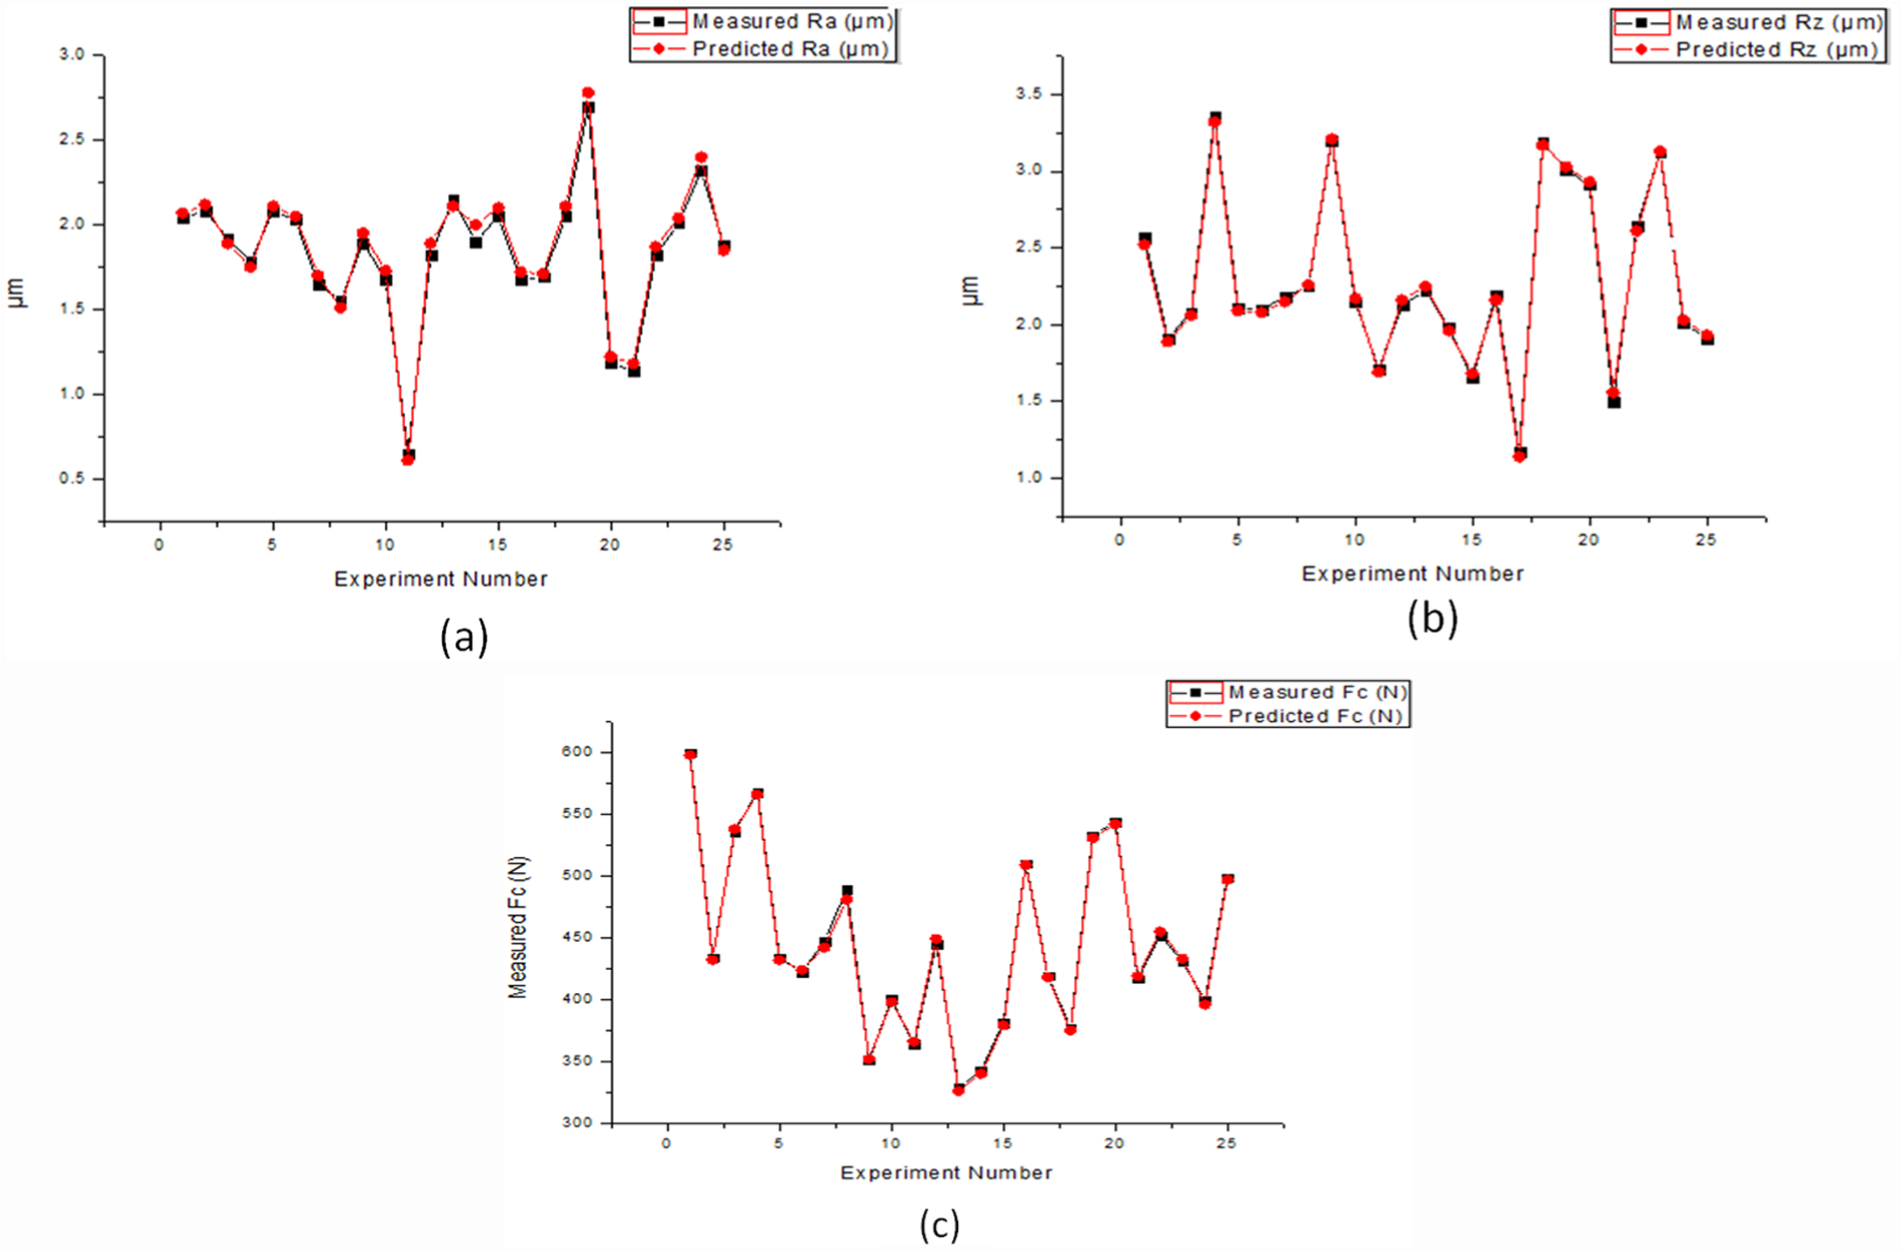
The purpose of RSM is not only to explore the response over the entire parameter space but also to establish the region where the response reaches the optimum or near optimal value. Through studying the response surface model, the combination of factors, which gives the best response, can then be established. The contour analysis is done for confirmation purpose, using the Minitab 17 software.
The analysis is done by considering two input process parameters with the GRG value and by keeping an average value of other two parameters as shown in Figure 7(a)–(c). Figure 7(a) shows that better GRG can be obtained at feed 30 mm/min and at cutting speed of 600 r/min. Figure 7(b) shows that better GRG can be obtained at depth of cut of 0.18–0.23 mm and at cutting speed of 600 r/min. When considering depth of cut and feed (Figure 7(c)), it is found that highest value GRG (i.e. >0.80) can be obtained at a depth of cut of 0.17–0.22 mm and at feed of 30 mm/min.
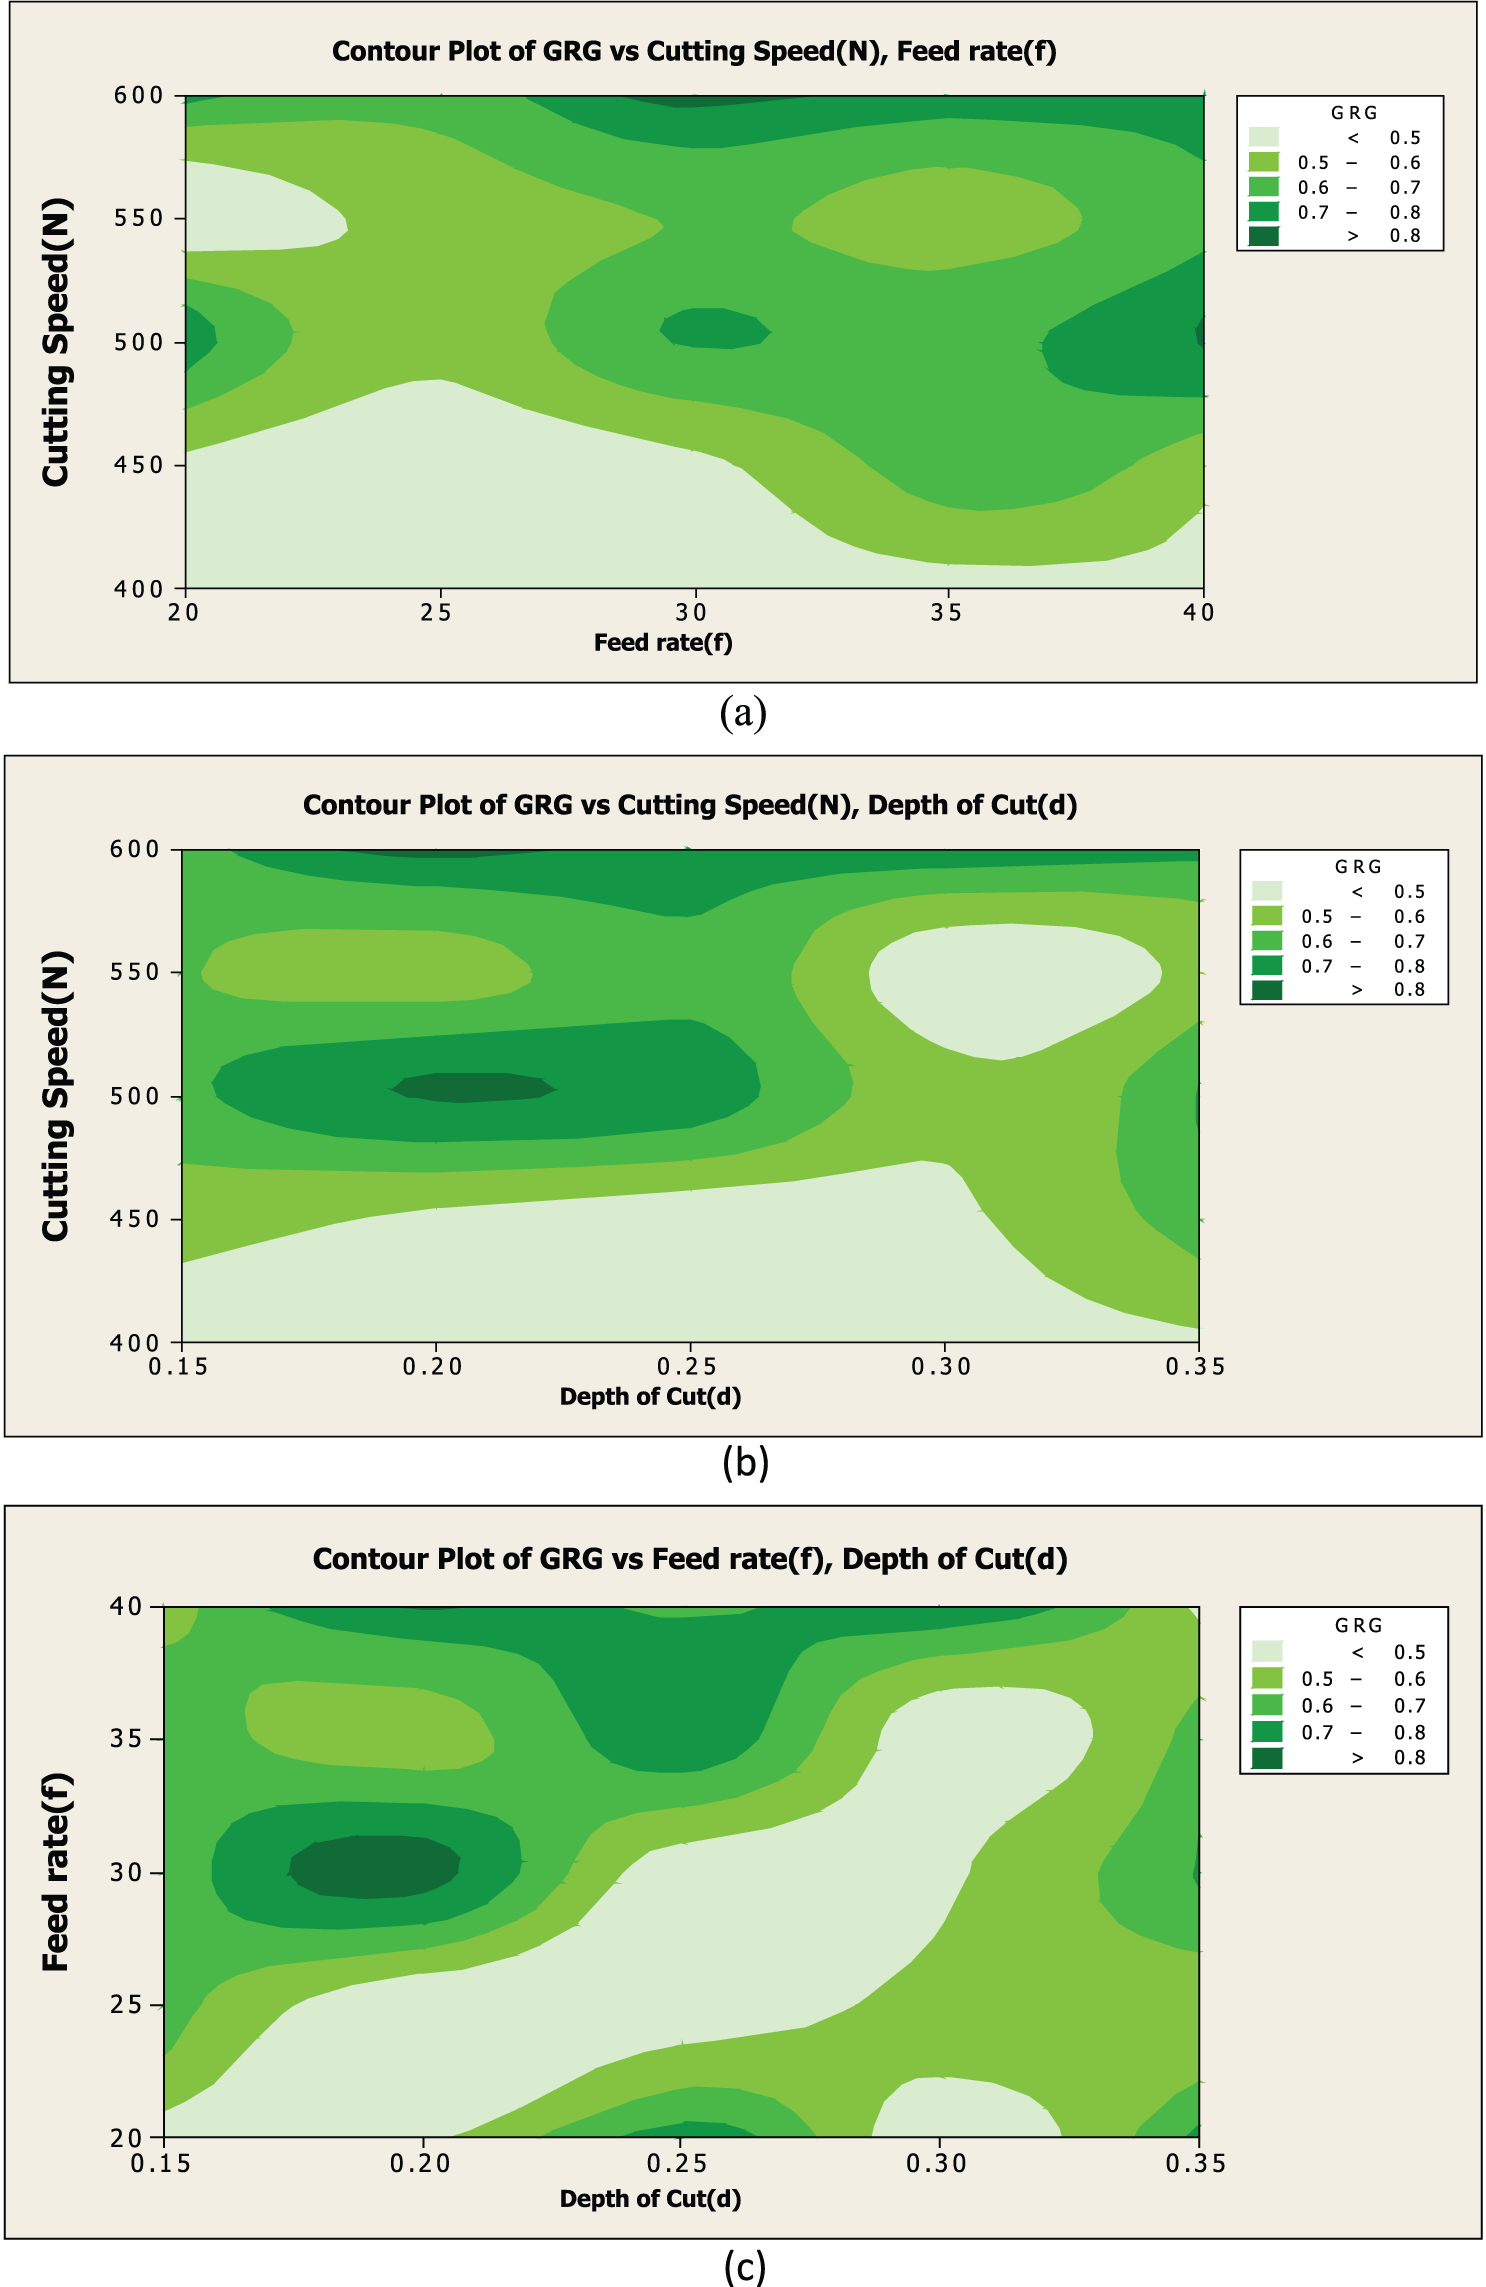
Contour plots of GRG versus each parameter. (a) shows that better GRG can be obtained at feed 30 mm/min and at cutting speed of 600 rpm/min (b) shows that better GRG can be obtained at depth of cut of 0.18—0.23 mm and at cutting speed of 600 rpm/min. When considering depth of cut and feed (c) it is found that highest value GRG (i.e. .0.80) can be obtained at a depth of cut of 0.17—0.22 mm and at feed of 30 mm/min.
Conclusion
The surface roughness parameters Ra, Rz and cutting force Fc in the CNC end milling process with machining parameters were measured in the experiments. From the results obtained, the following conclusions can be drawn:
The RSA technique was found to be efficient for identification and development of important relationships between machining parameters.
The numbers of experiments in CNC end milling operations were reduced with the GRGs for determining optimum cutting conditions. Satisfied results were obtained so that they can be used in different future studies.
ANOVA indicates that the depth of cut has the most significant effect on Ra, Rz and Fc, and cutting speed has the most significant effect on Fc due to its highest contribution among the other process parameters. The optimal machining combinations are found as N5f5d2, that is, with a cutting speed of 600 r/min, a feed of 40 mm/min and a depth of cut of 0.20 mm. According to fuzzy TOPSIS technique, the optimal combination of machining parameters is at cutting speed 600 r/min, feed 40 mm/min and depth of cut 0.30 mm, which is quite similar to the optimal values calculated by the GRA. Confirmation experiments were carried out for finding the adequacy of the method, and it was found satisfactory.
Contour analysis is done by considering two input process parameters with the GRG value and by keeping an average value of other two parameters as shown in Figure 7(a)–(c). Figure 7(a) shows that better GRG can be obtained at feed 30 mm/min and at cutting speed of 600 r/min. Figure 7(b) shows that better GRG can be obtained at depth of cut of 0.18–0.23 mm and at cutting speed of 600 r/min. When considering depth of cut and feed (Figure 7(c)), it is found that highest value GRG (i.e. >0.80) can be obtained at a depth of cut of 0.17–0.22 mm and at feed of 30 mm/min.
The approach presented experimentally and statistically in this study can be regarded as a proper method for the optimization of the CNC end milling process.
Footnotes
Declaration of conflicting interests
The author(s) declared no potential conflicts of interest with respect to the research, authorship, and/or publication of this article.
Funding
The author(s) received no financial support for the research, authorship, and/or publication of this article.