
Abstract
Nickel-based alloys are finding a wide range of applications due to their superior properties of maintaining hardness at elevated temperatures, low thermal conductivity and resistance to corrosion. These materials are used in aircraft, power-generation turbines, rocket engines, automobiles, nuclear power and chemical processing plants. Machining of such alloys is difficult using conventional processes. Wire-cut electrical discharge machining is one of the advanced machining processes, which can cut any electrically conductive material irrespective of its hardness. One of the major disadvantages of this process is formation of recast layer as it affects the properties of the machined surfaces. In this study, experimental investigation has been carried out to study the effect of wire-cut electrical discharge machining process parameters on micro-hardness, surface roughness and recast layer while machining Inconel-690 material. Interestingly, hardness of the machined surface was found to be lower than that of the bulk material. The micro-hardness and recast layer thickness are inversely related to the variation of process parameters. Recast layer thickness, surface roughness and hardness of the wire-cut electrical discharge machined surfaces of Inconel-690 are found to be in the range of 10–50 µm, 0.276–3.253 µm and 122–171 HV, respectively, for different conditions. The research findings and the data generated for the first time on hardness and recast layer thickness for Inconel-690 will be useful to the industry.
Keywords
Introduction
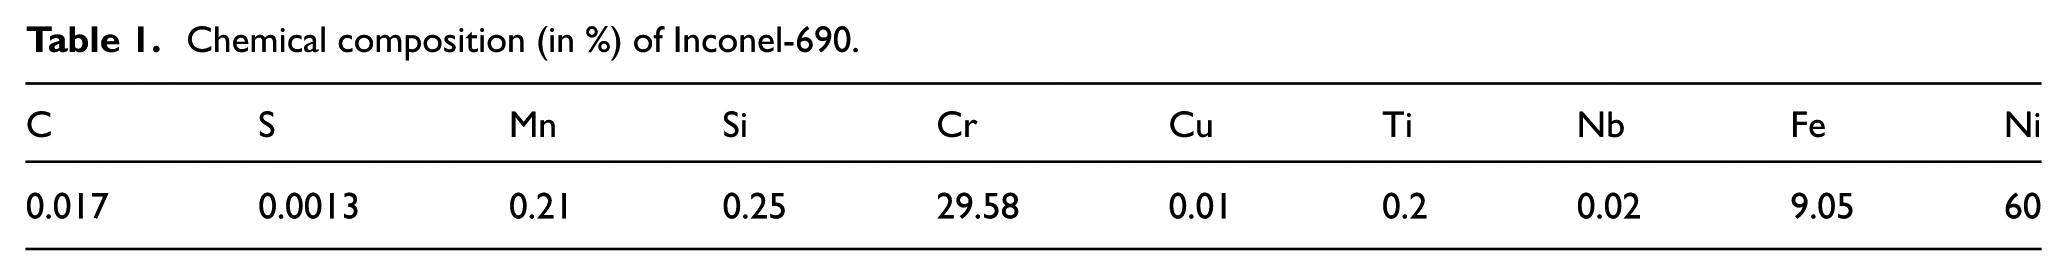
Owing to increased usage of nickel-based alloys in various fields such as aerospace, nuclear and automobiles, 1 it is very much necessary to process them so that the parts produced can satisfy the functional requirements. Among nickel-based alloys, Inconel-690 (Table 1), a high chromium nickel-based super alloy, exhibits high hardness at elevated temperature, low thermal conductivity and corrosive resistance. Due to these properties, it is difficult to machine such materials using conventional machining processes. The wire-cut electrical discharge machining (WEDM) process can machine any electrically conductive material irrespective of its hardness 2 and has the ability to produce accurate, precise, complex and any intricate surfaces.3,4 In WEDM, there is no direct contact between tool and workpiece and the material is eroded due to thermo electrical principle. When the workpiece approaches the electrode, the gap between workpiece and wire reaches a threshold and a plasma channel is formed thereby generating the sparks. A huge amount of heat is generated due to these sparks and this heat melts and evaporates the workpiece material.
Chemical composition (in %) of Inconel-690.
A portion of the melted workpiece material is removed by a dielectric circulation system. The remaining molten material will rapidly re-solidify to form a layer known as the recast layer.5,6 This recast layer affects the mechanical properties like hardness of the material. The hardness of the WEDMed surfaces will depend on the recast layer thickness (RLT). Recast layer and heat affected zones of electrical discharge machined surfaces were studied by Rajurkar and Pandit 7 and also developed thermal models to predict the damage layer thickness. Hascalyk and Çaydaş 8 carried out experimental investigations on the influence of WEDM process parameters on surface integrity of AISI D5 tool steel. They found that the machine surface hardness is harder than the bulk material hardness. Gostimirovic et al. 9 also found that, compared to bulk material, the machined surface hardness is higher in machining manganese–vanadium tool steel (ASTM A681) with WEDM. Hascalik and Çaydaş 10 performed experiments on titanium alloy with different electrode materials in electrical discharge machining (EDM) and explored the influence of parameters on white layer thickness, roughness and hardness. They found that hardness of machined surfaces is increased due to Ti24C15 carbides formation during machining. Soni and Chakraverti 11 investigated experimentally the change in re-solidified layers and micro-hardness (MH) of EDMed surfaces of Die steel. Studies were carried out by Cusanelli et al. 12 on the formation of white layer and hardness of EDMed surfaces of steel. They also studied the white layer in submicron scale for phases present in white layer, micro-cracks, carbon content in the white layer and nano-hardness of the white layer. They found that the hardness of the white layer is more than that of the base material. Iqbal and Khan 13 carried out experimental investigation on the influence of EDM process parameters on the RLT, micro-cracks and material migration in machining of stainless steel. Along with material removal rate (MRR) and tool wear rate (TWR), recast layer and MH are also studied by Jabbaripour et al. 14 for titanium alloy in EDM process. Experimental investigations on the effect of WEDM parameters on the surface roughness (SR) and MH of high-strength low-alloy steel (HSLA) material were carried out by Khan et al. 15 They also used gray relational analysis to optimize SR and MH simultaneously.
Researchers in the recent past used Taguchi orthogonal experimental design to study the effect of various WEDM process parameters on the responses such as MRR and SR. Regression method16,17 and neural networks (NN) approach18–20 were used to develop mathematical models to predict the responses with respect to process parameters and also for further optimization. Some researchers used response surface methodology (RSM) for experimental plans to study the influence of various WEDM process parameters on performance measures such as MRR, SR and Kerf. In studies, most of them used RSM itself to model the responses21–23 and others used techniques such as back-propagation neural network (BPNN)24,25 to model the process for comparison purpose.
Majority of the works focussed on modelling and optimization of responses such as MRR, SR and wire wear rate (WWR). Majority of investigations are reported on RLT and MH of machined surfaces of different steels and titanium alloys. Also, most of these works are carried out on die sinking EDM. Furthermore, general observation is that hardness of the machined surfaces is significantly higher than that of the bulk material. Although nickel-based super alloys are increasingly becoming popular in various industrial sectors, comprehensive WEDM studies are not reported on these alloys. This work focuses on the study of RLT and the hardness of the machined surfaces while machining Inconel-690 material. Modelling and prediction of RLT, SR and hardness of WEDMed surfaces are also attempted. The process physics involved in the influence of process parameters on these responses has been thoroughly explained. RSM was used to generate mathematical models for RLT, SR and MH for the first time for Inconel-690 material.
Experimental setup and procedure
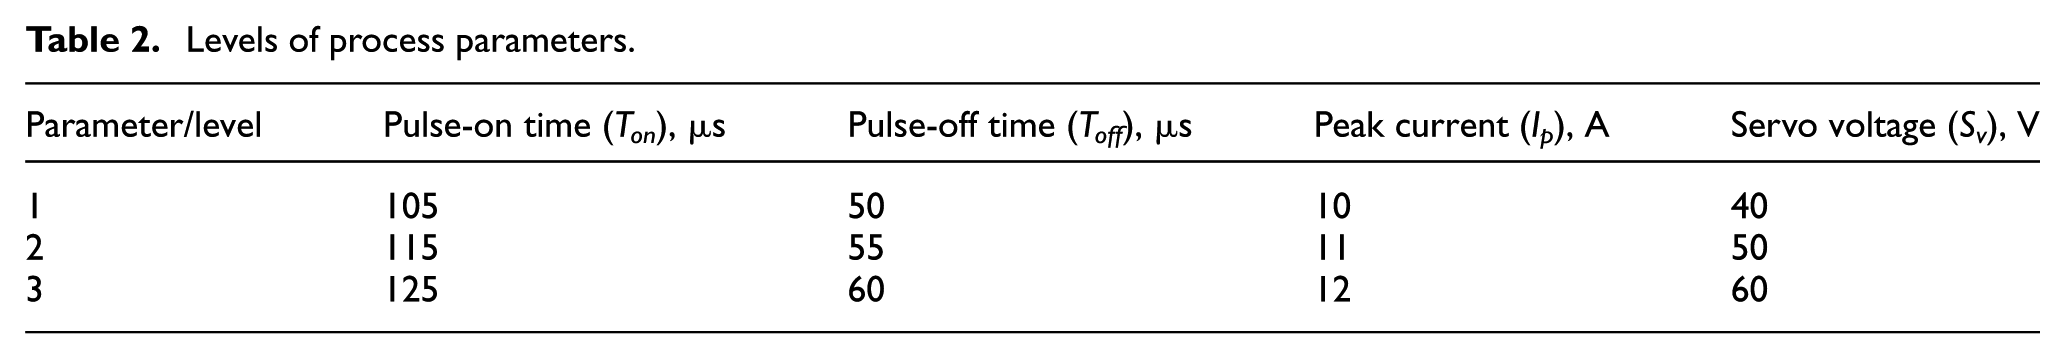
Experimental plan is designed using a face cantered central composite design with six centre points of RSM. Design Expert 9.0 software is used for this RSM analysis. A WEDM of Electronica, India, make has been selected as a machine tool. Inconel-690, workpiece material of size 100 mm × 50 mm × 6 mm, is used. Holes of 10 mm size are produced as shown in Figure 1, with zinc-coated brass wire as electrode and deionized water as dielectric fluid. The objective of this work is to study the effect of various process parameters of WEDM such as pulse-on time, pulse-off time, peak current and servo voltage on recast layer, SR and MH of machined surfaces. Trial experiments were conducted to fix the ranges for process parameters as presented in Table 2. MH of the machined surfaces is measured using Economet VH 1 MD, Chennai Metco, India, and the recast layer has been observed using Scanning Electron Microscope of Tescan make VEGA 3 LMU model. A load of 500 g was applied for a dwell time of 10 min to measure the MH. A German make Marsurf M-400 has been used to measure the SR of the machined components.
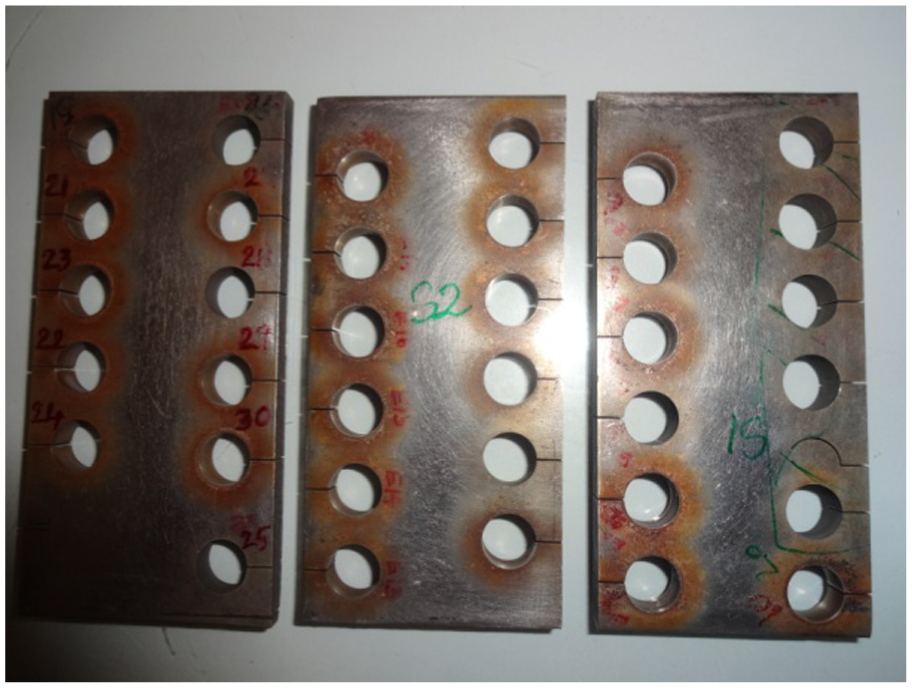
Machined circular holes on Inconel-690 workpiece.
Levels of process parameters.
Results and analysis
Experiments are conducted as per the RSM plan as presented in Table 3 in the coded form along with the measured responses. Analysis of variance (ANOVA) has been conducted for RLT, SR and MH to study the significance of parameters and their interaction effects on the responses. Prediction models are generated using RSM and the adequacies of these models are expressed in terms of R2 values. Energy-dispersive X-ray spectroscopy (EDS) analysis is also carried out to know the composition of the machined surfaces.
Experimental plan and results.
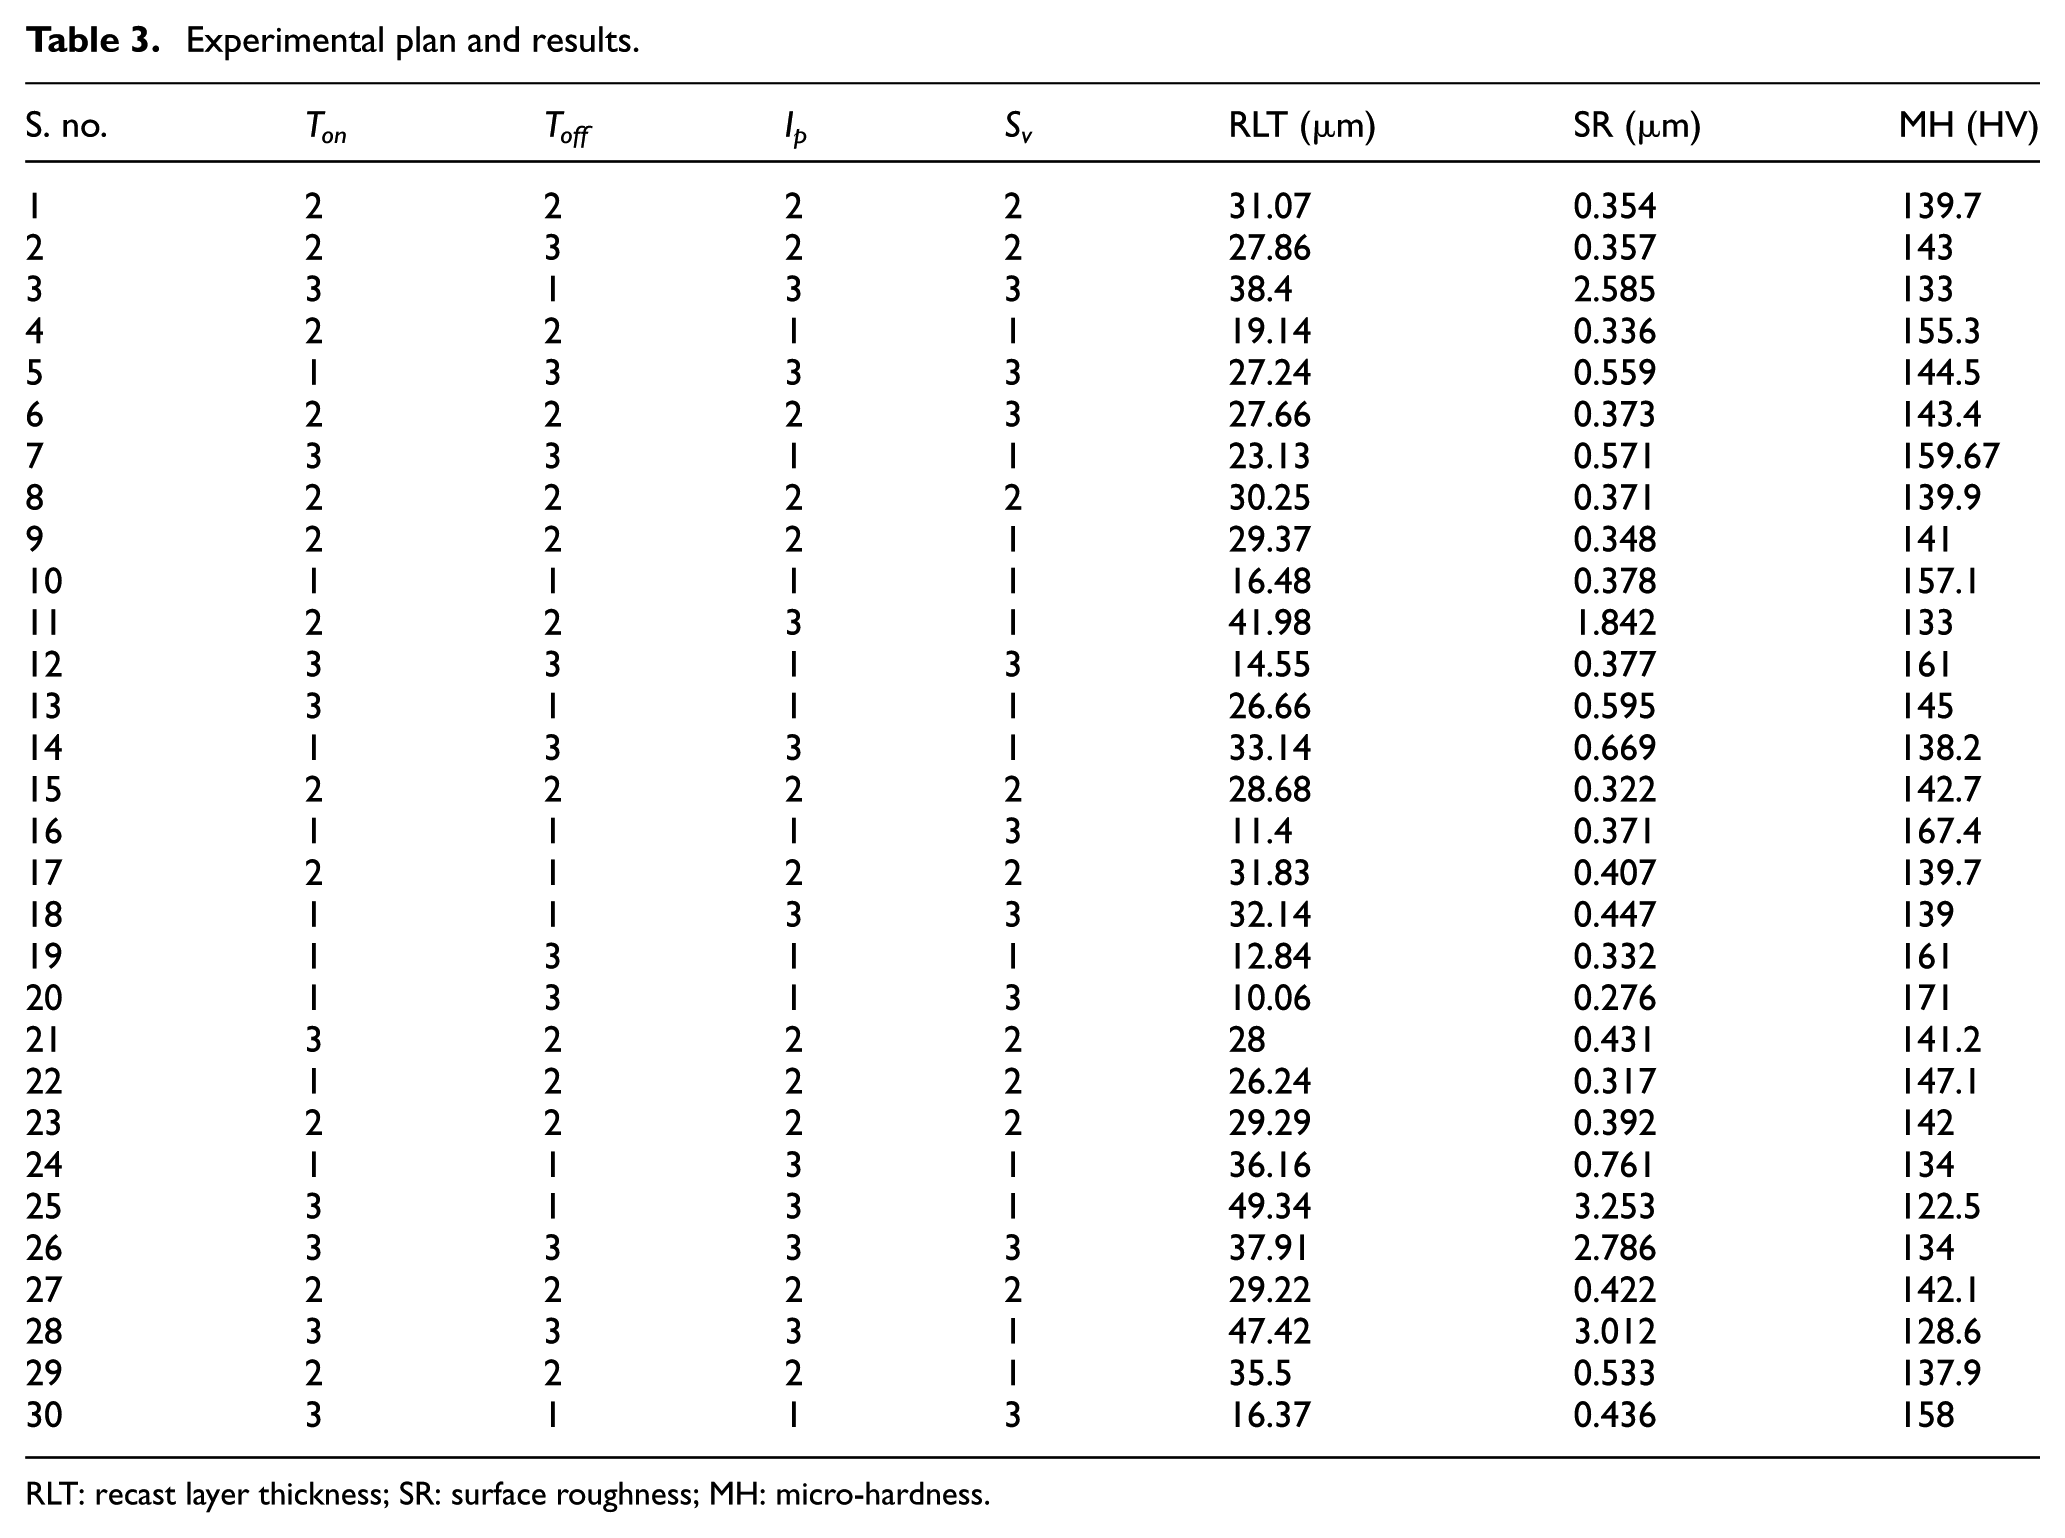
RLT: recast layer thickness; SR: surface roughness; MH: micro-hardness.
RLT
When the work material is subjected to very high temperatures in EDM, some portion of the material is evaporated and some amount will be flushed away by the dielectric fluid. However, remaining eroded material will rapidly re-solidify to form a layer known as the recast layer. This RLT affects the mechanical properties like hardness of the material. The recast layers of the machined samples were measured using the inbuilt measuring software of scanning electron microscope (SEM). The RLT is not uniform throughout the periphery of the machined surface. Hence, RLT values at different locations on the periphery of the machined surface are measured and average value has been considered. However, in order to indicate the measurements of RLT, two specimens are chosen, one at lowest RLT corresponding to experiment number 20 (Ton = 105 µs, Toff = 60 µs, Ip = 10 A, Sv = 60 V) and another at highest RLT corresponding to experiment number 25 (Ton = 125 µs, Toff = 50 µs, Ip = 12 A, Sv = 40 V) as shown in Figure 2. The same samples are considered for EDS analysis. A pool of molten metal in the form of debris, which is not flushed away by dielectric fluid, deposits on the machined surface as shown in Figure 3. Micro-cracks and voids can also be observed on the WEDMed surfaces. Figure 3(a) and (c) corresponds to experiment number 25 (Ton = 125 µs, Toff = 50 µs, Ip = 12 A, Sv = 40 V) and Figure 3(b) and (d) corresponds to experiment number 20 (Ton = 105 µs, Toff = 60 µs, Ip = 10 A, Sv = 60 V). A pool of molten metal increases RLT and it cannot be completely eliminated during WEDM process. RLT can be minimized up to certain level by choosing the optimal machining conditions. Also, circulation of dielectric fluid with sufficient pressure will flush most of the molten metal and debris, thereby reducing the RLT. The RLT was observed in the range of 10–50 µm.
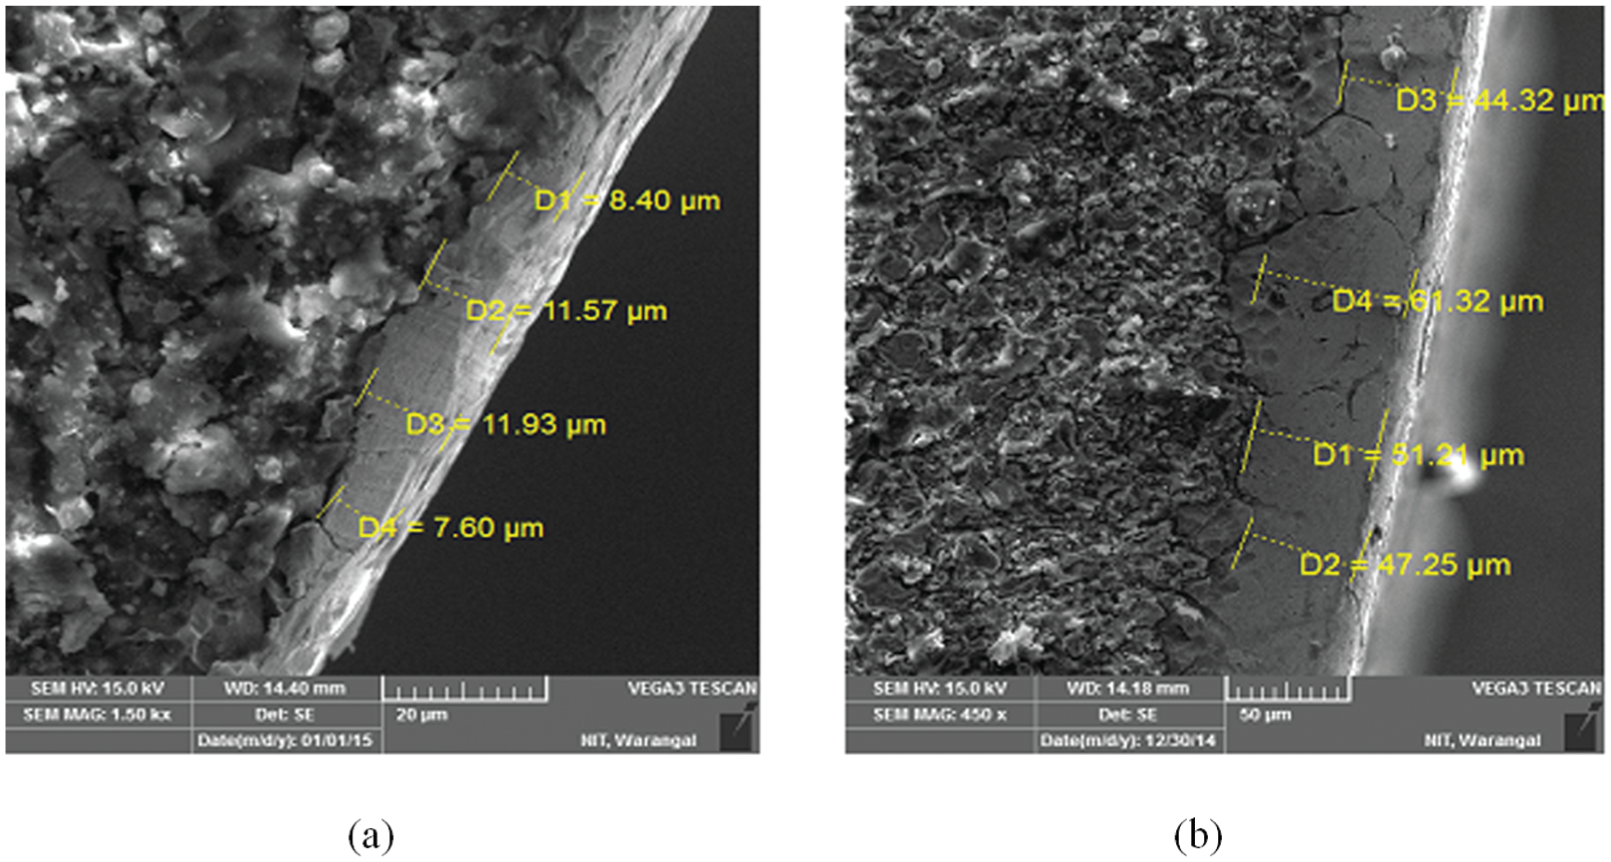
Scanning electron microscope images for RLT at different conditions: (a) Ton = 105 µs, Toff = 60 µs, Ip = 10 A, Sv = 60 V and (b) Ton = 125 µs, Toff = 50 µs, Ip = 12 A, Sv = 40 V.
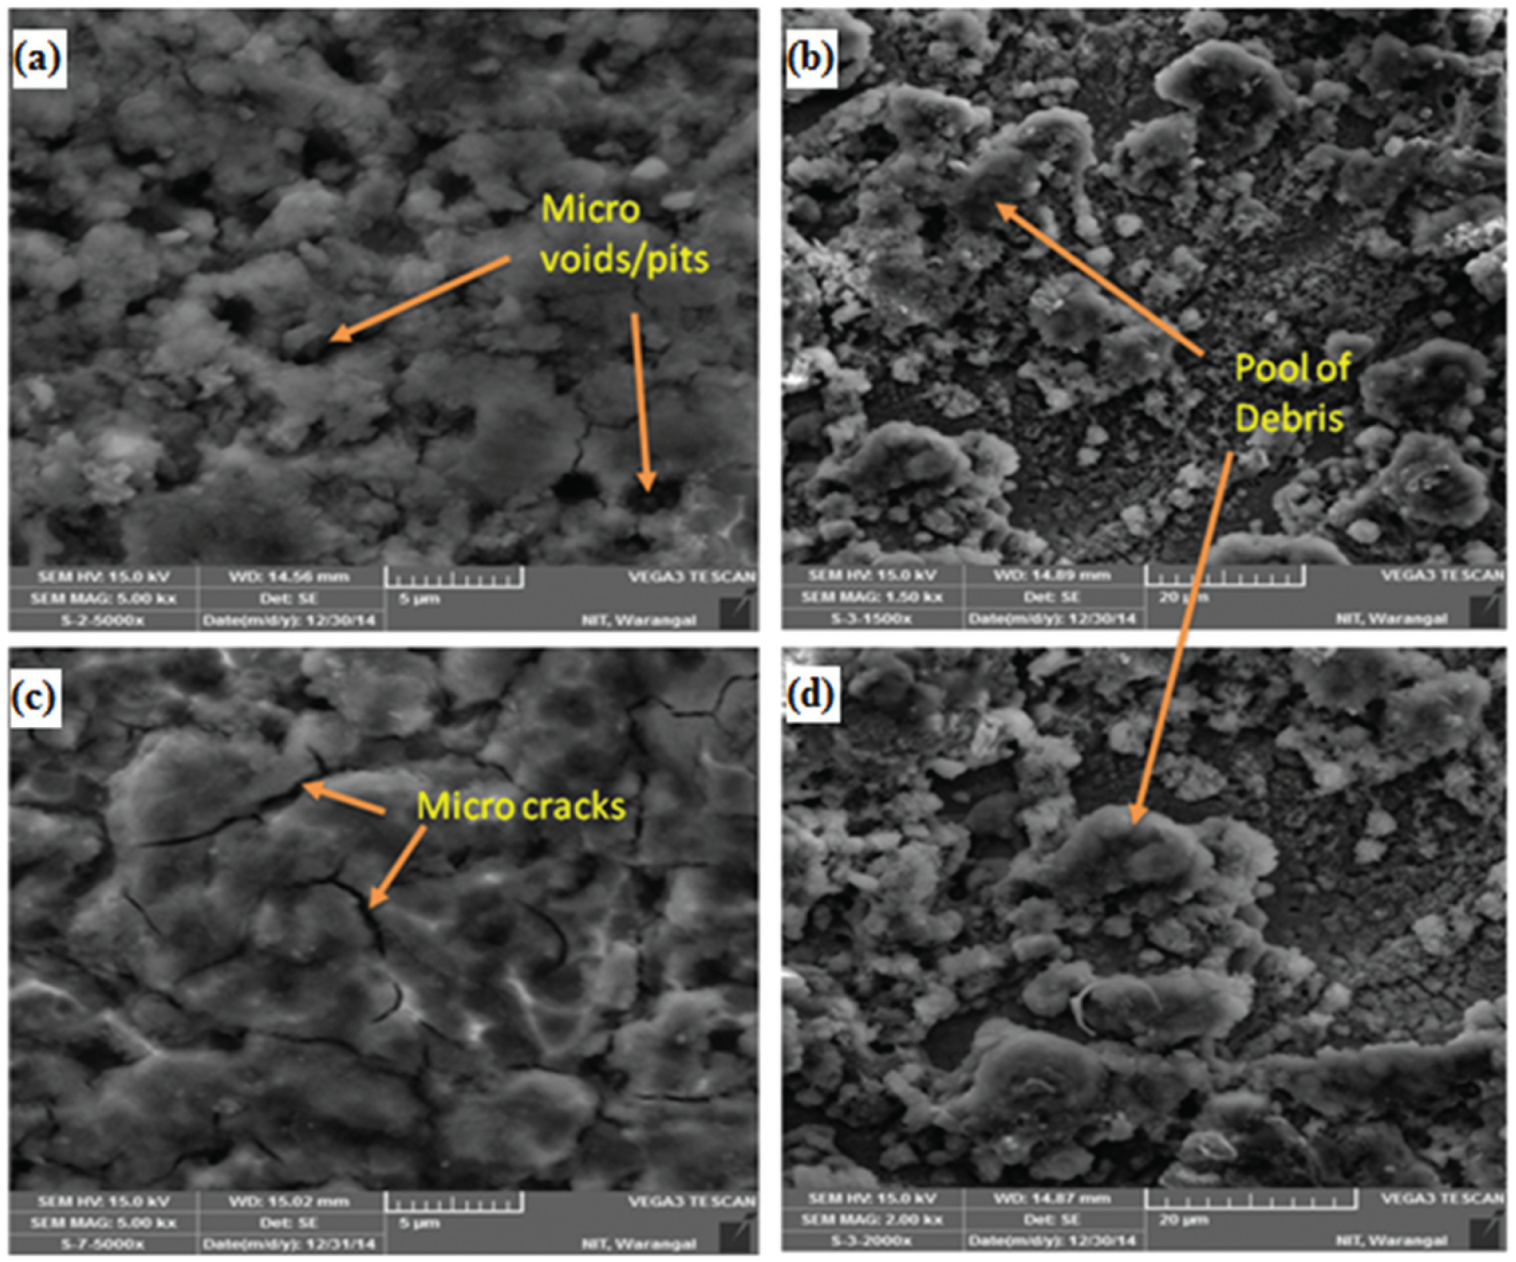
Scanning electron microscope (SEM) images of (a) Micro voids/pits, (b) & (d) Pool of debris, and (c) Micro cracks.
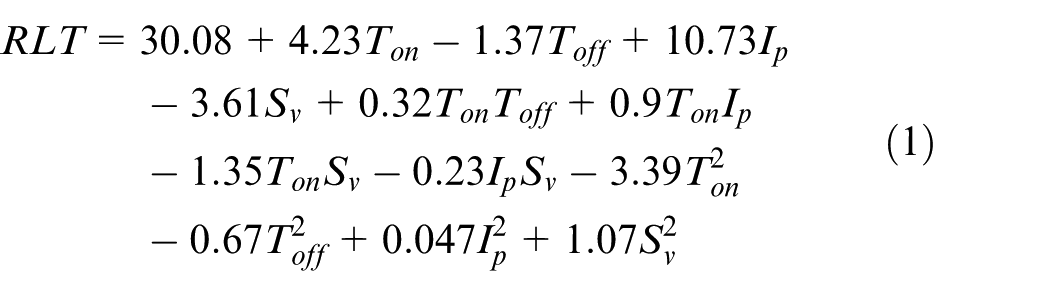
It is observed from the ANOVA results of RLT (Table 4 and Figure 4(a)–(f)) that the factors influencing the RLT are pulse-on time, pulse-off time, peak current, servo voltage, interactions of pulse-on time with peak current and pulse-on time with servo voltage. The factors for which the p value is less than 0.05 will influence that model. A mathematical predictive model has been developed using ANOVA. The predictive model in coded form is given by equation (1). For this model, R2, adjusted R2 and predicted R2 values are 98.6%, 97.6% and 94.9%, respectively
ANOVA results for recast layer thickness.
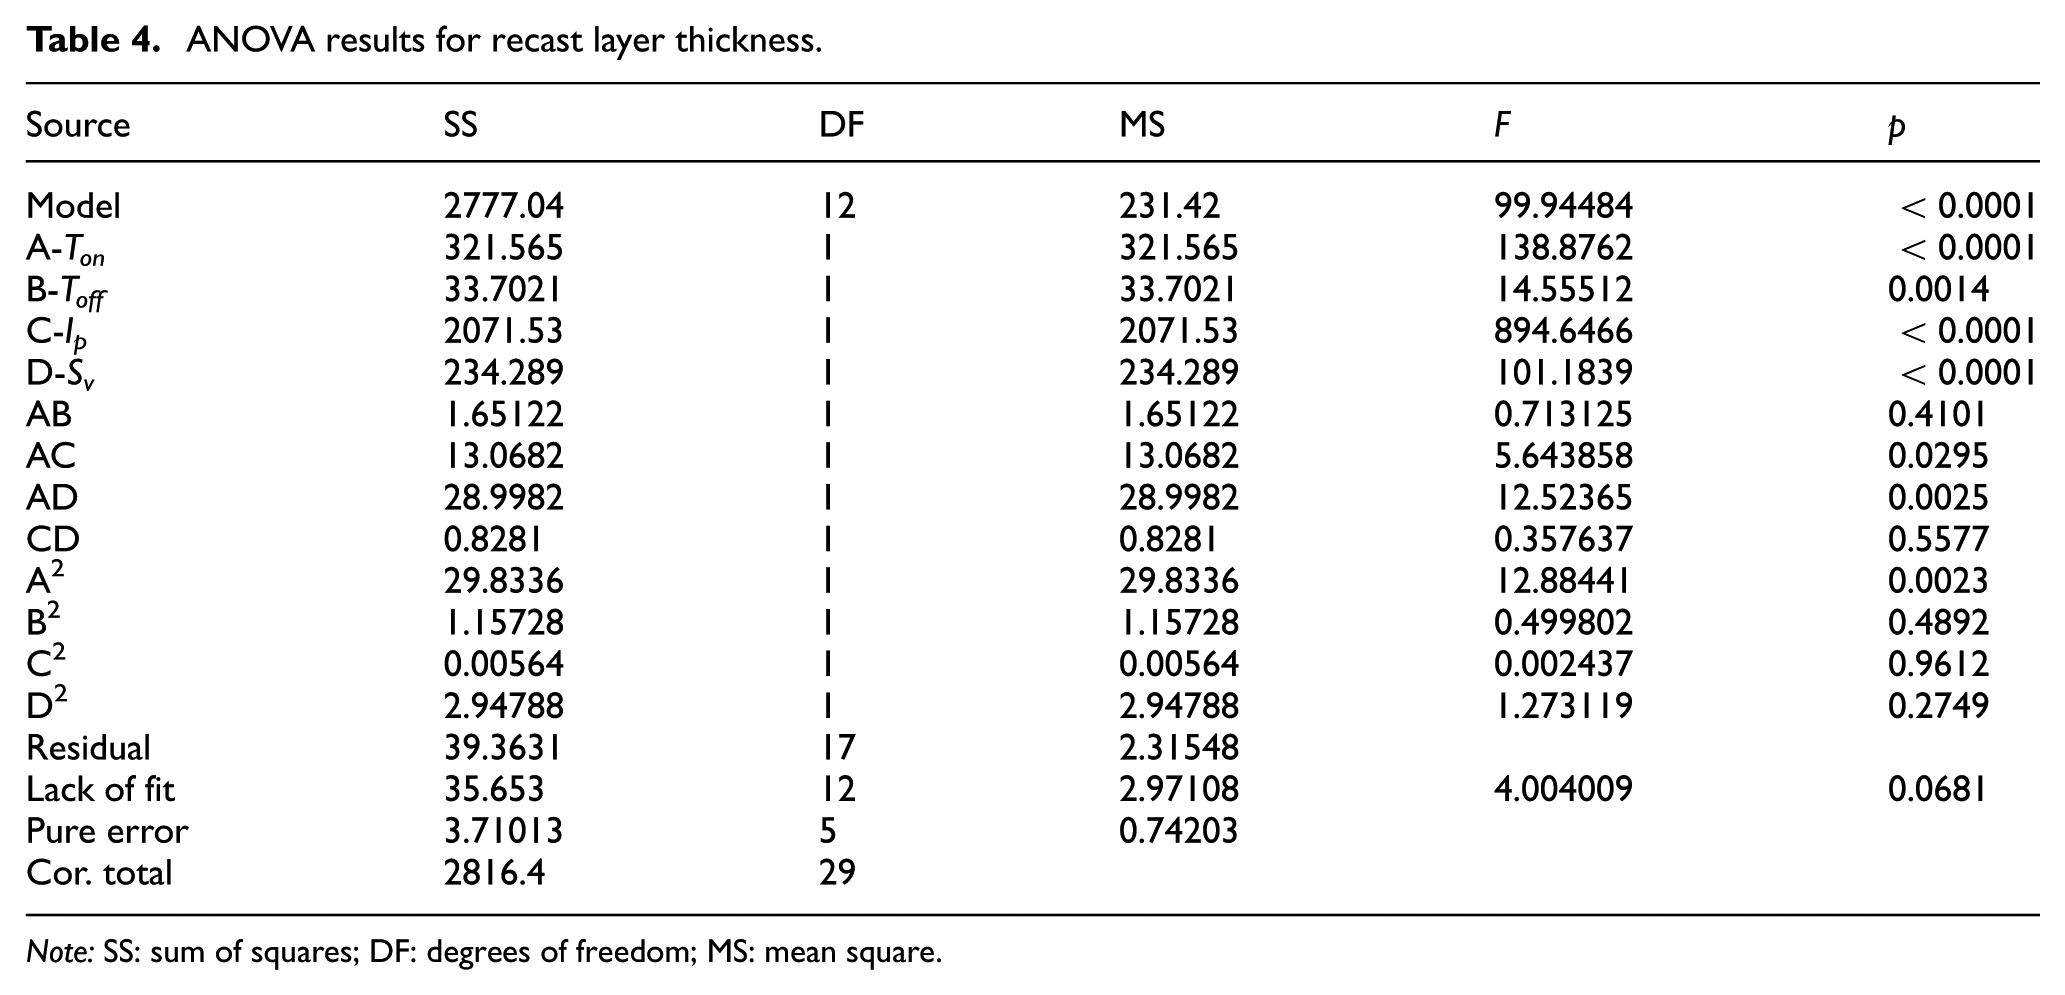
Note: SS: sum of squares; DF: degrees of freedom; MS: mean square.
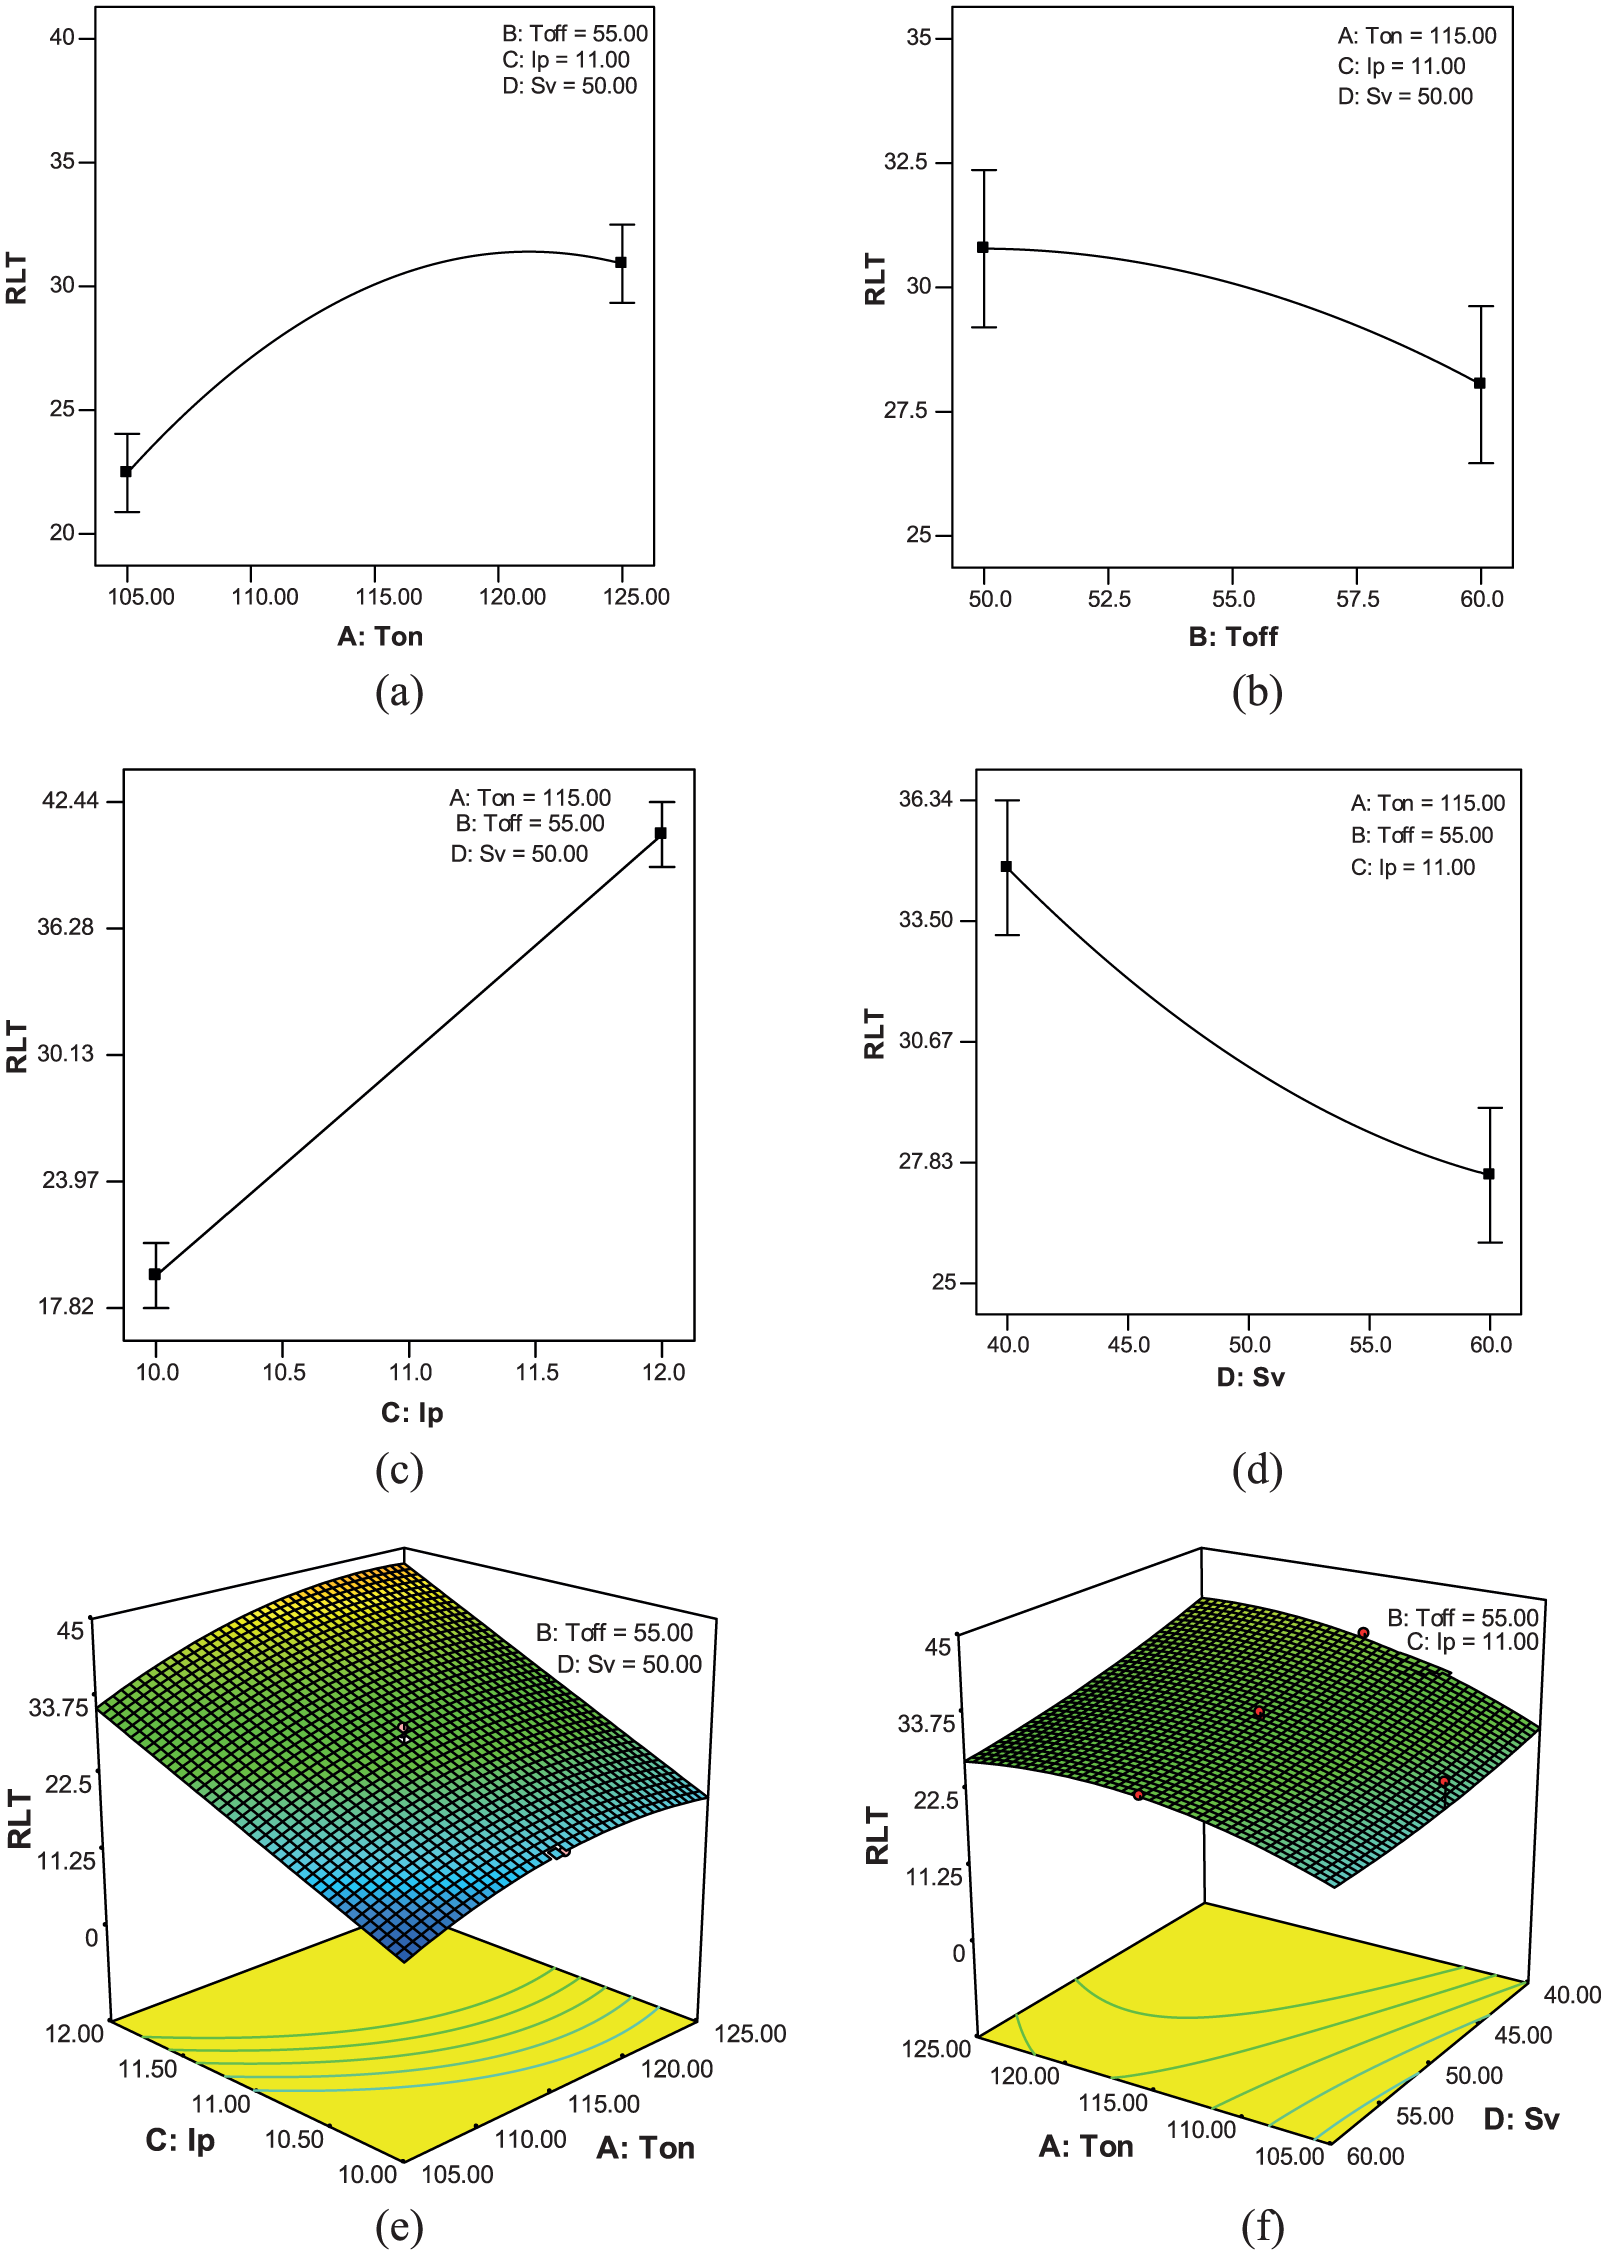
Effect of process parameters on recast layer thickness: (a) Ton (µs), (b) Toff (µs), (c) Ip (A), (d) Sv (V), (e) Ton (µs) and Ip (A), and (f) Ton (µs) and Sv (V).
Influence of process parameters on RLT is shown in Figure 4(a)–(f). It can be observed from Figure 4(a) that RLT increases as pulse-on time increases. Since pulse-on time corresponds to amount of time allowed to discharge energy in machining process, amount of energy increases with pulse-on time. Higher the energy discharged, higher will be the MRR and cutting speed. As the material removal increases, the dielectric fluid will not be able to flush away the debris effectively at higher cutting speed. Therefore, at high pulse-on time, chances of increasing the RLT on the machined surface will be high. Pulse-off time is the time interval between discharges. Behaviour of this factor is opposite to pulse-on time as shown in Figure 4(b). Peak current is the amount of current applied during machining. The discharge energy is directly proportional to the current. At the high peak current, more energy is discharged and there is continuous spark generation and the cutting speed increases. At higher cutting speed, more amount of material is removed from workpiece as well as electrode and therefore chances of forming the RLT will be high as shown in Figure 4(c). Servo voltage is the reference voltage and is used to control the wire retracts and advances. At lower value of servo voltage, the gap between wire and workpiece becomes narrow allowing more number of sparks per unit time. More amount of heat is generated causing cutting speed to increase, thereby increasing the RLT. In other words, as the servo voltage increases, the cutting speed decreases which causes RLT to decrease as shown in Figure 4(d). The interaction effects on RLT are also shown in Figure 4(e) and (f).
SR
From the ANOVA results of SR (Table 5 and Figure 5(a)–(d)), it is observed that Ton, Ip, Sv and interaction effect of Ton and Ip are influencing the SR. When Ton and Ip increase, the energy applied will also increase and more amount of heat energy will be generated during this period. At high energy levels, load on the wire causes the wire to vibrate, thereby increasing the SR as shown in Figure 5(a) and (b). At higher values of Sv, the mean gap between the wire and workpiece becomes wider which leads to decrease in number of electric sparks, thereby reducing the machining rate and vibrations thereby decreasing the SR as shown in Figure 5(c). R2, adjusted R2 and predicted R2 values were 94.41%, 93.24% and 91.29%, respectively. The mathematical model developed for SR from ANOVA in coded form is given in equation (2)
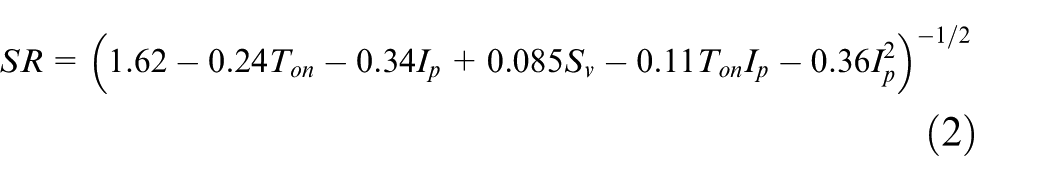
ANOVA results for surface roughness.
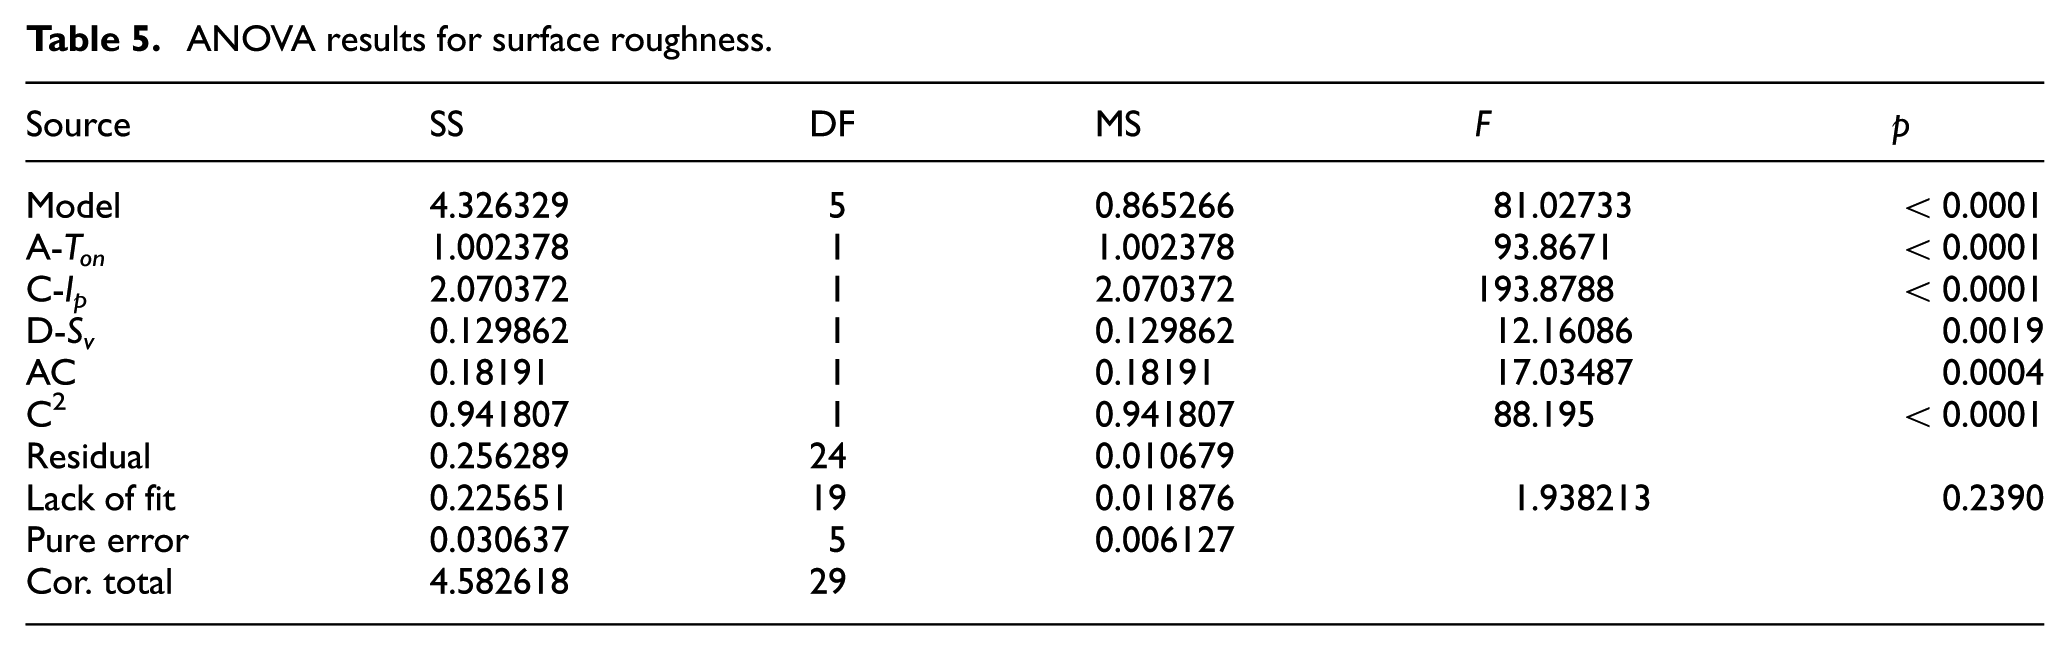
Effect of process parameters on surface roughness: (a) Ton (µs), (b) Ip (A), (c) Sv (V) and (d) Ton (µs) and Ip (A).
MH
Hardness of Inconel-690 base material is 221 HV. Hardness results of the machined surfaces are presented in Table 3. Interestingly, from the results, it can be observed that the hardness of the machined surfaces is found to be lower than that of the bulk material, that is, zero RLT. This is due to the fact that recast layer is composed of elements such as Cu, Zn, carbides, oxides and salts as observed from the EDS analysis. Therefore, hardness and RLT are inversely related. Although same wire was used in machining of steels in the literature, the carbides and oxides in such case are harder than the bulk material (steel). Furthermore, migration Cu and Zn in machining of steels has negligible influence on the hardness as compared to carbides and oxides. Hardness of the machined surface was found to lie in the range of 122–171 HV due to the variation of the RLT at different conditions.
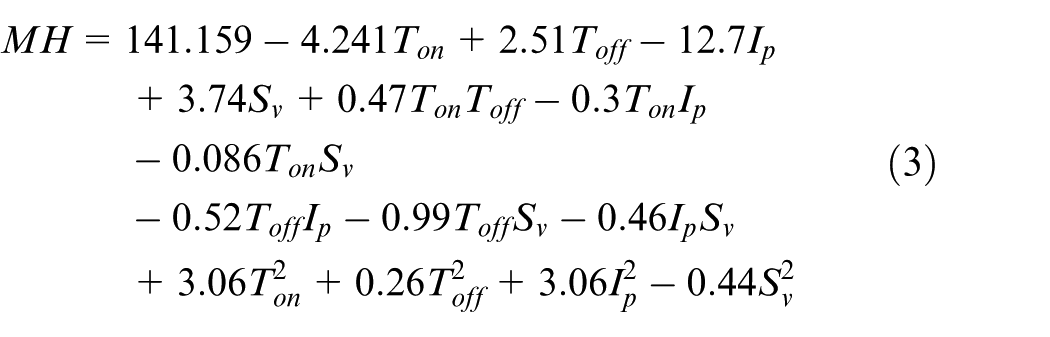
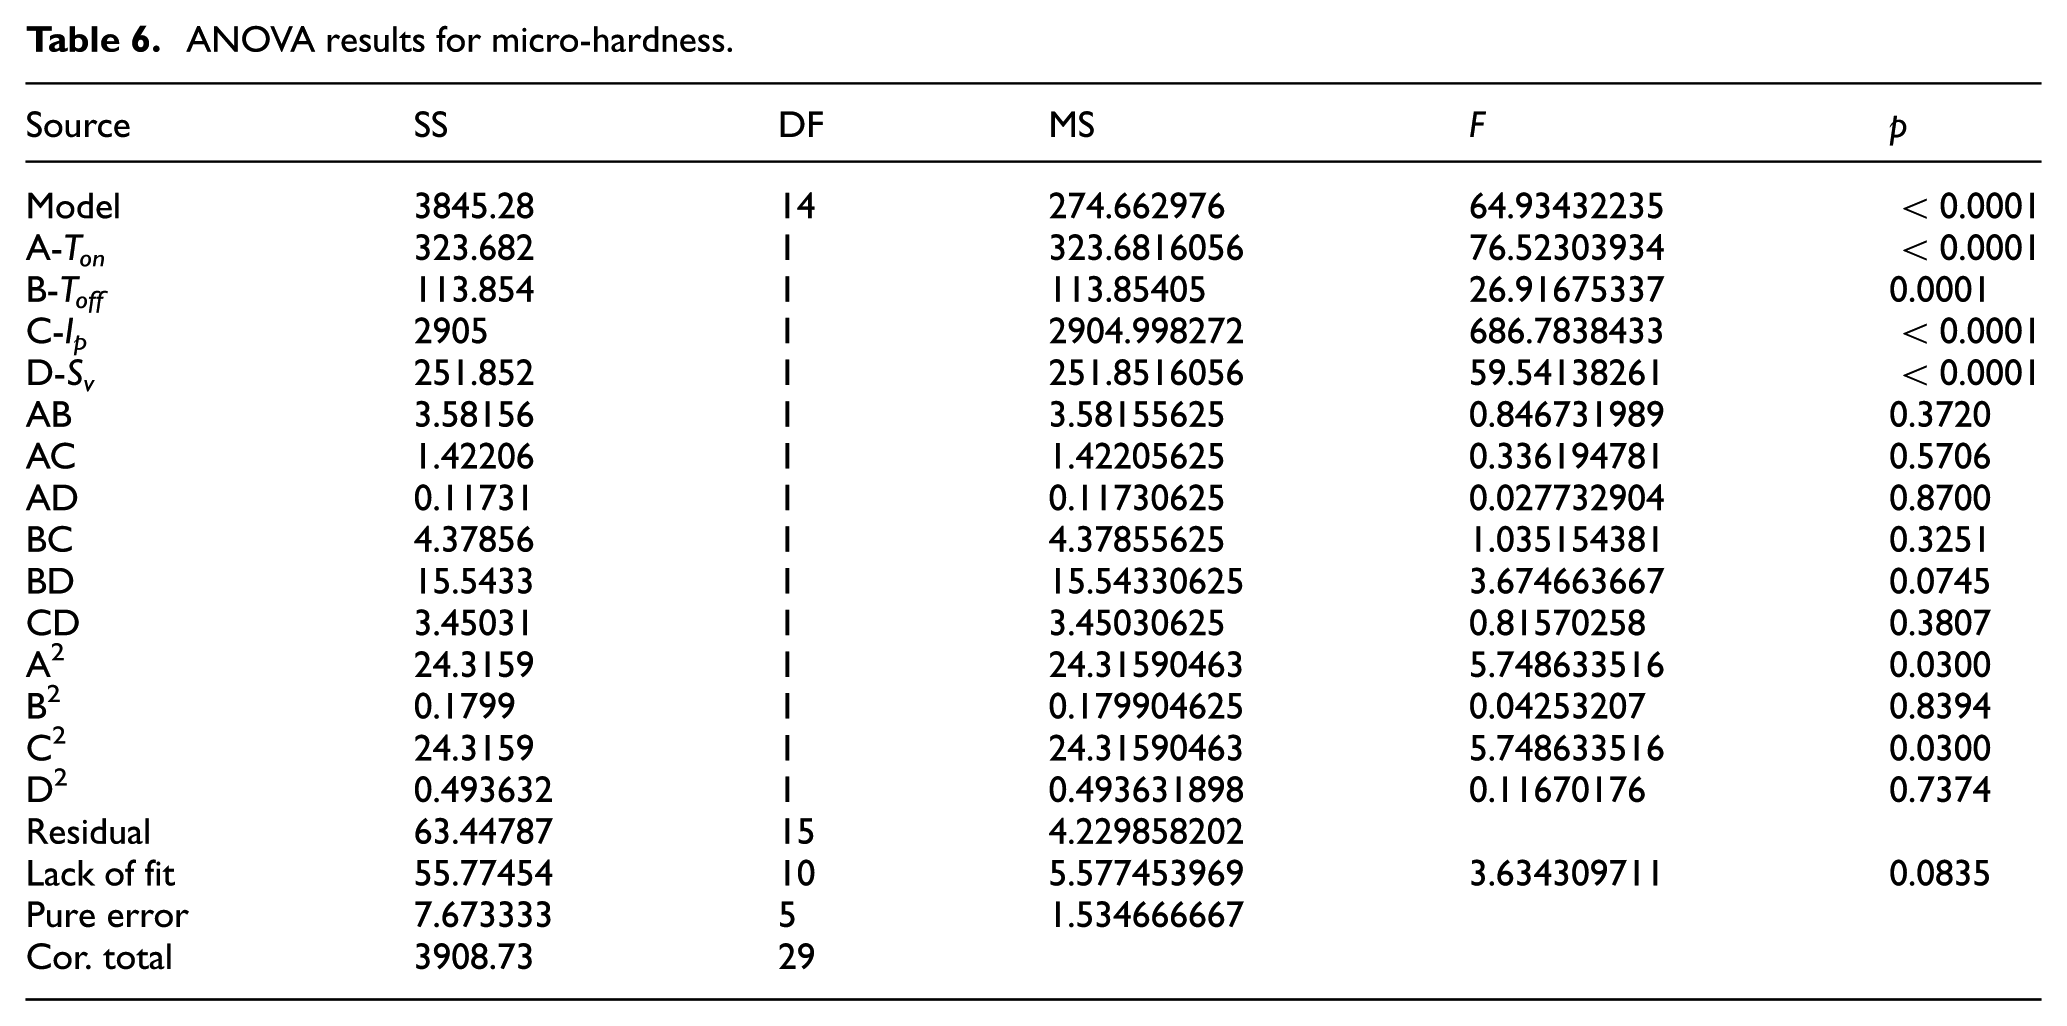
From the ANOVA (Table 6), it is observed that the factors such as pulse-on time, pulse-off time, peak current and servo voltage influence the hardness of machined surfaces. A prediction model has been developed using ANOVA and is given by equation (3) in coded form. The R2, adjusted R2 and predicted R2 values are 98.37%, 96.86% and 88.95%, respectively, for this model
ANOVA results for micro-hardness.
The effect of various process parameters and their interactions on hardness is shown in Figure 6(a)–(d). It can be observed from Figure 6(a) that the hardness decreases as pulse-on time increases. At higher pulse-on time discharge energy is more, which causes the cutting speed to increase. RLT increases with increase in cutting speed, thereby decreasing the hardness of machined surface. The behaviour of pulse-off time is opposite to pulse-on time as shown in Figure 6(b). As the discharge energy is directly proportional to the current, at the high peak current, the cutting speed and melting of metal are more. Therefore, RLT increases, thereby hardness decreases as shown in Figure 6(c). At low value of servo voltage, cutting speed is high due to the reasons explained earlier. As a result, RLT increases, thereby decreasing the hardness as shown in Figure 6(d).
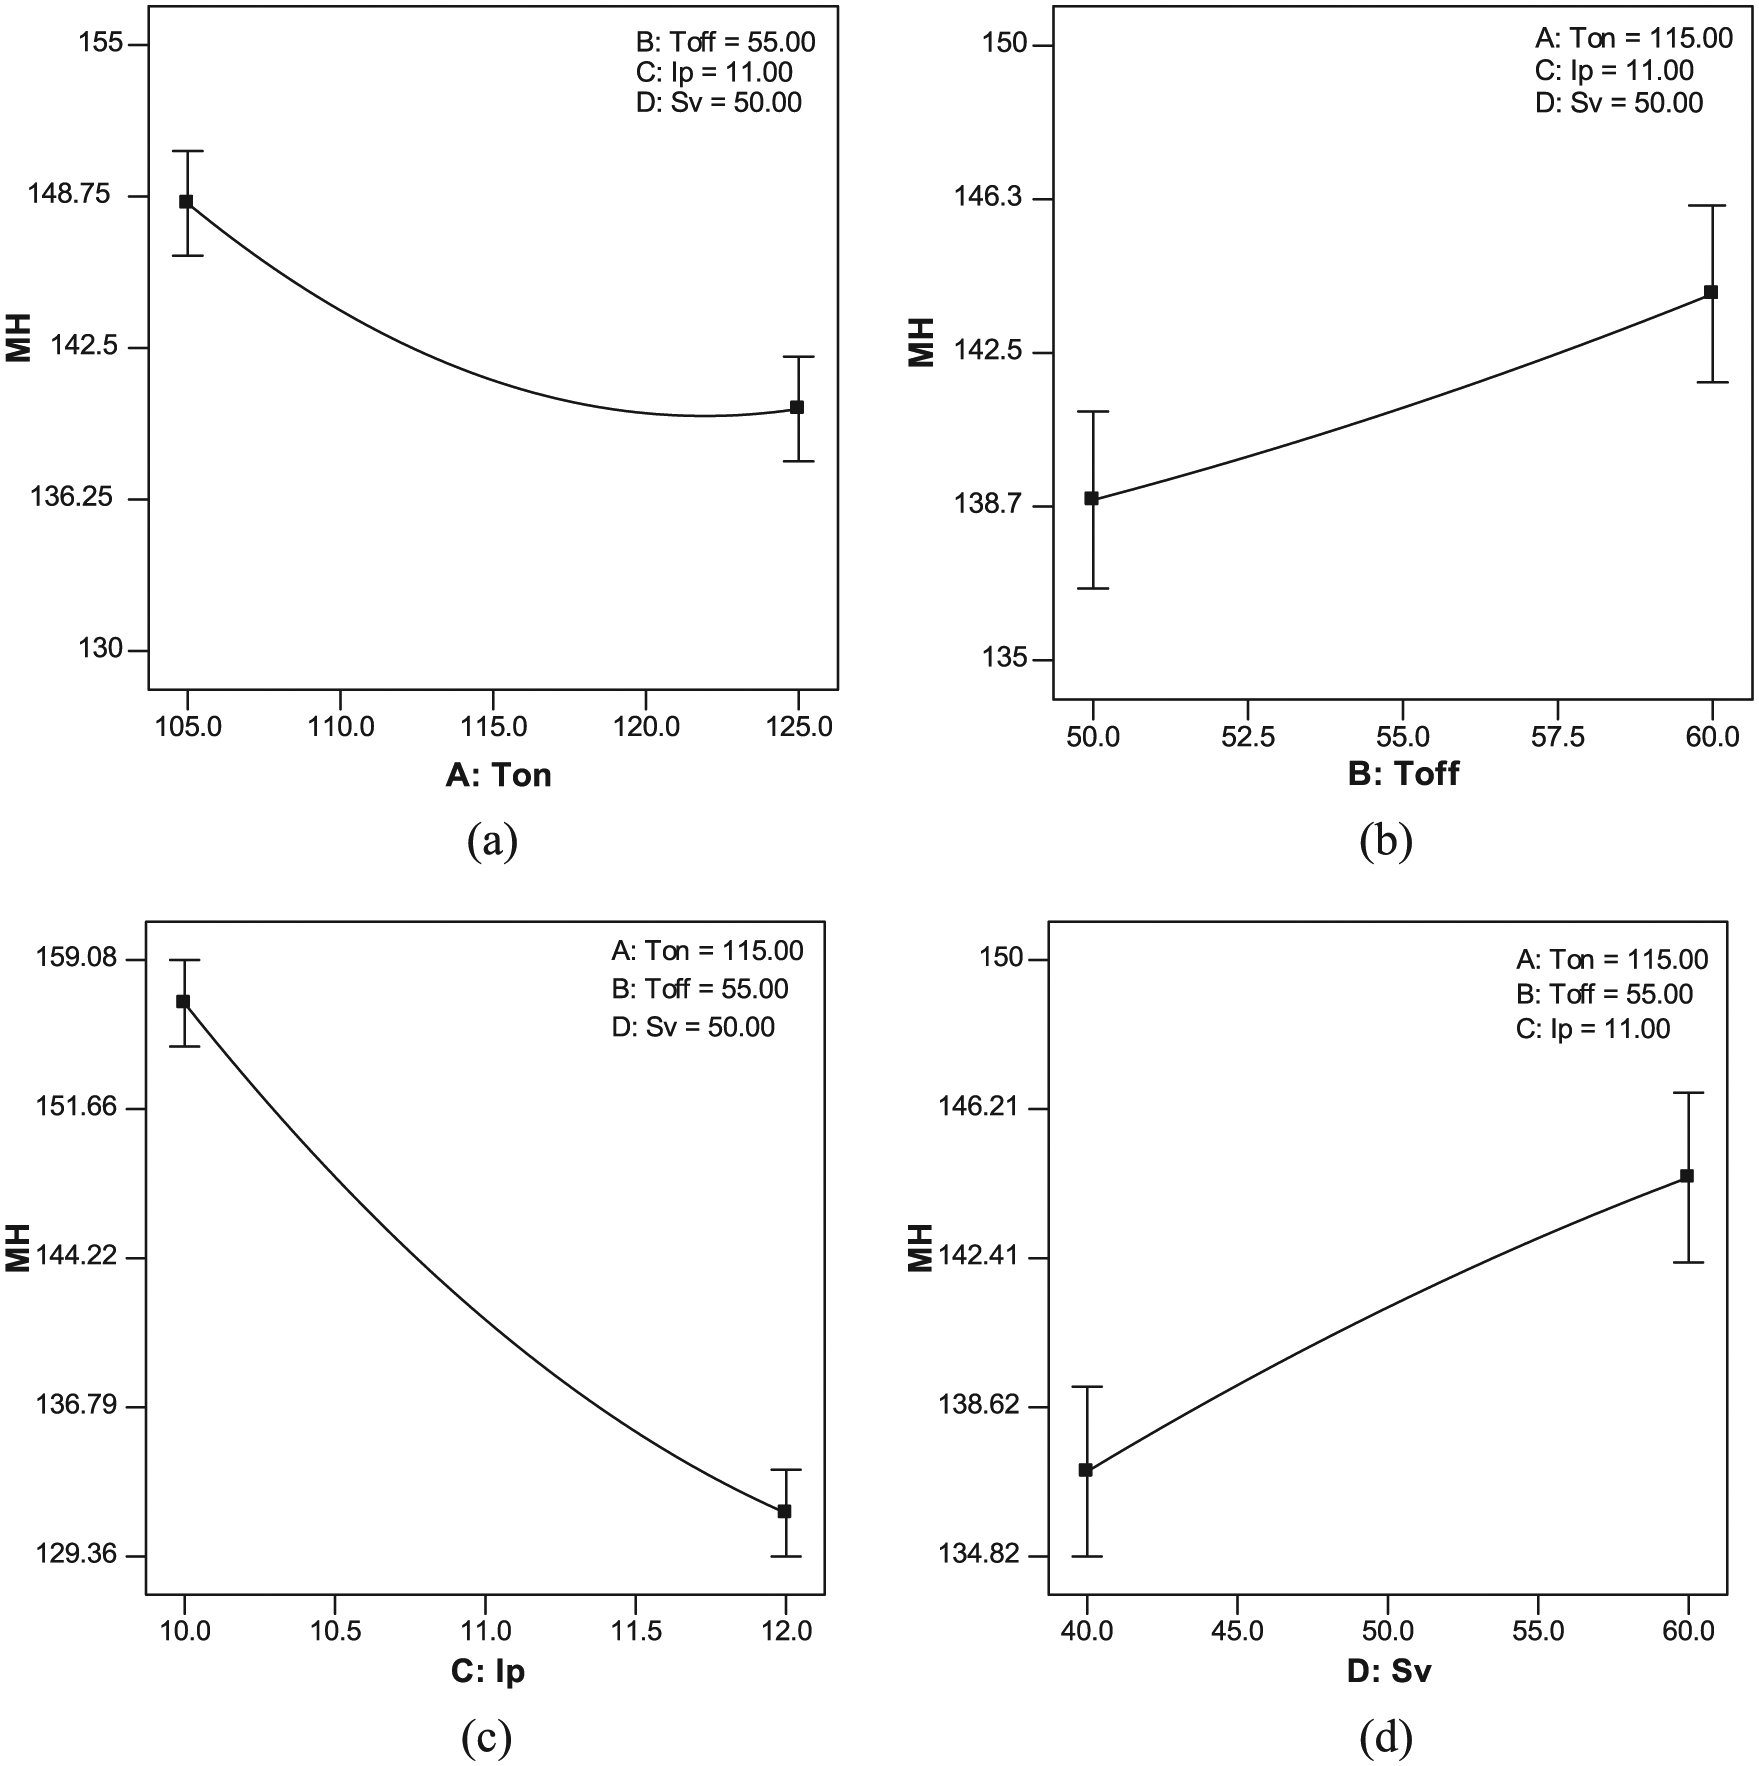
Effect of process parameters on micro-hardness: (a) Ton (µs) (b) Toff (µs) (c) Ip (A) and (d) Sv (V).
EDS analysis
EDS coupled with SEM is used for compositional analysis and chemical characterization. Surface layers of the WEDMed specimens have been analysed using EDS. Figure 7(a) and (b) shows the EDS spectra of machined surfaces of experiment number 20 (Ton = 105 µs, Toff = 60 µs, Ip = 10 A, Sv = 60 V) and experiment number 25 (Ton = 125 µs, Toff = 50 µs, Ip = 12 A, Sv = 40 V), respectively. Although the bulk material does not have zinc and has very less percentage of copper, the WEDMed surfaces were found to contain these elements in appreciable quantities. The quantities of these elements corresponding to experiment number 20 and 25 are found to be 4.12% Zn and 0.94% Cu and also 8.26% Zn and 1.51% Cu, respectively. These elements are migrated from the wire electrode while machining. Migration of Zn and Cu leads to soften the machined surfaces. Hence, hardness of the machined surface is lesser than that of the bulk material. Hardness of the machined surfaces is presented in Table 3.
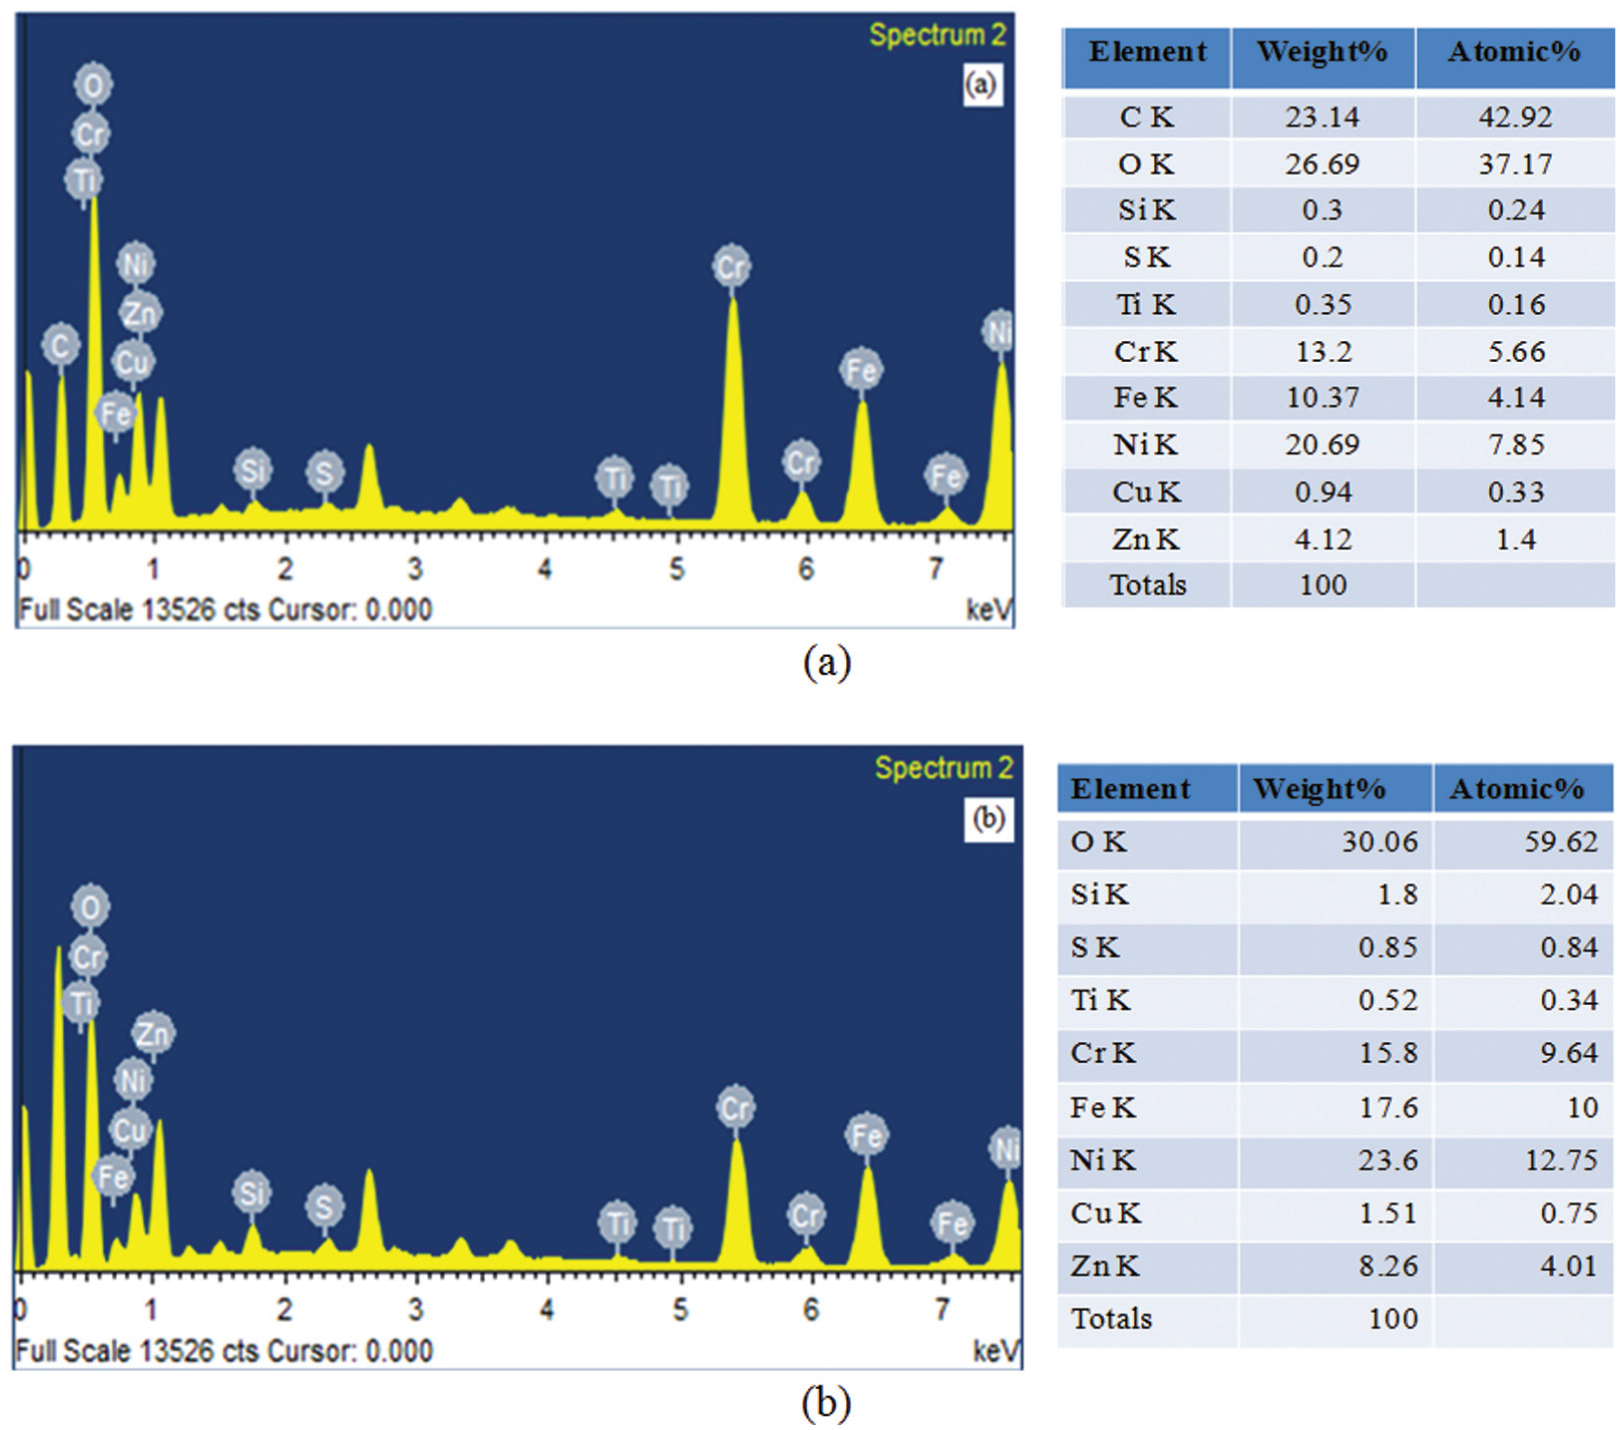
EDS images at different conditions: (a) Ton = 105 µs, Toff = 60 µs, Ip = 10 A, Sv = 60 V and (b) Ton = 125 µs, Toff = 50 µs, Ip = 12 A, Sv = 40 V.
Conclusion
Nickel-based super alloys are gaining importance day by day due to their superior properties like high hardness at elevated temperatures, low thermal conductivity and high resistance to corrosion. Machining of these alloys with conventional machining processes is very difficult due to these properties. Inconel-690, one of the nickel-based alloys, can be machined using WEDM process. A recast layer is formed on the surfaces of these machined components whose hardness is found to be lower than that of the base material. However, the machined components should meet their functional requirements like retaining the hardness at high temperatures. Controlling the recast layer and associated hardness is always a challenging task especially in a machining process like WEDM due to its stochastic nature. In this work, an attempt is made to investigate on the influence of WEDM process parameters on RLT and hardness of the machined surfaces while machining Inconel-690 material. Although formation of recast layer is unavoidable, its thickness can be minimized by proper selection of machining conditions. In order to reduce the rejection rate of the machined components based on their surface quality, SR is also considered as one of the responses in this work. The important findings are listed below:
RLT of machined components increases with increase in pulse-on time and peak current, whereas it is found to decrease with increase in pulse-off time and servo voltage.
Roughness of the machined components is predominantly influenced by pulse-on time, peak current, servo voltage and interaction effect of pulse-on time and peak current.
Hardness of the machined surface is affected by pulse-on time, pulse-off time, peak current and servo voltage.
Hardness of the machined surface was found to be lower than that of the base material due to migration of Zn and Cu from wire electrode and also formation of carbides, oxides and salts while machining.
Micro-cracks and pool of molten metal were also observed on the machined surfaces.
Also, predictive models for RLT, SR and hardness are developed for Inconel-690 material with respect to process parameters for the first time. The validity of these regression models is expressed by their R2 values. In the present ANOVA analysis, the R2 values for all the responses were found to be greater than 94%. Therefore, the developed regression models exhibit strong correlations. In order to emphasize the validity of the models further, predicted values obtained from the regression models have also been compared against the experimental results. The average deviations were found to be less than 5%. Hence, industry can apply the developed models to predict the responses confidently.
Footnotes
Declaration of conflicting interests
The author(s) declared no potential conflicts of interest with respect to the research, authorship and/or publication of this article.
Funding
The author(s) disclosed receipt of the following financial support for the research, authorship, and/or publication of this article: The authors are thankful to DST-SERB of India for the financial assistance to carry out this research work through Project No. SR/FTP/ETA-10/2012.