
Abstract
A tool condition monitoring system based on support vector machine and differential evolution is proposed in this article. In this system, support vector machine is used to realize the mapping between the extracted features and the tool wear states. At the same time, two important parameters of the support vector machine which are called penalty parameter C and kernel parameter
Introduction
Tool wear during machining process has a negative effect on the quality of work-piece. Researches indicate that 20% of downtime for machine tools can be attributed to the tool failure.
1
For decades, many pattern recognition methods, such as artificial neural network (ANN),2–4 hidden Markov model (HMM),5–7 have been proposed and utilized to realize tool wear monitoring. However, there are some shortcomings for both methods. ANN, which is based on empirical risk minimization principle, is easier to appear over fitting and low convergence. Additionally, the generalization ability of ANN is obviously lowered when the number of the training samples is limited.
8
In terms of HMM, independence assumption for the data sequence is indispensable during the application of the algorithm. However, this condition is hard to be satisfied because of the continuity of the tool wear evolution, which lowered the recognition accuracy of the built classifier.
9
In recent years, kernel function–based support vector machine (SVM), which is based on structure risk minimum principle, is presented to realize tool condition monitoring (TCM). Elangovan et al.
10
applied SVM to realize wear monitoring of the carbide tipped tool during turning operation. By comparing various kernel functions, the authors claimed that the radial basis function (RBF) kernel gives higher classification efficiency. Shi and Gindy
11
presented a new tool wear predictive model by combining least squares support vector machines (LS-SVM) with principal component analysis (PCA) technique. The authors claimed that a good agreement could be found between the predicted and the measured wear value. Chen and Limchimchol
12
demonstrated the application of SVM in grinding process monitoring. The analysis results demonstrated that the performance of the grinding process can be identified accurately. All these applications show that SVM-based models are effective for tool wear classification, especially in the case of the limited training samples. At the same time, it can also be demonstrated that the kernel parameters
In this article, differential evolution (DE) algorithm is presented to realize the optimal selection of the kernel parameter
Based on SVM and DE algorithm, a TCM system is constructed in this article to realize tool wear monitoring of milling process. In this system, SVM is used to build the nonlinear relationship between sensory information and tool wear category. At the same time, kernel parameter
The rest of this article is organized as follows. First, the principle of the integrated DE-SVM classifier is presented. Then, a framework of TCM system is constructed and the principal of the feature extraction for the force signals is also depicted. In the following section, milling experiment is described and dynamic features are extracted from force signals. Also, in this section, DE-SVM classifier is constructed and compared with GS-SVM and ES-SVM methodologies by means of cross validation scheme. Some useful conclusions are summarized in the last section.
Principles of DE-SVM
SVM
SVM is mainly based on statistical learning theory and characterized by the application of nonlinear kernels, high generalization capability and the sparseness solution.
28
The basic concept of the SVM is to map the training samples which cannot be classified by linear function into a high-dimensional feature space by nonlinear function
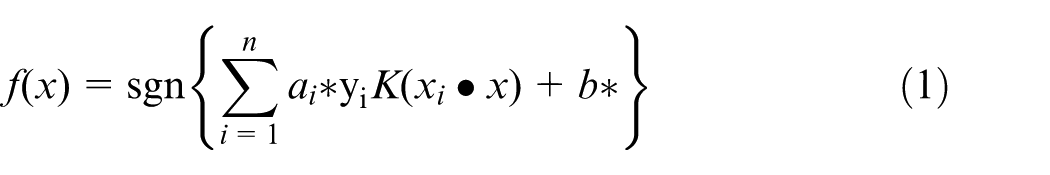
where
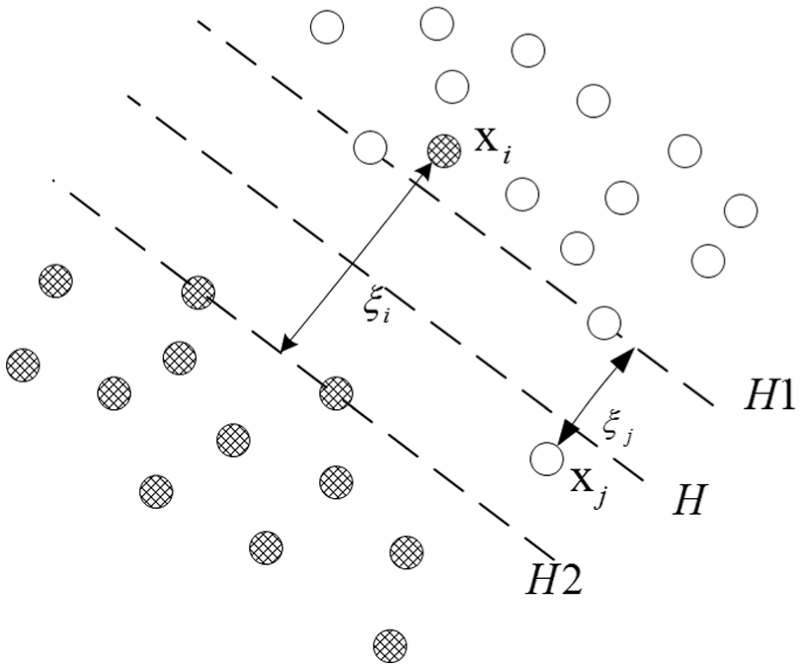
Classifying principle of SVM.
The classical definition of
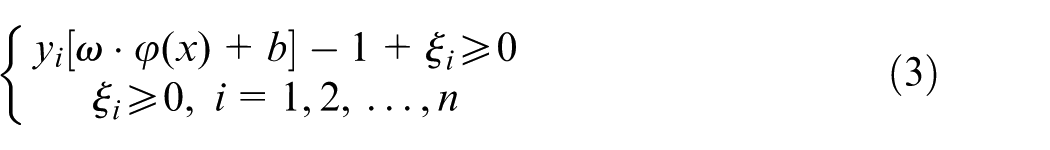
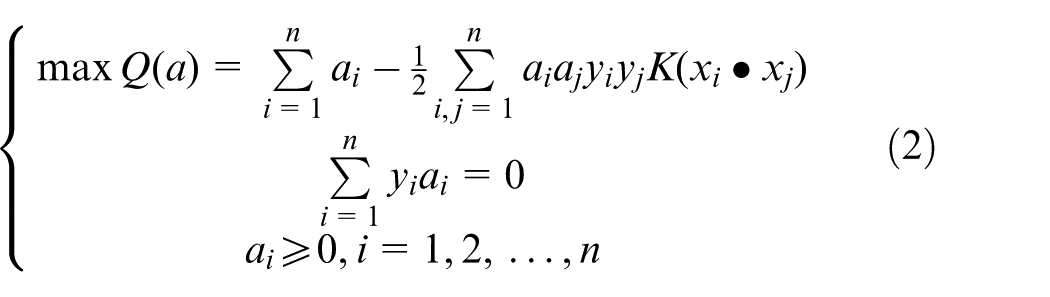
where ω is the weight vector and b is the bias term. ω can be calculated by minimizing the following objective function 32
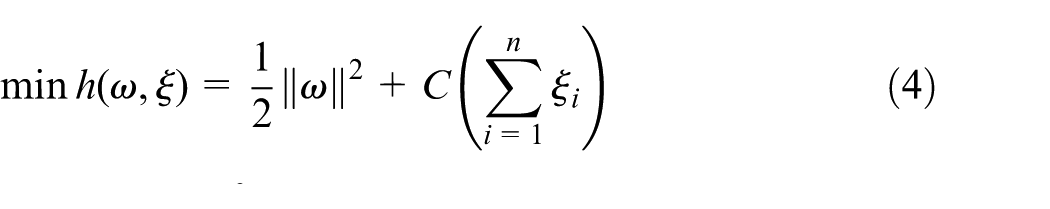
where
For SVM, RBF 28 is one of the most common used kernel functions whose mathematical expression is given as follows
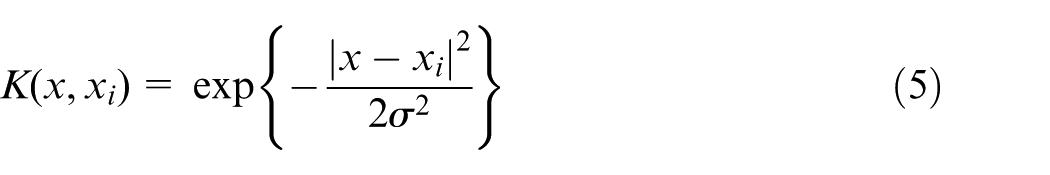
where σ is the width of the RBF kernel function, which affects the mapping between the transformation of data space and complexity degree of sample distribution in the higher dimensional feature space. 13
DE
DE is motivated by natural evolution of the species and has been successfully used to solve global optimization problem. DE algorithm works by cooperation and competition among individuals in certain population during evolution process. Each population comprises NP individuals, and each individual can be depicted by target vector
Step 1: initialization
First, the population size NP, the set of objective parameters D and the maximum number of generation
Step 2: mutation
Mutation is crucial for maintaining diversity in a population. The most commonly used mutation strategy is DE/rand/1/bin, 34 whose mathematical equation is given as follows 35

where t represent the tth generation,
Step 3: crossover
The trial vector
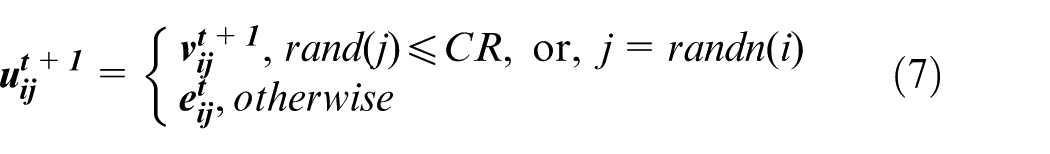
where
Step 4: selection
After the fitness value of each trial individual and its corresponding target individual are calculated, the selection process is realized by the following greedy algorithm 38
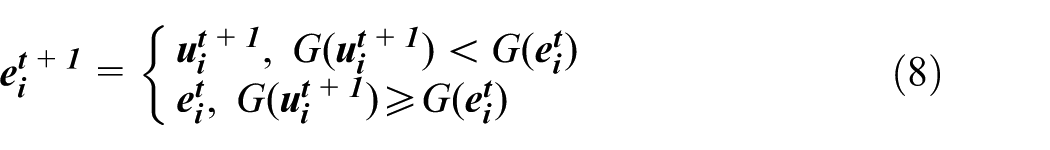
where G is the fitness function. Obviously, the individual with better fitness value is most likely to be selected into the new generation.
Step 5: termination
The optimization process is terminated only if the iteration times are larger than the predefined maximum generation number gmax and the values obtained in the last generation are taken as the optimal parameters.
DE-based SVM classifier
The flowchart of DE-SVM classifier is shown in Figure 2. First, the parameters of SVM classifier, such as the parameter set
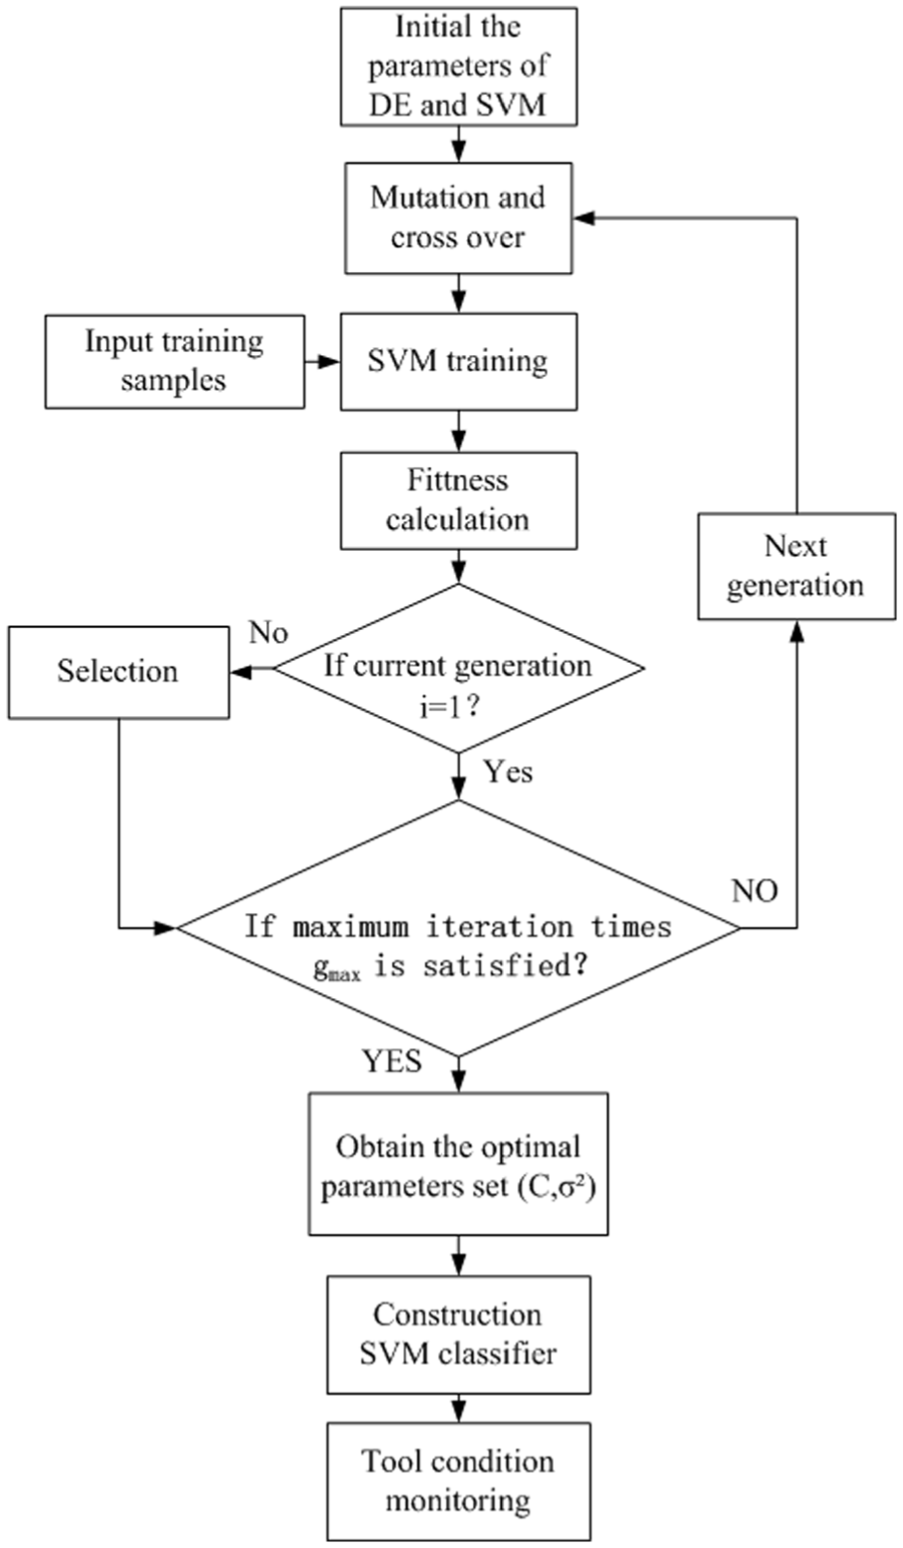
Flowchart of DE-SVM classifier.
TCM system based on DE-SVM
Framework of TCM system
The framework of TCM system is shown in Figure 3. The realization of this system includes two stages. One is to construct DE-SVM model and the other is to utilize it for monitoring tool wear states in real application. In the first stage, force signals are collected and their corresponding tool wear values are measured by an optical microscope and recorded simultaneously. Under different tool wear categories, time and frequency domain features are extracted from the collected force signals during machining process and the corresponding training and test samples are organized correspondingly. Then, the prepared training samples were used to construct SVM model. The parameter C and
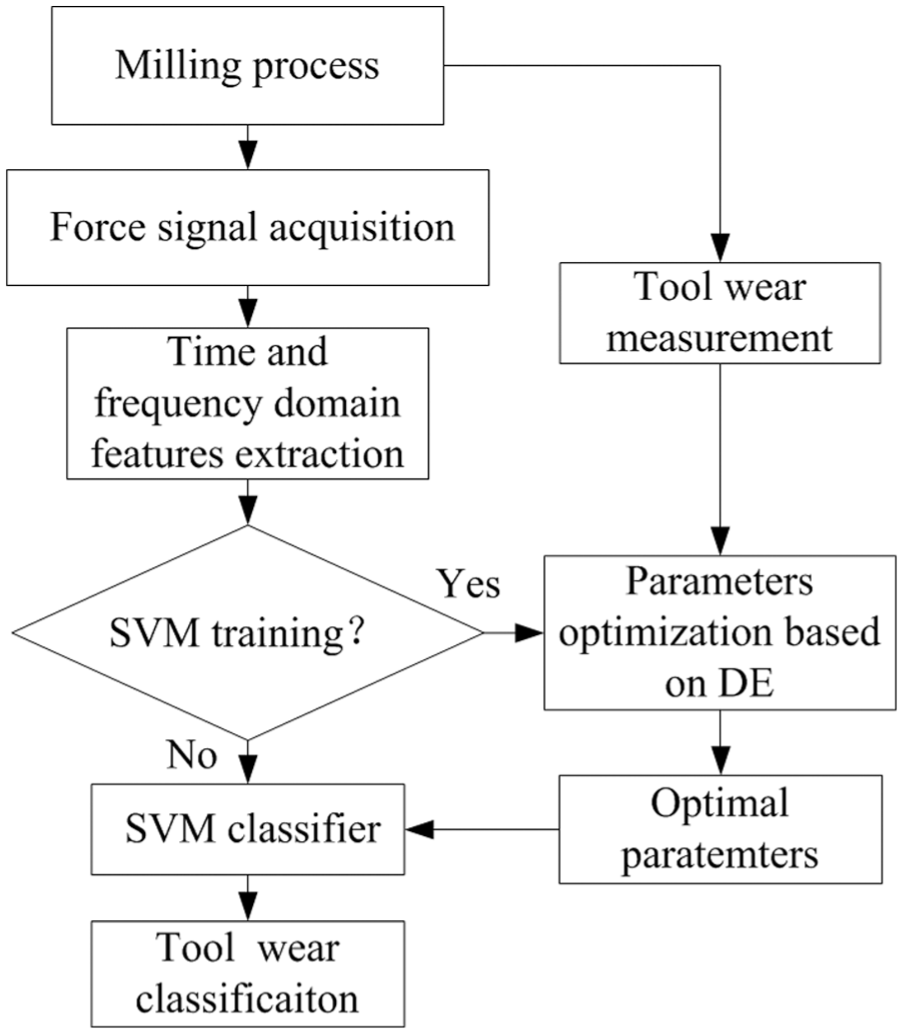
Framework of DE-SVM–based TCM system.
Feature extraction
Effective features are necessary to depict the dynamic relationship between the sensory information and tool wear states. In this article, five time domain and four frequency domain features are extracted based on the force signals. The time domain features include skewness, kurtosis, root mean square, variance and peak-to-peak value. The frequency domain features include mean frequency, frequency domain skewness, frequency domain kurtosis and root mean square ratio. The mathematical equations of these features are shown in Table 1.
Mathematical equations of time and frequency domain features.
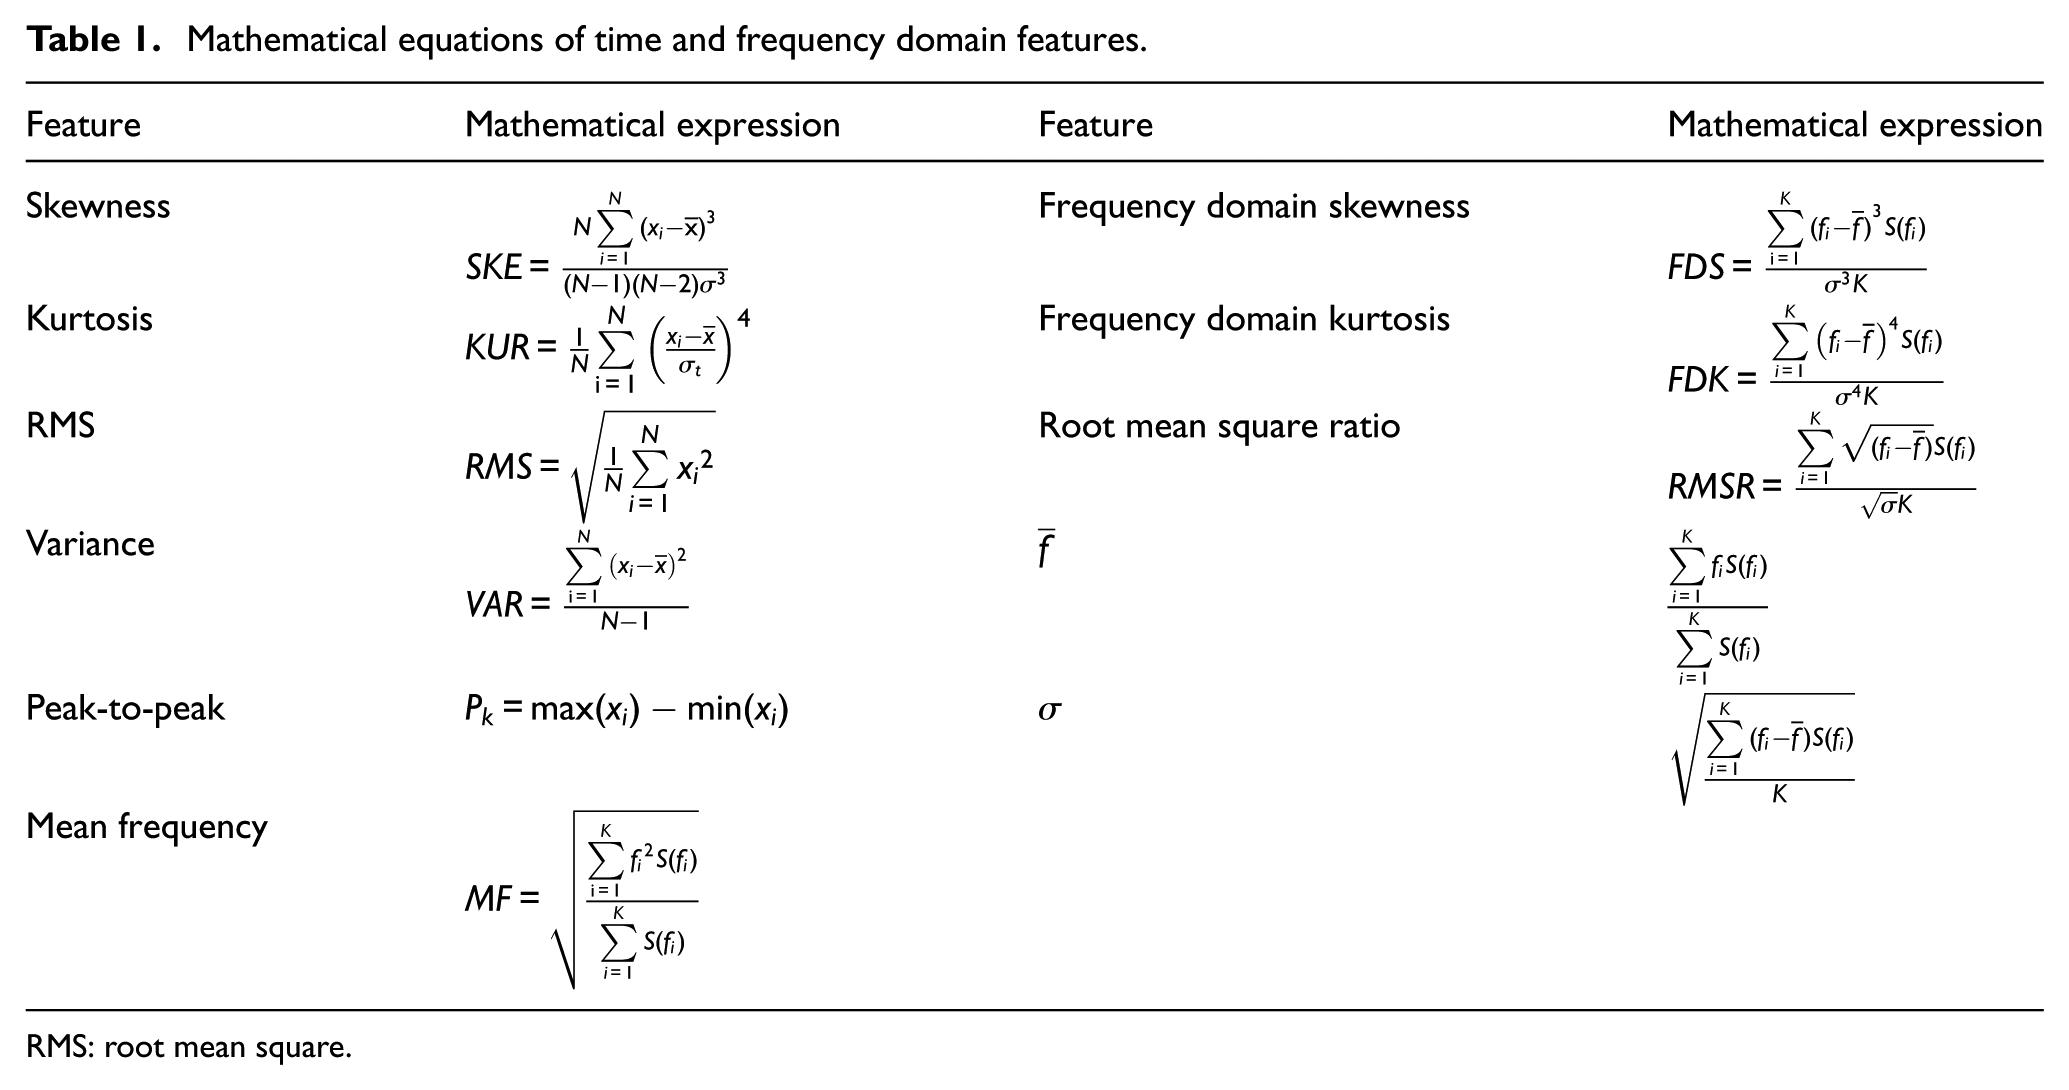
RMS: root mean square.
Monitoring and analysis
Experiment and data preparation
Experiments of titanium alloy were conducted to verify the effectiveness of the proposed method. The framework of the experimental setup is shown in Figure 4.
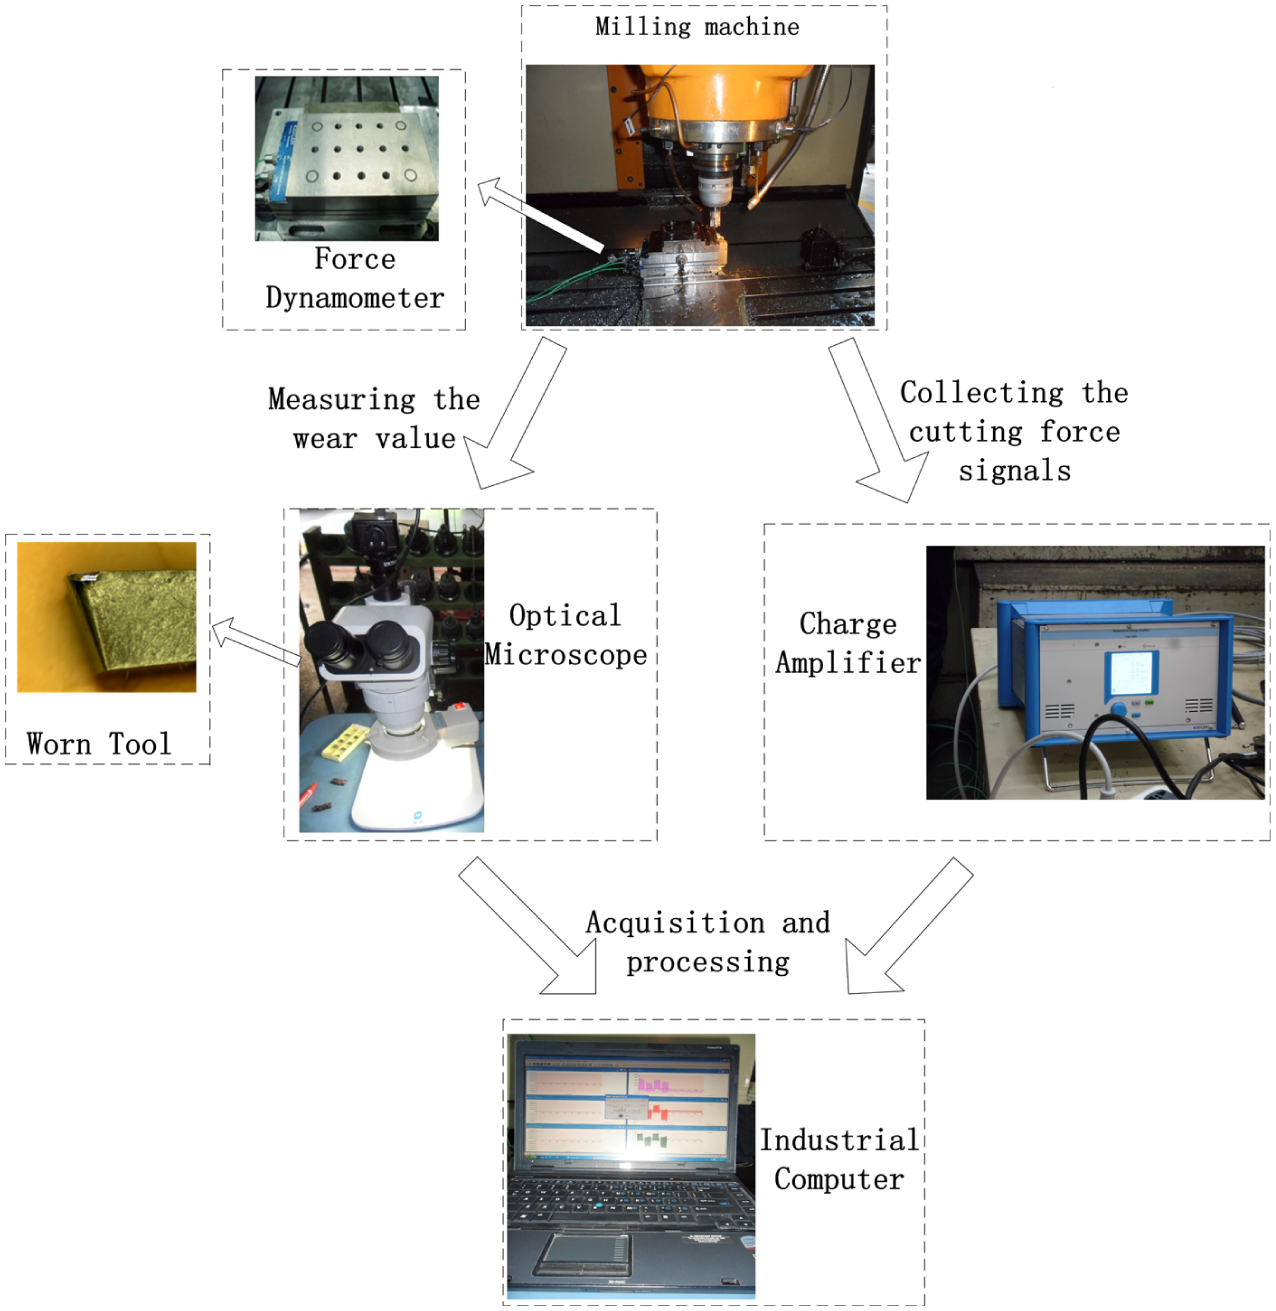
Framework of the experimental setup.
The machine tools used in this experiment is MAKINO vertical milling center. Ti-6A1-4V was chosen as work-piece material and the size was set to be 150 × 100 × 20 mm. The cutting parameters were set as follows: rotating speed
Tool wear scopes for four kinds of tool wear states.
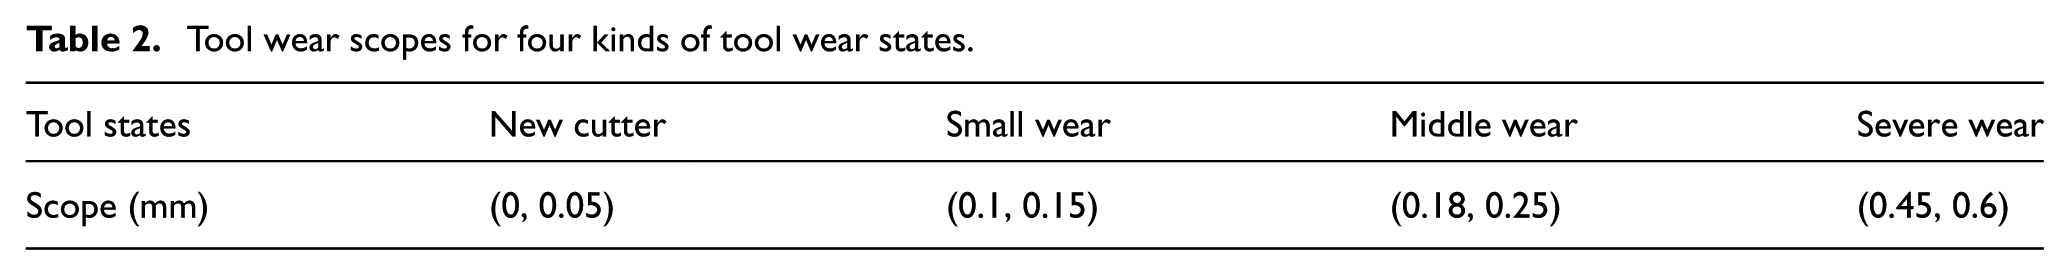
The spatial distribution of several selected feature vectors under different tool wear states is shown in Figure 5. It can be observed that the distribution of these features is severely dispersed and overlapped, which casts some difficulties on the construction of classification decision boundary. In the following section, DE-SVM–based TCM system is utilized to realize the classification of the each tool wear state.
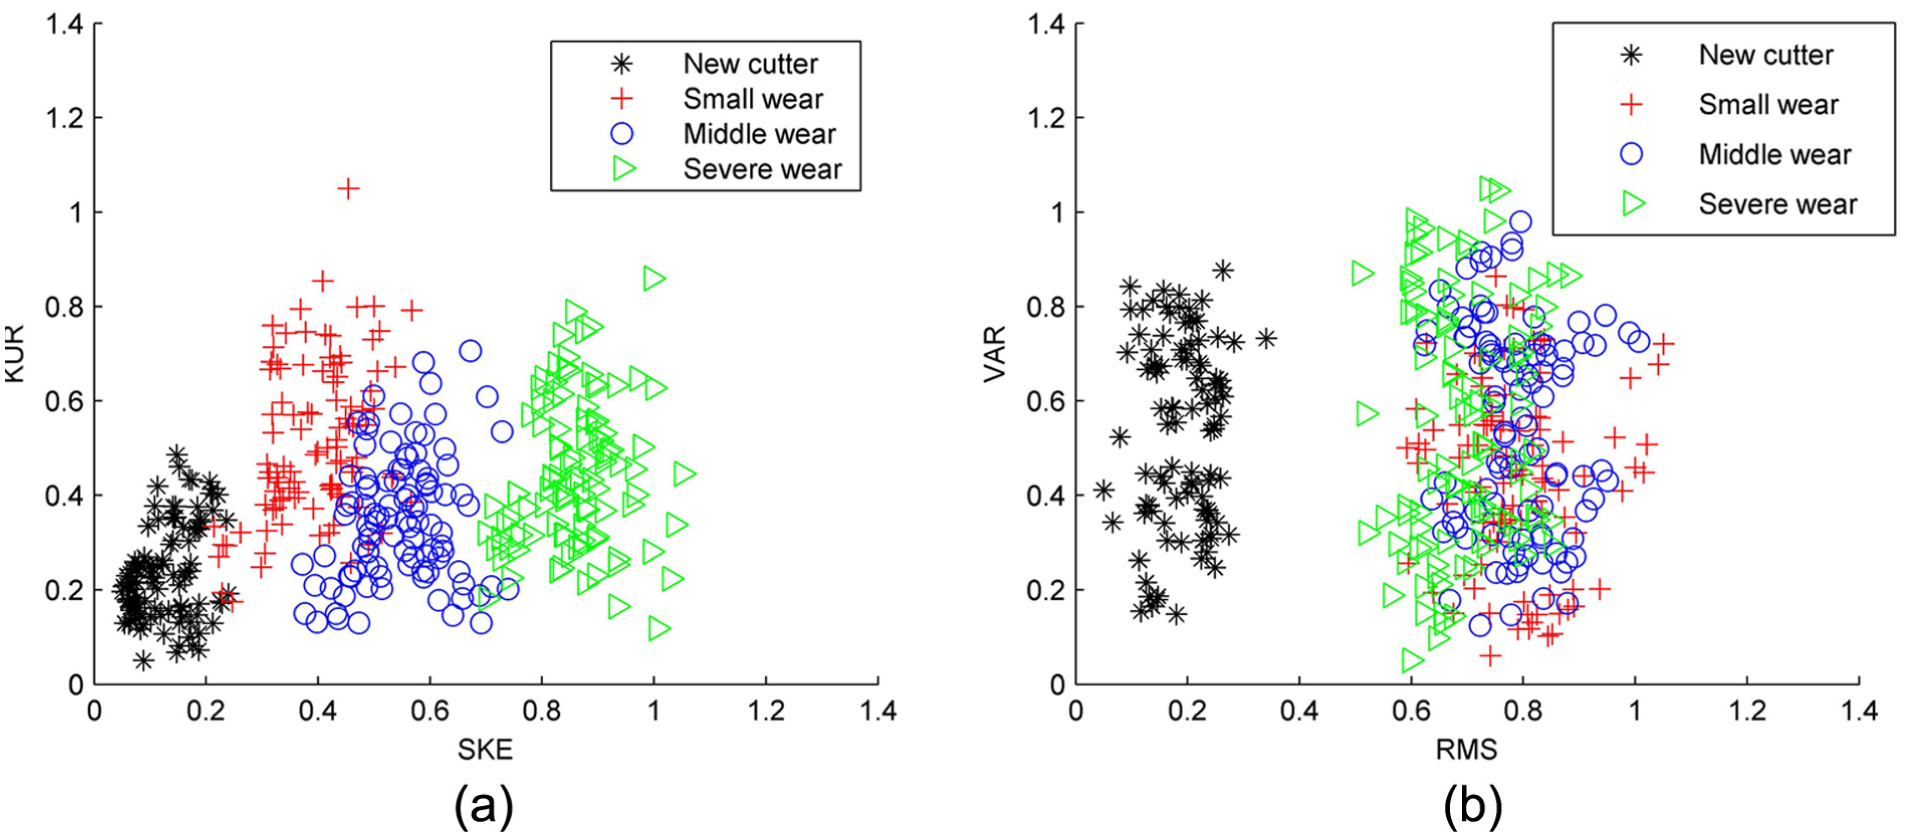
Spatial distribution of the feature vectors. (a) The spatial distribution of kurtosis(KUR) and skewness(SKE) under different tool wear states. (b) The spatial distribution of variance(VAR) and root mean square value (RMS) under different tool wear states.
k-Fold cross validation
As a kind of statistics analysis tool, cross validation is widely utilized to evaluate the performance of classification accuracy.39,40 In k-fold cross validation, the overall data are randomly partitioned into k sets of equal sizes. Each of the k subsets is used once for testing and the rest is utilized for training. The steps above are repeated k times, and the average accuracy of these k iterations is taken as the final result. The main advantage of this method is that each subset can be utilized for testing and training which make the final evaluation result robust. In this article, fourfold cross validation is applied to evaluate the performance of ES-SVM, DE-SVM and GS-SVM classifier.
Tool wear classification based on DE-SVM
DE-SVM classification
The initialization parameter of DE-SVM classifier is given as follows: penalty parameter
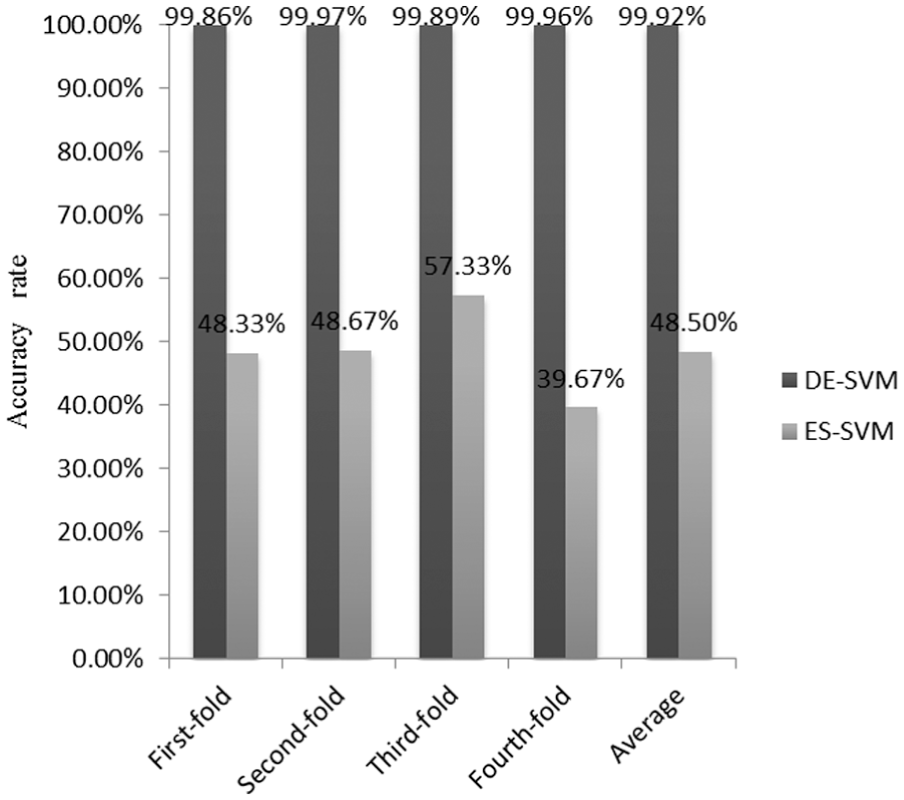
Comparison of the accuracy rate for DE-SVM and ES-SVM.
Comparison with ES-SVM
To make a comparison, ES algorithm is introduced so as to construct ES-SVM classifier based on the same training samples. Two empirical equations, which have been adopted in several articles, are used to select the optimal parameters in SVM. That is,
It can be observed that the average accuracy rate of ES-SVM is only 48.5% while DE-SVM can reach 99.92%. This shows that although ES method can provide an intuitive and fast instruction for choosing SVM parameters, it is not realistic to be adopted as a universal algorithm.
Comparison with GS-SVM
In this section, DE-SVM classifier is further compared with GS-SVM. GS algorithm is a kind of enumeration strategy, whose principle is to evenly split the searching space into grids and try every parameter combination at the node. The optimal parameters are obtained by comparing the classification accuracy of all possible combinations and selecting one parameter set corresponding to the highest accuracy. In this article, considering that the scope of these two parameters C and σ is very large, the GS is carried out in their linear logarithmic space. Therefore, the scope of
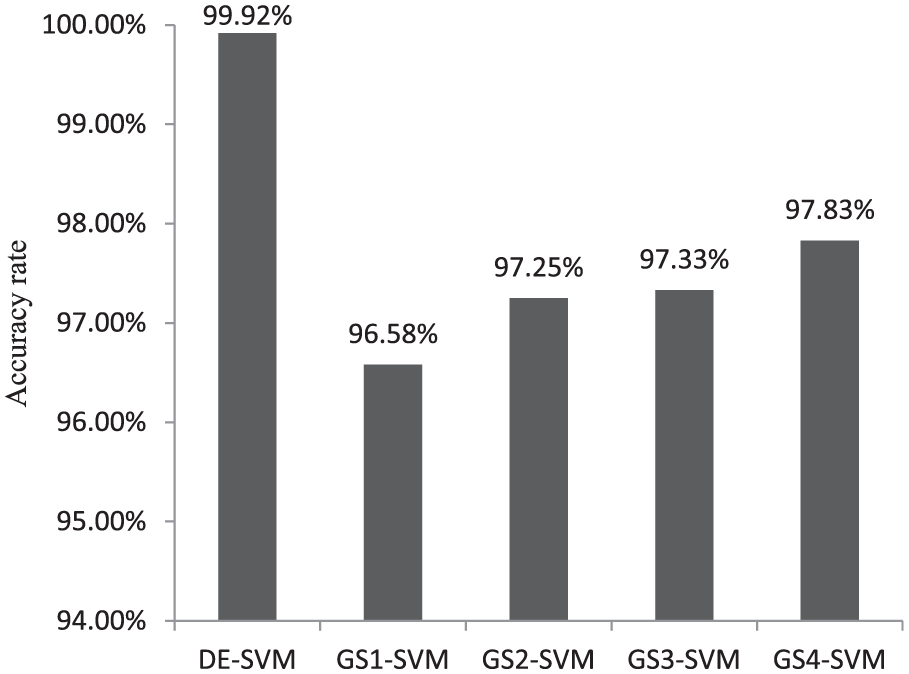
Comparison of the accuracy rate for DE-SVM and GS-SVM.
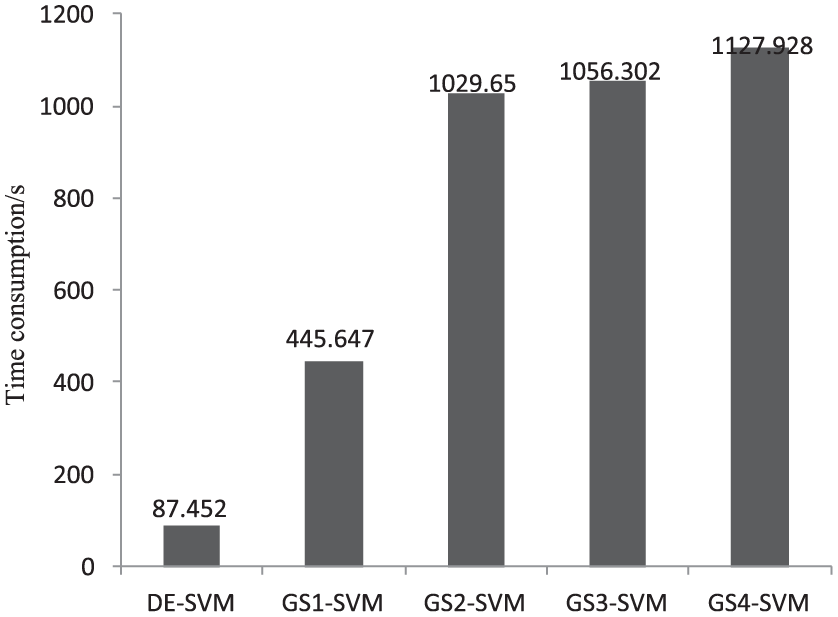
Time consumption comparison of DE-SVM and GS-SVM.
From Figure 7, it can be observed that the scope of the accuracy rates for four kinds of GS-SVM models varies from 96.58% to 97.83%. The denser grid can get higher classification accuracy. In contrast, the average accuracy rate of DE-SVM can reach 99.92%, which is a little higher than each of the GS-SVM model. In addition, it can be demonstrated from Figure 8 that the time consumption of DE-SVM is about 87.452 s. In contrast, the shortest computational time of GS-SVM is 445.647 s and the longest is 1127.928 s, which are 5 to 12 times as much as that of DE-SVM. These results show that DE-SVM performs better than GS-SVM in both classification accuracy and computational time.
Conclusion
In this article, an online TCM system–based DE-SVM is constructed. The main characteristic of this system is that the combined application of DE and SVM can meet the requirements of both accuracy and training speed. The milling experiment of Titanium alloy was carried out to verify the effectiveness of the proposed system. The cutting force signals related to different tool wear states were collected and several time domain and frequency domain features are extracted correspondingly. Based on that, ES-SVM, GS-SVM and DE-SVM models are constructed to recognize the tool wear states and make a comparison. Meanwhile, cross validation is applied to improve the robustness of classifier evaluation. The analysis and comparison results show that the accuracy rate of DE-SVM is higher than ES-SVM and GS-SVM. Moreover, the computational time of DE-SVM algorithm is far less than GS-SVM.
Footnotes
Appendix 1
Declaration of Conflicting Interests
The author(s) declared no potential conflicts of interest with respect to the research, authorship and/or publication of this article.
Funding
The author(s) disclosed receipt of the following financial support for the research, authorship, and/or publication of this article: This project is supported by National Science and Technology Major Projects of China (2014ZX04012-014), National Natural Science Foundation of China (51175371 and 51420105007) and Tianjin Science and Technology Support Program (13ZCZDGX04000 and Key Project of International Cooperation 51420105007.