
Abstract
In machining systems, the quality of the manufactured part is directly related to the condition of the tool used. Sharp tools are mostly used on the final machining pass to obtain enhanced dimensional accuracy and surface smoothness. Worn tools on the other hand are typically used for coarse machining. The operator usually makes tool assignments based on his experience, the wear levels of the tools and the type of machining task. However, this kind of operator judgment is bound to errors and may not be reliable in processes requiring high precision. Therefore, a tool condition monitoring system is highly desirable to achieve the best results in machining quality. In this study, three-axis cutting forces, torque, three-axis accelerometer and acoustic emission signals were analyzed and used for the development of an online tool condition monitoring system. Various time domain and statistical features extracted from these signals were used to train support vector machine models in a binary decision tree, which was used to predict the condition of the cutting tool. The genetic algorithm was employed for reducing the dimensionality of the feature set by selecting the features that correlates best with the tool condition. Nine experiments were carried out at different cutting conditions. Experimental results demonstrated the efficacy of the proposed scheme. The classification rates for the tool condition monitoring system before and after inclusion of the genetic algorithm step were determined as 89% and 100%, respectively.
Keywords
Introduction
With widespread use of technologies such as high-precision computer numerically controlled (CNC) machines, robots, automated tool and workpiece changers, the concept of unmanned manufacturing is now close to becoming a practical reality. Despite all the technological developments, unmanned manufacturing is not achievable in the absence of reliable tool condition monitoring (TCM) systems. 1 Tool condition is a significant parameter that directly influences the machining quality. Tool wear not only increases cutting force, tool–workpiece temperature, machine tool vibration and manufacturing cost, but also results in poor surface finish and lower dimensional accuracy. 2 This constitutes a major problem, especially for high precision and highly demanding industries such as the automotive industry, for which the number of out-of-tolerance parts is usually less than 3.4 per million. 3 The degree of tool wear is an important parameter for machining quality to comply with the Six-Sigma requirements for dimensional accuracy. 4 That is why accurate tool wear monitoring is very beneficial for a high class manufacturing company to increase in-process efficiency and product quality.
Since direct measurement of tool wear is not possible without interrupting the machining process, machine operators often decide on the tool condition based on personal experience by visual assessment of flank wear or by detecting changes in the sound emitted during operation. Human controlled machining maintenance has become the stumbling block for the progress of the new manufacturing trend, e-manufacturing. 5 For this reason, development of a reliable online TCM system is very critical in machining industry. An online TCM system is expected to indirectly identify tool wear and thus prevent any damage to the machine tool or the workpiece.
A typical TCM system consists of three components: sensors to collect process data, methods to extract features from the raw data and a decision-making mechanism. All three parts affect the reliability and the robustness of the system. Dynamometer, acoustics emission, accelerometer, motor current and temperature are the most frequently used sensors in the literature for capturing process data for TCM. 6 Several different TCM algorithms or methods were proposed in the context of sensor techniques and decision mechanisms.4–30 These methods can be categorized into two groups.
TCM systems based on tool wear classification.
TCM systems based on the prediction of the instant wear value.
This study focuses on the development of a TCM system based on tool wear classification with multi-sensor usage. Multi-sensor monitoring is a sensor fusion technique that utilizes signatures from multiple sensors and has been observed to improve prediction performance and reduce the effects of noise in tool wear monitoring.7,8
The studies in the literature use different operating parameters and sensor signals, and hence are very diverse in terms of sensor techniques and decision mechanisms. Several TCM methods have been proposed earlier, especially for a lathe with a non-rotating single tool.9–26 TCM systems designed for turning processes are not well suited for milling, since the chip formation is not continuous. 27 In milling processes, wear progression can be different 28 and sensor placement is more complicated owing to the rotation of the milling tools. 29 Numerous machine learning algorithms, such as widely used artificial neural networks (ANN), and fuzzy expert system have already been investigated7,10–12,15–29 for tool wear prediction. In addition to these schemes, support vector machines (SVMs) are also an effective method used in the decision making components of TCM systems. However, the number of studies dealing with the use of SVMs in TCM are still limited despite its popularity in the machine learning community. Among the methods proposed in the literature, it is not clear which expert system would be the best for tool wear classification and/or prediction.
The primary goal and motivation of this study is to develop a reliable TCM system that can be adopted by the industry for improving tool wear prediction and reducing the costs for milling of Inconel 718 super alloy. Machining sustainability is an important issue for difficult-to-cut valuable materials. Therefore, there is a need for developing different TCM systems for machining sustainability. The reliability and condition monitoring performance of these systems should then be evaluated and compared to determine the best one to be made available to the machining industry. In this study, an SVM-based binary decision tree was developed for TCM. Process data was collected using multiple sensors. Various time domain and statistical features were extracted from the multi-sensory data. The extracted features were then processed with the genetic algorithm (GA) for selecting the appropriate features that best correlate with the tool condition. It was shown that the performance of the proposed TCM scheme improved when the features selected by the GA were used instead of the complete feature set.
Theoretical background
SVM
SVMs have recently become one of the most widely used classification techniques in many areas involving empirical data modeling. Basically, this technique is motivated by the statistical learning theory. 31 When compared with the other classical learning procedures, it has better generalization performance and robustness. Therefore, it has been successfully applied to condition monitoring studies in recent years.30,32,33
The SVM classifies any data into two groups by finding the optimal hyperplane that separates all data points at each class. For this aim, a hyperplane with the largest margin between the two classes must be found, as illustrated in Figure 1. The points on the boundary of the slab that are closest to the separating hyperplane are referred to as support vectors.
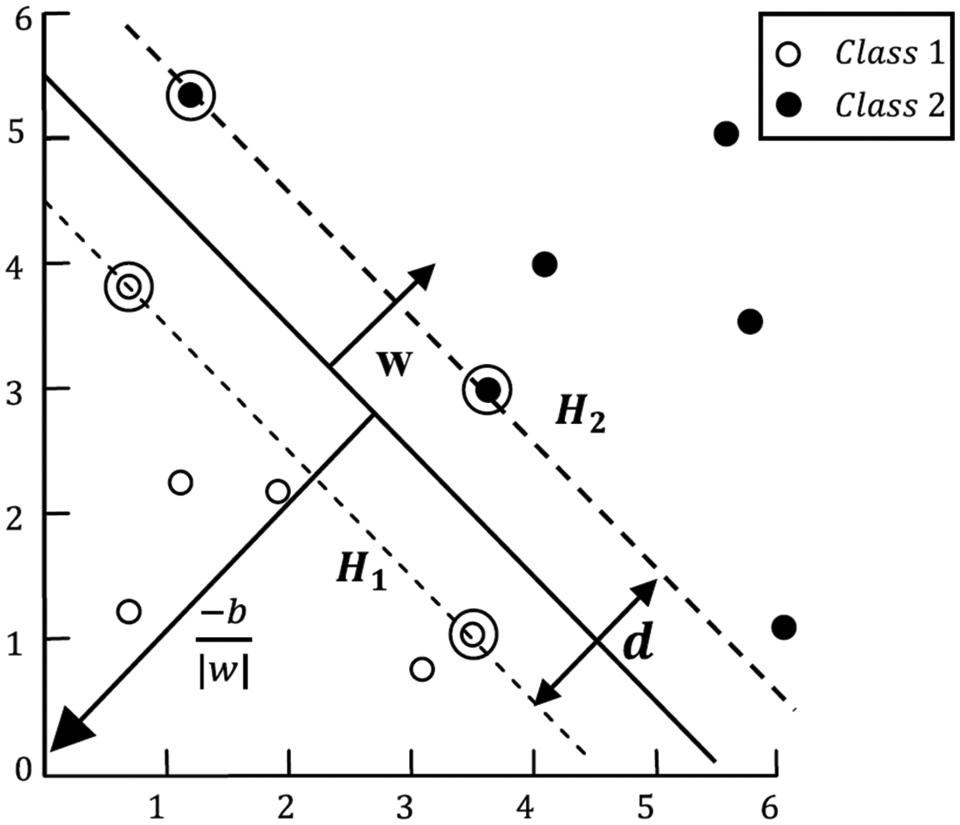
Binary classification using SVM.
Consider a training data set with vectors such that
In the case of linearly separable data, a hyperplane
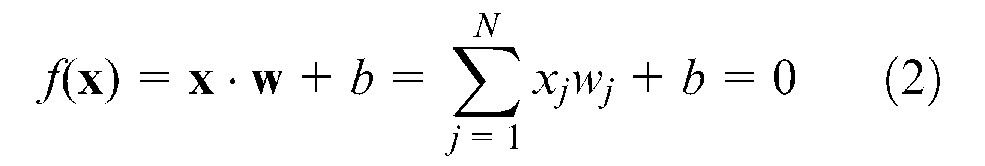
where
Referring to Figure 1, a separating hyperplane that classifies the training data set should satisfy the following constraints


These equations can be combined into one equation

Based on this formulation, the two planes, H1 and H2, where the support vectors lie can be described as


The Euclidian distance, d, between the two hyperplanes is known as the SVMs margin and is equal to
On the other hand, the classes are not commonly fully linearly separable. Therefore, it is necessary to allow some misclassified points that do not satisfy the constraints defined before. For this, a positive slack variable e i (i = 1, …, N) is introduced to the inequality constraints that indicates the amount of violation of the constraints. The constraint then becomes

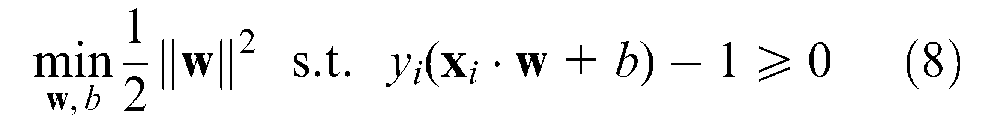
This constraint can always be satisfied if e i is chosen to be very large. Thus, a penalty term must be added to the objective function as
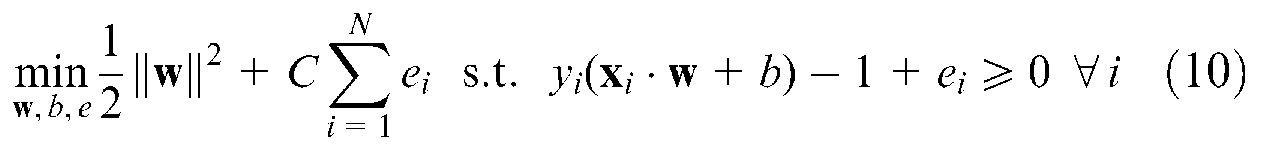
where C is the parameter used for adjusting the penalty factor for the misclassified data. The first part of the objective function is used for maximizing the margin. The lower the C value is, the more inappropriate the support vectors are that may be derived. In contrast, the larger the C value is, the lower the generalization ability of the SVM, which leads to overfitting of the training data. This optimization problem can be solved using a Lagrange function, which is given as
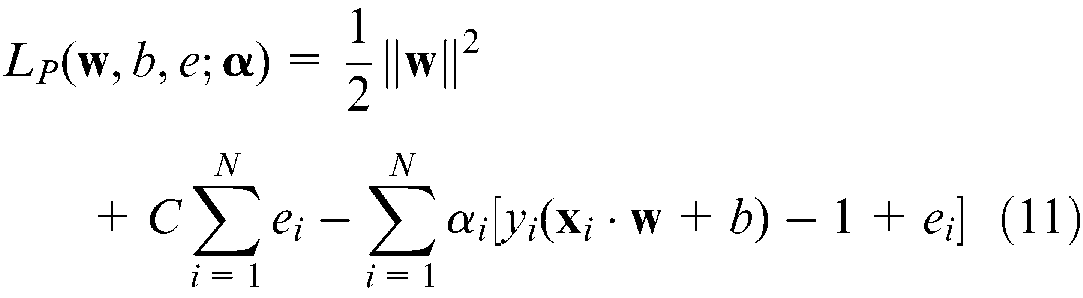
where


If the values found in the partial differential equations using Kuhn–Tucker conditions are substituted in the Lagrangian function, then a new formulation, the dual form of the original formulation, can be obtained that depends on
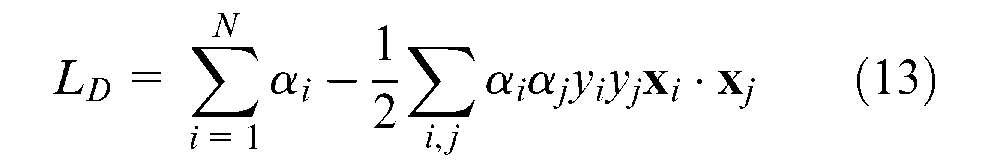
If the dot product of the input vectors,

then, the optimization problem can be stated as a convex quadratic optimization problem given by
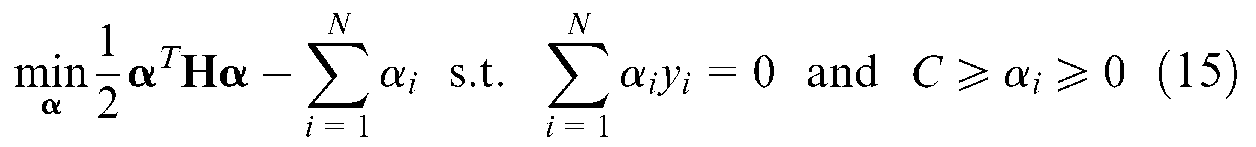
However, TCM applications are very complex and linear boundary functions may not be adequate to separate the two classes properly. For these cases, it is necessary to construct a hyperplane that permits linear separation in the higher dimension. To avoid the computational cost of transformation into higher-dimensional feature space, many kernel functions can be used, such as linear, polynomial, sigmoid and radial basis functions.
34
Since an SVM-based multi-stage classification algorithm was developed in this study, a linear kernel was used by constructing a matrix

where k(
GAs
The GA is a topic of evolutionary computing and was introduced to the literature by Holland in the 1970s. 35 The GA is a powerful and widely applicable heuristic search and optimization method that mimics Darwinian natural selection and evolution. It can be applied to problems that cannot be formulated in exact and accurate mathematical forms. Unlike conventional approaches that search a single region of the search space, the GA explores all regions of the search space through three operations: selection, crossover and mutation. Consequently, the GA is more likely to find the global minimum or maximum point in complex search spaces.36,37
A typical flowchart of the GA is depicted in Figure 2. A single iteration of the cycle of the algorithm is referred to as a generation. The evolutionary process starts with the first generation, individuals of which are, in general, randomly selected. Individuals are representations of candidate solutions and consist of gene sequences that are typically bit-strings. The number of genes in the sequence is determined based on how the solutions are encoded as individuals. In this study, the GA was used to select the optimal feature set that maximizes the classification performance of SVM models used in the proposed decision tree. The number of genes per individual was set to the number of features used in the study. Each individual depicts a separate feature set, such that a value of one for a gene means that the corresponding feature should be included in the feature set. Fitness scores are assigned to individuals based on their gene sequences and a pre-defined objective or fitness function. The fitness function indicates an individual’s performance in the problem domain and constructs the basis for selecting the two individuals that will be placed in the mating pool. In each generation, the GA picks the best two individuals as parents based on their fitness scores. Through crossover and mutation operations performed on parents, as illustrated in Figure 3, the GA produces new individuals or children for the new generation. Crossover, also referred to as recombination, allows gene exchange between pairs of individuals. It is a critical operator that allows new solution regions to be explored in the search space. Mutation alters one or more gene values in an individual from its initial state. It introduces random changes into the population and avoids premature convergence. The children created through crossover and mutations replace the old population or generation. This evolutionary cycle continues for many generations creating more fit individuals or better solutions in each cycle until a termination condition is satisfied. 37 The GAs are explored in more detail in Mitchell. 38
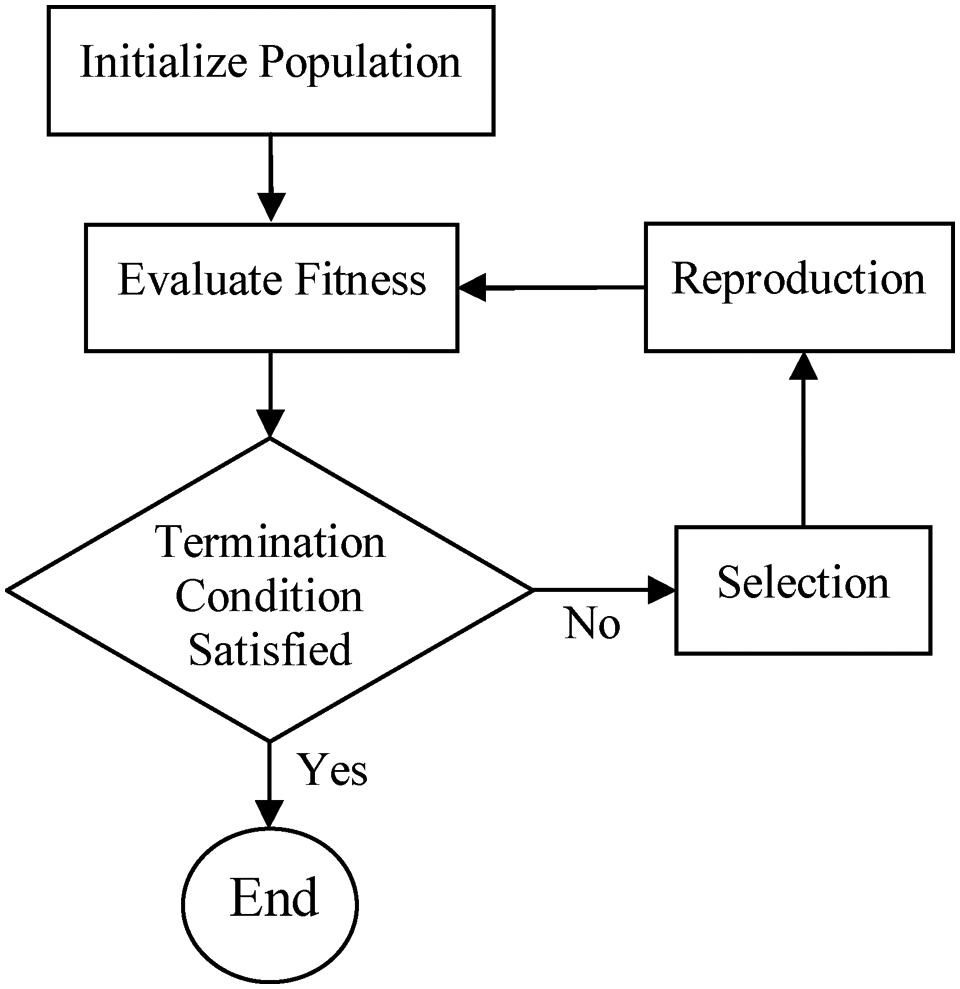
The evolutionary cycle in a GA.
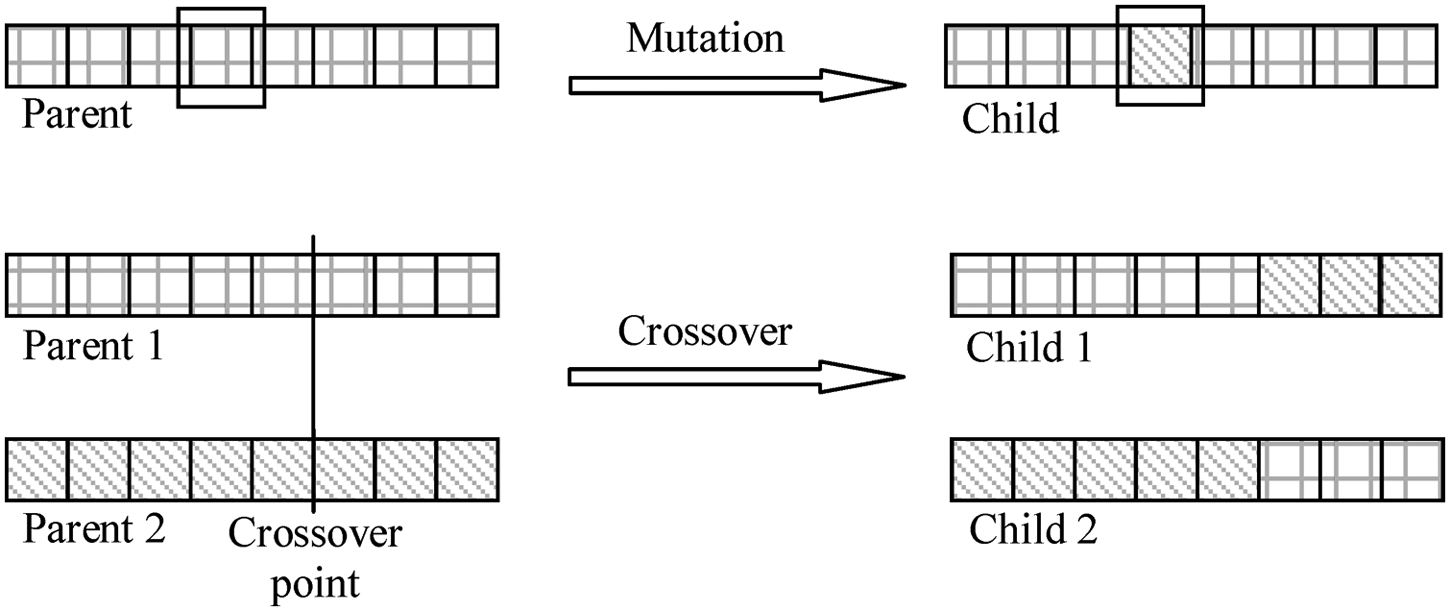
Crossover and mutation operators.
Experimental set-up
Design of experiments based on Taguchi
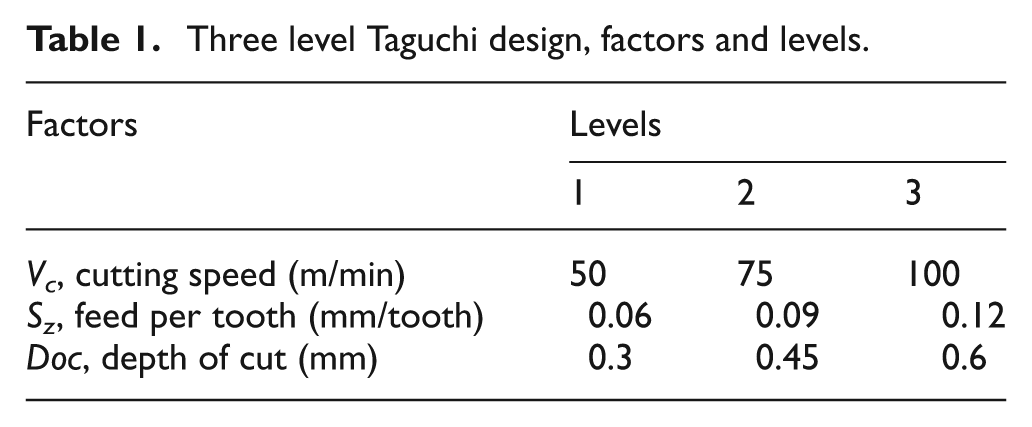
Three kind of parameters, namely cutting speed (V c ), feed per tooth (S z ) and depth of cut (Doc), in three levels, were selected for the experiment. Instead of a full factorial experiment, which requires 27 separate experiments, nine set of experiments designed by Taguchi’s orthogonal array method were conducted. Taguchi’s orthogonal array L9 (33) was applied to characterize the entire experimental range. Only the depth of cut factor in the z-direction of the tool holder was used to control the material removal rate. However, the radial depth of cut factor in shoulder milling experiments was kept at a constant value of 1 mm overlaps during the experiments. The ranges for the three machining parameter are shown in Table 1. The manufacturer of the cutting tools generally provides recommendations for the cutting speed and feed rate based on the hardness of the material to be used. The cutting parameters were selected such that they fall within the minimum and maximum values provided by the manufacturer. In addition, the values were determined based on preliminary experiments and recommendations of an experienced operator.
Three level Taguchi design, factors and levels.
Work material and cutting tool
Experiments were carried out by machining Inconel 718, which is a “difficult-to-cut material”. Since there is a high rate of tool wear for the machining of Inconel 718, many studies25–30 were conducted on the optimization of machining parameters for extended tool life. In this work, a systematic procedure was followed in the milling of Inconel 718 using a particular combination of cutting parameters. Pre-machined blocks of size 70 × 62 × 70 mm were utilized in the experiments. The milling was carried out by a CoroMill 390 shoulder milling cutter (R390-016A16-11L) holding sandvik inserts (R390-11 T3 08M-PL 1030).
Milling experiments and measuring instruments
The milling experiments were carried out on a five-axis rotary table type Deckel-Maho DMU 60P CNC machining center. The tool path was generated by ProEngineer WildfirePLM software with down milling strategy and was the same for all experiments. The tool path selected for face milling of the rectangular workpiece was in the form of continuous rounds to keep the milling cutter in full contact. This avoids the necessity for cutting edges with multiple entries and exits in the parallel passes.
The dynamic and quasi-static measurements of the three force components (F x , F y , F z ), together with the drive moment M z , were performed by a rotating cutting force dynamometer (Kistler Corporation, Model 9123C1111).
The rotating cutting force type dynamometer (RCD) was installed on the spindle of the CNC machining center using an integrated spindle adapter. The cutting forces and the torque signals were acquired from the tool without considering orientation. The cutting tool holder was installed with a single insert on the RCD. As the RCD has a zero point identification groove, the cutting edge of the insert was aligned with the y-axis of the RCD. The output of the dynamometer was amplified using a stator side charge amplifier (Kistler 5223B). The cutting tool, the RCD and the workpiece used during the experiments are illustrated in Figure 4.
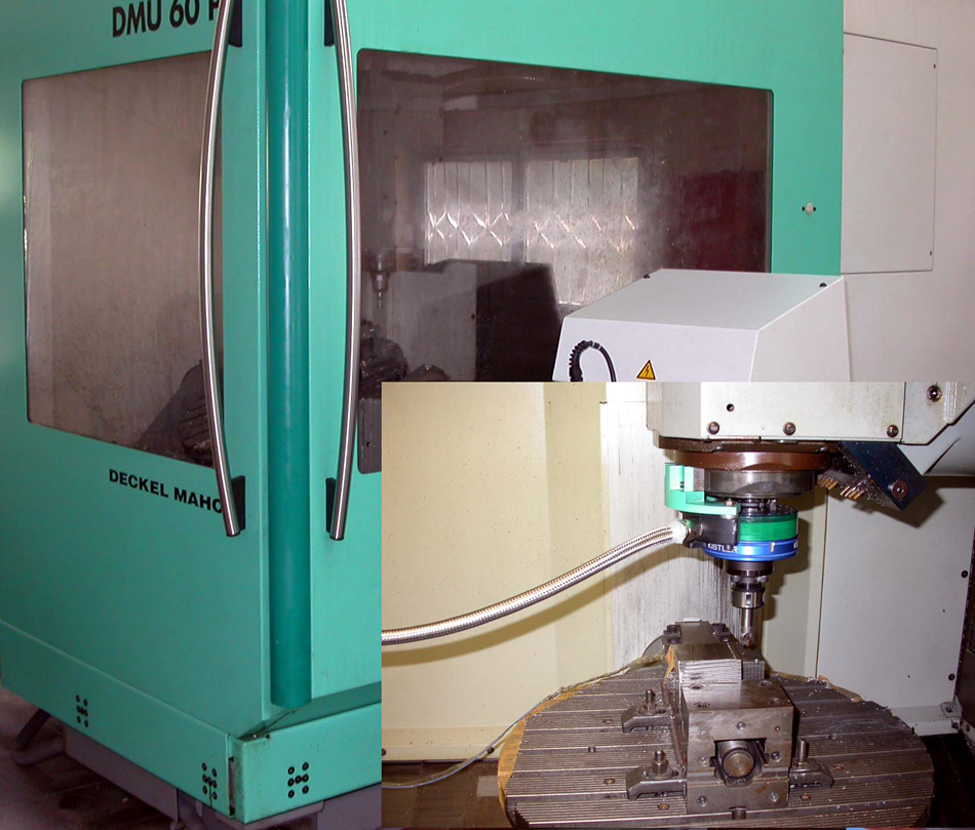
Experimental set-up and the CNC machining center.
A tri-axial accelerometer (model 356A31-EK-C) manufactured by PCB Piezotronics, Inc. was mounted on the workpiece side to measure vibration signals during machining. High-frequency acoustic emission signals were also recorded using a high-efficiency acoustic emission (AE) sensor (Kistler 8152B2) mounted on the workpiece. Signals collected by the AE sensor were conditioned on a dedicated signal conditioner (Kistler 5125B1) prior to data acquisition.
For each tool wear data on the flank face of the tool, three axis cutting forces (Fx, Fy, Fz), z-axis torque (Mz), three-axis acceleration (Vx, Vy, Vz) data and AE signals were collected. Flank wear (VB) measurements were conducted and recorded regularly with recording frequency depending on the experimental conditions.
The multi-sensory data was acquired through National Instruments NI-6229 data acquisition hardware controlled via MATLAB at a sampling frequency of 15 kHz. The machining process was interrupted at approximately equally spaced time intervals during each experiment for flank wear measurements. The interrupt frequency for a given experimental condition was determined depending on the wear progress rate observed during the machining process. The flank wear measurements were performed using a Nikon Eclipse L150 microscope at 50× zoom and ImageJ program 39 complying with ISO 8688-2. Although flank wear was the dominant failure mode, crater wear, chipped cutting edge and notching were also detected, but they were negligible compared with flank wear. Figure 5 depicts an example flank wear measurement performed on an insert mounted on a CoroMill 390 shoulder milling cutter. Tool wear measurements for each experiment were conducted until the flank wear exceeded 0.5 mm. A total of 163 measurements were made in nine different experiments and the corresponding sensor data was saved for further processing.
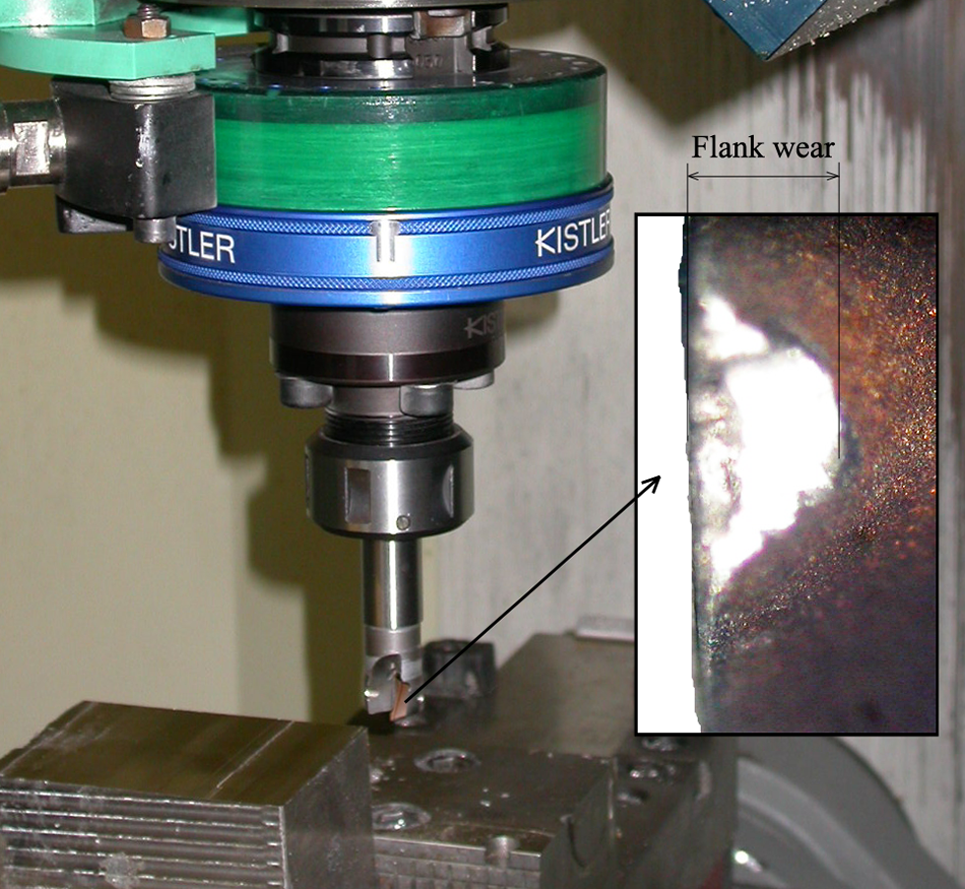
A sample flank wear measurement on an insert mounted on CoroMill 390.
Methods
Feature extraction
Feature extraction is a transformation process performed on a large data set in such a way that the sensor signal is decomposed into a dimensionally reduced set of representative features. Therefore, it is expected that the feature set will contain significant information from the input signal in order to perform a desired task. The cutting force (three axes), torque (z-axis), accelerometer (three axes) and AE signals acquired after each interrupting cut were processed with various most common statistical feature extraction methods. After the feature extraction, the most critical step is the process of selecting the appropriate features that correlate with the tool status. Only the time domain and statistical features were extracted rather than the frequency domain ones because of their reliability 40 and lower computational cost. In this study, each sensor signal was processed to extract 18 time-domain and statistical features: minimum (min), maximum (max), standard deviation (std), median, root mean square (rms), kurtosis, mean, skewness, and the ten coefficients of the tenth-order linear predictive model. At the end of the feature extraction process, 144 features (18 × 8) were extracted from eight different signals acquired from multiple sensors. Thus, a feature matrix of size 163 × 144 was obtained from the acquired signals for developing an SVM-based TCM system.
SVM-based binary decision tree for TCM
Initially, a k-means clustering algorithm was used to pre-classify the data into four clusters based on flank wear measurements. Based on the results, wear levels were coded with sharp (S), workable (W), close to dull (CD) and dull (D), as given in Table 2. Out of 163 tool wear measurements, 69, 30, 42 and 22 were classified as S, W, CD and D, respectively. The flank wear levels (in µm), as determined by the k-means clustering method, were [24, 133], [144, 268], [282, 416] and [484, 548] for the sharp, workable, close to dull and dull conditions, respectively.
Wear codes and meanings for SVM classification.
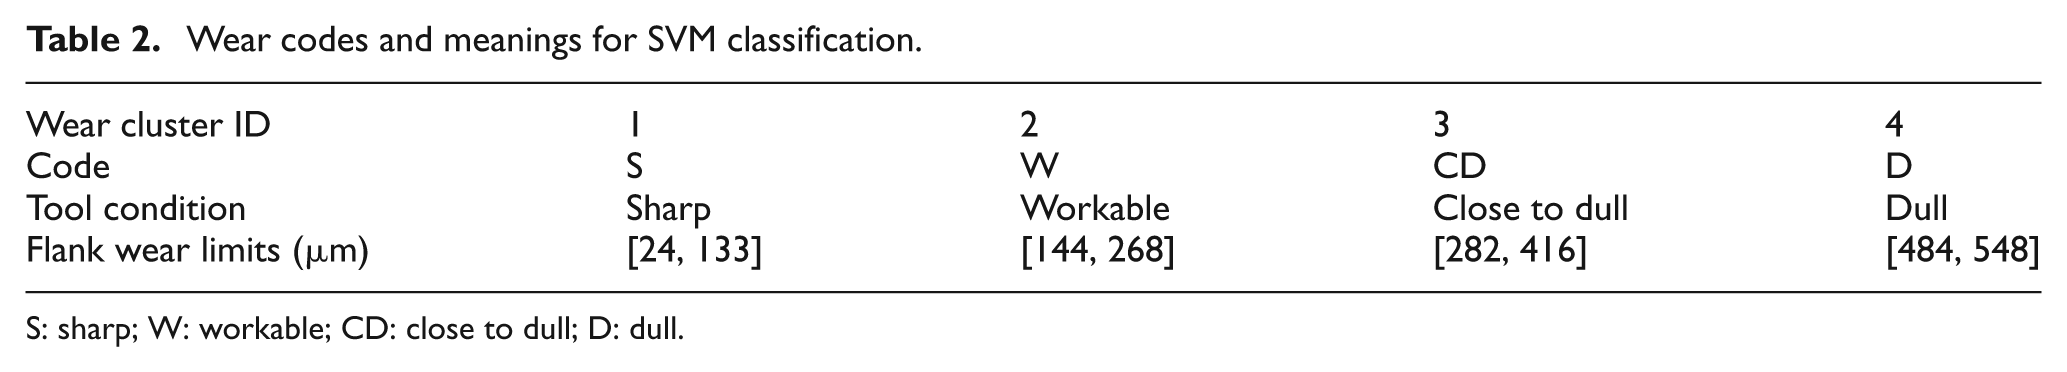
S: sharp; W: workable; CD: close to dull; D: dull.
A multi-stage decision-making algorithm was realized in this study, instead of a single-step SVM classification scheme for enhanced classification performance. The proposed TCM system, as illustrated in Figure 6, consists of three decision stages. In each of these three stages, a decision is made regarding if the tool is in the corresponding state or not. The conditions that correspond to the three stages are sharp, workable and close to dull. In the first decision stage of the algorithm, it is decided whether the tool is sharp or not. If it is decided that the tool is not sharp, the algorithm goes into the second decision stage in which it decides whether the tool is workable or not. Similarly, if the tool is decided not to be workable in this stage, then the algorithm goes into the last decision stage in which it decides on whether the tool is close to dull or dull.
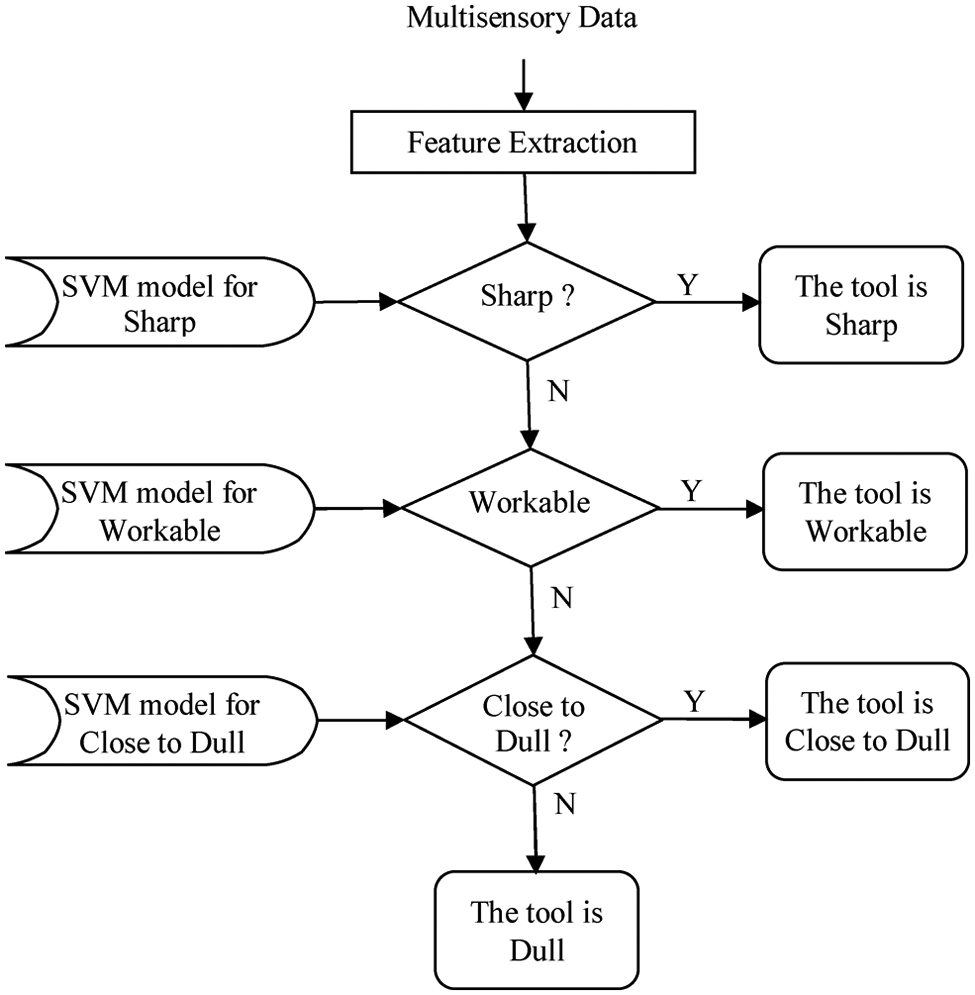
SVM-based binary decision tree for TCM.
SVM-based binary classifiers were used in the decision steps of the proposed TCM system. Each decision step separates one tool condition from all the remaining ones. There are a total of three binary classifiers used in the decision tree, which assigns the tool to one of the four possible conditions: sharp, workable, close to dull or dull. Each decision stage clears one condition only. In the first decision stage of the TCM system, an SVM model was trained to detect tools that are sharp. For training this model, the data was separated into two classes: sharp versus others. In the second decision stage of the TCM system, an SVM model was trained to detect tools that are workable. For training this model, the data was separated into two classes: workable versus others. Similarly in the last decision stage of the TCM system, an SVM model was trained to detect tools that are close to dull. For training this model, the data was separated into two classes: close to dull versus others. Half of the data was used in the training phase of all three SVM models.
The GA for feature selection
Usually a very large size data set is acquired in the development phase of a multi-sensory TCM system. However, besides meaningful information for TCM, these signals also include useless, irrelevant and noisy features that need to be removed. 30 The key to successfully applying an SVM is to identify input features that have a linear or non-linear relationship with the output. Therefore, the weights of the each feature have to be clearly addressed to increase the performance of SVM.
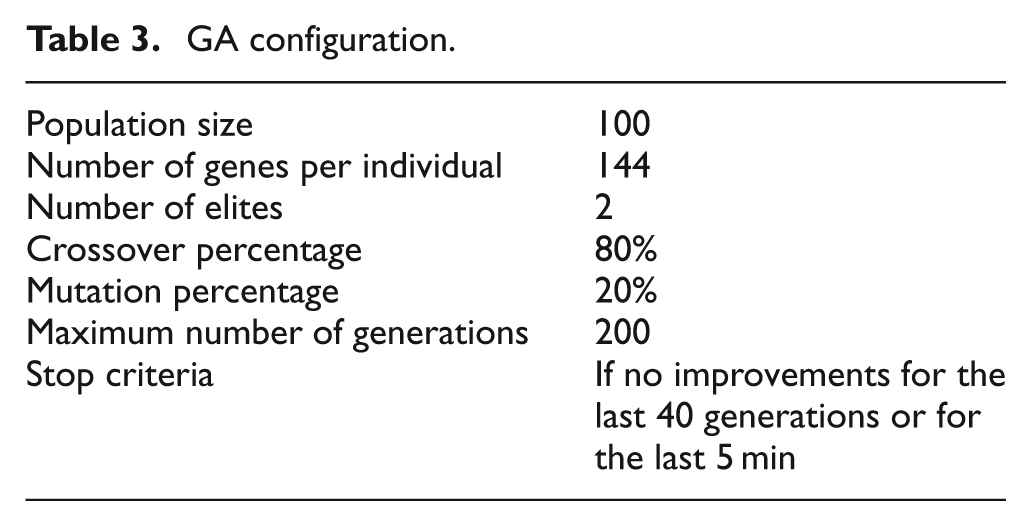
A robust optimization method is needed for maximizing the classification accuracies of the SVM models used in the decision stages of the proposed TCM algorithm. The GA was employed to identify the most suitable input features independently for all three SVM models. After testing with various GA configurations, the parameters of the GA were set as given in Table 3. The best population size depends on the size of the encoded string, which in this case is the number of features. Increasing the population size allows for the exploration of the solution from more search regions. However, this considerably slows down the algorithm. A population size of 100 individuals was chosen starting with a randomly generated first generation. Since the total number of features was 144, solutions were encoded by individuals having 144 genes. The gene sequence for an individual is a bit string and encodes a separate feature subset. As mentioned previously, a value of 1 in the sequence indicates that the feature subset contains the corresponding feature. The objective function of the GA set to minimize was
GA configuration.

where k1, k2 and k3 are the weights, N f is the number of features to be used (the number of genes having a value of 1), ec1 and ec2 are the misclassification rates of the binary SVM classifier in percentages for the two classes. As either k1 or k2 is increased, the penalty for misclassifying an input vector that belongs to the corresponding class would increase as well. Consequently, the GA would give more effort to minimizing the misclassification rate for that class as compared with the other one. Similarly, as k3 is increased, the penalty for adding one extra feature to the feature set increases as well. Thus, the GA would give more effort to minimizing the number of features as w3 is increased. In this study, by trial and error k1, k2 and k3 were set to 1, 1 and 0.1, respectively.
Two individuals with the highest scores, named as elites, in each generation were guaranteed to survive to the next generation. The genes of elites were not modified in any way. The children of the new generation were created through the genetic operators: crossover and mutation. Crossover and mutation rates were set to 80% and 20%, respectively. The evolutionary cycle was allowed to continue for 200 generations or until the termination condition given in Table 3 was satisfied.
Results and discussion
Results using the complete feature set
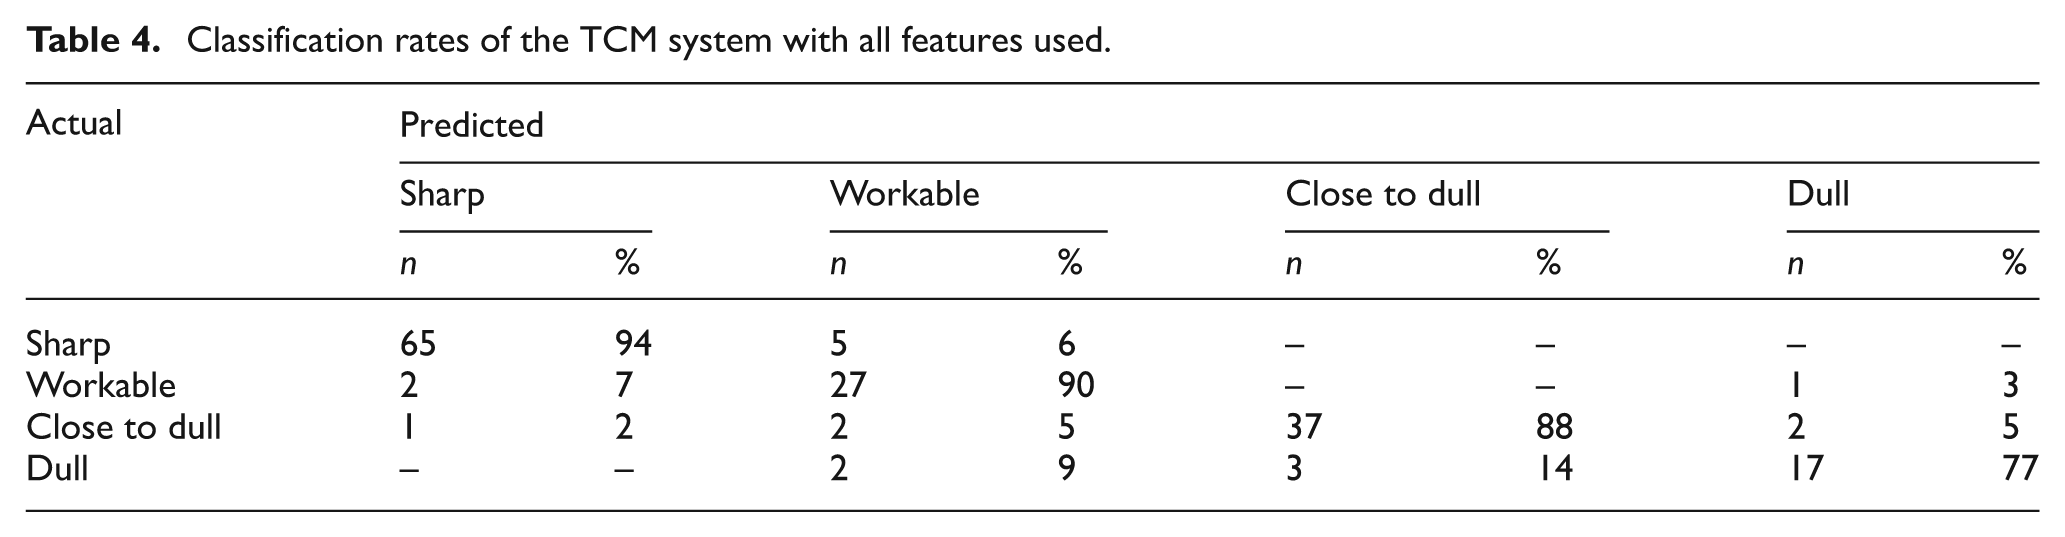
As mentioned in the preceding sections, nine different experiments were conducted under various cutting conditions. SVM classifiers used in the decision steps of the binary tree were trained using 50% (82 out of 163) of the available data. The remaining 50%, along with the test data, were used to test the performance of the proposed TCM scheme. SVM models in the decision stages of the binary tree were initially trained and tested using all the features extracted from signals acquired from all sensors. The classification performance of the TCM system is presented in Table 4. The classification rates for the sharp, workable, close to dull and dull tool condition were 94%, 90%, 88% and 77%, respectively. In 5 out of 69 cases (6%) the tool that was sharp was misclassified as a workable tool. Workable tools were misclassified as sharp in 2 out of 30 cases (7%) and as dull in 1 out of 30 cases (3%). Close to dull tools were misclassified as sharp, workable or dull in 2%, 5% and 5% of the cases, respectively. Dull tools were misclassified as workable or close to dull in 9% and 14% of the cases, respectively. As the results reveal, the proposed SVM-based TCM scheme predicted the tool condition with a reasonable accuracy except for the dull case.
Classification rates of the TCM system with all features used.
Results after the selection of the optimal feature set using the GA
Proper setting of the parameters is critical in successfully applying GAs to real optimization problems as in this case. Each parameter has a separate function and affects the way the search space is explored. Crossover is an essential operator that allows new solution regions to be explored in the search space. The higher the crossover percentage, the more regions that are explored in the search space. However, if it is used alone without mutation, the algorithm will converge to the best solution within the regions investigated. This solution is not necessarily the global optimum, since it is almost impossible to search through the entire space simultaneously. Mutation adds randomness to the search allowing new regions to be investigated and prevents premature convergence. If the mutation rate is set too high, the search will be similar to a random walk through the search space. By testing with different settings, the crossover and mutation rates were determined as 80% and 20%, respectively. The summary of the GA parameters and their settings are provided in Table 3.
As pointed in the preceding section, the evolutionary cycle was allowed to continue for 200 generations or until a termination criterion is achieved. An illustrative example of how candidate solutions evolve in time during the selection of the optimal features for the close to dull case SVM model is depicted in Figure 7. The figure illustrates: (a) the fitness scores of the fittest individual (bottom bars); (b) the fitness scores of the worst individual (top bars); and (c) the population’s mean fitness score (line plot in the middle) as a function of the evolutionary cycle. As the fittest individuals pass on their genes to the next generation, new generations consist of more fit individuals, thus increasing the mean fitness score of the population. In other words, the GA finds better solutions in each cycle by modifying the best candidate solutions from the previous step. At the end of the 89th generation, the algorithm converged to a solution, finding the best input feature subset for the close to dull SVM model.
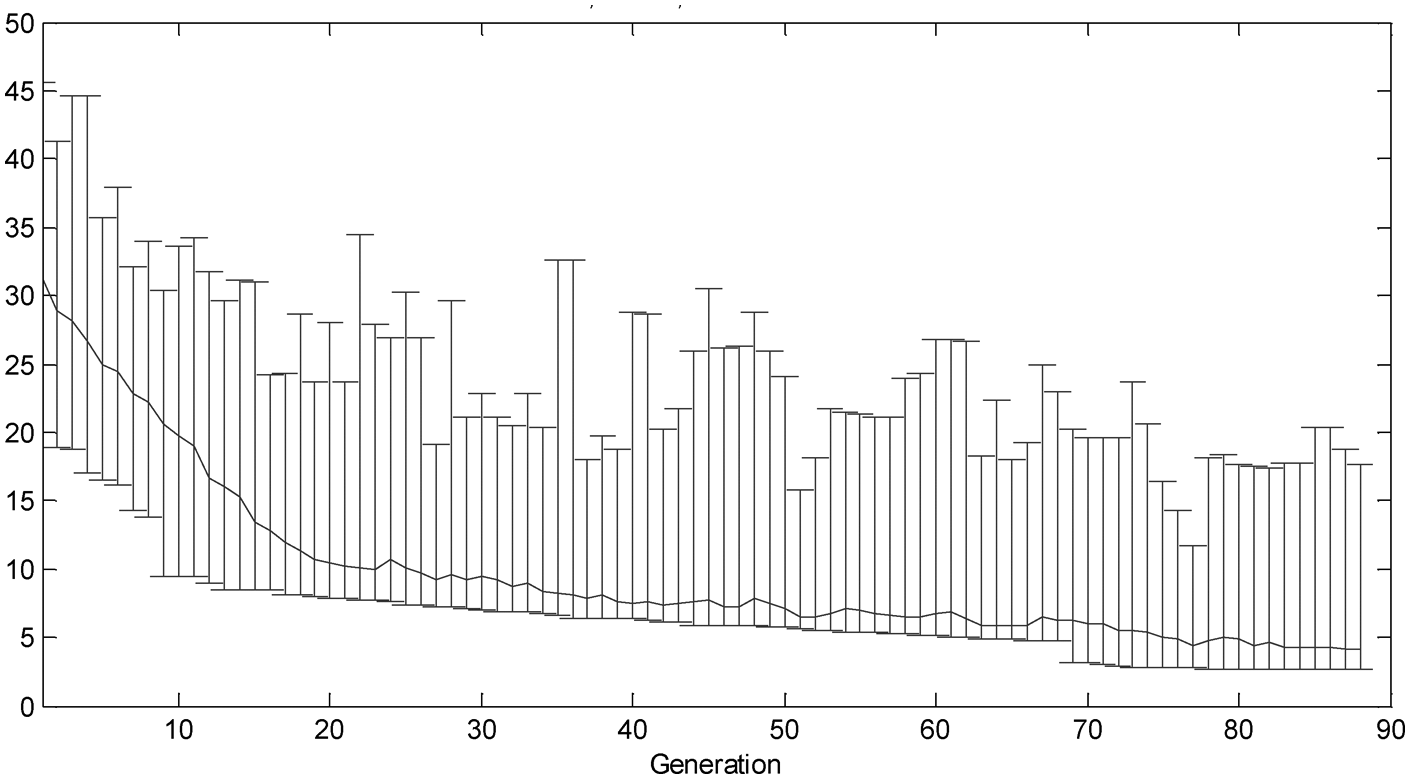
Best, worst and the mean fitness scores for the close to dull case SVM model.
The number of features in the optimal feature subset found by the GA for the three SVM models is shown in Table 5. The available 144 features were reduced to 24, 16 and 27 for the sharp, workable and close to dull SVM classifiers, respectively. When optimized feature sets were used in SVM classifiers in the decision stages of the binary tree, the correct classification percentage of the proposed TCM system increased to 100% for all tool conditions, as illustrated in Table 6. Therefore, the GA did not only help to reduce the number of features dramatically, but it also increased the performance of the TCM system noticeably. This is mainly because the GA selected the features that correlate to the corresponding tool condition in each decision stage, while eliminating the useless and noisy features. The main advantage of using a multi-staged decision-making algorithm instead of a single SVM classifier is that the SVM model in each stage can be optimized to distinguish the corresponding condition from the others. Thus, an optimal feature set can be found independently for all three SVMs, which was aimed and successfully implemented in this study.
Number of features used in SVM models before and after the GA.
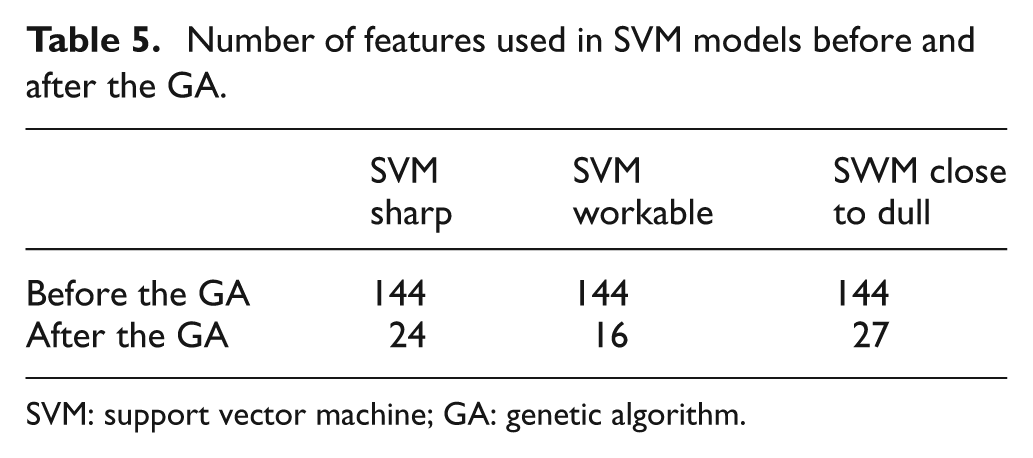
SVM: support vector machine; GA: genetic algorithm.
Classification rates of the TCM system with the GA selected features.
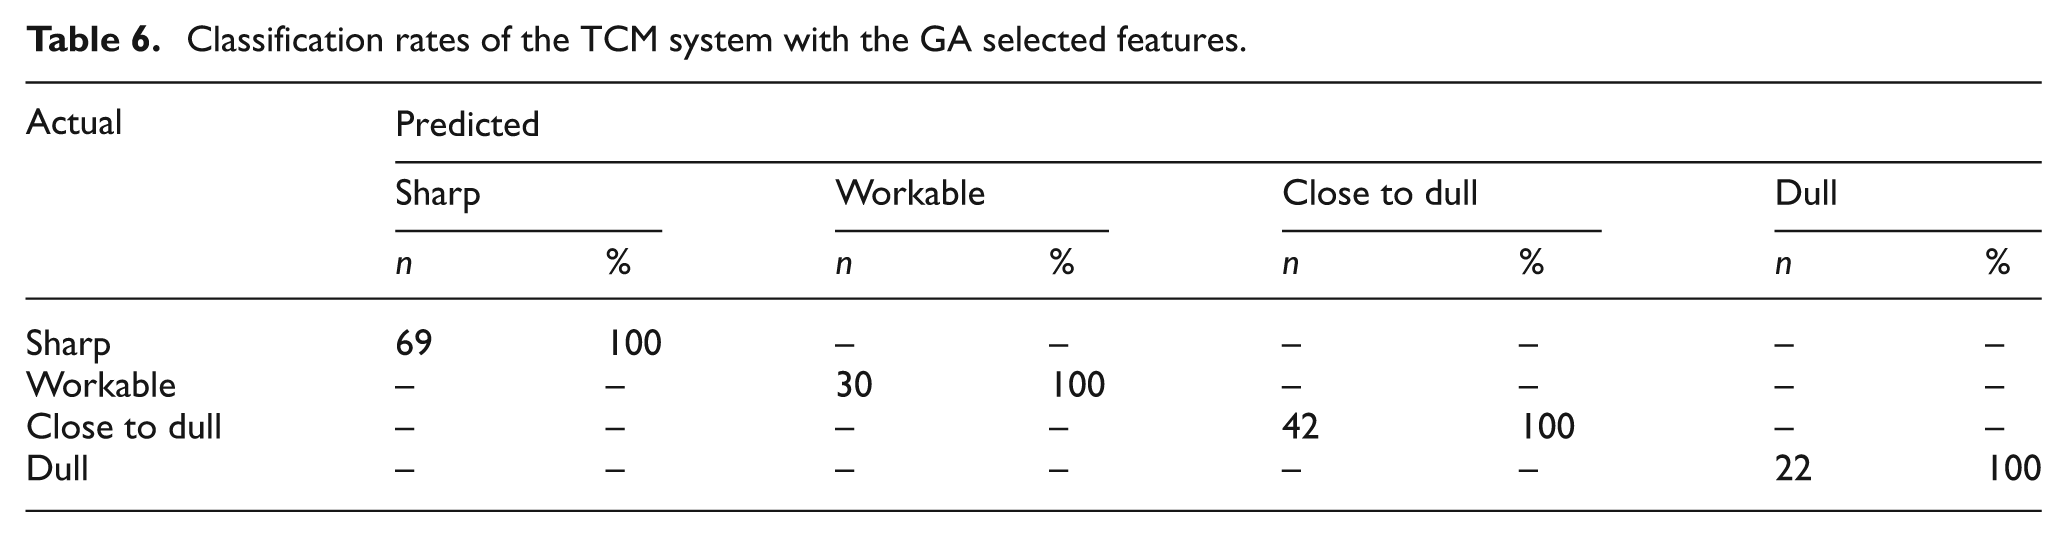
Table 7 presents the results of the GA-based optimal feature selection step. As pointed out earlier, a total of 144 features were extracted from 8 different signals, namely three-axis cutting forces (Fx, Fy, Fz), torque (Mz), three-axis accelerometer (Vx, Vy, Vz) data and AE signals. Among these features, the GA selected those that are relevant to the tool condition of interest for the three SVM models used in the binary decision tree. Based on the results presented in the table, the features selected for identifying workable and close to dull tools are mostly vibration based. On the other hand, vibration and force-based features contribute equally to the optimal feature set used to distinguish a sharp tool from the others. Features extracted from the AE signals also play an important role in detecting a sharp tool. According to the results, features extracted from the F z signal were not useful in detecting any of the four tool conditions. Overall, vibration-based features provide meaningful and useful information to predict tool condition. Force-based features, excluding the z-axis measurements, are especially useful in identifying sharp tools. AE-based features also provide useful information for detecting sharp tools. However, overall contribution of these features to the optimal feature set is less than the vibration and force-based features.
The GA selected features used in SVM models.
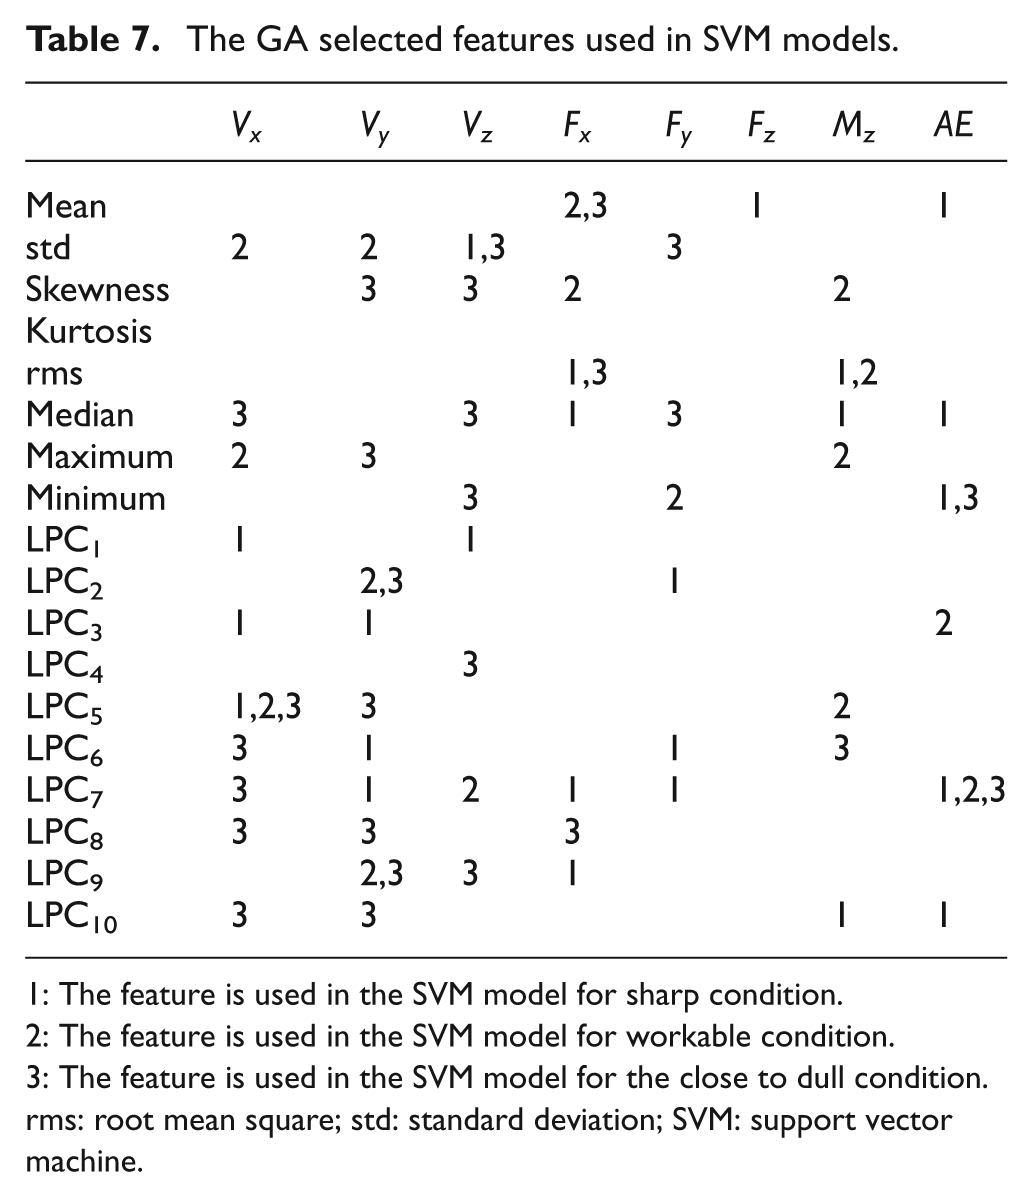
1: The feature is used in the SVM model for sharp condition.
2: The feature is used in the SVM model for workable condition.
3: The feature is used in the SVM model for the close to dull condition.
rms: root mean square; std: standard deviation; SVM: support vector machine.
Machining sustainability is an important issue for difficult-to-cut valuable materials like Inconel 718, which was the target material for this study. The specific reason for selecting Inconel 718 was to show that the proposed TCM system might assist machining sustainability even for difficult-to-cut materials. On the other hand, the target material does not necessarily have to be Inconel 718. In fact, the proposed tool wear classification scheme can be adapted to be used with any target material provided that the same procedure is followed as illustrated. For such an adaptation, initially, a number of experiments should be carried out with the target material performing regular tool wear measurements throughout the experiments. This data can then be used to train the models employed in the decision stages of the binary tree. Eventually, the decision tree can be utilized to classify tool wear.
Conclusions
This work presents a new TCM system based on an SVM and GA. The proposed scheme consists of a binary decision tree that includes three decision stages. In each decision stage, presence of a specific tool condition is decided. A sensor fusion approach was employed in this study such that the features used in training the SVM models in the decision stages were extracted from multi-sensory data. The GA was utilized to select the features that give the most useful information and eliminate the irrelevant ones. The feature selection results suggest that vibration-based features provide meaningful and useful information to predict tool condition. Furthermore, force-based features, being also effective, are especially useful in identifying sharp tools. Overall, the results reveal that the proposed scheme is a very effective TCM system.
Footnotes
Funding
This research received financial support from the Turkish State Planning Organization (DPT) under the Grant No. DPT-2003K120790.