
Abstract
Indirect tool condition monitoring in end milling is inevitable to produce high-quality finished products due to the complexity of end-milling process. Among the various indirect tool condition monitoring techniques, monitoring based on image processing by analyzing the surface images of final product is gaining high importance due to its non-tactile and flexible nature. The advances in computing facilities, texture analysis techniques and learning machines make these techniques feasible for progressive tool flank wear monitoring. In this article, captured end-milled surface images are analyzed using gray level co-occurrence matrix–based and discrete wavelet transform–based texture analyses to extract features which have a good correlation with progressive tool flank wear. Contrast and second diagonal moment are extracted from gray level co-occurrence matrix and root mean square and energy are extracted from discrete wavelet decomposition of end-milled surface images as features. Finally, these four features are utilized to build support vector machine–based regression models for predicting progressive tool flank wear with 94.8% average correlation between predicted and measured tool flank wear values.
Keywords
Introduction
Condition monitoring of cutting tool in any conventional machining is inevitable to maintain product quality and economy of machining by reducing machine tool downtime. To accomplish this, direct and indirect monitoring of cutting tool are utilized in industries by direct visual measurement of cutting tool wear and by measuring degree of tool wear utilizing machining process signals, respectively. Inaccessibility of flank face region of cutting tool is an obstacle to measure the tool flank wear online using direct tool condition monitoring (TCM). To avoid this problem, online capturing of process signals (namely, force, acoustic emission (AE), power, current and vibration) has been utilized to monitor degree of tool wear. 1 Turning process involves a continuous contact between tool and workpiece, which results in non-periodic process signals for all the variables discussed above. A relatively easy computation with high accuracy of these types of signals can be obtained due to the less complexity in process mechanics. On the other hand, in milling, multi-point cutting tool is involved for material removal, which results in a periodic tool–workpiece contact. Due to the nature of this complex process mechanics, a periodic process signal is obtained, which results in an unpredictable and pre-mature tool wear in milling operation.2,3 To overcome this situation, accurate TCM is inevitable to produce high-quality products, as end-milling operation is generally used for finishing purpose. 4 Using cutting force signals in TCM of milling, high peaks can be observed during entry and exit of the cutter. 5 These peaks, sometimes, give a false alarm for breakage of tooth; however, breakage has not occurred in actual case. Also the bandwidth of piezoelectric force sensor, which are generally used in dynamometer, is limited (due to their placement) to obtain high-frequency information. 6 To overcome these limitations, AE sensors are used in milling applications. 7 However, the precision of the signal data acquired from AE sensors is sensitive to the location of the sensor. 8 Accelerometers are sometimes used to monitor vibration signals as the vibration in machine tools are very critical to the milling process,9,10 but this sensor should be situated very near to the cutting location which may cause the obstacles to machining. Moreover, all these three sensors should be located in contact with the machine tool. 11 Current and power sensors are used as well for the TCM purpose. But these sensors require very complicated calibration to get an accurate result. 4 The surface roughness can also be measured in end milling to monitor the tool condition. But the measurement of surface roughness using contact-type stylus can cause the damage to the stylus tip for very hard material or can cause the damage to the finished surface itself for soft materials. Also obtaining two-dimensional (2D) surface finish information using contact-type surface profiler is a slow process. However, due to the advent of metrological facilities, end-milled surface can also be evaluated using non-contact-type three-dimensional (3D) surface profilers which are quite costlier. To overcome these problems of progressive TCM in end milling, there is a need to develop a non-tactile, low-cost and high-speed evaluation technique which should be able to monitor the tool flank wear by analyzing end-milled surface images. This can be realized using machine vision technique due to the advancement of computing hardware, image sensor, image processing algorithms and learning techniques. 12 Some works in the field of application of image processing in TCM or machined surface analysis are mentioned briefly as follows.
Dutta et al. 13 reviewed the use of image texture analyses on machined surface images to predict surface roughness or tool flank wear. They found that the information of surface finish degradation with an increase in abrasive tool wear (or tool flank wear) was utilized to monitor the tool condition from machined surface images. They pointed out that various texture analysis techniques, namely, first-order statistical texture analysis (image histogram based), gray level co-occurrence matrix (GLCM)-based analysis, geometric texture analysis using Hough transform method, fractal analysis and frequency domain–based texture analysis using discrete Fourier transform, were utilized mainly for characterizing surface topography, over the last decade. However, image histogram analysis is highly dependent on the illumination condition 14 and therefore it requires complex pre-processing techniques to get rid of this situation.15–17 Hough transform technique requires binarization of original images, which results in loss of important information. Fourier transform–based techniques can extract the frequency information from surface images, but this technique is unable to extract the spatial information in multi-scale. Therefore, the extraction of micro-scale features is very difficult using this technique. Fractal analysis is a model-based texture analysis technique which was used to extract micro-scale information from machined surfaces, but the high computational time is the main barrier to apply this technique in TCM. Datta et al. 18 applied another geometrical texture analysis, based on Voronoi tessellation (VT) technique, on turned surface images to monitor progressive tool flank wear of turning operation. However, this can only extract the change in feed mark information resulting from progressive tool flank wear. Recently, Samtaş 19 converted face-milled surface images into binary images and then they extracted image vector from each of these binary images. Finally, these image vectors were fed into an artificial neural network to predict average surface roughness (Ra) with 99.99% accuracy. However, most of the above-mentioned techniques have less capability to extract micro-texture and micro-scale features. But there is a need to extract those features for waviness and roughness information, respectively, of machined surface images for precise TCM purpose. This need can be accomplished by applying GLCM-based and discrete wavelet transform (DWT)-based texture analyses on the machined surface images. Therefore, in this work, an attempt has been made to extract waviness and roughness features from the GLCM and DWT analysis, respectively, of end-milled surface images and fuse all these features to predict tool flank wear using a modern learning machine. As GLCM- and DWT-based texture analyses are utilized here, some works on GLCM- and DWT-based texture analyses in the field of analyzing machined surface images are mentioned briefly in the following two paragraphs.
In GLCM-based texture analysis, a matrix called GLCM is formed by evaluating the number of co-occurrence of pixel pairs situated at a specified pixel pair spacing (s) and oriented with a particular orientation angle. Gadelmawla20,21 performed GLCM analysis on face turned and lapped surfaces to determine surface finish. In their another work, Gadelmawla et al. 22 obtained a relationship between GLCM features with speed, depth of cut and feed rate for face milling operation. They also worked on the prediction of machining time by extracting GLCM features of face turned surfaces using regression analysis. 23 In the same domain, Dutta et al. 24 showed a good correlation of tool flank wear with the GLCM features and run length statistical (RLS) features extracted from end-milled surface images. The RLS analysis applied by them can only be able to extract the feed mark information, and due to this reason, the performance of GLCM analysis was better than RLS analysis. Very recently, Wang et al. 25 made a significant contribution toward them on monitoring of progressive tool flank wear of wiper inserts used to face mill engine block components using 3D surface images acquired using a high-definition metrological instrument. They converted 3D surface images into 2D gray level images and then they straightened the feed marks using an image pre-processing step. Then, GLCM analysis was applied on these pre-processed images to extract features, which have a direct correlation with progressive tool flank wear. However, they did not evaluate the performance of their technique to predict tool flank wear. On the other hand, the importance to select proper pixel pair spacing for accurate analysis is shown in previous studies.26,27 But in any of the above-mentioned literature related to GLCM analysis, selection of proper pixel pair spacing was not addressed. Therefore, in this work, an attempt is made for progressive TCM by applying GLCM-based texture analysis on end-milled surface images using proper pixel pair spacing value for precise analysis. However, GLCM-based analysis is mainly capable of extracting waviness information, but extraction of roughness information is also required to predict tool wear, more precisely. The extraction of roughness information from machined surface images can be accomplished by applying a micro-scale and multi-resolution analysis, that is, DWT.
DWT is a multi-resolution analysis technique, which allows the decomposition of an image into four images with low and low, low and high, high and low and high and high frequency components along row and column, respectively, with the help of a mother wavelet. 28 Micro-scale features or high-frequency roughness components of a machined surface can be extracted by decomposing a surface image into higher decomposition level. Josso et al. 29 discriminated waviness and roughness components of milled surface images using DWT with Daubechies 20-tap (db20) mother wavelet. Chang and Ravathur 30 performed surface quality assessment of shaped and polished surface images by Daubechies 4-tap (db4) mother wavelet. Morala-Argüello et al. 31 applied DWT on turned surface images for classifying surface classes based on feed rates using Haar mother wavelet and artificial neural networks technique. Danesh and Khalili 32 performed GLCM-based analysis followed by un-decimated wavelet transform to monitor tool flank wear in turning without any quantification of prediction accuracy. Most of these techniques are based on surface roughness prediction. However, in these techniques, any selection method of proper mother wavelet and decomposition level has not been utilized or developed. But the quality of decomposed image is highly dependent on the selection of mother wavelet because the mother wavelet is actually acting as a band-pass filter. Recently, Dutta et al. 33 performed the progressive monitoring of turning tool from the turned surface images using DWT with proper mother wavelet selection based on machining conditions. However, the proper wavelet selection technique for variation of cutting tool is missing in their research. Therefore, in this research, an attempt is made toward the selection of proper mother wavelet and decomposition level based on the milling cutter used to extract roughness information by applying DWT on machined surface images for progressive TCM in end milling.
However, after the extraction of proper features to describe tool flank wear, a learning machine is needed to build a proper prediction model for the accurate prediction of tool flank wear. Various learning machines were utilized for this purpose, over the years. Tool wear prediction using artificial neuro-fuzzy inference system was performed from the features extracted from force, AE and vibration signals by Sharma et al. 34 Prediction of surface roughness was mainly performed in the literature using supervised learning approaches like group method of data handling, 15 artificial neural network16,19,31 and artificial neuro-fuzzy inference system. 35 Main problem of these supervised learning approaches is lying with empirical risk minimization principle, which biases the results toward training data. Therefore, due to this, there should be a requirement of high number of training data, which involves high experimental cost. To overcome the shortcomings of these neural network–based algorithms, Kaya et al. 36 classified end mill cutter conditions in four classes using support vector machine (SVM) from the features extracted from force, vibration and AE signals which were acquired at the time of profile milling operations. Bhat et al. 37 also utilized SVM to classify tool flank wear obtained from turning into three classes using the features extracted from GLCM analysis of resulting turned surface images. Dutta et al.38,39 performed progressive monitoring of tool flank wear in turning using support vector machine–based regression (SVMR) from features extracted from turned surface images. SVMR is more generalized due to its structural risk minimization principle, which enables it to build a prediction model with less number of training data. Therefore, in this work, prediction of progressive tool flank wear (VBaverage) has been performed using SVMR technique.
Most of the above-mentioned works are dealt with the prediction of surface roughness from machined surface images. Very few research works are available on quantification of the correlation between progressive tool flank wear with image texture features. But still the prediction of progressive VBaverage using image texture features in end milling is missing. Therefore, in this research, an attempt has been made to predict tool flank wear using the texture features extracted from end-milled surface images. Accurate monitoring of progressive tool flank wear needs the information of micro-texture and micro-scale features of end-milled surface images. Therefore, to accomplish this requirement, GLCM- and DWT-based analyses are performed here on end-milled surfaces to extract micro-texture and micro-scale features, respectively. Selections of proper pixel pair spacing value, mother wavelet and decomposition level are performed to obtain accurate results. Finally, the extracted texture features are fed into SVMR models to predict progressive VBaverage.
In this article, the detailed experimental setup and planning are mentioned in section “Materials.” Section “Methodology” shows the methodologies of the work carried out, that is, it explains the theoretical backgrounds of GLCM-based texture analysis, proper selection of pixel pair spacing, DWT-based texture analysis with proper mother wavelet selection process and SVMR technique with proper kernel. Results obtained and discussions on those are mentioned in section “Results and discussion.” Finally, the conclusions are presented in section “Conclusion.”
Materials
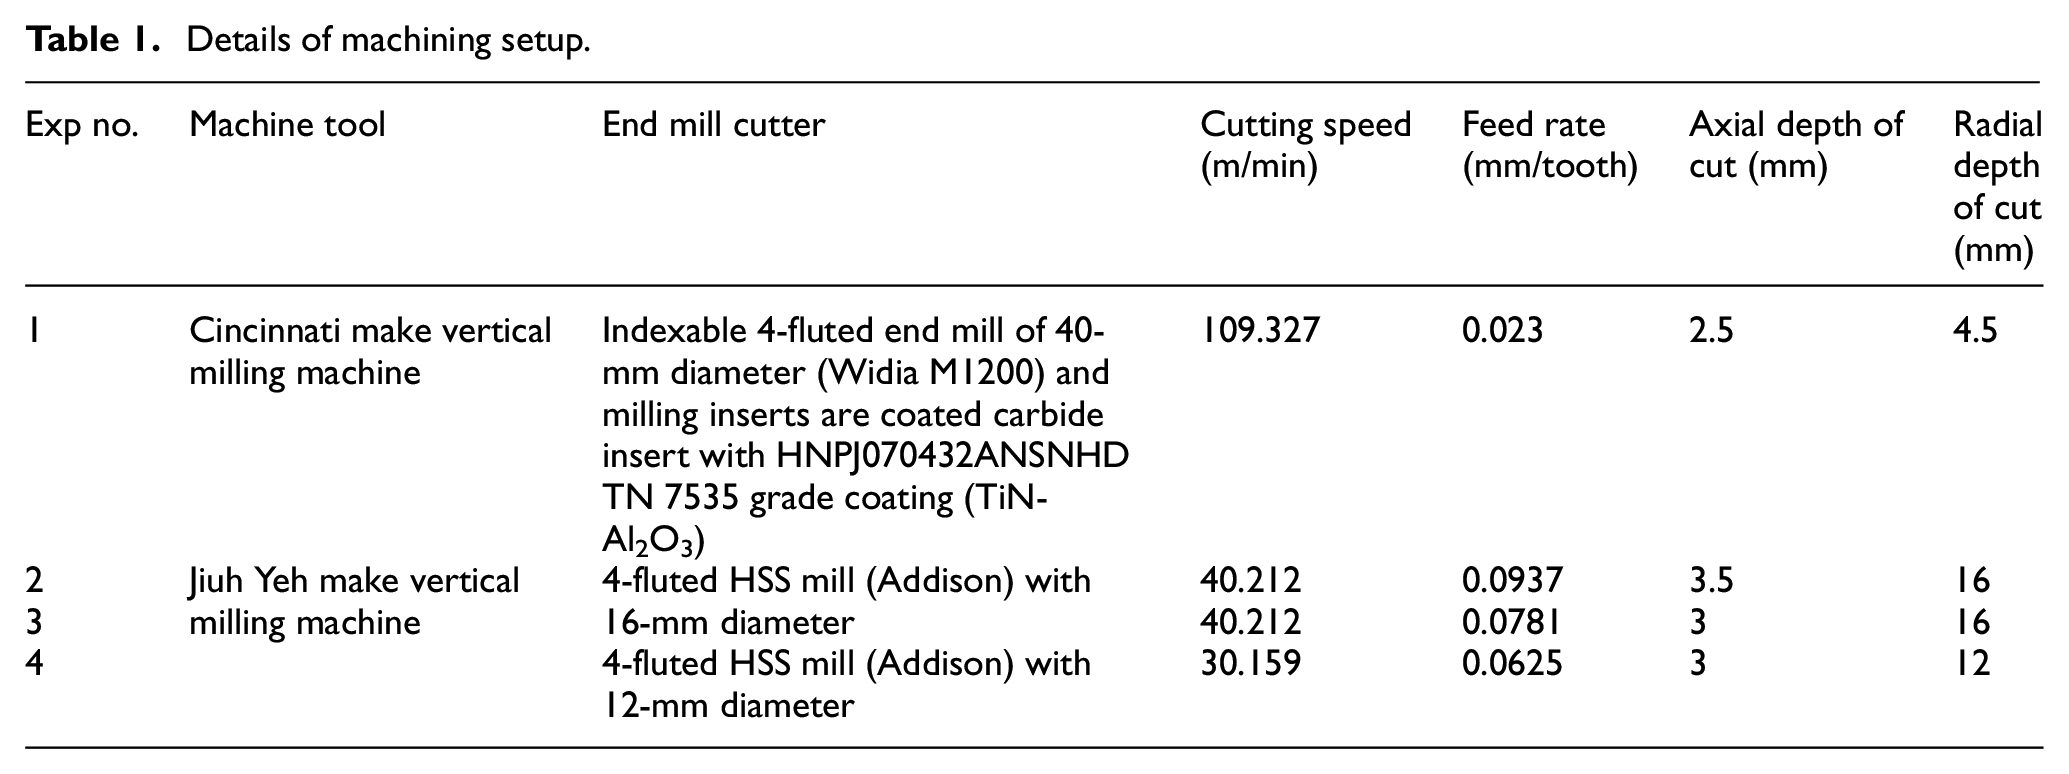
AISI 1040 steel blocks with 100 mm × 50 mm × 50 mm dimensions were machined using two types of end mill cutters in two different types of machine tools with various machining conditions. Here, the machining experiments were performed using coated carbide insert–based end mill and high-speed steel (HSS) end mill using two different vertical milling machines. The details of end mills, machine tools and machining conditions are shown in Table 1.
Details of machining setup.
The machining setup at Cincinnati make and Jiuh Yeh make vertical milling machines is shown in Figure 1(a) and (b), respectively.
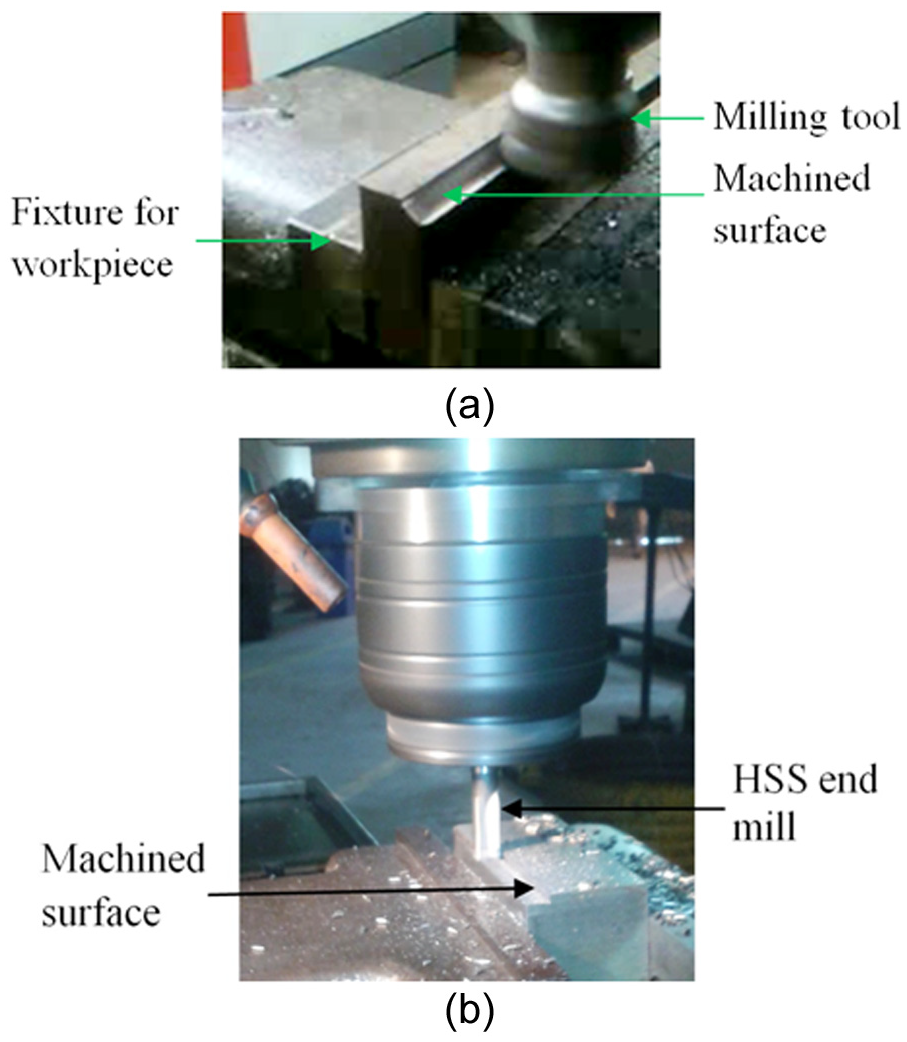
Machining setup at (a) Cincinnati make vertical milling machine with coated carbide tool and (b) Jiuh Yeh make vertical milling machine with HSS tool.
All the four experiments were performed in dry cutting condition. After each pass (after the end milling of the full length, i.e., 100 mm), tool flank wear was measured using Leica S6D microscope at 10× zoom with the help of an image analysis software, Leica QWin-V3. At the same time, end-milled surface images were also captured at five different positions with the help of Leica S6D microscope and Leica QWin-V3 software.
As the width of the machined surface is very small due to low axial depth of cut in end milling, the evaluation area of machined surface is very small, due to which the surface images were captured using the optical microscope with 2048 × 1536 pixels resolution at 2× zoom. Surface images were then cropped into 300 × 300 pixels (0.95 mm × 0.95 mm) for further processing. The images of surfaces machined by a fresh and a worn end mill cutter are shown in Figure 2(a) and (b), respectively. Non-uniform feed marks with more diffused reflection can be observed in Figure 2(b) than that in Figure 2(a).
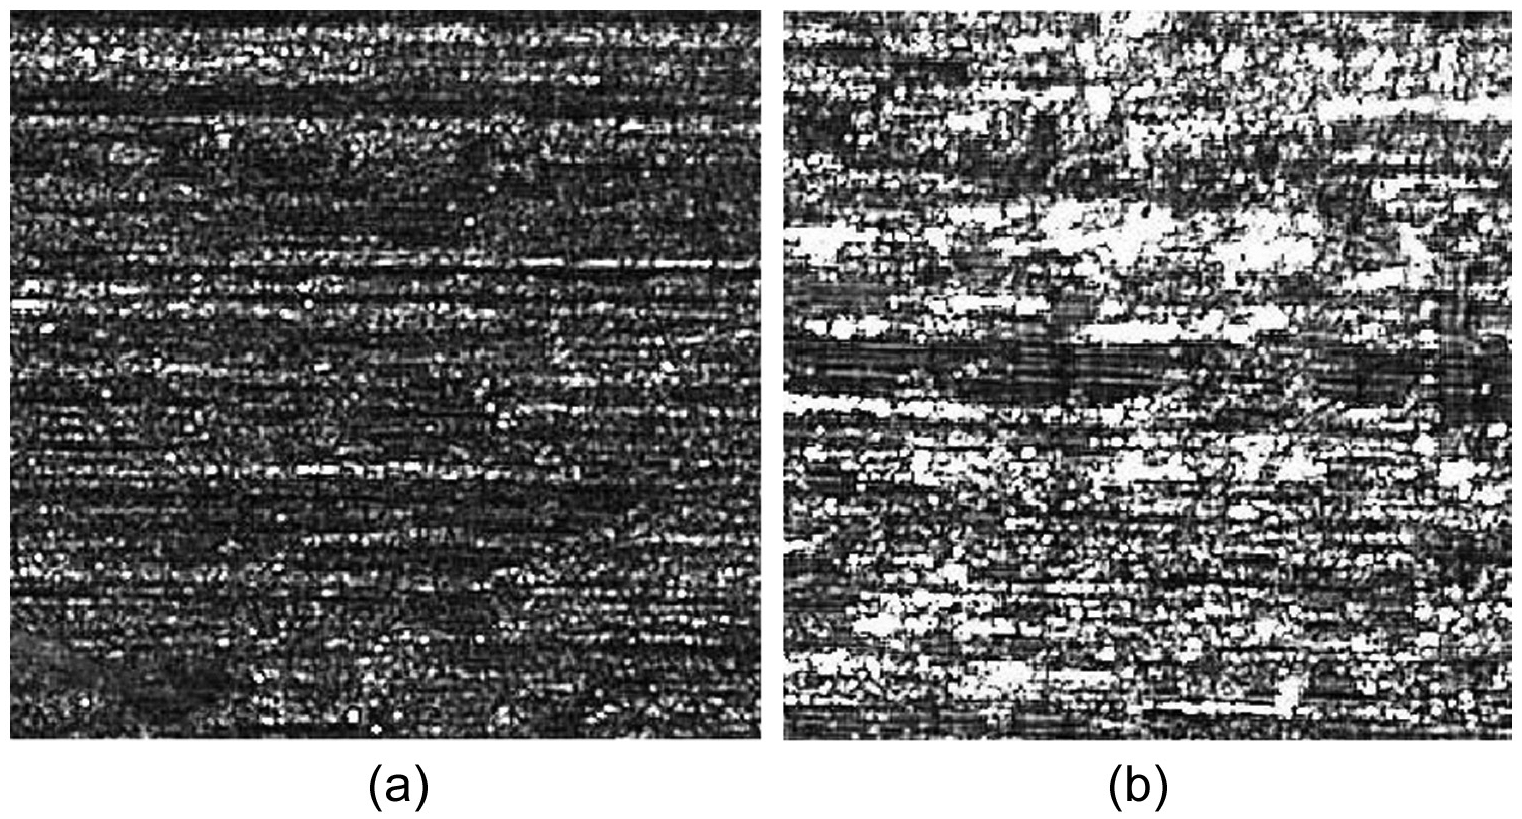
Images of surfaces produced by (a) a fresh end mill cutter and (b) a worn end mill cutter (VBaverage = 214 µm) for Exp No. 1.
All the image processing were performed using MATLAB® (version 7.6.0.324 R2008a) software and SVMR was performed using Statistica10 software.
Methodology
GLCM-based texture analysis
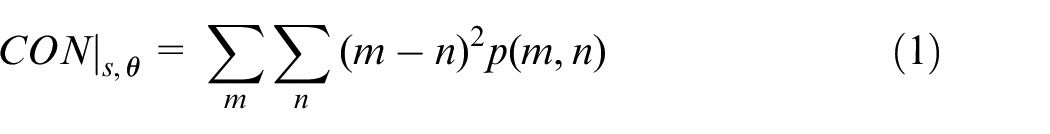
In this work, GLCM-based texture analysis is performed on end-milled surface images to extract the micro-texture details. GLCM-based texture analysis is a method to extract the second-order statistical texture features from an image. First-order statistical texture analysis can only extract features based on image intensity histogram without considering the information of spatial position of texture primitives. However, second-order statistical features can overcome this limitation of first-order analysis by evaluating the spatial relationships of gray level intensity values present in the image texture. 40 The formation of GLCM is already explained in authors’ previous works.26,27 GLCM of a rougher surface is more prone to off-diagonal distribution than that of a smoother surface due to the non-uniformity as explained by Gadelmawla. 20 Contrast (CON) and second diagonal moment (SDM) are extracted as the features for describing tool flank wear based on this concept. Expressions of CON and SDM are shown in equations (1) and (2), respectively 21
and
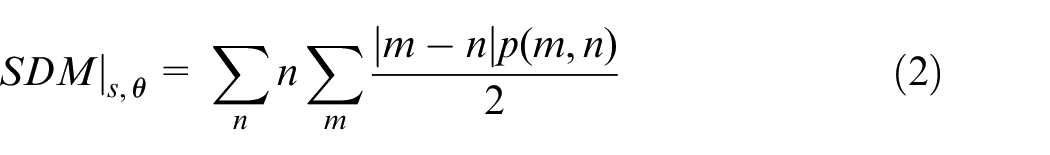
where
Selection of proper s value
In end-milled surfaces lay marks are distributed horizontally and the orientation is considered as perpendicular to the lay direction. Thus, the orientation is considered as 90° in this work. Proper pixel pair spacing value to construct GLCM is chosen based on the maximum CON value by varying pixel pair spacing for an end-milled surface image, as CON is highly dependent on the pixel pair spacing value due to diagonal distribution characteristics of this feature. 41 The plot of CON with varying pixel pair spacing for end-milled surface shown in Figure 2(a) is indicated in Figure 3.
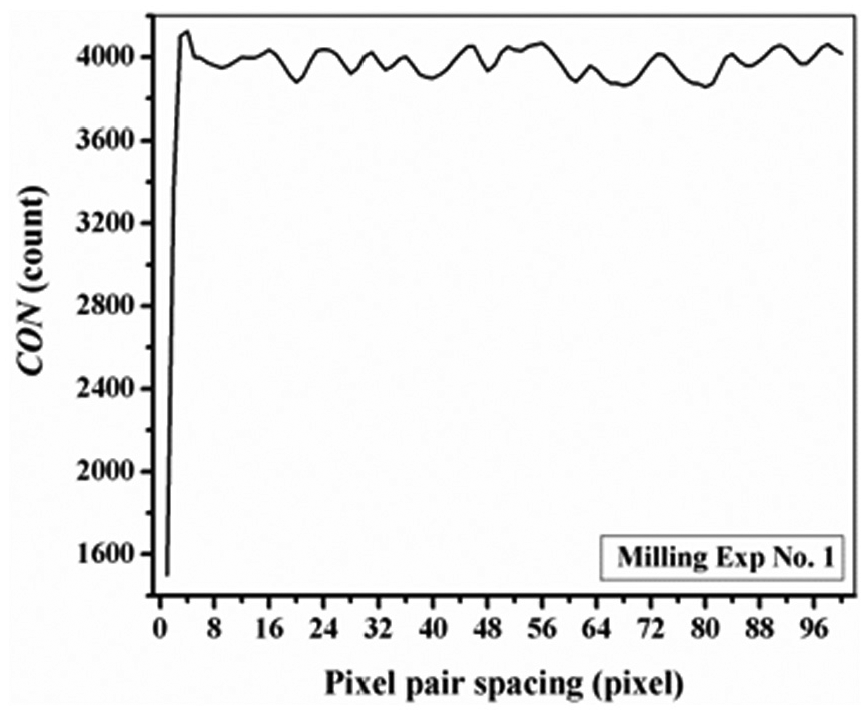
Plot of CON versus pixel pair spacing for Figure 2(a).
It can be found from Figure 3 that the maximum CON value is obtained at pixel pair spacing (s value) of 4. Therefore, proper s value for images obtained from Exp No. 1 is 4. Similarly, proper s values for surface images obtained from other three experiments are same and the value is 3. Thus, the pixel pair spacings are considered to construct GLCM of end-milled surface images obtained in experiment numbers 1, 2, 3 and 4 are 4, 3, 3 and 3, respectively. This method is mainly utilized for texture with no particular pattern.
DWT-based texture analysis
Topography of the end-milled surface is non-stationary in nature. Therefore, these non-stationary surfaces are needed to be evaluated at micro-scale for detailed analysis in multi-resolution. On the other hand, only wavelet transform has the capability to analyze non-stationary surfaces using multi-resolution analysis. Study of non-stationary surfaces in spatial and frequency domain with one analysis can be accomplished by utilizing a waveform function in wavelet transform. To analyze the low-frequency part of a signal or image, low-frequency resolution with high spatial resolution or vice versa is required which can be achieved by applying wavelet transform by utilizing mother wavelet as a basis function. In most of the practical applications, DWT is used to decompose a digital image using dyadic scaling. In dyadic scaling,

where translation is
Similarly, there is a scaling function
Selection of proper mother wavelet and decomposition level
For the selection of proper mother wavelet and the decomposition level, end-milled surfaces are divided into two surface classes based on the materials of end mills used. First surface class consists of the end-milled surfaces produced by coated carbide tool, and the second surface class consists of the surfaces produced by HSS tool. For a particular surface class, suppose for class 2, the surface images obtained in Exp no. 2, 3 and 4 are decomposed up to three levels with all the 59 mother wavelet bases having in MATLAB library. Therefore, for each of the experiments, 59 horizontal details are obtained for each of the images in each of the three decomposition levels. A feature, energy (ENE), is then extracted from each of the horizontal details as shown in equation (4) 30
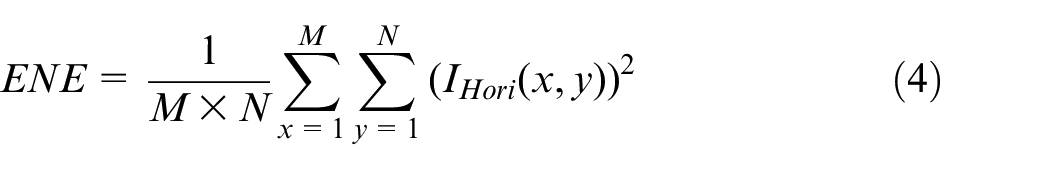
where
Surfaces machined by a fresh tool are smoother than that by a worn tool, and on smooth surface, reflection is more specular than that on a rough surface.
43
Therefore, rough surface image looks brighter than smooth surface image which results from higher gray level intensity at high frequency in rough surface images (Figure 2). As a consequence, the matrix elements
Therefore, with the selected mother wavelet and decomposition level, the DWT on end-milled surface images is performed to extract horizontal details. Finally, ENE and root mean square value (GRMS) of the horizontal details are evaluated as descriptors of VBaverage. The feature GRMS is expressed in equation (5) 30
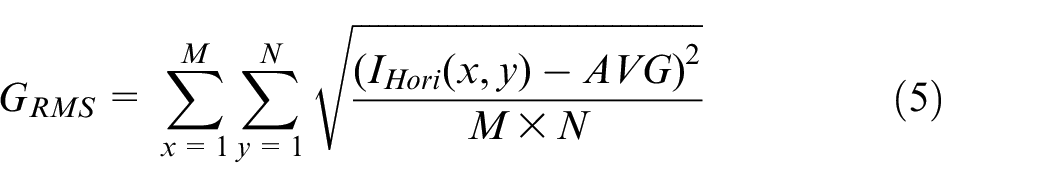
where AVG is the mean of the matrix,
RMS is the standard deviation of the matrix elements and this should have an increasing trend with an increase in tool flank wear due to the increase in
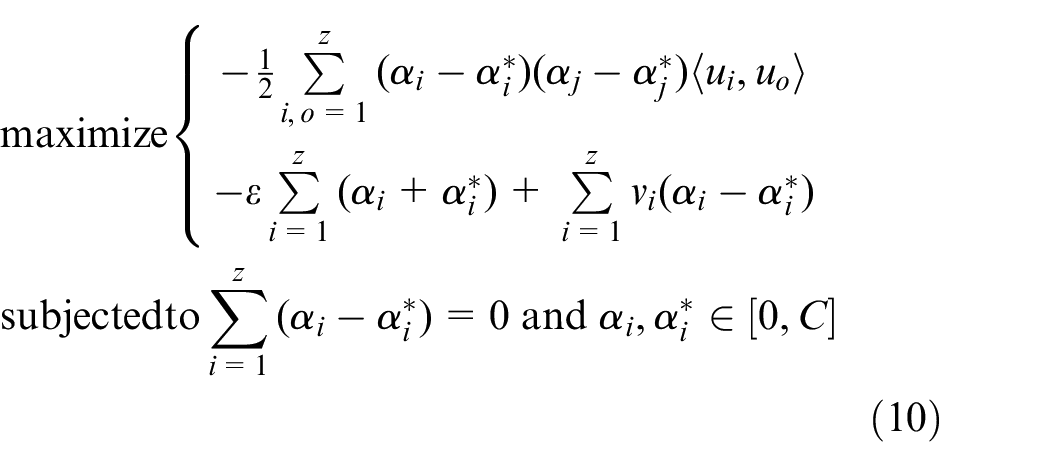
SVMR
The aim of this work is to predict progressive VBaverage using the extracted texture features from end-milled surfaces. In this regard, CON and SDM are extracted from the GLCM of end-milled surface images, and ENE and GRMS are extracted from the discrete wavelet decomposed images of end-milled surface. Finally, these four extracted texture features are fed into a SVMR model to predict progressive VBaverage for each experiment.
In SVMR, p number of training data pairs

where
More generalized models with smoother target function can be achieved by smaller weight parameters. Maximum error ε is utilized in ε-based SVMR approach to enhance the generalization performance of
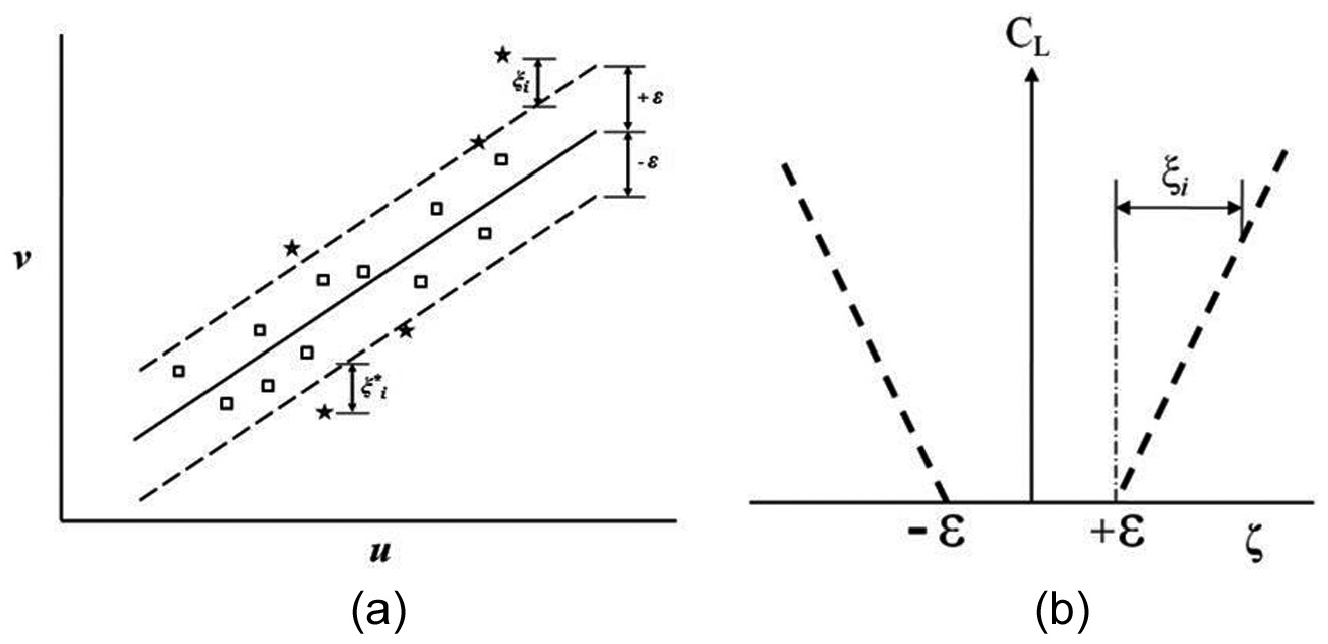
Soft margin loss for (a) a linear SVMR model and (b) its loss function.
Therefore, the convex optimization problem of SVMR can be written as 44
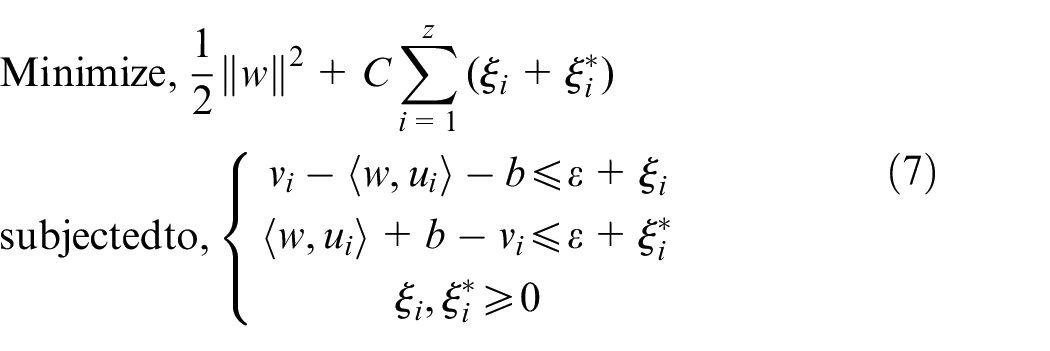
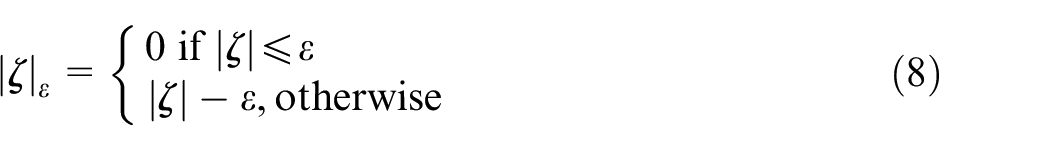
Figure 4(b) represents the plot of ε-insensitive loss function where
The ε-insensitive loss function is represented as 44
The optimization problem in equation (7) can be expressed as a primal loss function,
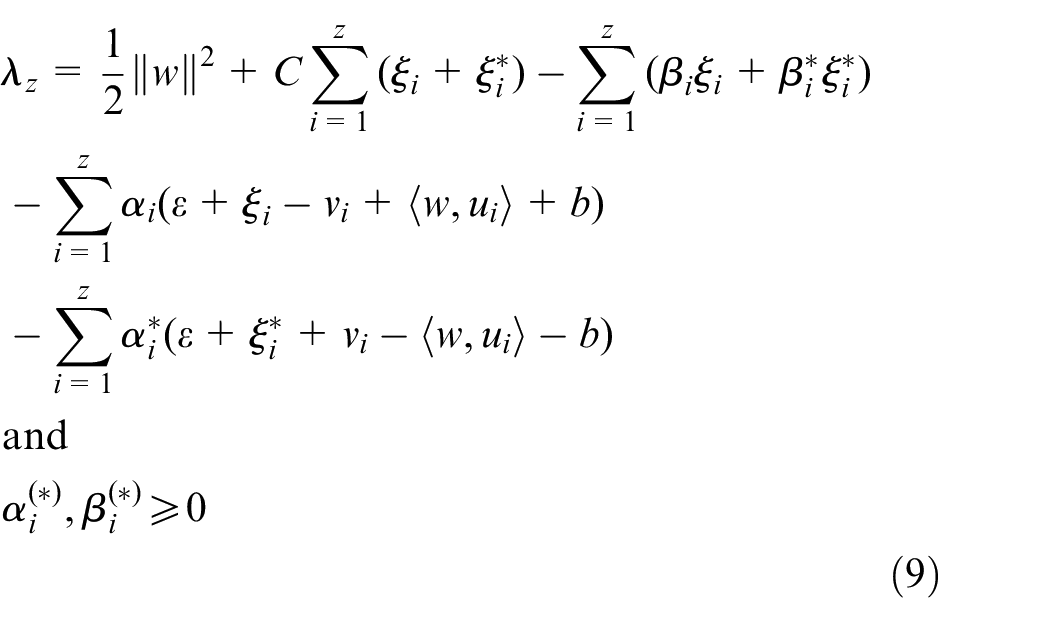
For optimal solution, the partial derivatives of
and
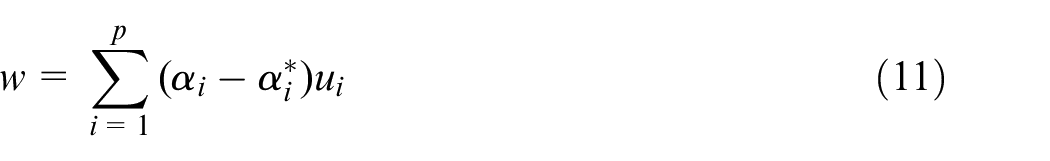
Therefore, the target function can be expressed in equation (12) 44
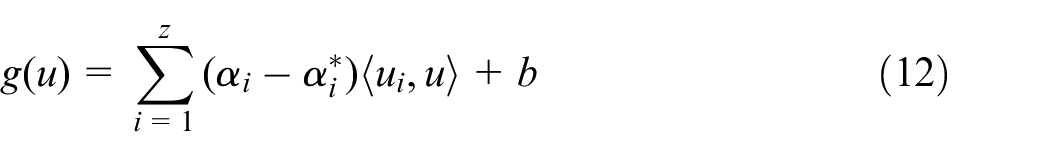
Non-linear SVMR problem can be maneuvered by replacing
In this work, extracted four texture features are fitted with the corresponding measured VBaverage with linear, polynomial of degree 2 and exponential fits and the fitting parameter R2 is evaluated for each fit. Then, average of these R2 values for all the four experiments is calculated for each of the features. After this, the type of best fit for each of the texture features with measured VBaverage is selected based on the maximum R2 value. Finally, this type of best fit is then utilized to select the proper kernel. For example, if CON shows the type of best fit as exponential, then this RBF kernel should be selected as proper kernel. The selection of kernel parameters is also utilized in this work, which is shown in section “Results and discussion.”
Results and discussion
In this work, tool flank wear of four inserts (in case of indexable end mill) and four flutes (in case of HSS end mill) is measured separately after each pass. Four tool flank wear values are then averaged and these mean values are considered as average tool flank wear (VBaverage). The plots of VBaverage with machining time for experiment numbers 1, 2, 3 and 4 are shown in Figure 5(a)–(d). It can be seen from the plots (Figure 5) that the measured VBaverage is increasing with the increase in machining time, which is a normal phenomenon.
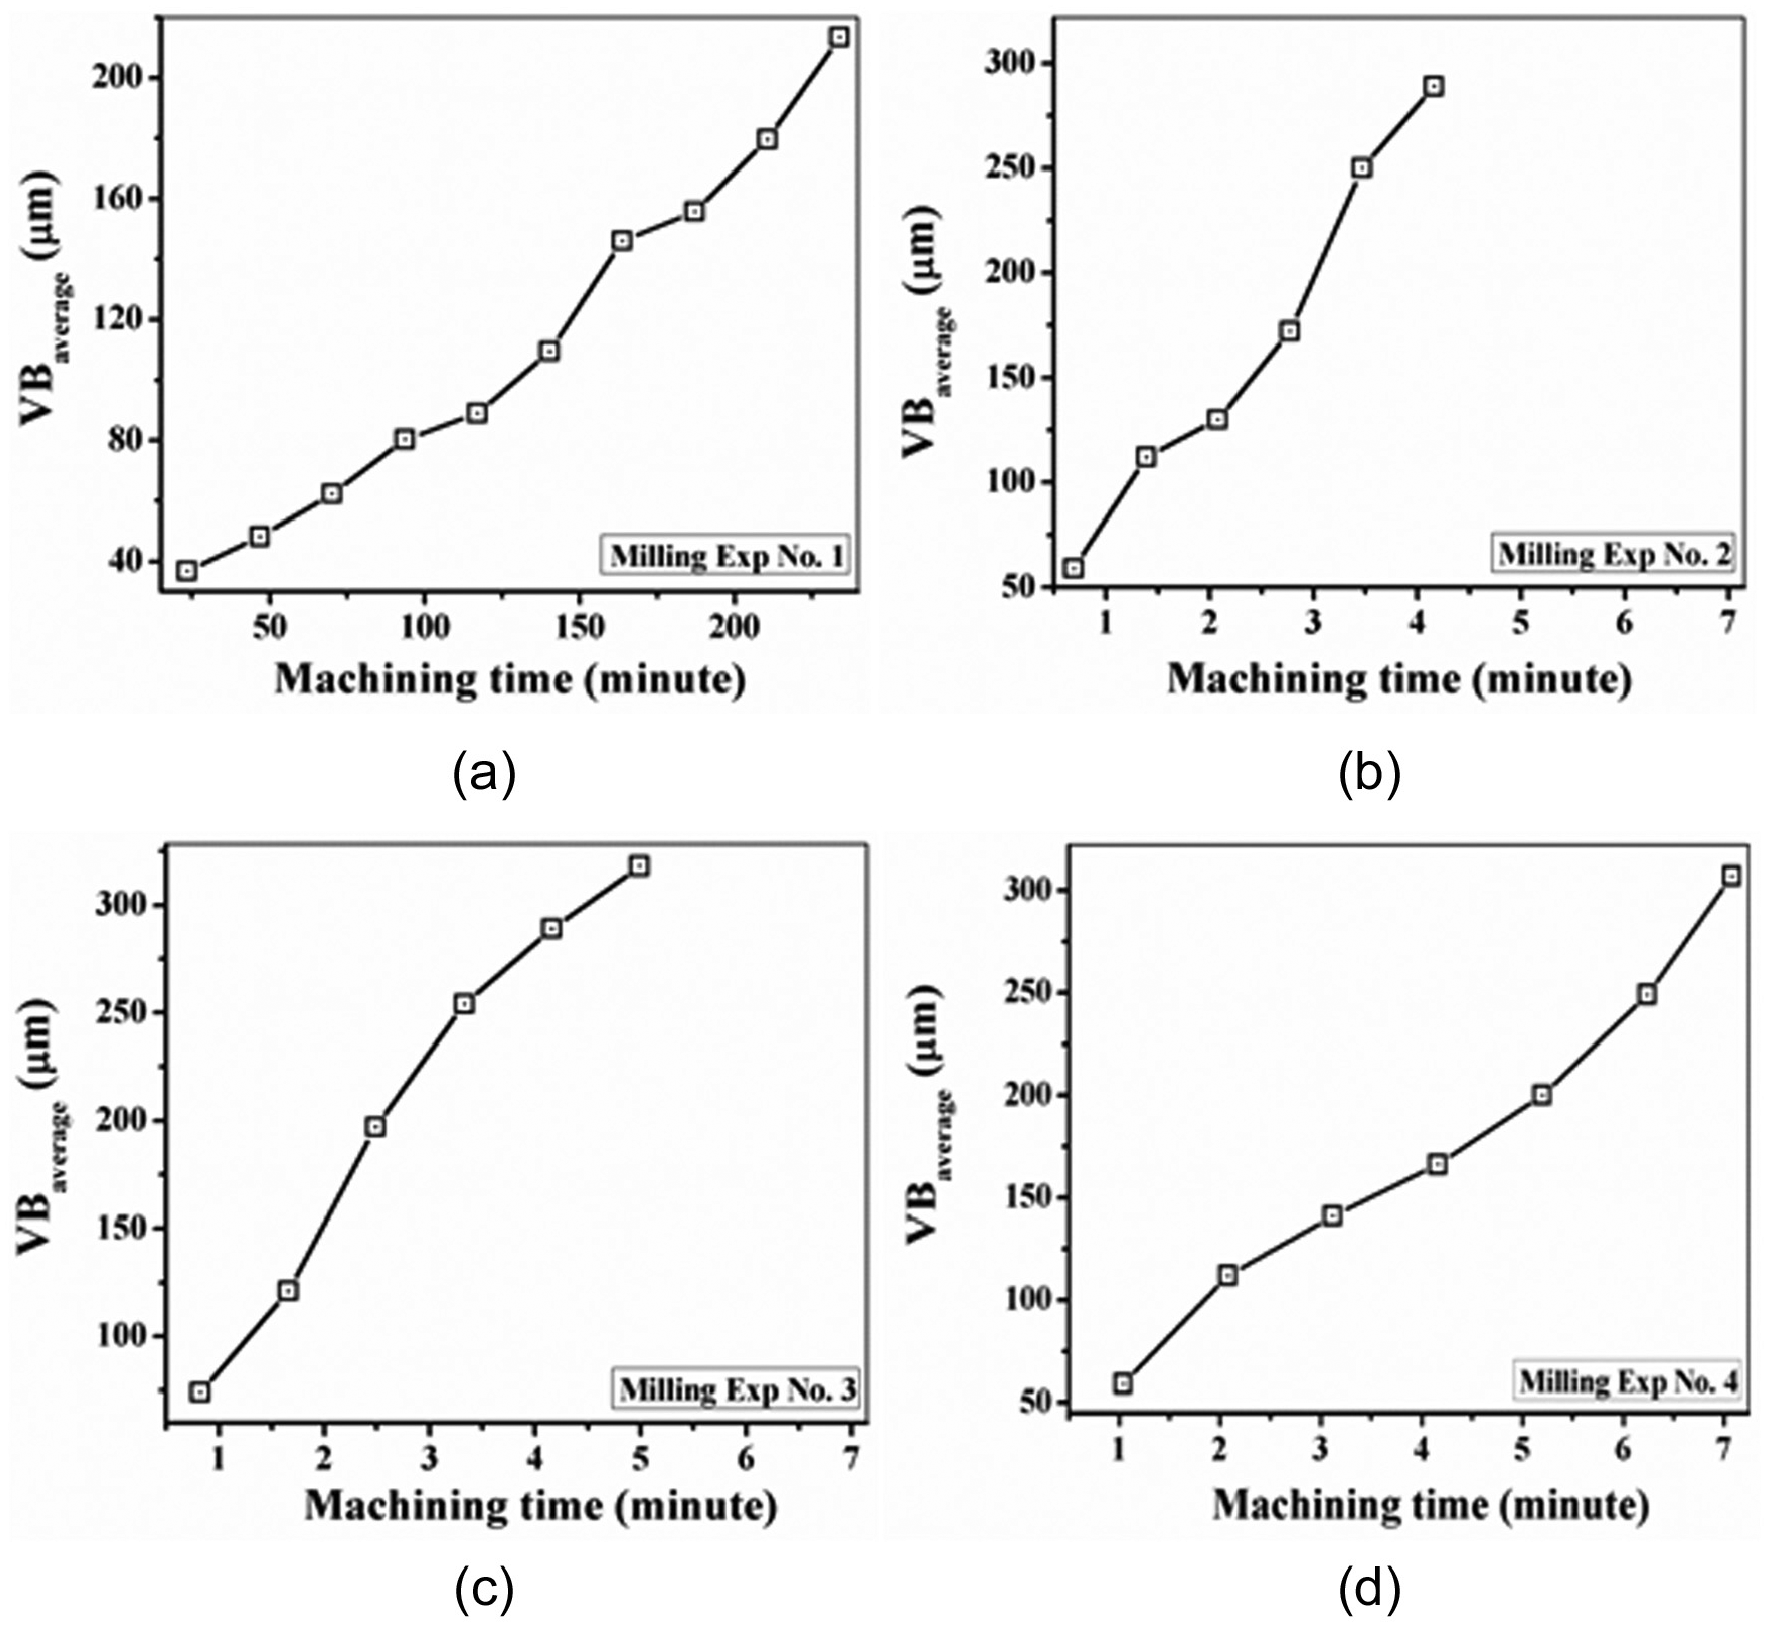
Plots of VBaverage with machining time for (a) Exp no. 1, (b) Exp no. 2, (c) Exp no. 3, and (d) Exp no. 4.
CON feature values extracted from the end-milled surface images are plotted with corresponding VBaverage values, as shown in Figure 6.
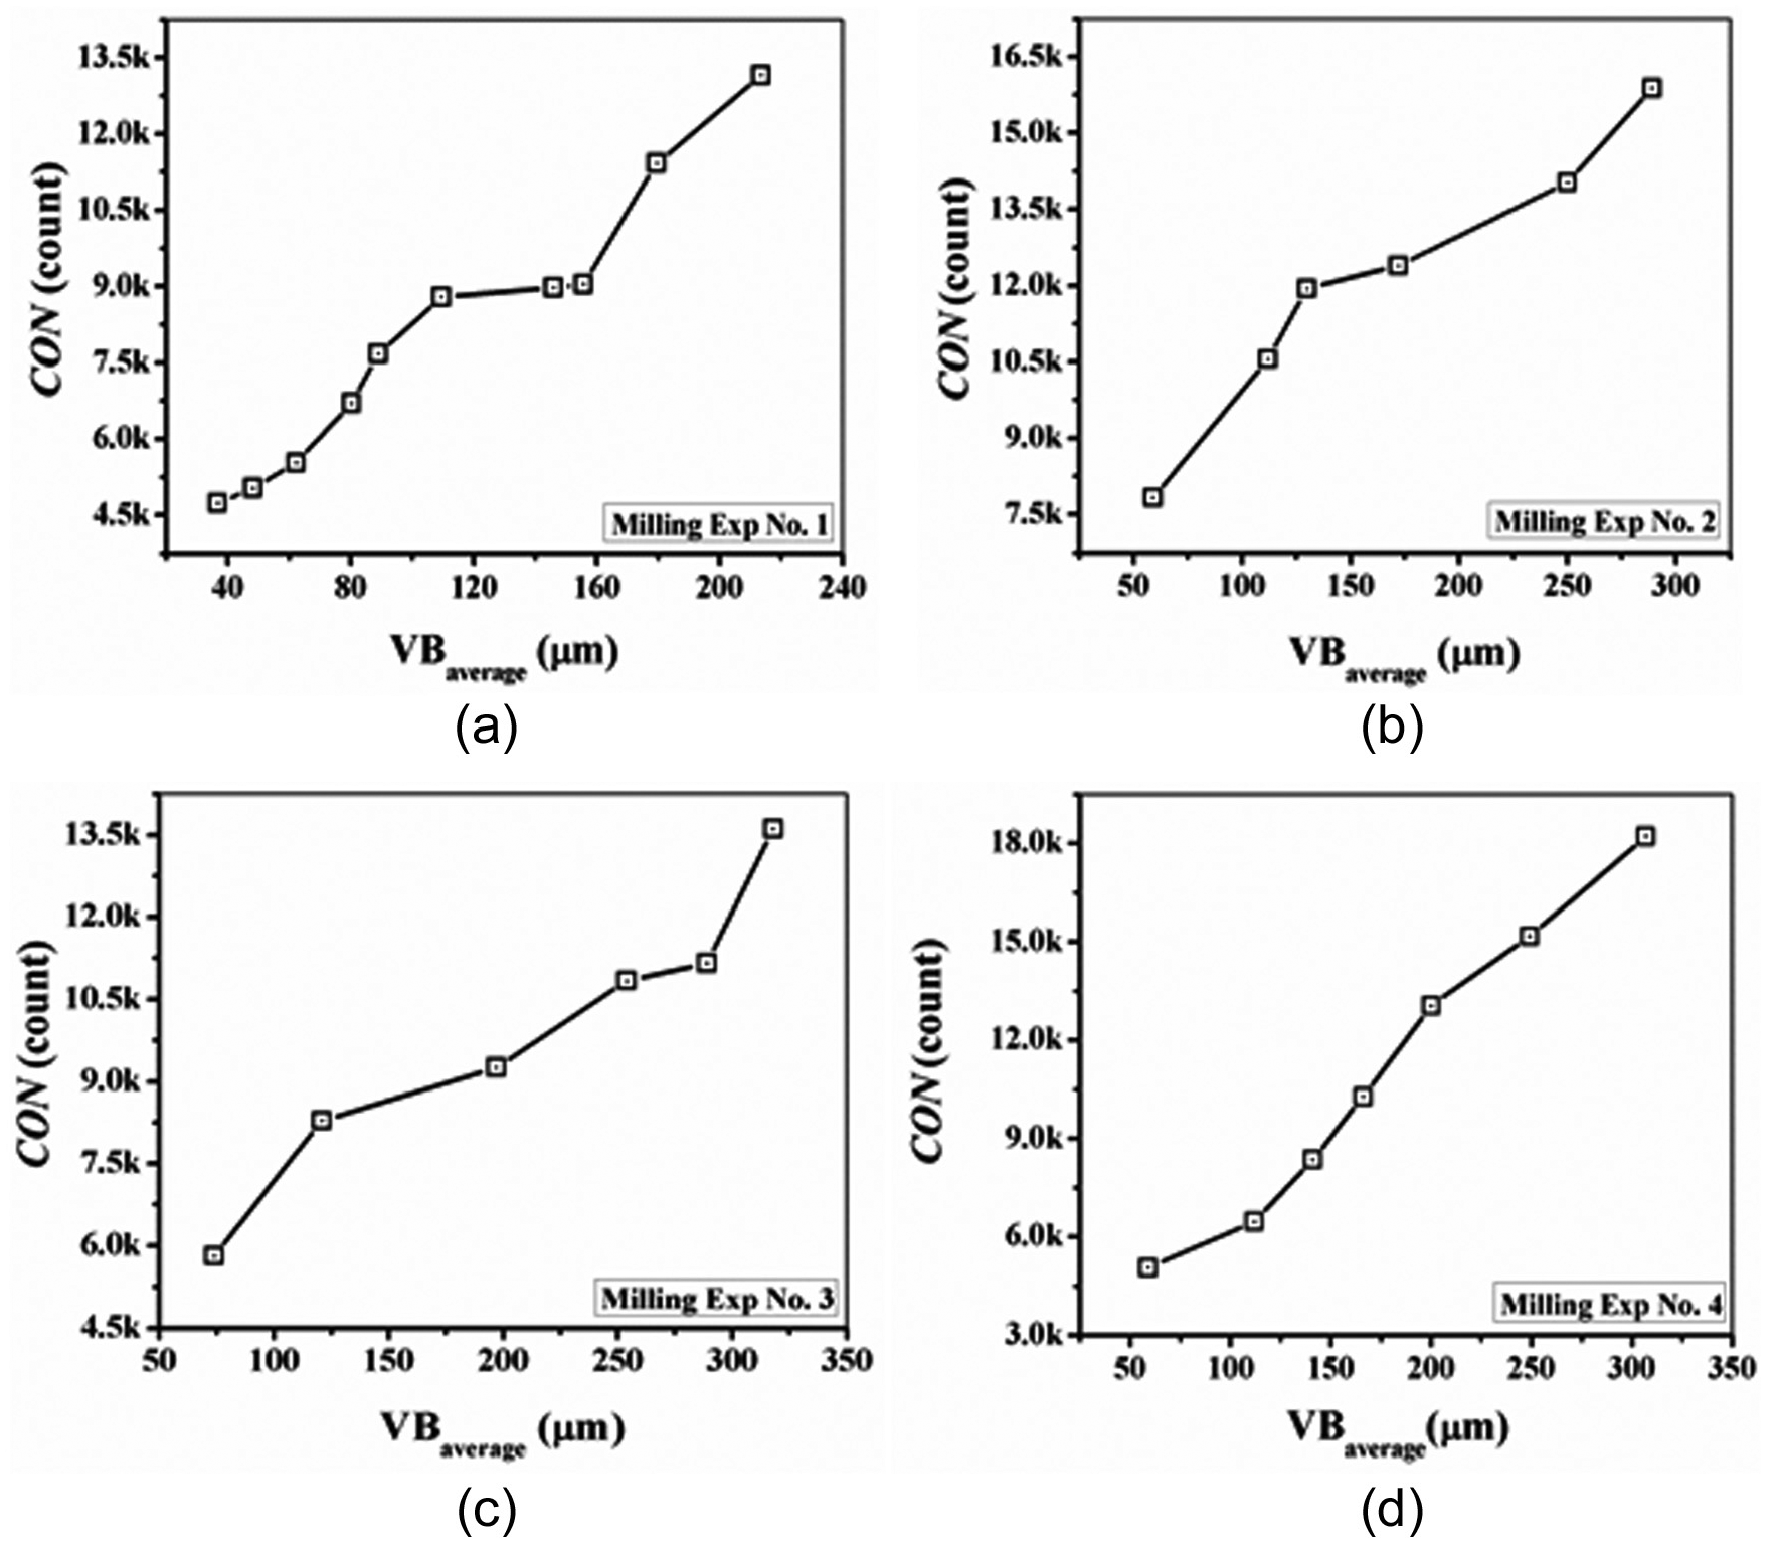
Plots of contrast (CON) with VBaverage for (a) Exp no. 1, (b) Exp no. 2, (c) Exp no. 3, and (d) Exp no. 4.
It can be depicted from Figure 6 that CON is increasing with the increase in VBaverage. Since, with the increase in tool flank wear, the non-uniformity of machined surface increases which results in an increase in scatterness of the GLCM obtained from the machined surface images. Therefore, CON has an increasing trend with an increase in tool flank wear as explained in section “GLCM-based texture analysis.”
SDM values are plotted with corresponding VBaverage values in Figure 7. The trend of SDM is increasing with the increase in VBaverage, due to the increase in non-uniformity of machined surface images with an increase in tool wear, as explained in section “GLCM-based texture analysis.”
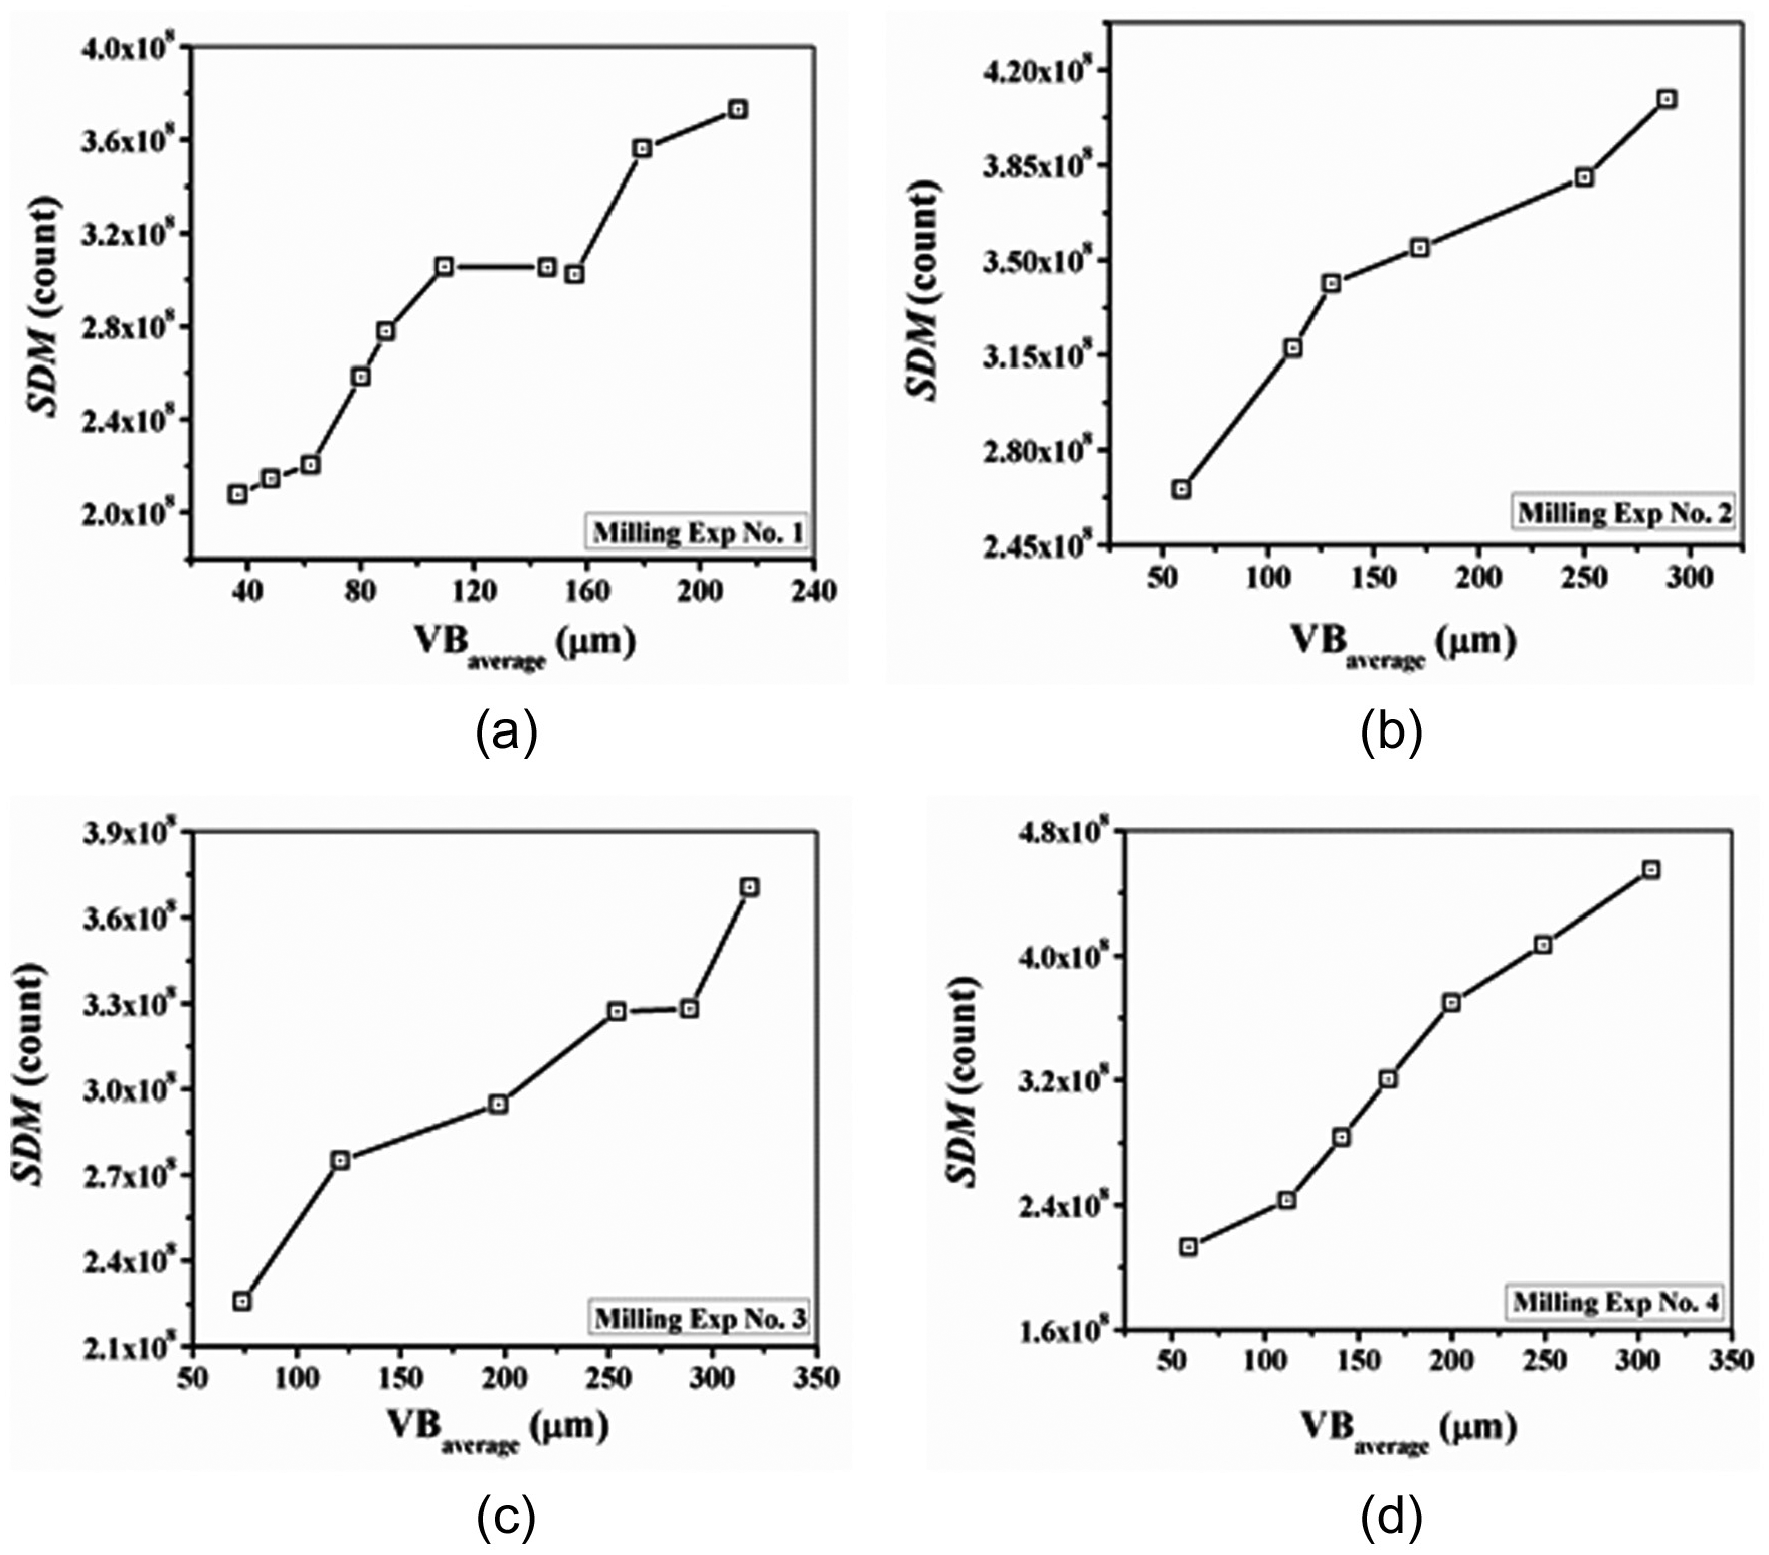
Plots of SDM with VBaverage for (a) Exp no. 1, (b) Exp no. 2, (c) Exp no. 3, and (d) Exp no. 4.
In DWT-based texture analysis, first the mother wavelet and decomposition levels are selected for surface classes 1 and 2, as described in section “Selection of proper mother wavelet and decomposition level.” For surface class 1, the surface images are decomposed up to level 3 with 59 mother wavelets and therefore 59 linear fits of ENE with VBaverage are evaluated corresponding to each level. Thus, 59
The
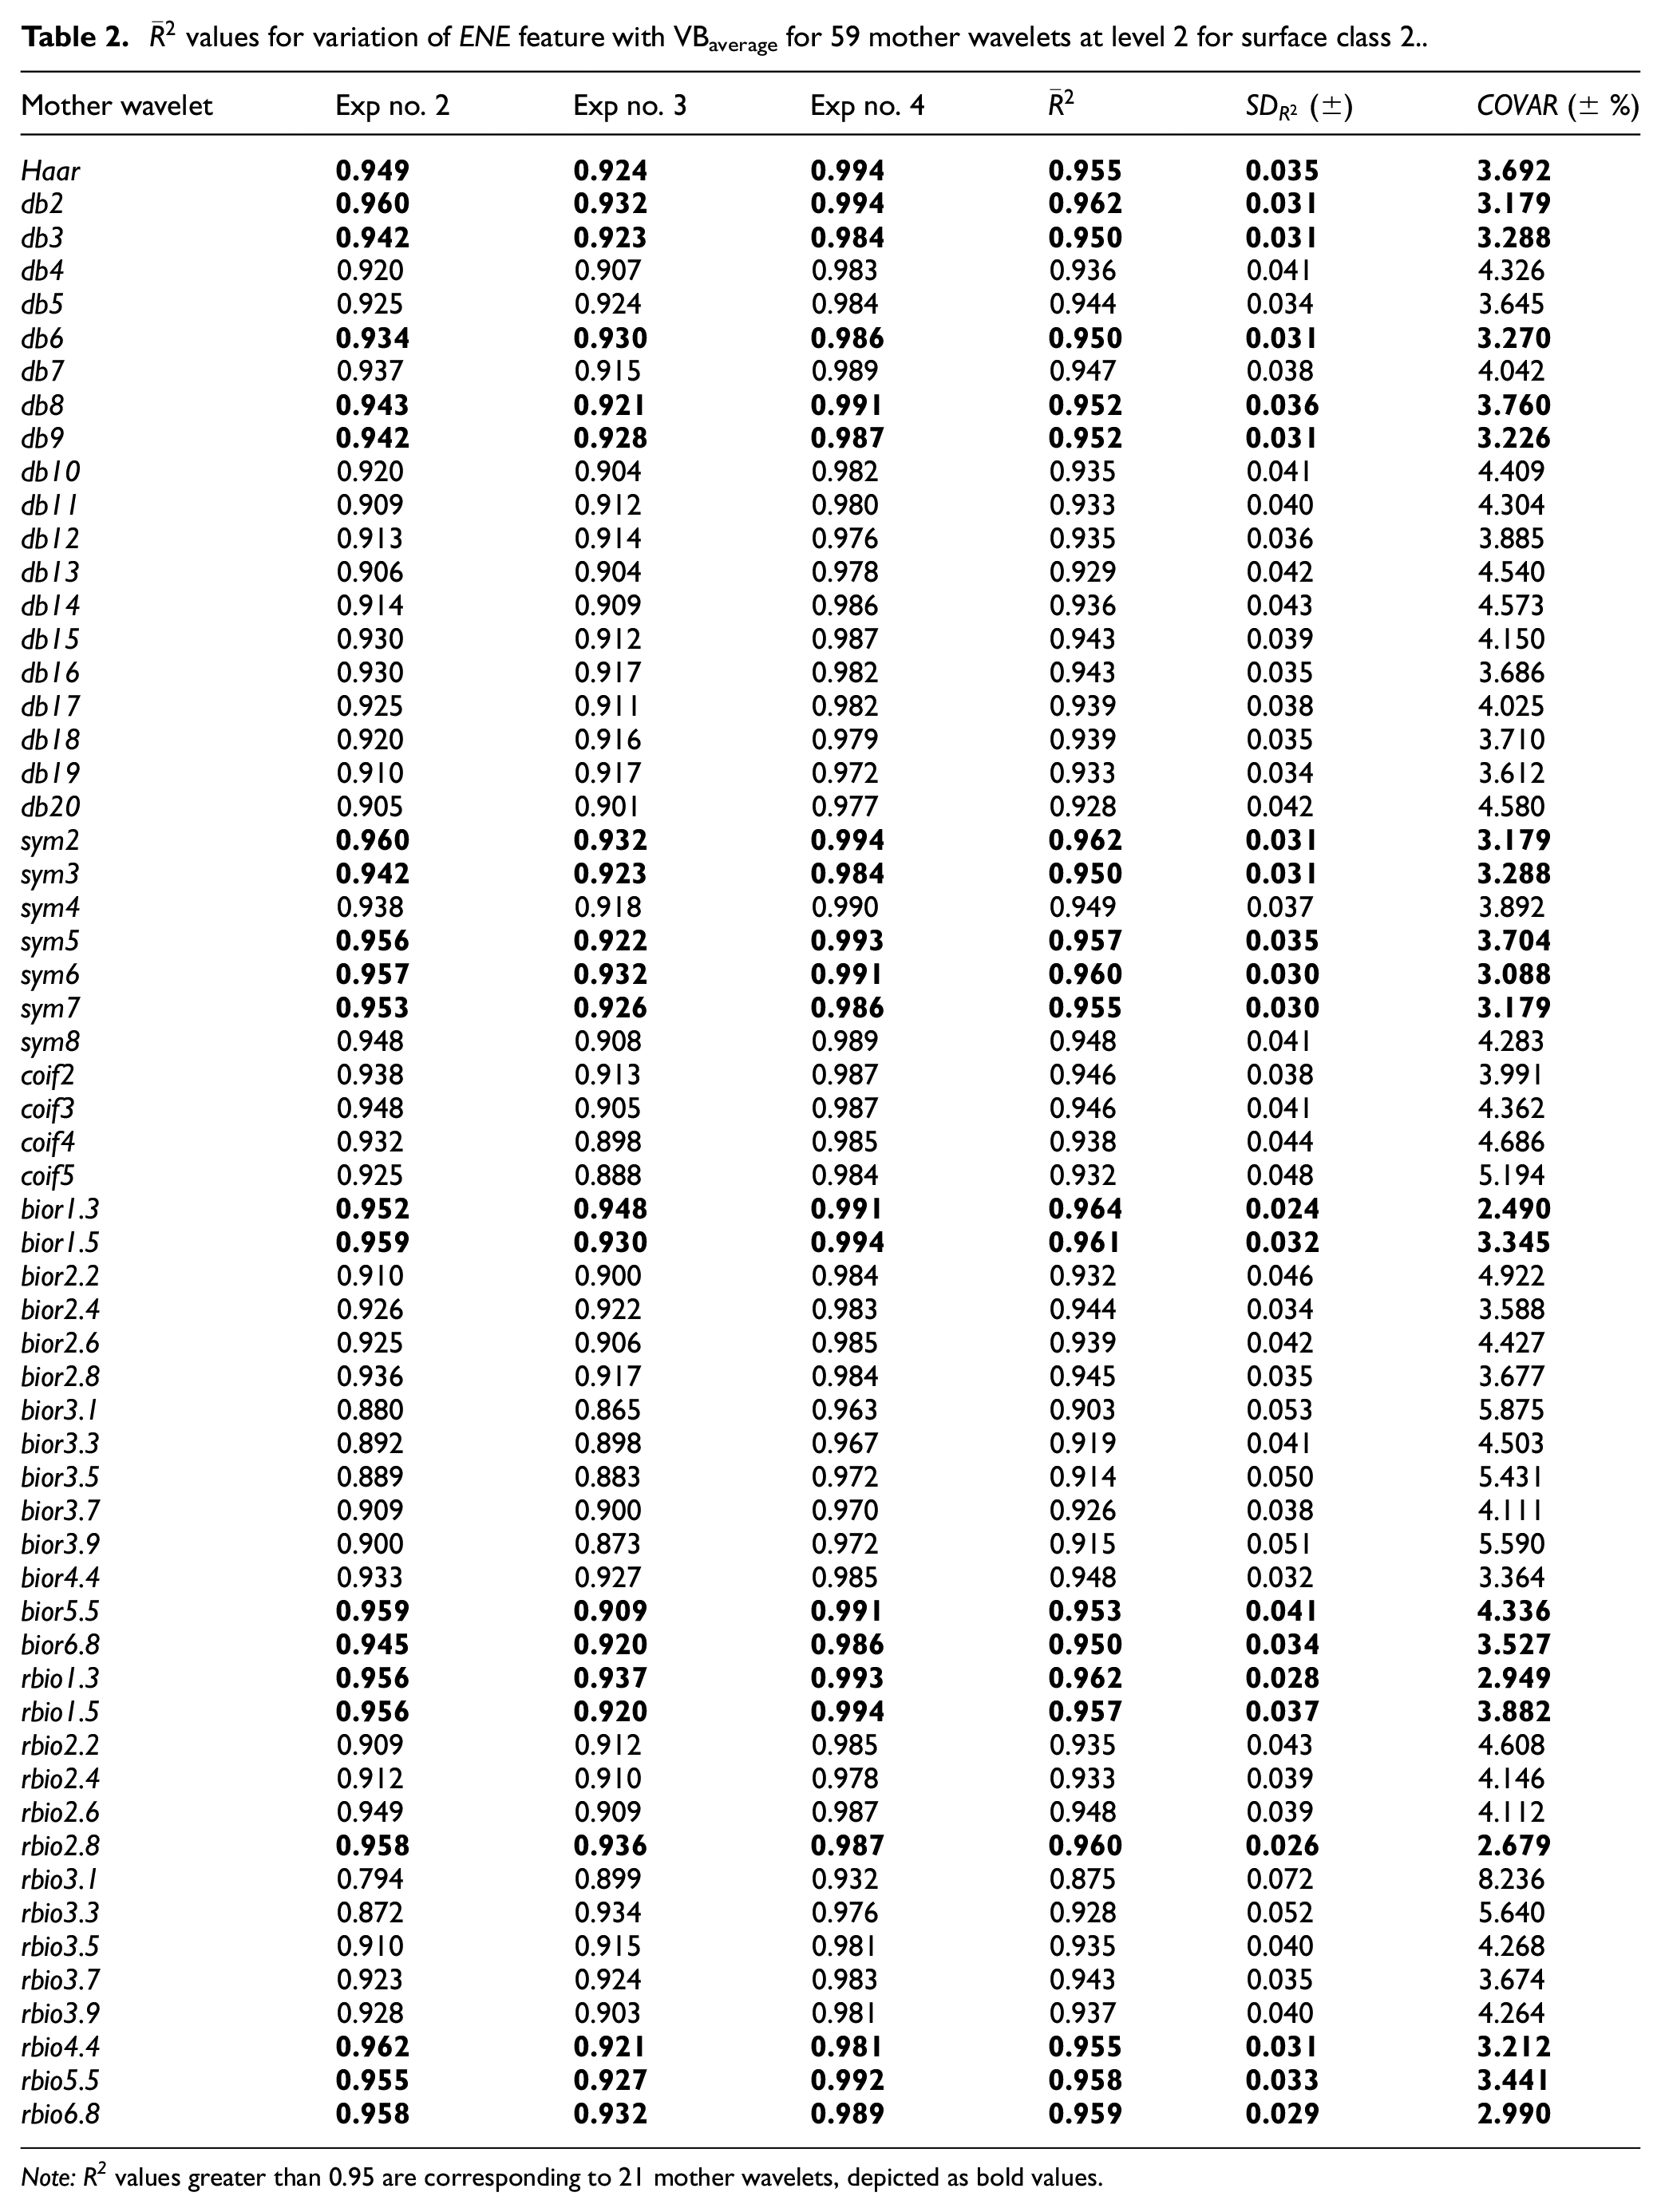
Note:R2 values greater than 0.95 are corresponding to 21 mother wavelets, depicted as bold values
Biorthogonal mother wavelets are selected as appropriate wavelet due to their smoothness, low approximation error, finite small support and presence of symmetricity. 46 Whitehouse 47 also enlightened the usefulness of biorthogonal wavelets for surface analysis.
The variation of GRMS with corresponding VBaverage values are plotted for all the four experiments as shown in Figure 8.
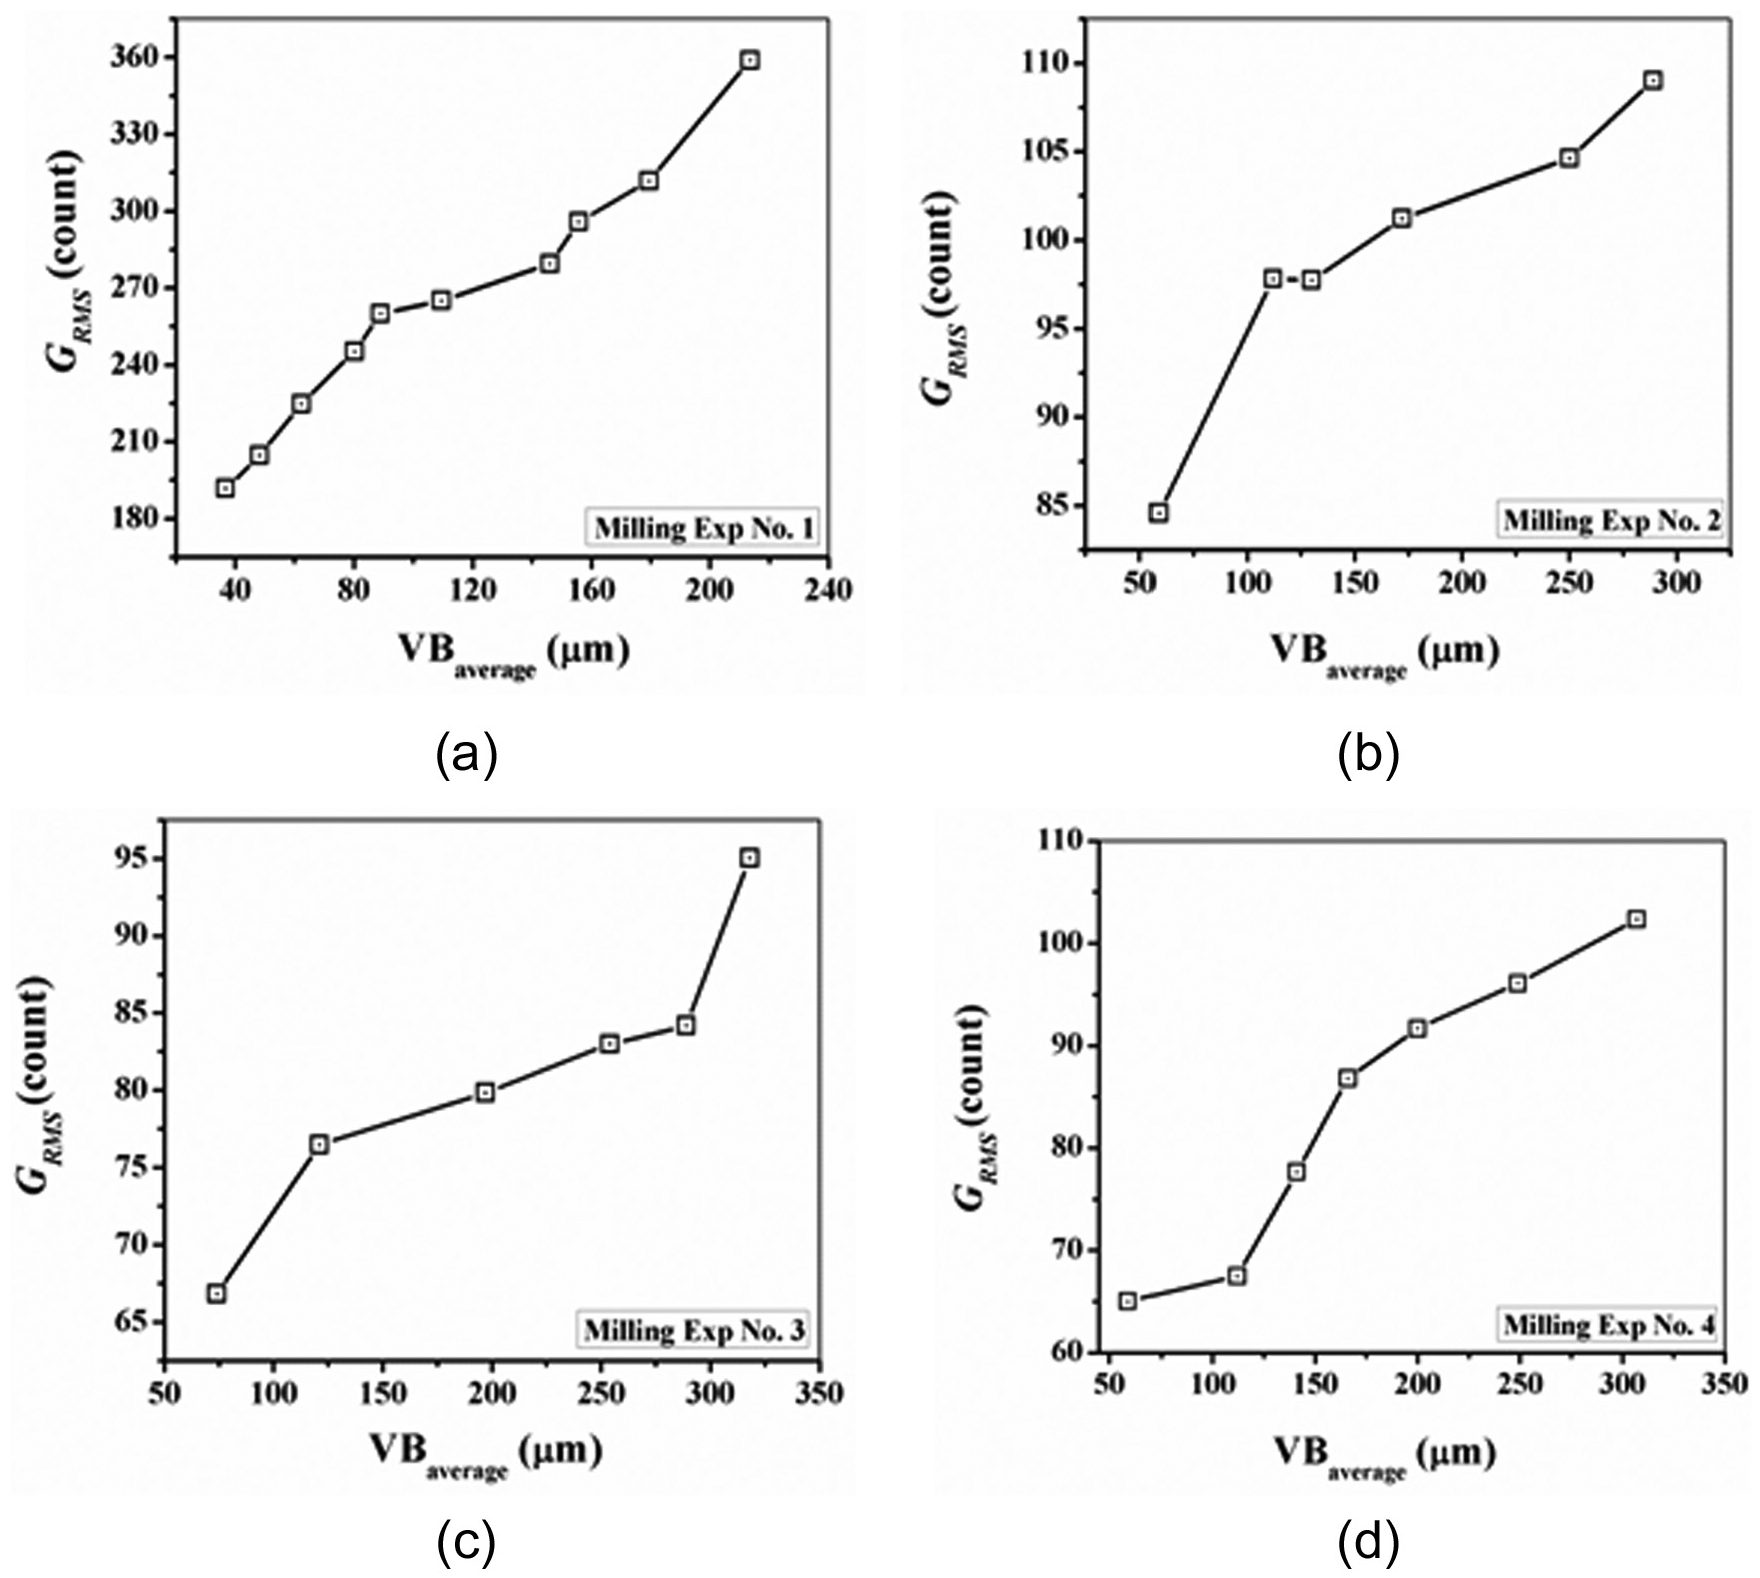
Plots of GRMS with VBaverage for (a) Exp no. 1, (b) Exp no. 2, (c) Exp no. 3, and (d) Exp no. 4.
Increasing trend of GRMS is observed from Figure 8 for all the machining conditions with the increase in VBaverage. Non-uniform surfaces are produced from a worn tool and thus more diffused reflection occurs from the non-uniform surfaces than that from the uniform surfaces, as shown in Figure 2. Due to this reason, the gray level values of surface images produced with a worn tool is higher than the surface images produced with a fresh tool. Consequently, the elements of
The variation of ENE with corresponding VBaverage values are plotted for all the four experiments and are shown in Figure 9. The ENE feature has an increasing trend with an increase in VBaverage, as depicted in Figure 9. This phenomenon is caused due to the increase in
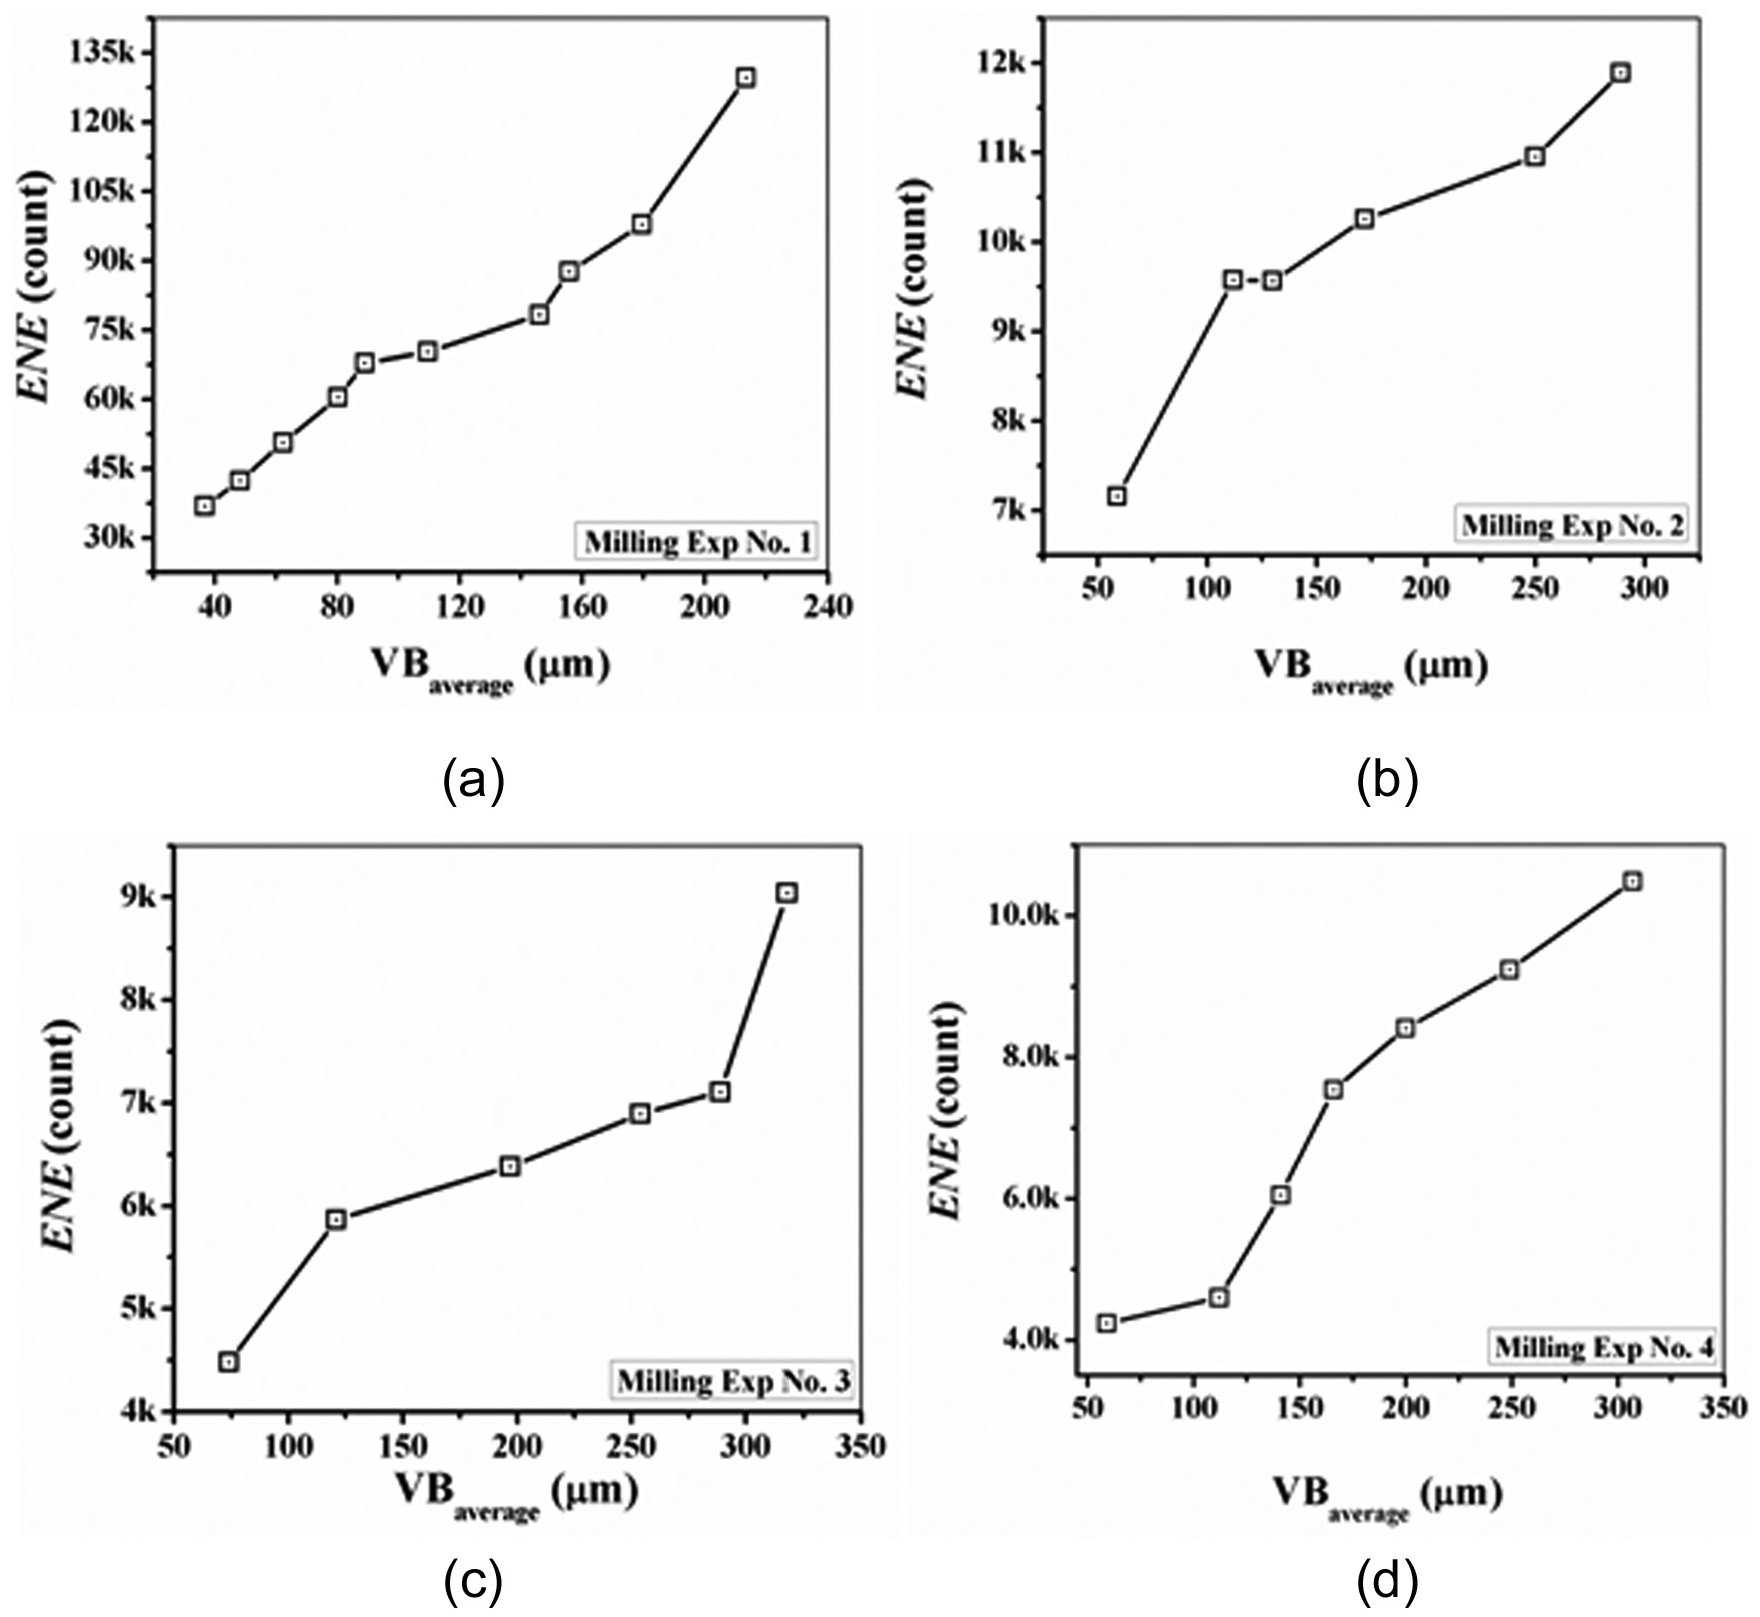
Plots of ENE with VBaverage for (a) Exp no. 1, (b) Exp no. 2, (c) Exp no. 3, and (d) Exp no. 4.
After the extraction of four features, it is needed to feed them into SVMR models for prediction purpose. Therefore, proper kernel selection to build the prediction models is required. For this purpose, correlation parameter, coefficient of determination (R2) values for the correlation between each of the extracted features and measured VBaverage are evaluated. The obtained values by evaluating the correlations of CON, SDM, RMS and ENE with measured VBaverage are shown in Table 3.
R 2 values for correlation of all the extracted features with measured VBaverage.
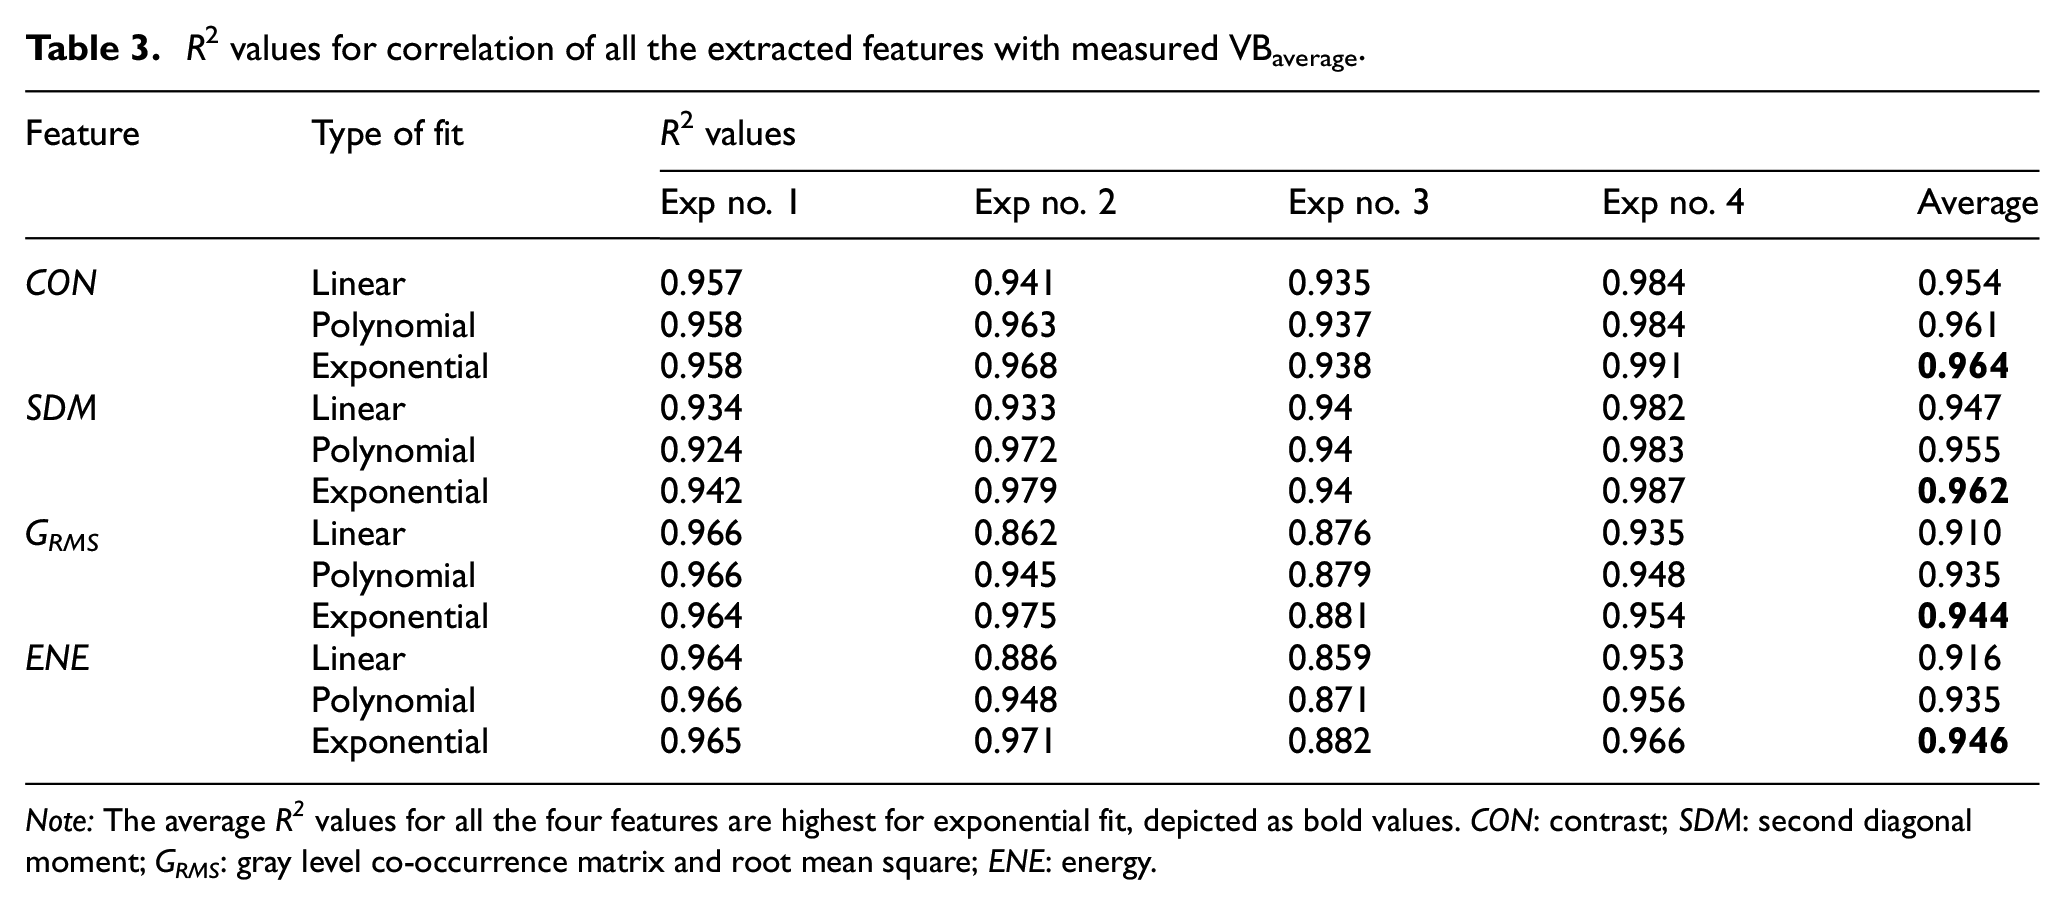
Note: The average R2 values for all the four features are highest for exponential fit, depicted as bold values. CON: contrast; SDM: second diagonal moment; GRMS: gray level co-occurrence matrix and root mean square; ENE: energy.
It can be depicted from Table 3 that the average R2 values for all the four features are highest for exponential fit, which are shown in bold at Table 3. Therefore, these extracted features have best exponential correlation with measured VBaverage. Due to this reason, RBF kernel, as the RBF kernel is of exponential nature, is selected in this work for SVMR analysis.
The expression of RBF kernel

where
At the time of building the ε-support vector (SV) regression model with RBF kernel, the selection of
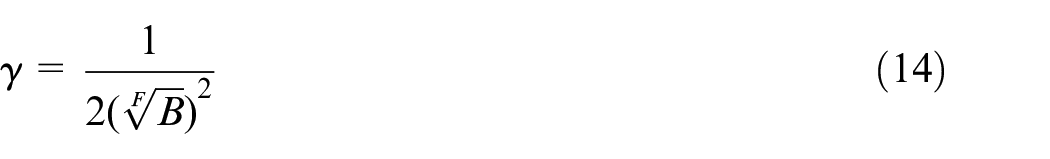
where F is the dimension of input feature vector or number of input variables and B∼0.2–0.5.
The model parameters and correlation coefficients of SVMR adopted are shown in Table 4.
Model parameters and correlation results of SVMR adopted.
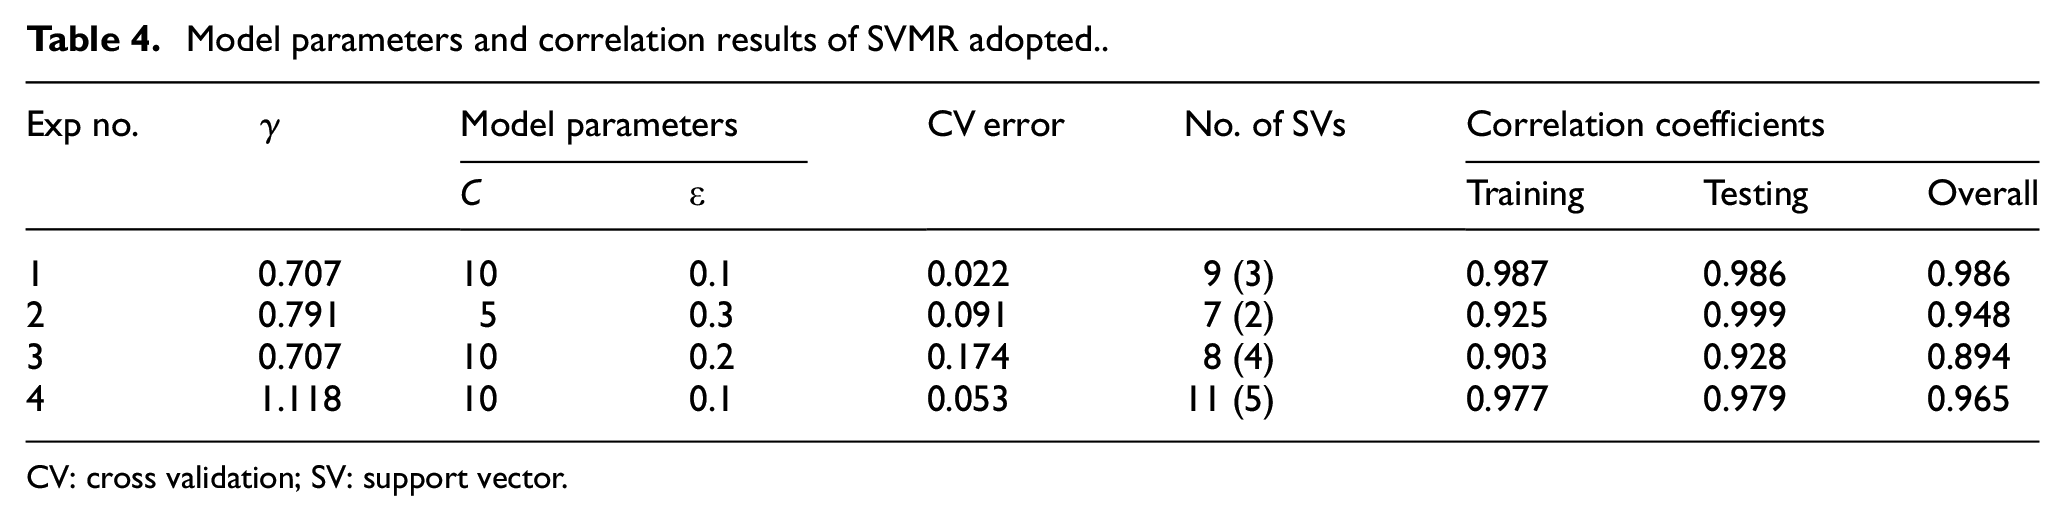
CV: cross validation; SV: support vector.
All the overall correlation coefficients for prediction are above 0.85 with low error bound
Prediction results.
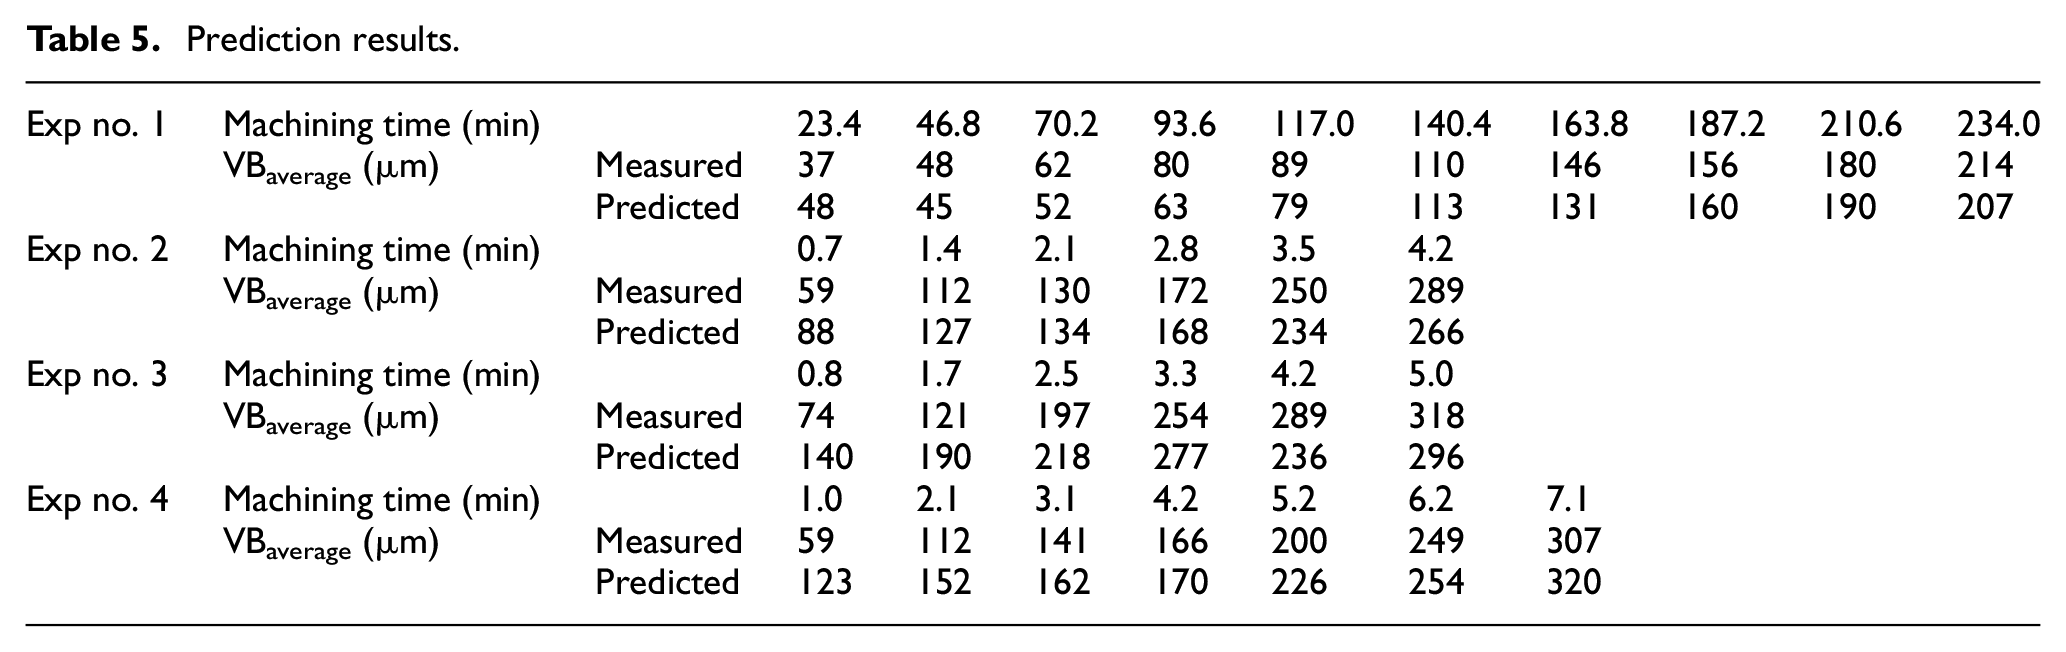
It can be depicted from Table 5 that the prediction results are good except for experiment numbers 1 and 3. A small drop of predicted tool flank wear value occurs, that is, from 48 µm at machining time 23.4 min to 45 µm at machining time 46.8 min. However, this drop occurs at the preliminary stage of wear whose effect is very less for the quality of machined surface. Therefore, this cannot be considered as very high discrepancy in this prediction process. In Exp no. 3, the predicted tool flank wear value is found to be reduced, that is, 236 µm at the machining time of 4.2 min compared to the tool flank wear value of 277 µm at 3.3 min machining time. This is due to the presence of variability in the data. However, the average correlation of predicted VBaverage with actual VBaverage is 0.948 (or 94.8%) with ±0.039 (or ±3.9%) standard deviation. Therefore, the SVMR models with the extracted texture features can be adopted for applying machine vision in offline TCM of end milling.
Conclusion
An offline TCM of end milling using image processing and SVM techniques is presented in this article. Here, end milling was performed with both coated carbide and HSS end mill cutter using two different machine tools and by varying machining conditions. End-milled surface images were captured using an optical microscope due to very small area of machined surface. These captured images are then analyzed by GLCM-based and DWT-based texture analysis techniques for extracting waviness and roughness information, respectively. Total four texture features, CON and SDM from GLCM analysis and GRMS and ENE from DWT-based analysis, are then extracted from machined surface images. Increasing trends of all these features with the increase in average tool flank wear are observed for all the experiments. Selection of proper mother wavelet and its decomposition level is utilized to obtain precise results which have a correlation of 94.8% with ±3.9% standard deviation between predicted and measured tool flank wear values. Exponential correlation of all these four features with VBaverage is found. Therefore, RBF kernel is adopted as the kernel of SVMR model for predicting tool flank wear using the extracted surface texture features. Prediction of progressive VBaverage with an average correlation of 94.8% with ±3.9% standard deviation is achieved, finally, using this machine vision–based TCM technique.
Footnotes
Declaration of conflicting interests
The author(s) declared no potential conflicts of interest with respect to the research, authorship and/or publication of this article.
Funding
The author(s) received the following financial support for the research, authorship, and/or publication of this article: This work was funded by Council of Scientific and Industrial Research (CSIR) with project number PSC-0111. Steel Technology Centre, Indian Institute of Technology Kharagpur, has also given support to this work. The authors also acknowledge Manufacturing Science and Technology Group of CSIR-Central Mechanical Engineering Research Institute, Durgapur, for the immense support in this work.