
Abstract
In this article, the single-point incremental forming of sheet metals made of micro-alloyed steel and Al alloy is investigated by combining the results of numerical simulation and experimental characterization, performed during the process, as well as on the final product. A finite element model was developed to perform the process simulation, based on an explicit dynamic time integration scheme. The finite element outcomes were validated by comparison with experimental results. In particular, forming forces during the process, as well as the final shape and strain distribution on the finished component, were measured. The obtained results showed the capability of the finite element modelling to predict the material deformation process. This can be considered as a starting point for the reliable definition of the single-point incremental forming process parameters, thus avoiding expensive trial-and-error approaches, based on extensive experimental campaigns, with beneficial effects on production time.
Keywords
Introduction
Incremental sheet forming (ISF) is gaining a significant niche among sheet metal processes, due to the growing interest in manufacturing for customization. The process is based on the progressive local plastic deformation produced by a rigid tool equipped with a smooth head (indenter), pressed against the metal sheet and guided by a robot arm or by computer numerical control (CNC) machine along specific paths, whose envelope define the final geometry. The possibility of forming sheet metals without the need of specialized dies is advantageous for producing small batches of products or even single parts. The potential impact of the technology has been extensively recognized, and the interest in its practical applications has steadily grown over the last 25 years. Hagan and Jeswiet 1 showed the potential impact of this technique for rapid prototyping applications. A comprehensive review of the process development has been provided by Jeswiet et al., 2 covering most variants of ISF that have been explored. This article has pointed out the well-established knowledge of the technique, which can be translated into guidelines for manufacturing designer. However, some challenging open issues have been highlighted such as, in particular, the control of the final part accuracy, the complex deformation mechanisms influencing the forming limit of the metal, the control of forming force and the potentiality of finite element (FE) analysis as a design tool.
Single-point incremental forming (SPIF) and, to a lesser extent, two-point incremental forming (TPIF) suffer from the difficulty to control the final part accuracy. Several experimental, numerical and analytical studies have been tried to assess this crucial point of the technology. Ambrogio et al. 3 discussed the discrepancies between designed surfaces and the obtained ones, suggesting the use of FE modelling as an effective approach for defining optimized tool trajectories. Micari et al. 4 proposed some strategies to improve accuracy, thus emphasizing the promising perspective offered by the definition of optimized tool trajectories. Ambrogio et al. 5 presented an interesting statistical analysis aiming at studying principal parameters influencing the material springback. To overcome this problem, Bambach et al. 6 investigated a multistage forming strategy coupled with stress relief annealing. In order to enhance the practical applications of the technique, Ambrogio et al. 7 investigated the suitability of very high feed rates to strongly reduce processing time. Malhotra et al. 8 presented an adaptive method for three-dimensional (3D) definition of the tool path with variable incremental depth aimed at improving part accuracy. Recently, Zemin et al., 9 Behera et al. 10 and Lu et al. 11 have worked on tool path generation strategies and path correction algorithms, which seem to be very effective for improving the accuracy of the final piece.
The effort towards an improvement of geometrical accuracy up to a level comparable with that typical of final products in the industry standard has been supported by the extensive research on deformation mechanisms. Some aspects of the deformation processes occurring in traditional sheet metal forming can be identified also in the SPIF process, such as, for example, springback phenomena or the conditions of plastic strain localization, influencing the sheets thinning and the onset of forming cracks. However, despite extensive research over the last decades, the deformation mechanism is not fully understood yet: the analysis is more complex for SPIF processes than for traditional sheet forming techniques, being the process based on an accumulation of numerous incremental deformation passes, depending on several factors not easily implemented in a theoretical formulation of the problem. The use of data and information on materials behaviours obtained for traditional sheets forming is questionable. It is currently accepted that conventional forming limit curves cannot be used for the ISF process. Higher critical strains may be achieved in ISF than in traditional processes, due to the complex local strain phenomena, including sheets stretching, bending deformation and transversal shear flow of material. Kim and Yang 12 suggested that sheet deforms by means of dominant shear deformation and proposed a double-pass strategy to improve formability. Filice et al. 13 proposed an experimental approach to build up the forming limit curves of the process, thus showing the much higher level of deformation that can be achieved during SPIF as compared to traditional forming processes. Ham and Jeswiet 14 used a design of experiment (DOE) approach to develop a set of response surfaces for different aluminium alloys, in order to define the limit of the process as a function of different technical parameters. Martins et al. 15 proposed a theoretical model based on membrane analysis, trying to explain the experimental evidence that fracture cracks propagate under tensile meridional stress, thus giving an interpretation of the enhanced formability of sheets as a retardation in the onset of necking. Jackson and Allwood 16 carried out an interesting experimental analysis showing that deformation mechanisms are due to stretching and shear in the radial axial plane as well as shear in the tool direction due to friction. Hussain et al. 17 carried out an extensive experimental campaign on different materials to show the major material properties influencing SPIF. Silva et al. 18 stated the inapplicability of forming limit diagrams to describe deformation and failure and proposed the use of fracture forming limit diagram, considering that neck formation is suppressed in SPIF and fracture takes place at the onset of cracks normal to the stretching direction under tensile meridional stresses. Based on the observations of different forming limits, Duflou et al. 19 have proposed the multipass forming, to avoid damage localization at critical geometrical details, thus enhancing the process window, especially as regard the maximum achievable inclination of the surfaces after forming. Directly correlated to sheet formability is the control of the force which influences the scale of the local plastic deformation, as well as the design of tooling and fixtures, and also the choice of the machinery to be used. Aerens et al. 20 carried out a systematic analysis on five different materials, finding regression formulae for computing the axial and tangential forces during forming. By considering the correlation between forming forces and the strain localization, Ambrogio et al. 21 suggested to measure forming forces as failure predictor. A similar conclusion was proposed also by Duflou et al. 22
The knowledge of all these aspects is necessary for the setting of the process parameters, which is usually tackled and partially solved by trial-and-error approaches based on extensive experimental campaigns. From this point of view, SPIF seems to be more versatile and flexible than conventional processes: no matrix dies need to be redesigned, but only the computer-aided manufacturing (CAM) programme running on the controlling machine can be modified step by step. For this purpose, in order to efficiently predict the process outcome, numerical approaches based on FE simulations have been frequently considered. In conventional sheet forming processes, FE has been successfully adopted for several applications. The ISF process simulation is more difficult and some crucial points still need to be solved: the sequential tool trajectory produces quite complex plastic strain histories leading to a progressive and heterogeneous strain accumulation in different regions of the sheet, up to the achievement of the final geometry. The FE simulation is highly nonlinear and strongly dependent on the time variable. Under these conditions, a critical point of the simulation is represented by the computational cost since, if compared with conventional processes, the modelling of tool paths requires an extensive computation time and requires to take into account fast dynamic effects.
Iseki 23 showed the capability of a simplified FE approach to predict bulging of sheet metals. He et al. 24 published an application of FE for incremental forming of aluminium sheets using an implicit integration scheme. They obtained interesting results in terms of final geometry reproduction and a certain overestimation of the forming forces. Henrard et al. 25 proposed to use a dynamic explicit time integration scheme both using brick and shell elements. As for He et al., 24 they also observed a certain overestimation of vertical forces. Shell elements were found to be more efficient for process simulation. Flores et al. 26 showed the importance of the identification of yield locus and hardening rule to be implemented in the FE code. Using a dynamic explicit integration scheme with mass scaling, Yamashita et al. 27 successfully studied the strain histories produced by different tool paths, thus proving the powerfulness of the numerical approach. Dejardin et al. 28 suggested that the use of 3D reduced shell elements, with adaptive mesh refinement and explicit integration scheme, can be a very efficient modelling approach. Hadoush and Van den Boogaard 29 proposed a mixed approach to improve the efficiency of implicit solution strategy, accounting for the strong nonlinearity in the vicinity of the tool and the weak nonlinearity in the rest of the model. Nguyen et al. 30 used a combination of CAM and explicit FE simulation for the production of complex shapes.
About forming force prediction by FE analysis, Henrard et al. 31 recently published a benchmark analysis between two different FE codes and between brick and shell elements. Sena et al. 32 also performed a benchmark analysis considering different solid elements and found that the number of integration points in thickness direction is a crucial parameter for improving process simulation results. In general, a common agreement on the most effective way to perform FE analysis of SPIF has not been reached yet.
In this context, this work is aimed at studying the SPIF process for two-sheet metals. For this purpose, a numerical and experimental approach was adopted, based on the development of a FE model able to simulate the entire tool trajectory during the forming process. The computational model was implemented and validated by a specific experimental investigation covering both mechanical characterization of the sheet metals and the production of sample geometry on a workbench specifically developed. Numerical and experimental results are compared on the basis of forming forces exerted by the tool during the process, as well as of measurements taken on the final geometry. The geometrical accuracy, the strain distribution and consequently the sheet thinning were studied in correspondence to the most critical geometrical details. The validated computational model forms the basis of a method for the reliable definition of the process parameters, in order to efficiently manufacture parts characterized by complex geometries.
Materials
This study is focused on two different alloys: the S355MC micro-alloyed steel extensively used in the automotive industry, which was delivered in the form of sheets with 1.0 mm thickness, and the AA5182 Al alloy delivered in the form of sheets with 1.2 mm thickness.
Due to the low content in C as alloying element, S355MC presents a ferritic microstructure with some evidence of cementite along the grain boundary. For the AA5182, the microstructure is characterized by a uniform distribution of intermetallic precipitates such as Al3 (Fe, Mn) and Al4 (Fe, Mn) and an average grain size of 18 µm. 33
In order to identify the anisotropy introduced by the lamination process, the tensile properties of the material were determined on hourglass specimens with 100-mm gauge length, manufactured from the metal sheet, along directions oriented at angles of 0°, 45° and 90° with respect to the rolling direction.
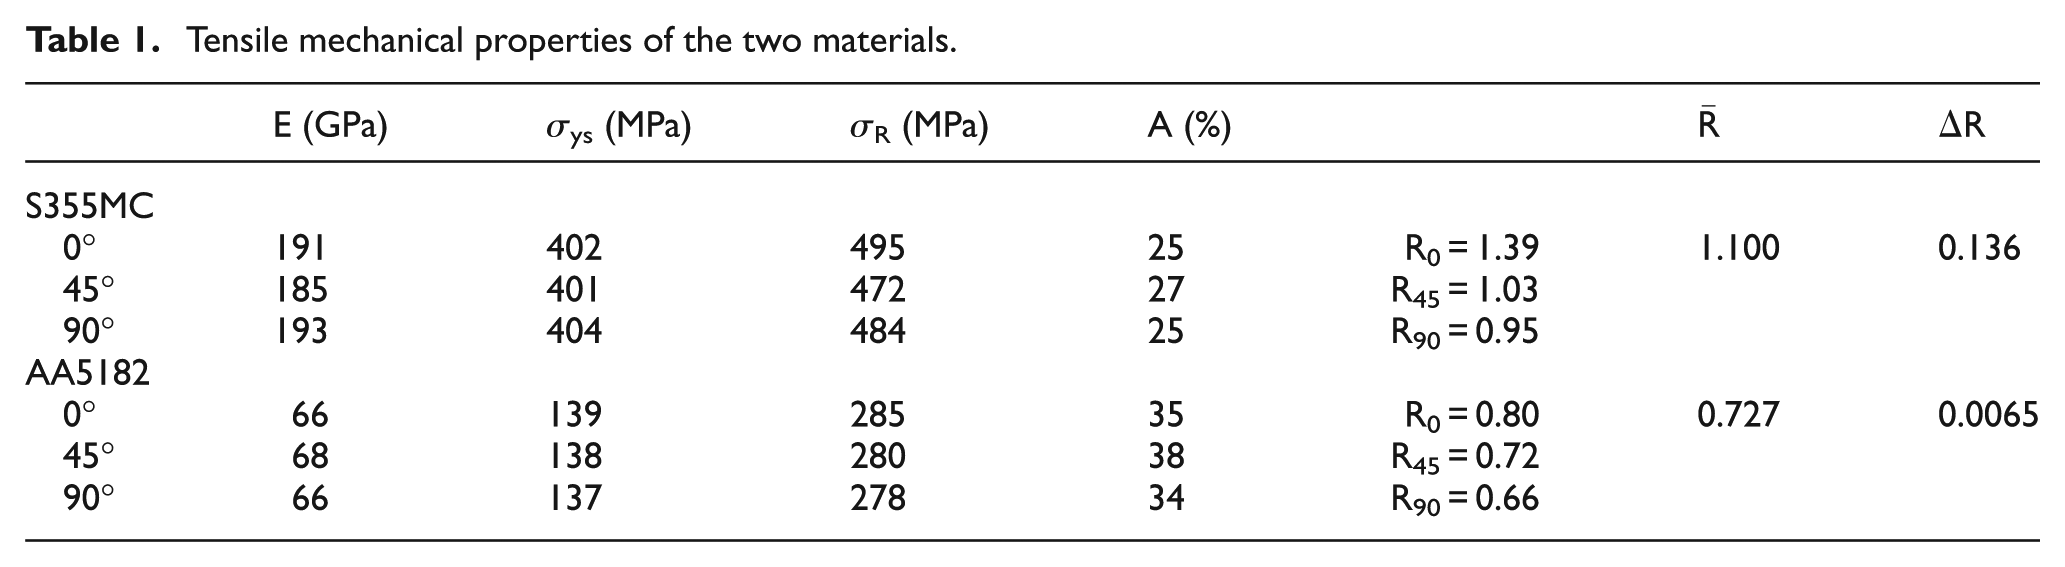
Tensile tests were carried out on a servo-hydraulic testing machine (Instron 8516 – 100 kN), following ISO 6892-1 standard specifications. 34 Five tests were carried out for each cutting orientation. Representative tensile curves of the two alloys are plotted in Figures 1 and 2, whereas mean values of material parameters obtained from the analysis of tensile data are summarized in Table 1.
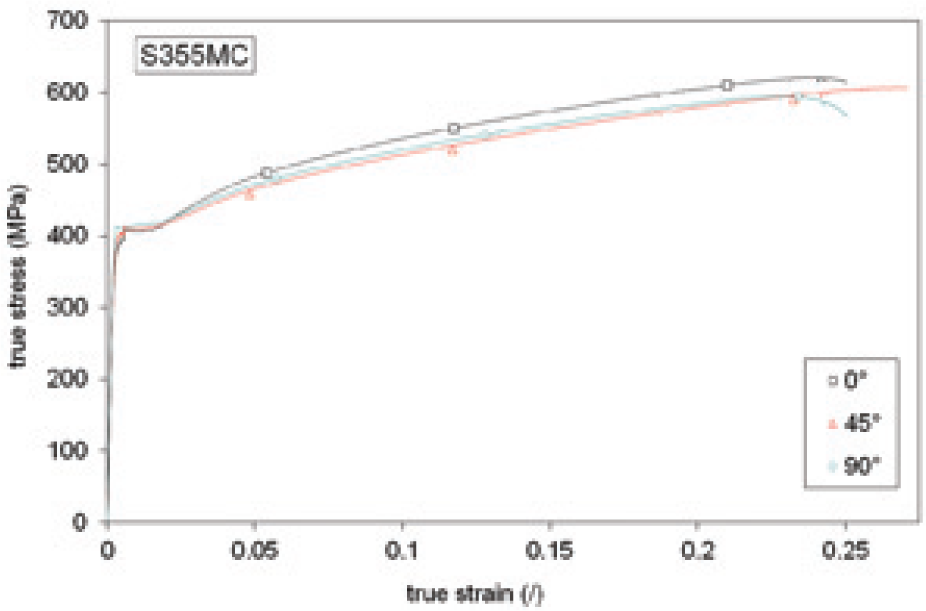
S355MC: true stress–true strain curves.
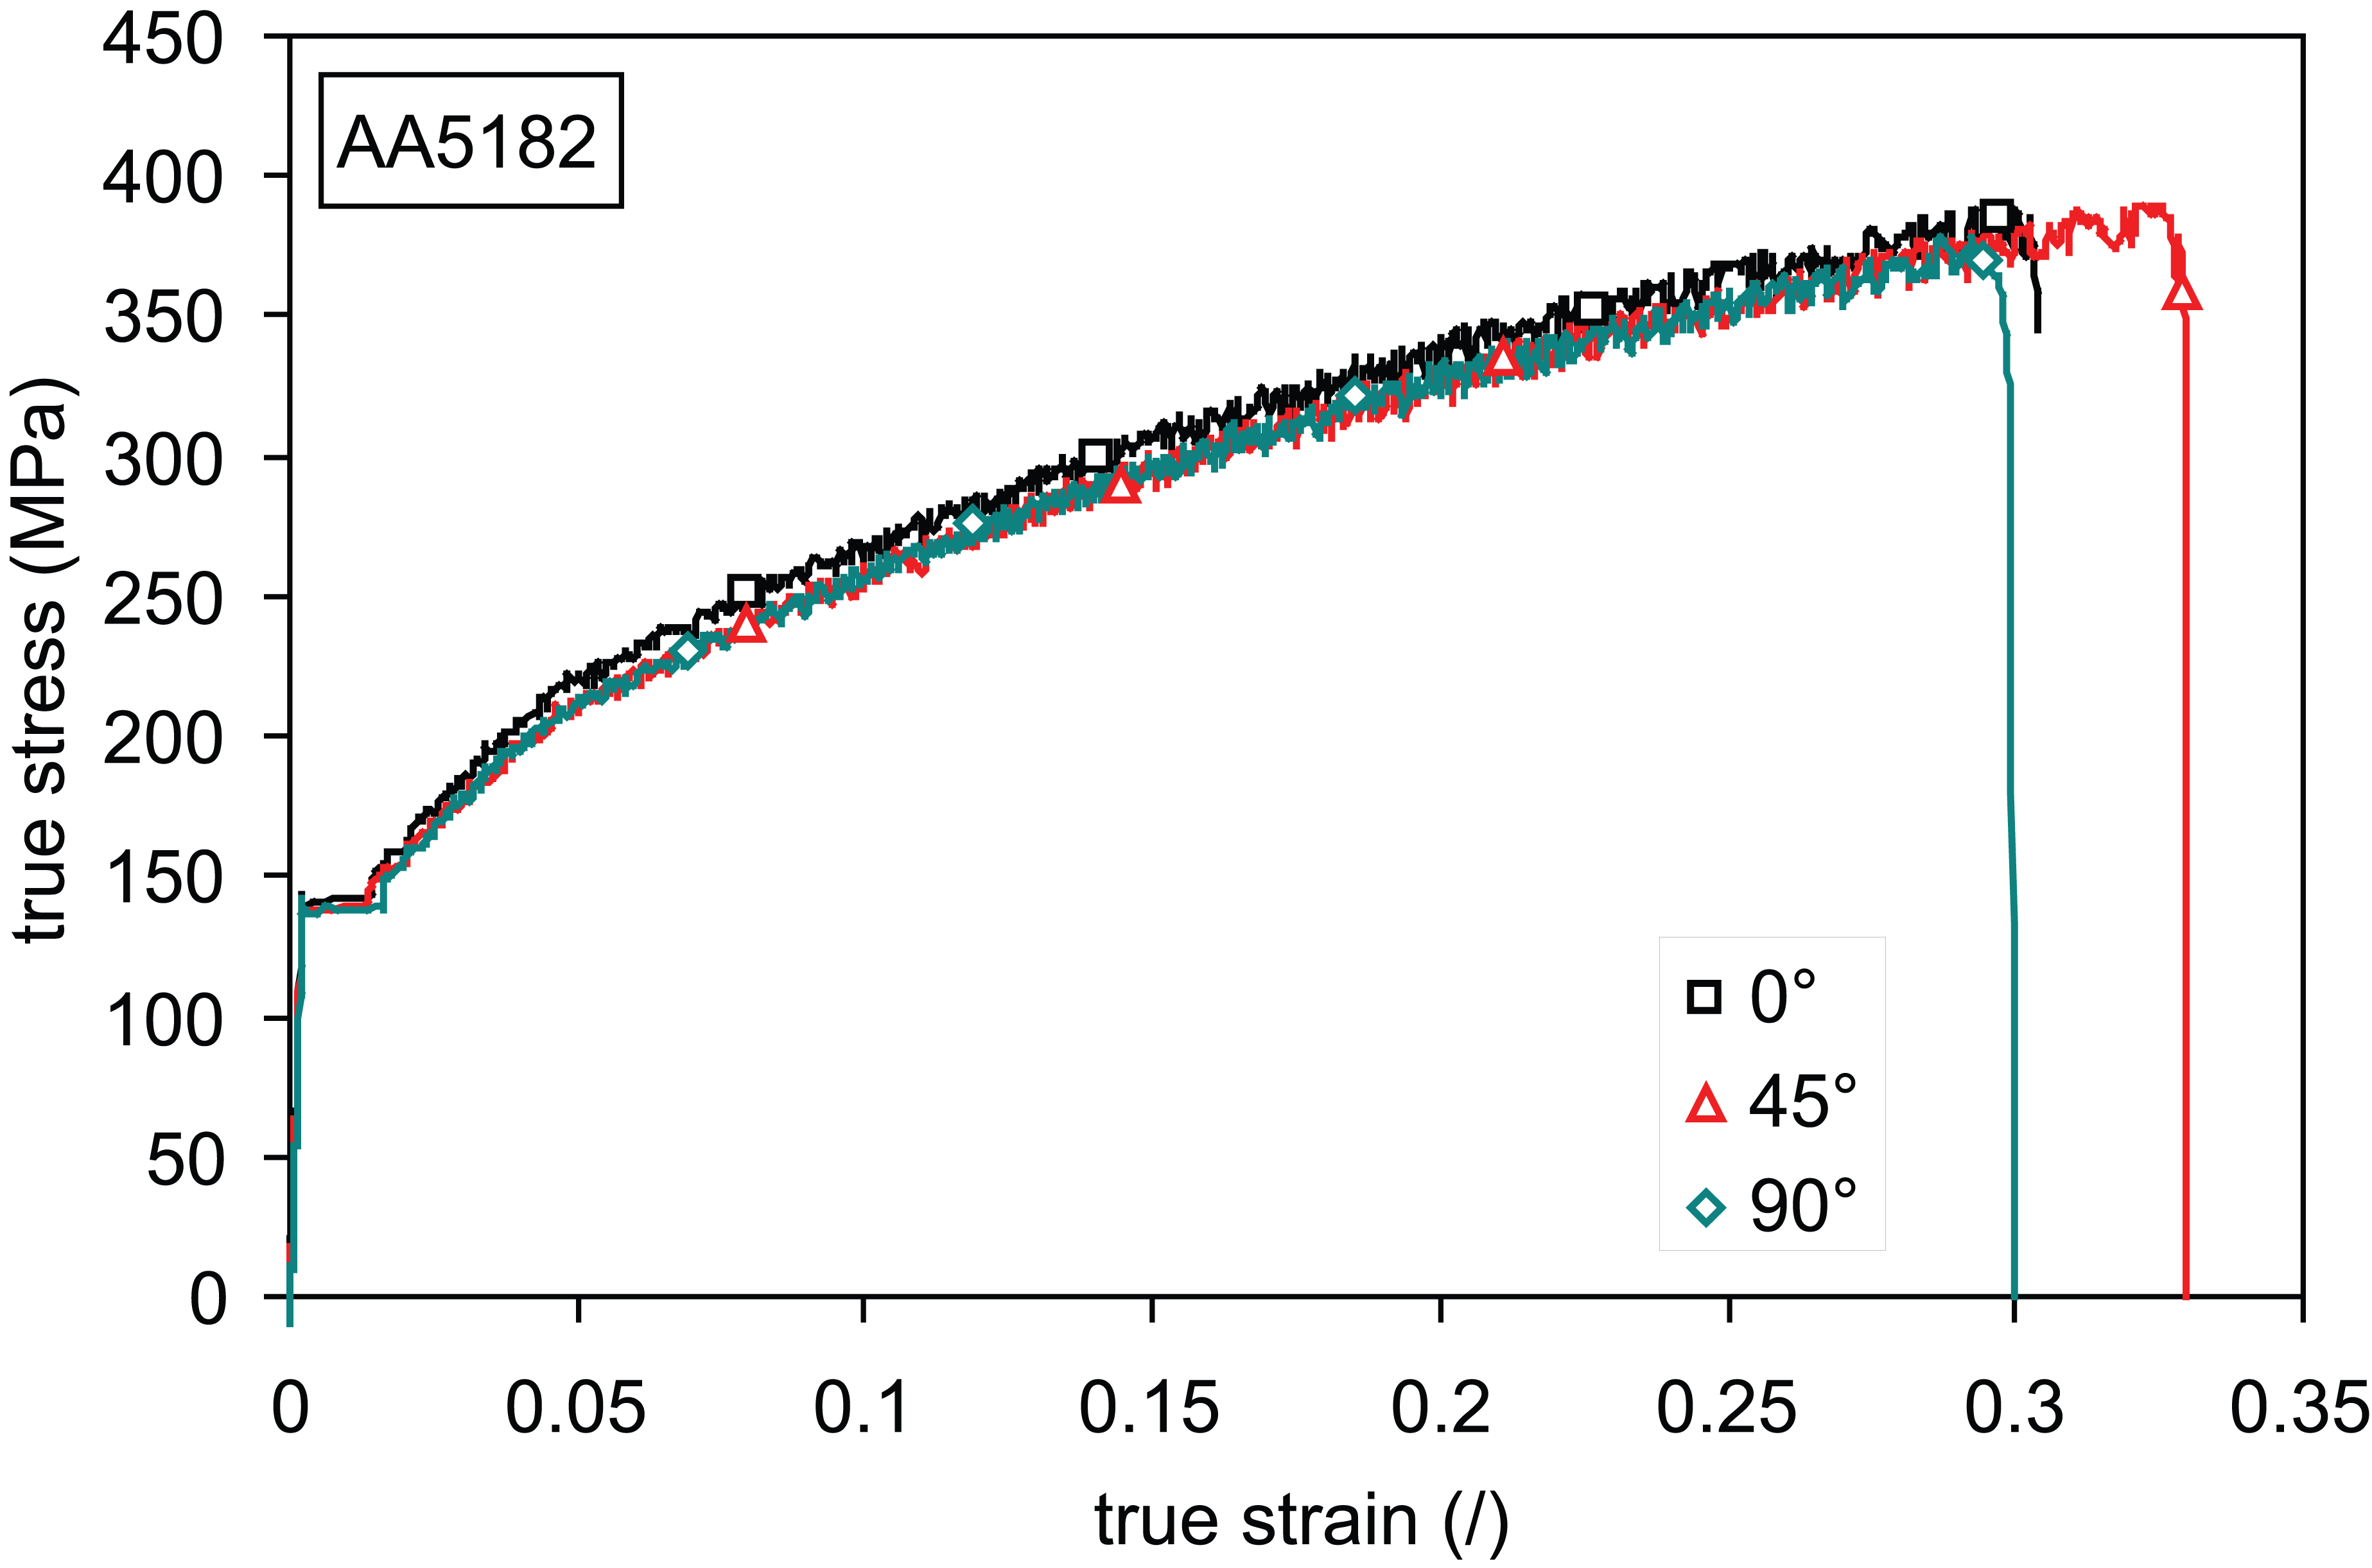
AA5182: true stress–true strain curves.
Tensile mechanical properties of the two materials.
Parameters
Incremental forming conditions
The incremental forming tests were performed on a testing workbench specifically developed for forming sheets with thickness up to 10 mm and rectangular areas with sides up to a maximum length of 1100 mm. An anthropomorphic robot arm (Comau NJ 370-2.7) carrying a punch with hemispherical head (10 mm by diameter) was used for the execution of the forming operations. The experimental set-up is shown in Figure 3.
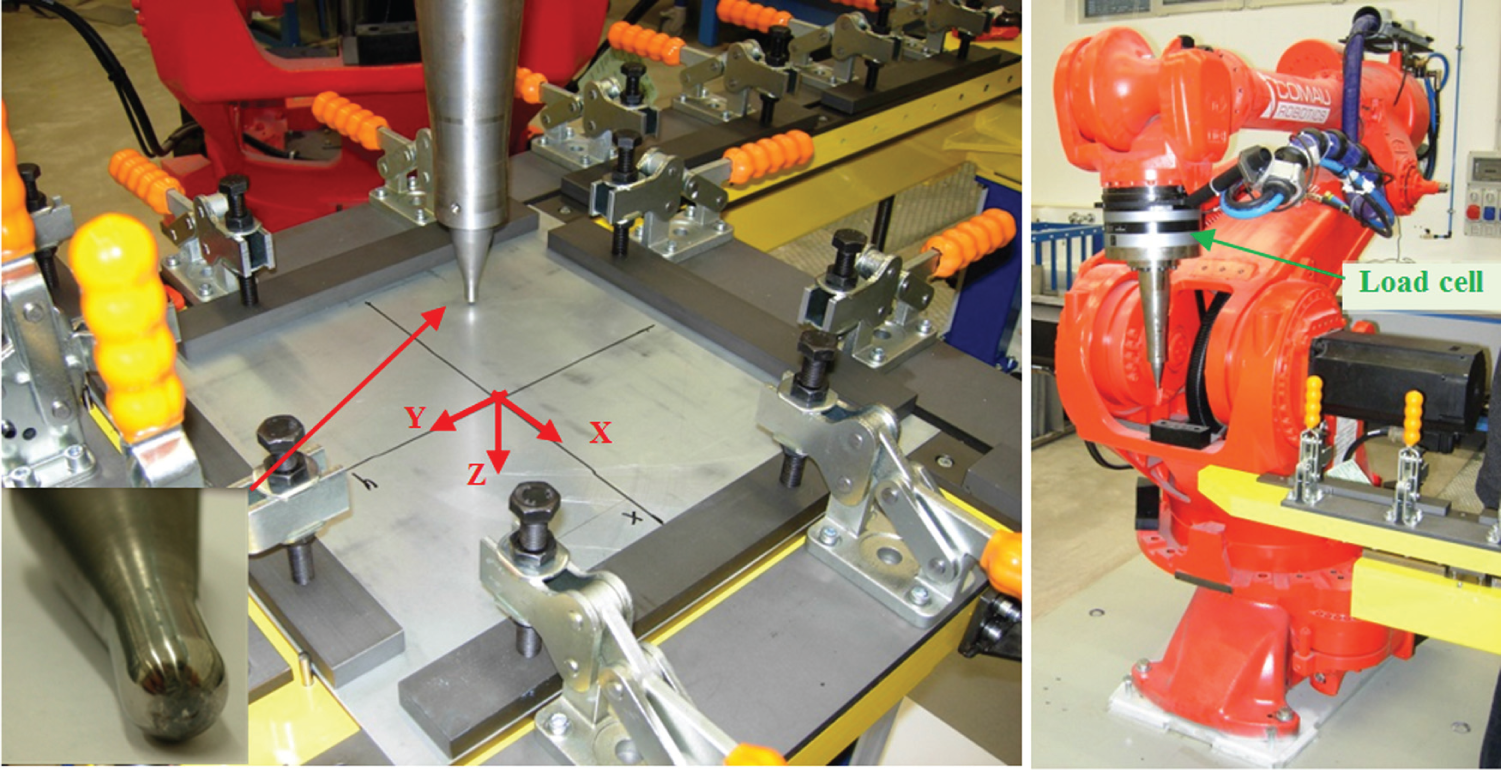
Experimental set-up for the ISF.
The manufacturing sequence was generated using the PowerMill® CAM software. The load cell DSP-905-3AX, mounted on the robot arm in series with the punch, was used to measure the three force components, namely, Fx, Fy and Fz (see for reference the triad represented in Figure 3), exerted by the tool, when moving on the sheet during the forming process.
In this work, a basin in the shape of a truncated pyramid was produced with a depth of 30mm and rectangular bases having sides dimensions, respectively, of 212 mm × 132 mm at the upper border and of 118mm × 30mm at the bottom face. The inclination of the oblique faces resulted of 57.5° with respect of the symmetry planes of the tray.
The tool covered a rectangular spiral–helix, called spiral path, moving gradually downwards and towards the centre of the tray, thus producing an axial pitch of 0.5 mm (z-direction) and a shift towards the centre by 0.78 mm at the end of each round. The forward speed was fixed to 0.025 m/s, and the tool was mounted free to spin around its axis. The contact between tool and sheet was lubricated. The entire manufacturing took a time of nearly 20 min. A sketch of the path is shown in Figure 4. Four tests were carried out for each of the two alloys, in order to have a reasonable evaluation of the process repeatability.
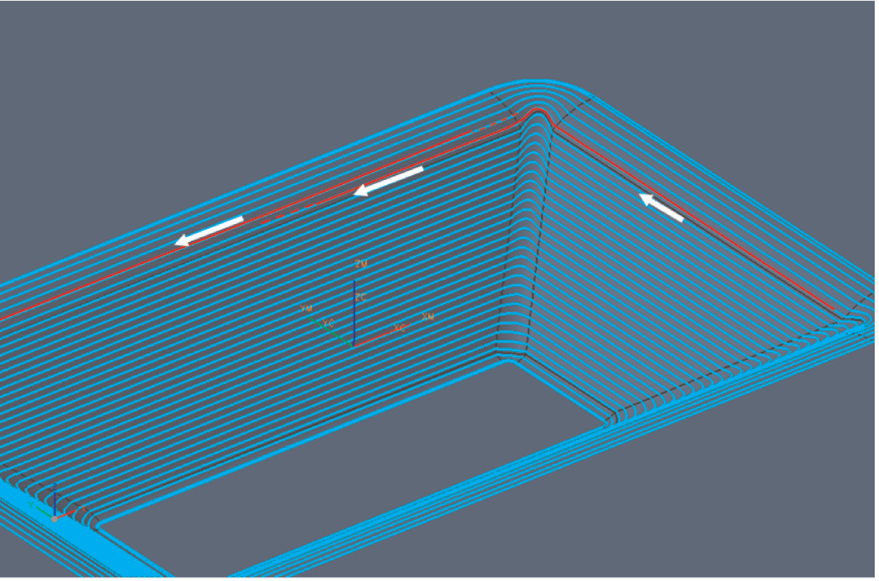
Spiral tool path.
Measurements and experimental characterization
The automated strain analysis and measurement environment (ASAME) method, 35 based on a digital image correlation technique, was adopted to determine the final geometry of the part. For this purpose, a square grid was printed on the sheet before starting the forming operations (Figure 5(a)). Incremental forming process produced a grid distortion as shown in Figure 5(b). The software is able to perform the image correlation among several pictures of the investigated region, taken from different angular positions. This way, the spatial coordinates of the crossing points of perpendicular grid lines can be determined. Different methods can be adopted for the digital reconstruction of the final shape. One of them takes advantage of a reference gridded sample (e.g. a cube) and does not require the exact knowledge of the camera position with respect to the sheet (Figure 5(b)). By comparing the initial square with the deformed one, the local strain after forming can be calculated. The corresponding sheet thinning can be deduced. The accuracy in the estimation of grid dimension is claimed to be around 0.01 mm. For the present analysis, the most critical points, where the sheets thickness can be critical for the onset of forming cracks, were investigated; specifically, the attention was focussed on the bottom and upper corners of the tray (box frames in Figure 6(a)).
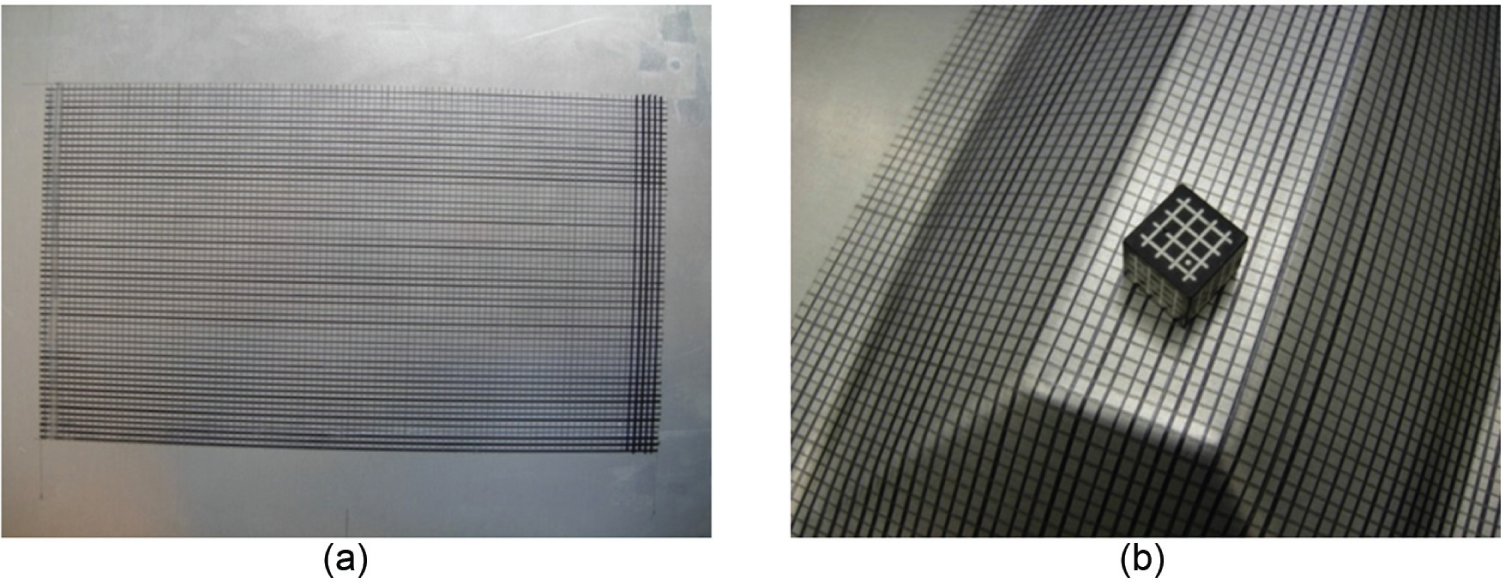
Grid printed on the sheet (a) before and (b) after manufacturing.

(a) Deformed grid (grid spacing 3.5 mm) and regions identified as critical for sheet thinning and strain localization and (b) scanning paths carried out with the CMM (Y1 = −15 mm, Y3 = +15 mm, X1 = −50 mm, X3 = +50 mm, in the depicted reference system).
In order to test the capability of the forming process, to accurately produce the theoretical geometry of the tray, several profiles were acquired using a coordinate measuring machine (CMM) by scanning the tray surface along different paths, as described in Figure 6(b).
FE analysis of the forming process
The FE simulation of the ISF process is particularly complicated since it involves highly nonlinear problems (large displacements, friction contact and plastic deformation of the material). Moreover, it is complicated to account for symmetry due to the onset of forces and displacements transverse to the symmetry planes. To this purpose, Henrard 36 suggested to introduce rotational instead of symmetry boundary conditions in the FE model. The analysis has, however, a very high computational cost because the entire time history of the forming process must be simulated. For all these reasons, although in the technical literature analyses based on an implicit formulation of the problem can be found, the simulation is very often carried out using an explicit dynamic approach since it guarantees convergence and allows to adopt the mass-scaling and time-scaling approaches for improving the computational efficiency of the analysis.
The very small ratio between the thickness and the other dimensions of the sheet suggests using shell elements, even though several authors consider the use of brick elements more appropriate to account for the not negligible transversal shear deformation in the material during the ISF process. The use of brick element introduces, however, some problems concerning the very unfavourable element aspect ratio and produces a significant increase in computation cost of the analysis, being the time step strictly influenced by the smallest element dimension.
In the present case, the entire sheet has been modelled using shell elements. The model was set up using the ABAQUS code: 37 four node shell (S4R) elements were adopted to model the sheet, whereas both four and three node shells (S4R and S3R) were used to model the rigid surfaces representing the tool. These elements use a Mindlin–Reissner type of flexural theory that includes transverse shear (thick shells). The shell formulation is that of finite-membrane strain; therefore, these elements can be used to perform large strain analyses. Moreover, the S4R and S3R elements use a reduced integration rule plus hourglass stabilization, through an hourglass control parameter.
The FE model of sheet and tool is represented in Figure 7. A convergence analysis suggested fixing the element dimensions to 2 mm, thus obtaining a good compromise between accuracy and computational cost. The hemispherical punch was modelled as a rigid body, whereas the sheet was modelled as an elastic–plastic material. The contact conditions were implemented using ‘surface to surface’ contact elements, in the hypothesis of asymmetric contact, in which the sheet metal and the tool are respectively the master and slave surfaces. Coulomb’s friction law with a friction coefficient equal to 0.1 was adopted, and this value is commonly assumed in well-lubricated sheet forming.
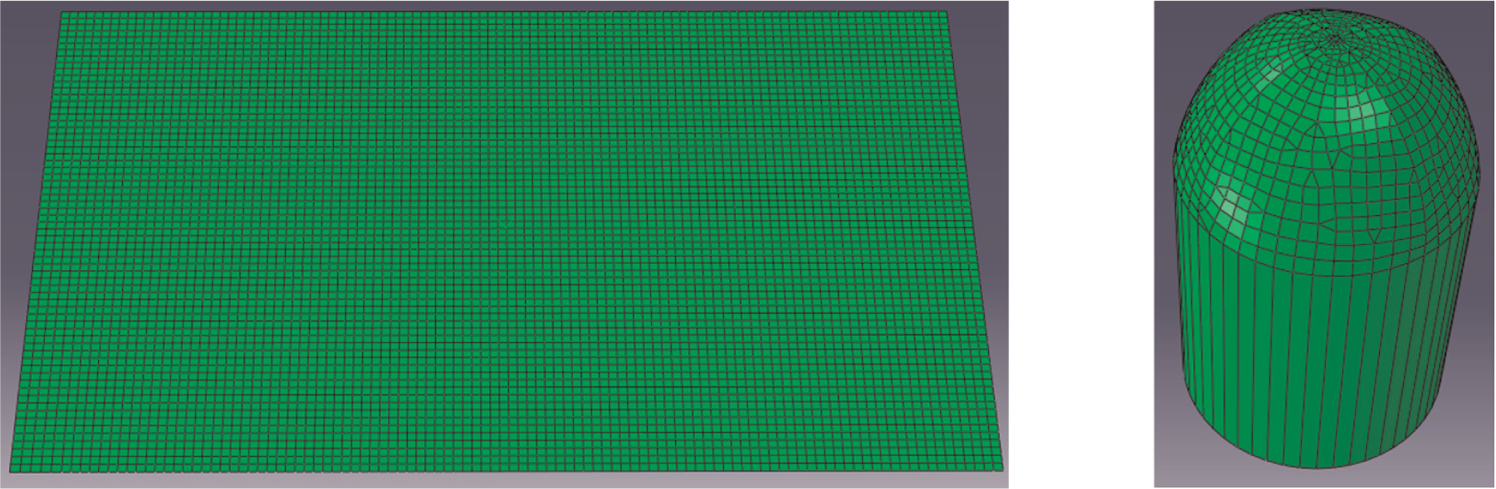
FE models of sheet and tool.
Constrained conditions were fixed after a preliminary static analysis based on a 3D model of the workbench, with blank holder clamping a rectangular sheet through pretensioned bolts as shown in Figure 8. Static loads have been applied in different positions of the sheet. The analysis carried out with ANSYS version 11.0 38 proved the acceptability of constraining 5 degrees of freedom at the sheet border, allowing free rotation about the axis parallel to the border. Negligible relative sliding between blank holder and sheet was observed at the clamped border.
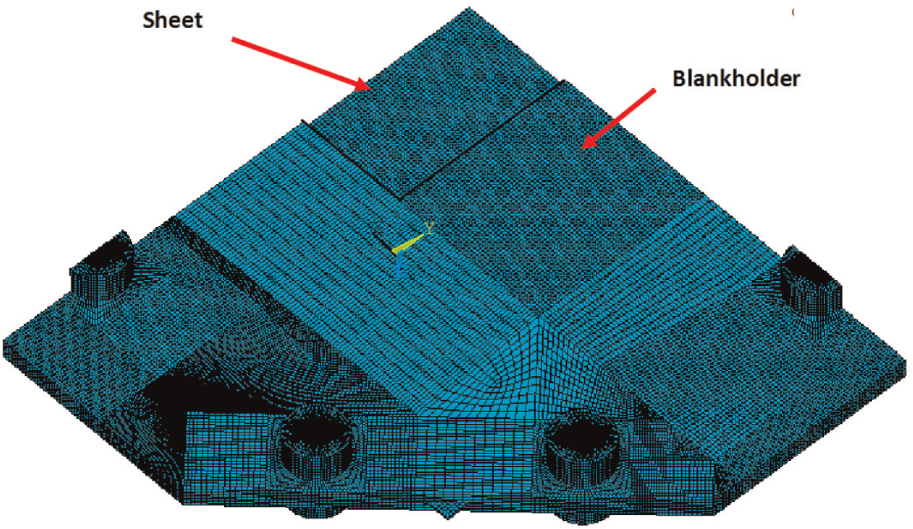
3D FE model of sheet and blank holder.
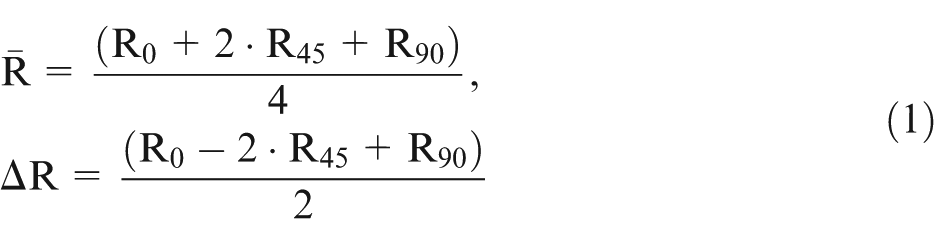
The material model is formulated on the basis of the Hill’s yielding criterion with an isotropic hardening rule. To account for the anisotropy, Hill’s criterion requires introducing the following coefficients
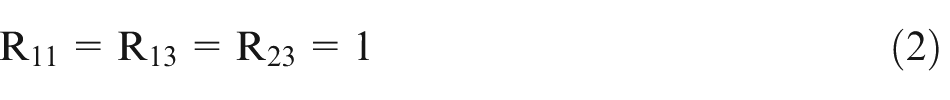
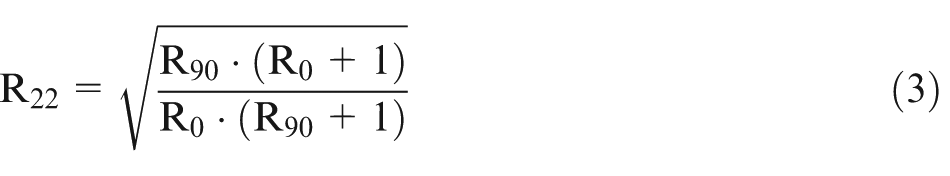
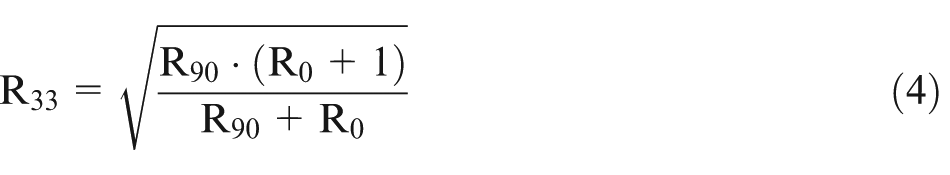
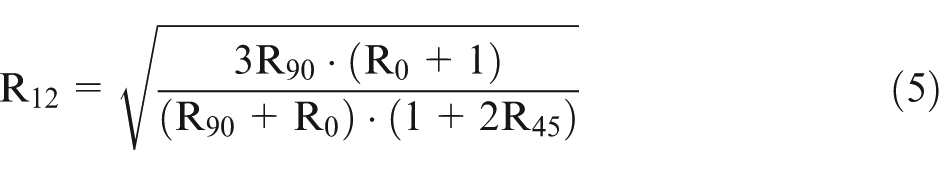
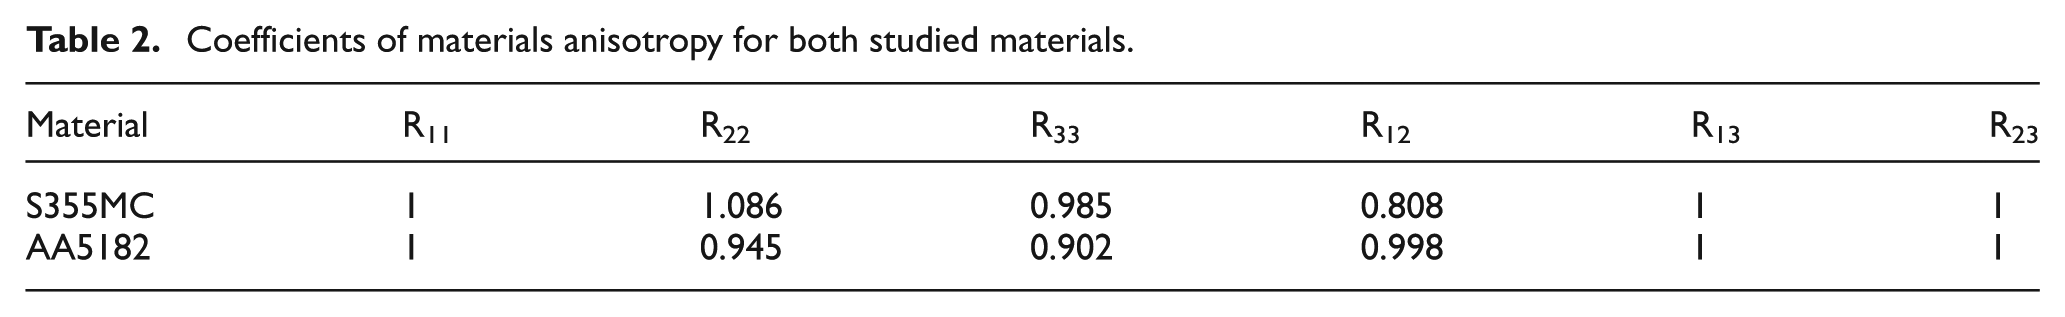
These coefficients can be calculated using the results of the experimental tensile tests on specimens taken along the directions inclined by 0°, 45° and 90° (Table 1) with respect to the lamination direction. In the present case, the values reported in Table 2 were found.
Coefficients of materials anisotropy for both studied materials.
The dynamic explicit approach allows the control of the minimum time step size by including mass scaling in the analysis. In fact, if the time step calculated by the software is too short, the density of the entire component or a set of elements can be adjusted to achieve a user-specified time step size so as to reduce the computational cost of the analysis. For the present problem, the calculated critical time step for both materials was nearly 3.9E−7 s, leading to unfeasible computing times. The mass-scaling factor of 0.65E4 was set by performing a sensitivity analysis, resulting in a fictitious time step of nearly 1.0E−5 s. Since the ratio between kinematic energy and total energy is always lower than 2%, this value can be considered acceptable. The FE analysis took a time of nearly 10 h using a CPU with 64-bit architecture, 3.33 GHz with 12-GB RAM.
The tool trajectory was implemented after reediting the input file produced by the CAM software used for moving the robot arm. The data were passed to the FE code as a sequence of tool positions versus time. The sequence of pictures shown in Figure 9 refers to several time steps of the simulation. An example of the final sheet thickness after forming is shown in Figure 10. Accounting for the inclination angle of the oblique faces, using the sine-law, which is based on the hypothesis of volume conservation, a sheet thickness of nearly 0.84 and 1.01 mm can be estimated for the S355MC and AA5182 samples, respectively. The residual sheet thicknesses shown in Figure 10 are reasonably correlated with these values, except near the tray edges, where a comparison cannot be performed.
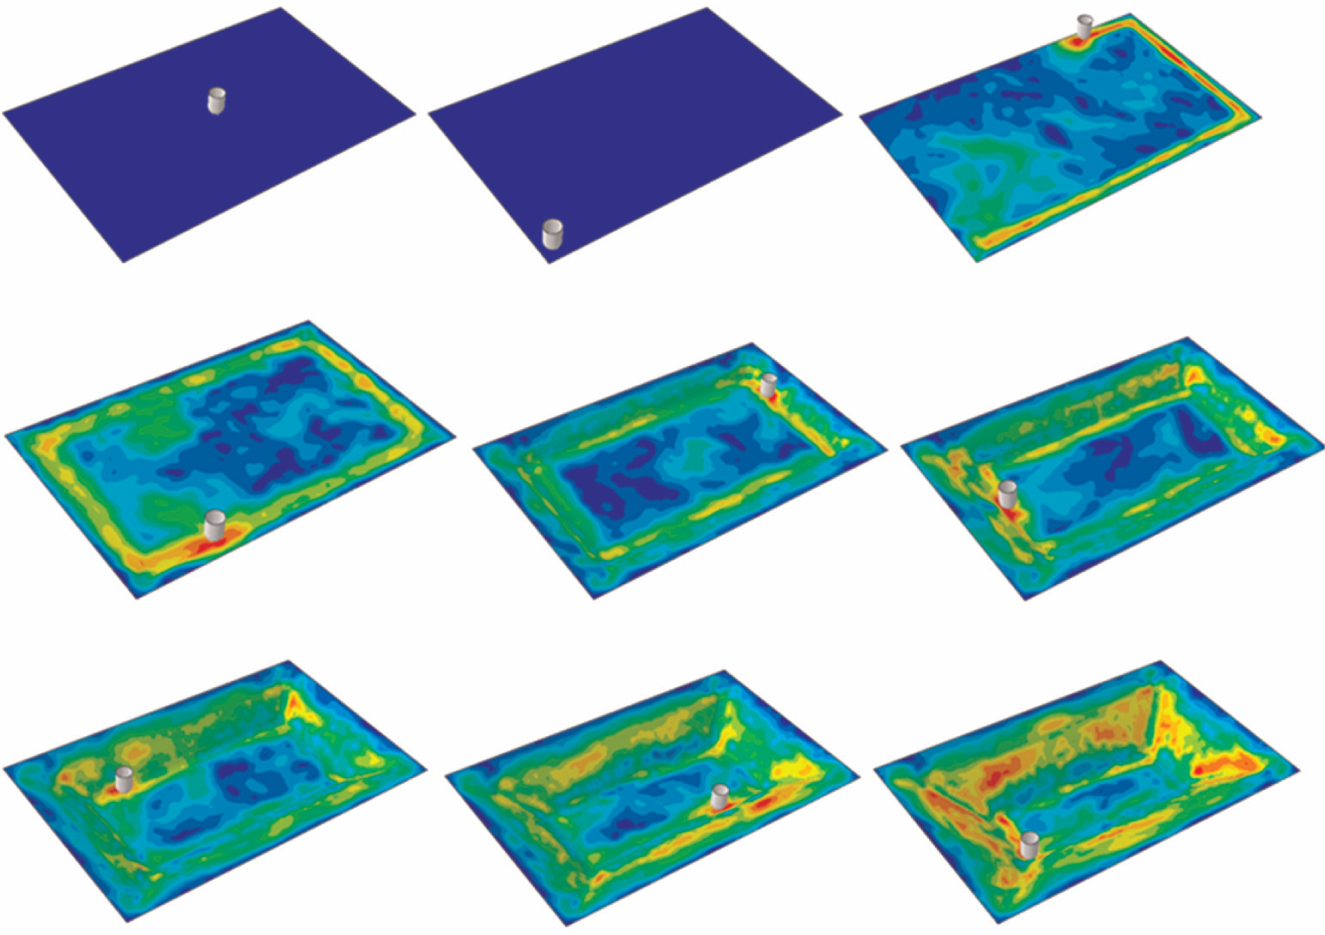
S355MC: different time steps of the punch spiral trajectory during the forming process (colour maps represent von Mises equivalent stress ranging from 0 to 550 MPa).
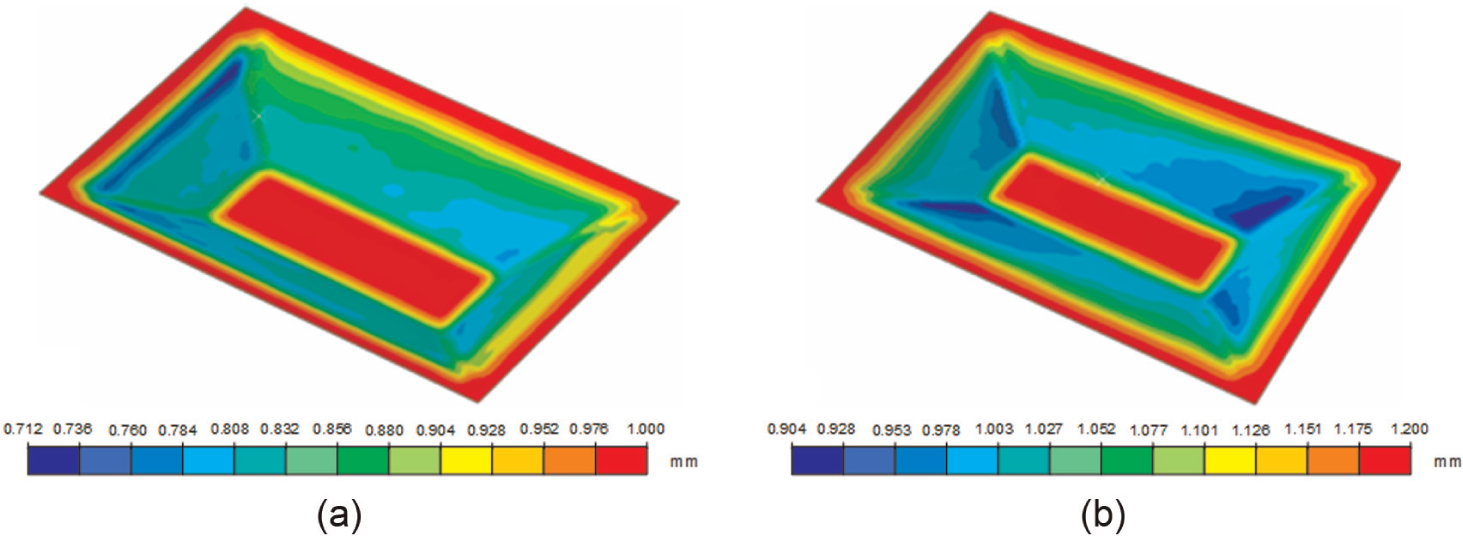
Residual sheet thickness after forming: (a) S335MC and (b) AA5182.
Validation of FE results and discussion
The FE model validation was performed comparing numerical results with experimental measurements. As explained in section ‘Measurements and experimental characterization’ (Figures 5 and 6), the local sheet strains produced in the trays processing can be estimated using the ASAME method. From these measurements, in the hypothesis of plastic deformation with volume conservation, the sheet thinning can be calculated also in the critical geometrical details. As discussed by Jackson and Allwood, 16 the hypothesis of volume conservation is reasonable in the typical ranges of plastic deformation occurring during SPIF. Local discrepancies can be observed in regions where damage localization occurs. A comparison between values of residual sheets thickness, determined by FE and ASAME, was carried out at five reference points as shown in Figure 11, forming a path in one of the two critical regions marked by the rectangular box depicted in Figure 6(a).
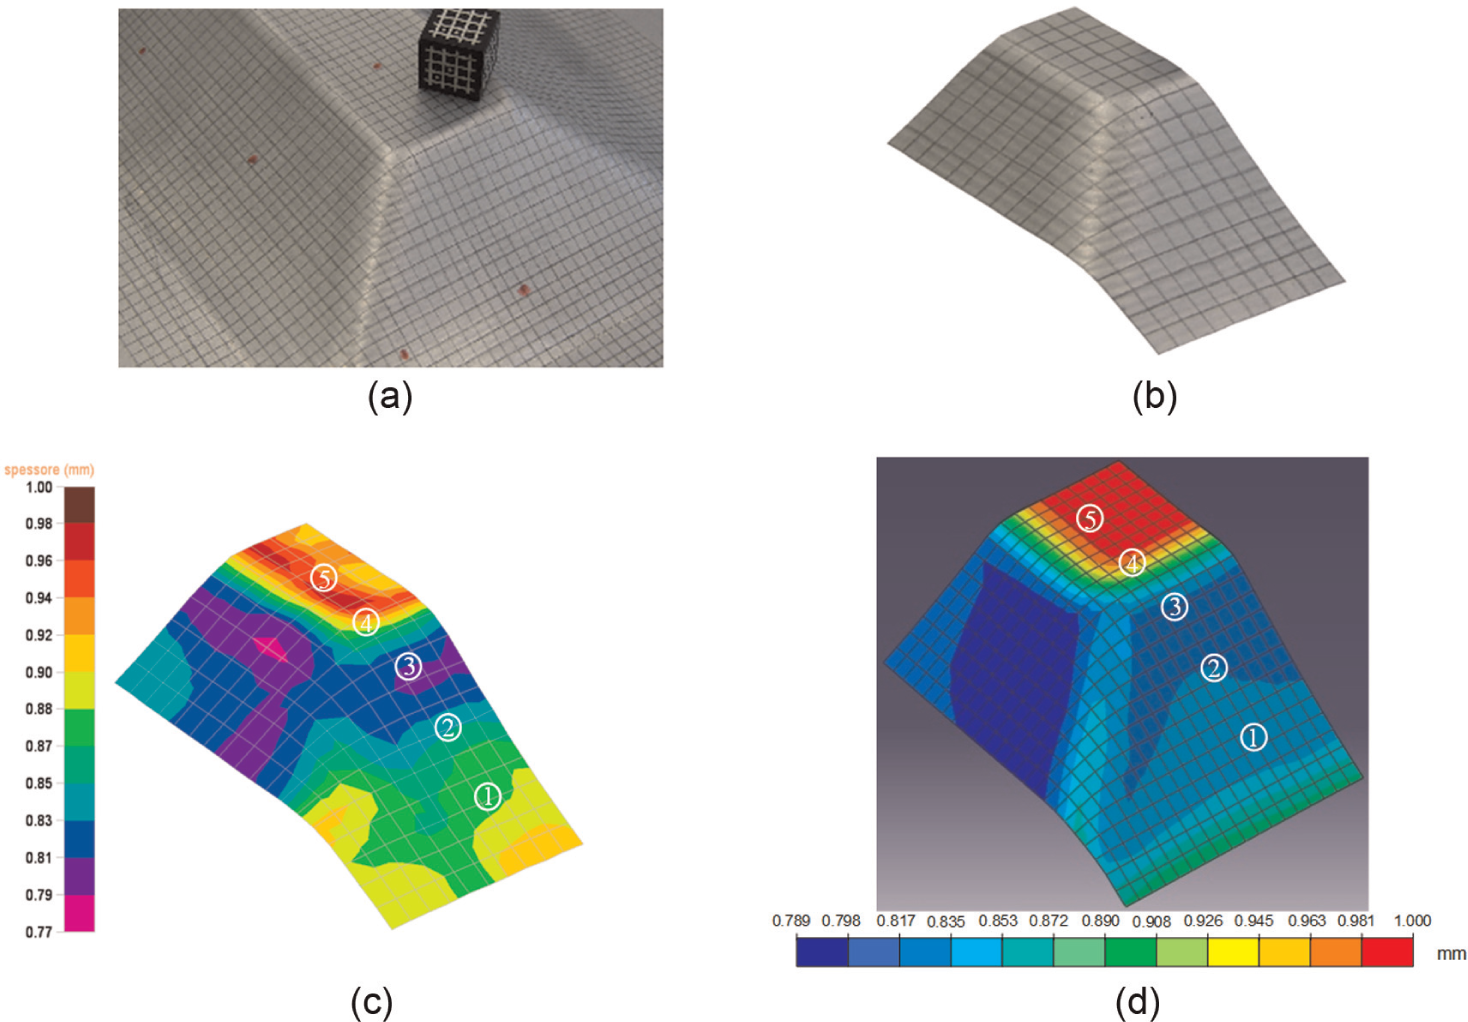
(a) Local geometry of the sheets, (b) detail on the investigated sheets, (c) sheet thinning predicted by ASAME and (d) sheet thinning predicted by FE analysis. The reference points selected for the comparison between the two techniques are indicated (S355MC).
The relative difference between FE and ASAME thickness values for the two critical regions (see Figure 6(a)), taken at five sampling points, is plotted in Figure 12. The results of the four tests carried out both on micro-alloyed steel and on Al alloy were averaged, and a scatter band is also included in the plot. For both regions 1 and 2, small differences were observed, and no systematic over- or underestimation of the local thickness can be observed. The comparison was carried out at geometrical details, representing critical points for the manufacturing process of these components. The reported results display a good correlation between numerical results and experimental measurements. It can be concluded that the FE model can correctly simulate the final deformation condition produced in the sheet by the forming process. Therefore, the numerical modelling can be conveniently adopted for defining conditions of critical strain, accounting for the main material properties influencing the SPIF process.10–14 Moreover, the FE model can give an approximate assessment of the residual stresses affecting the component after forming. A typical representation of the stress state generated in the sheet can also be seen in Figure 9, depicting the equivalent von Mises stress in the material at the end of different time steps of the forming process.
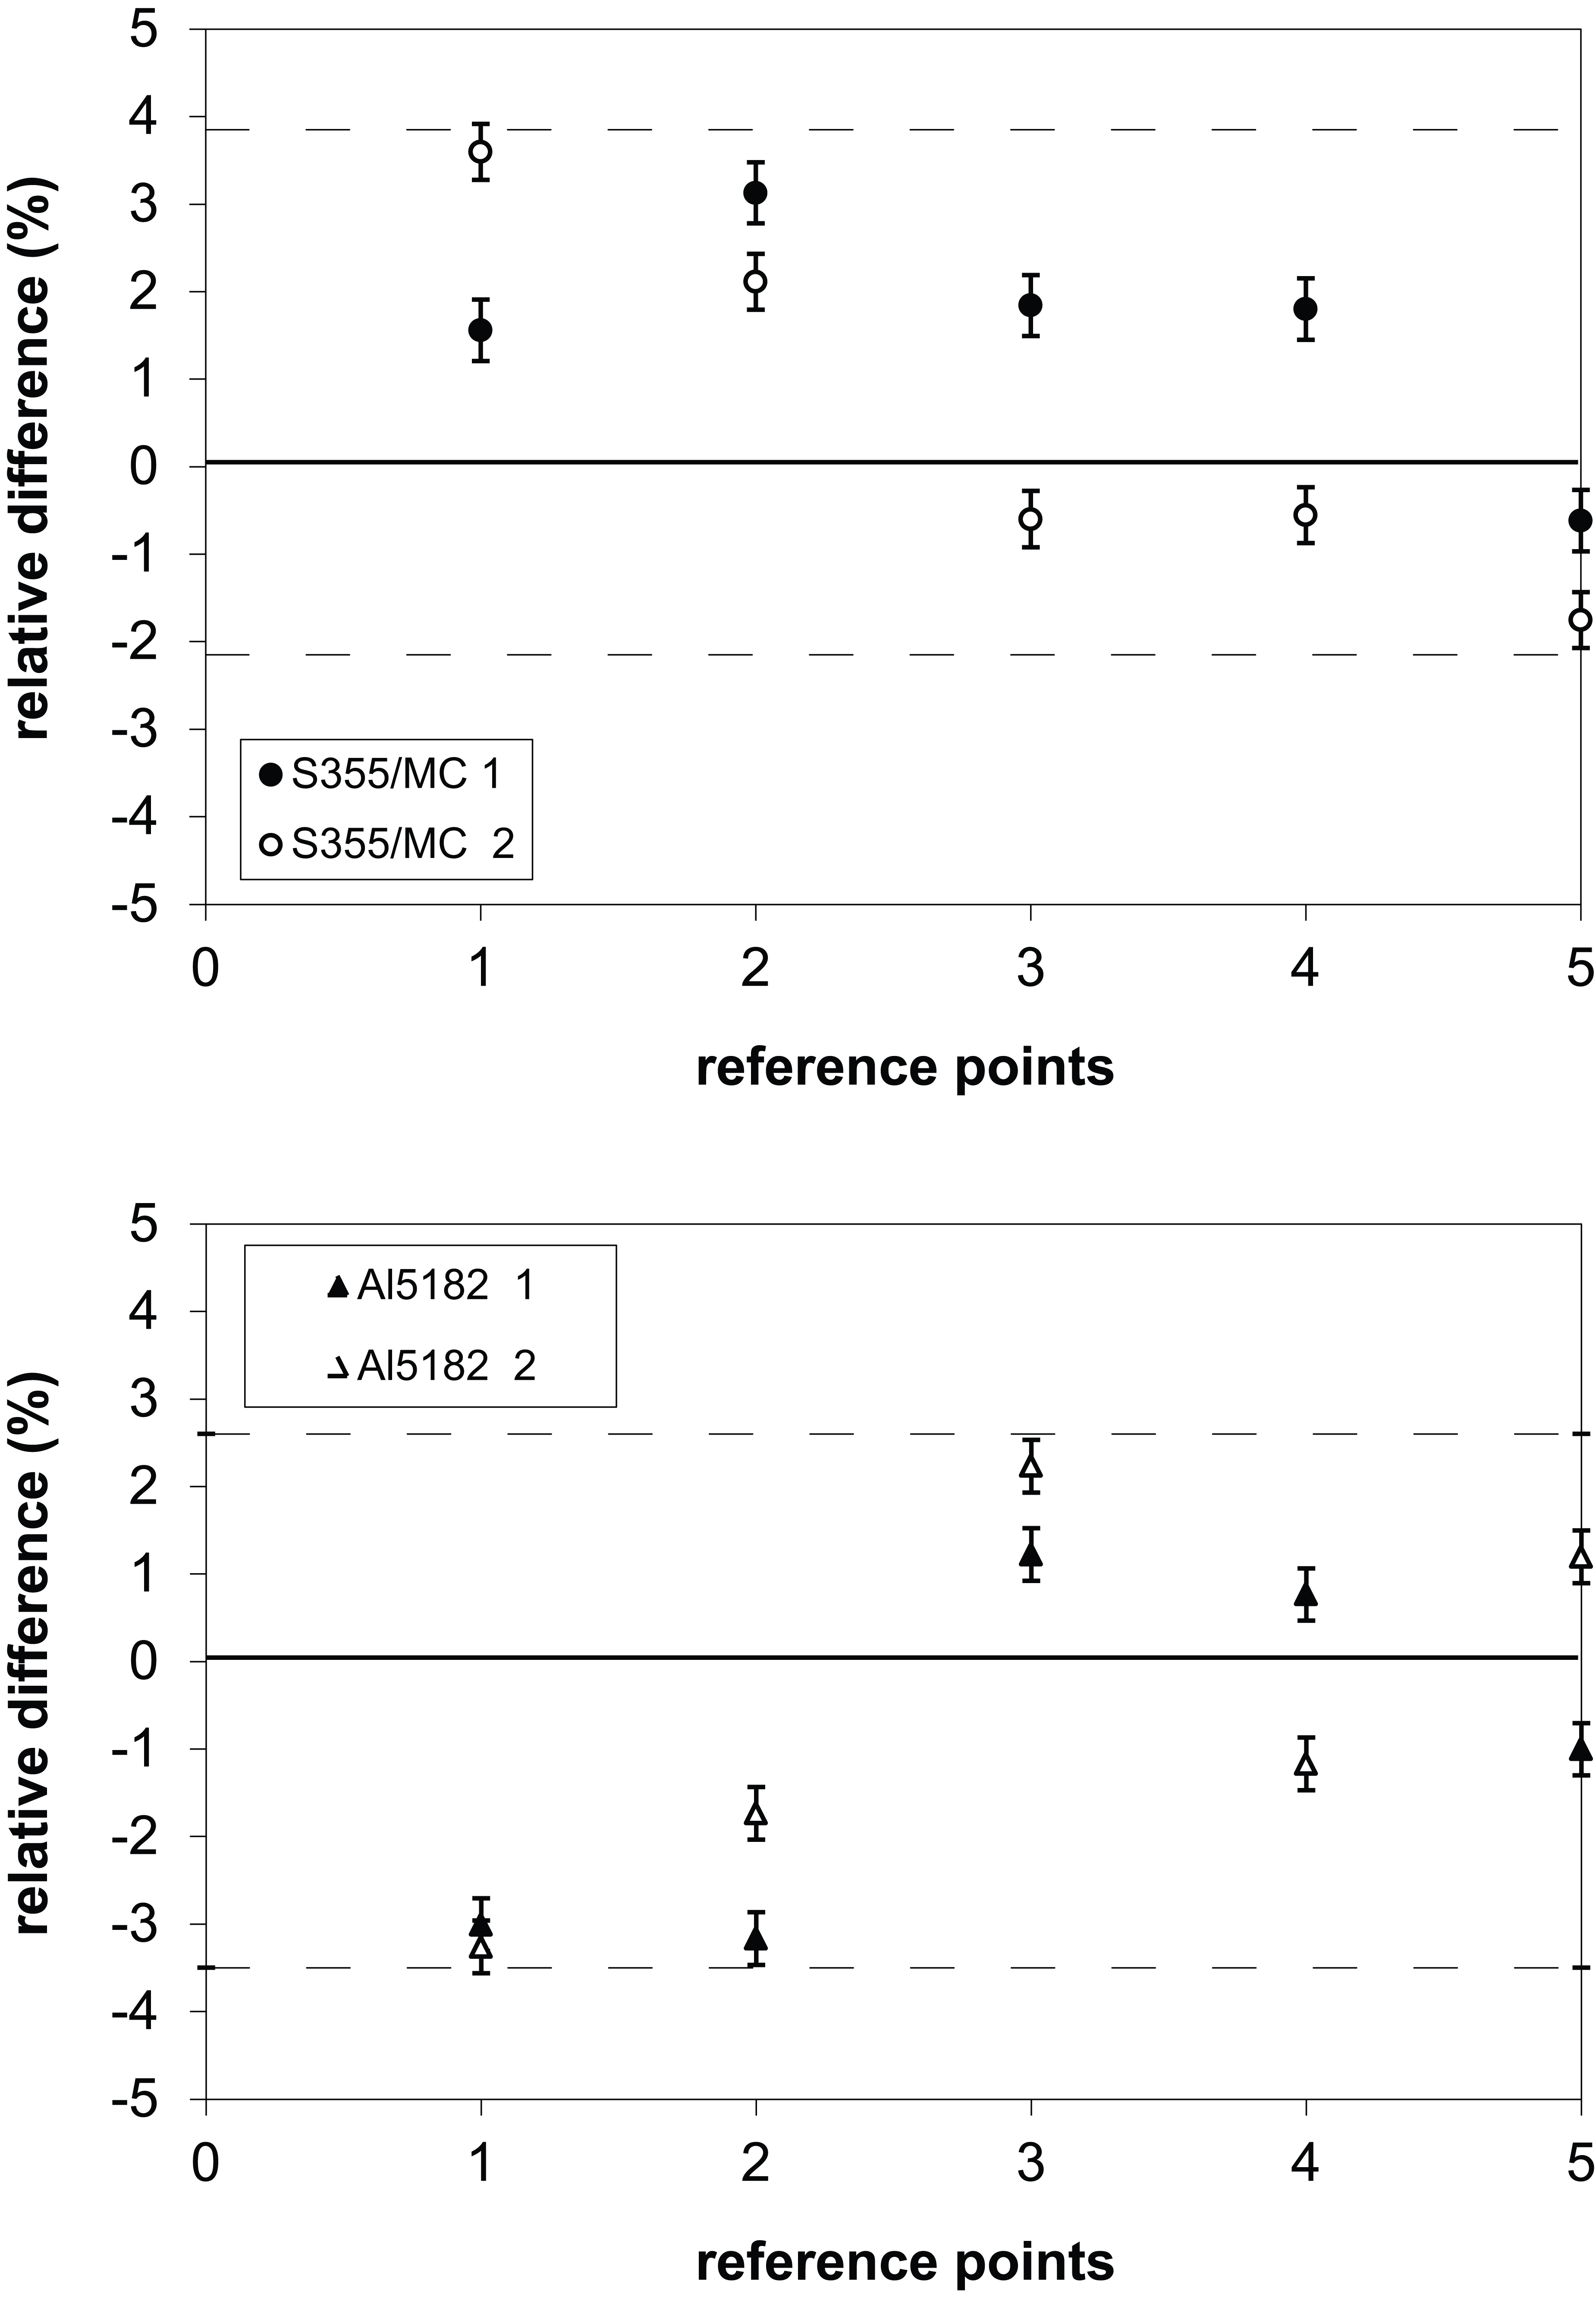
Relative difference between ASAME and FE results, evaluated at five sampling points in the regions at the two corners (1 and 2, see Figure 6(a)).
The measurements carried out on the CMM, following the scanning paths described in Figure 6(b), make it possible to evaluate the final geometry of the tray and compare it both with the ideal one and with that predicted by the numerical analysis. Sample results of this comparison are shown in Figures 13 and 14 for S355MC and AA5182 alloys, respectively.
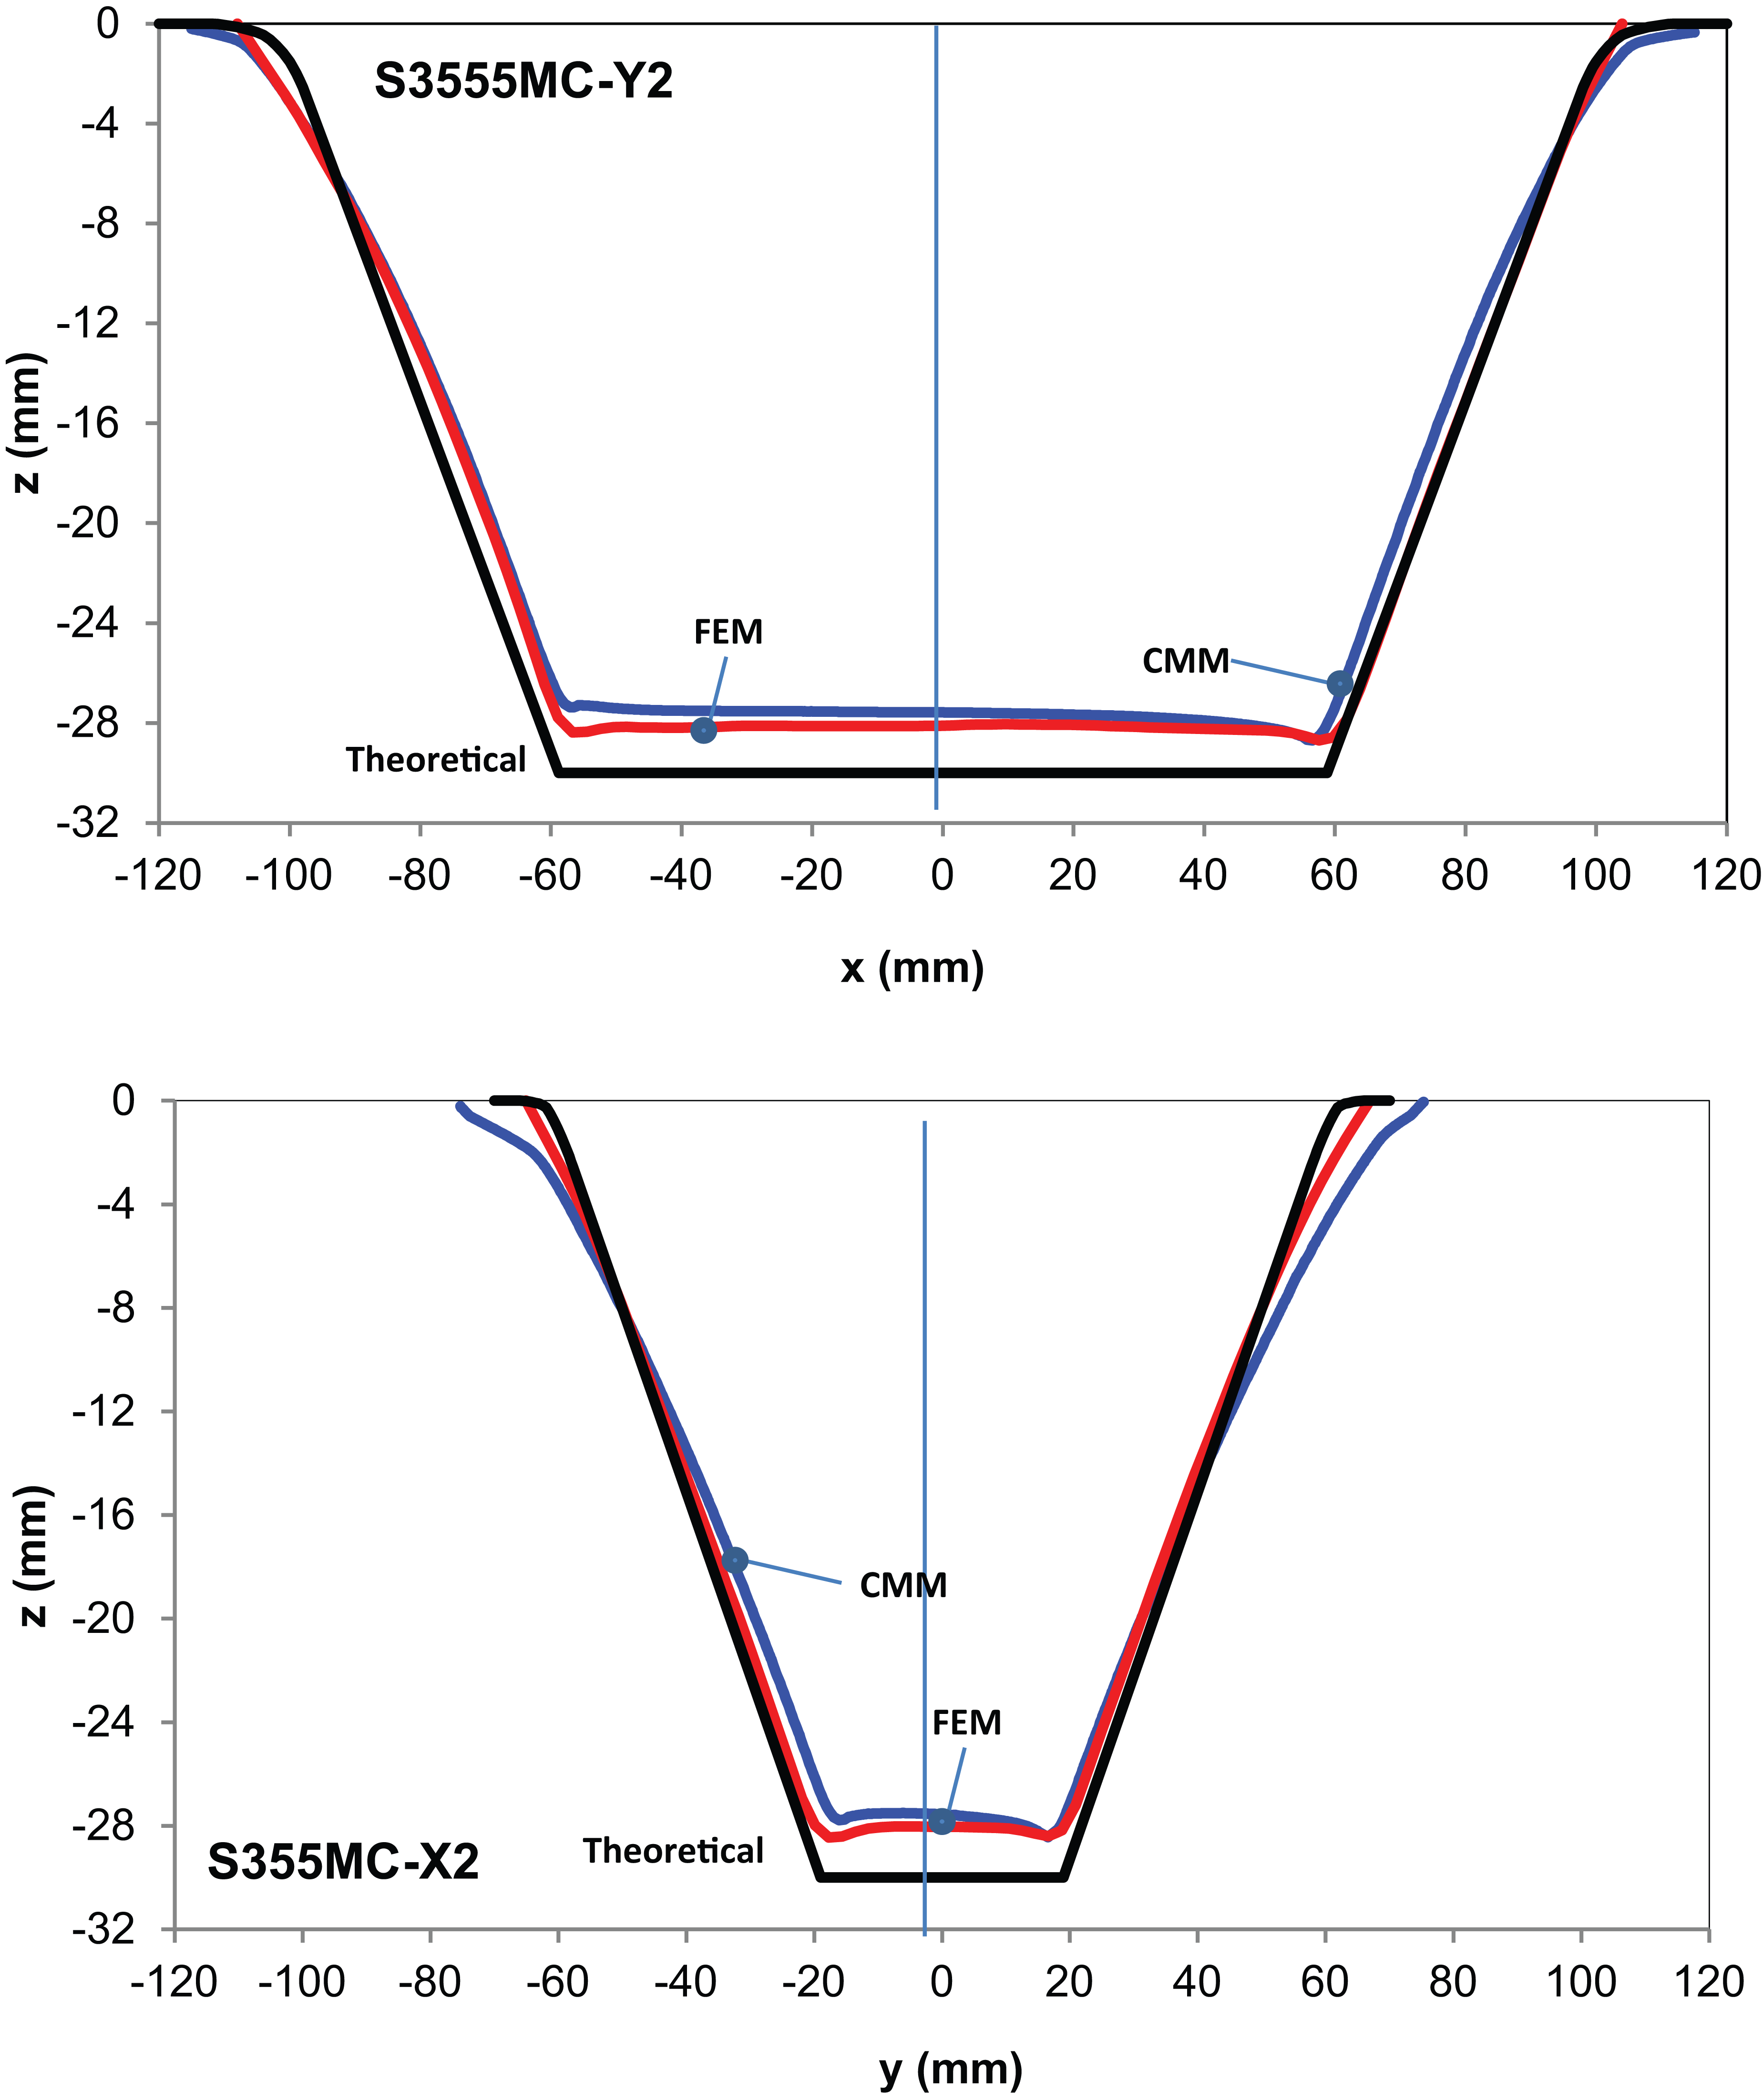
S355MC: comparison between theoretical, numerical and experimental profiles, with reference to the scanning paths X2 and Y2 described in Figure 6(b).
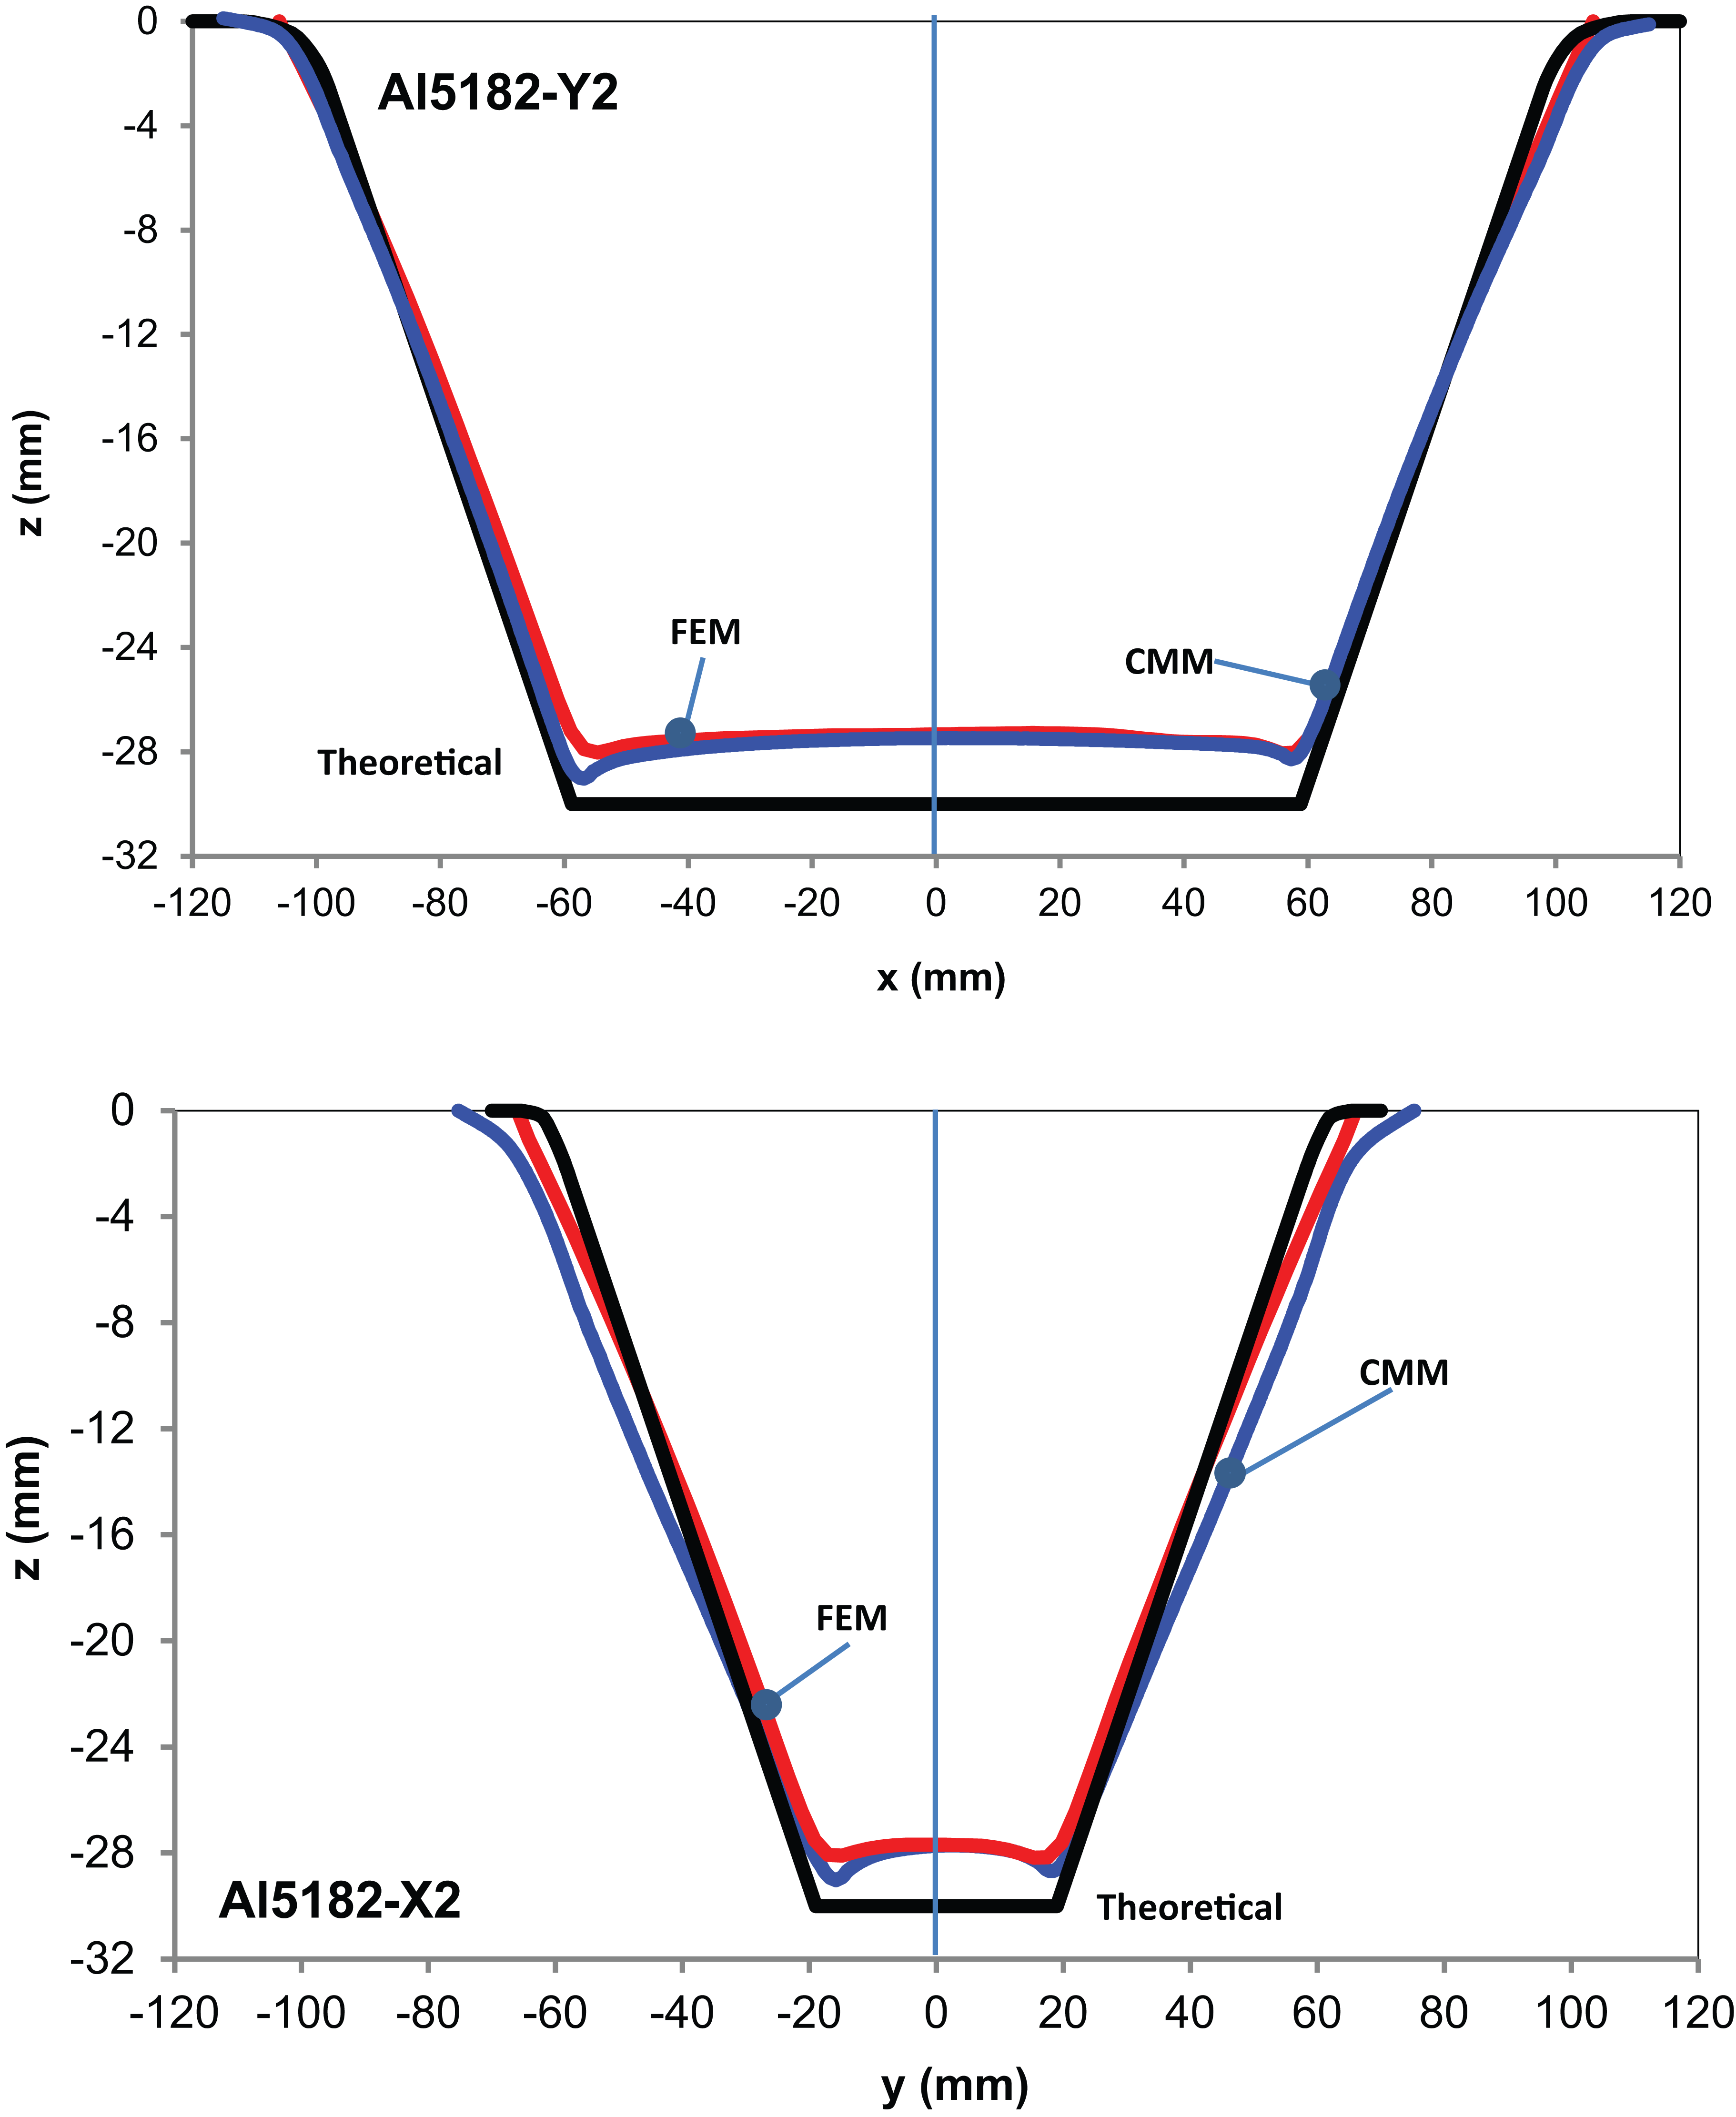
Al5182: comparison between theoretical, numerical and experimental profiles, with reference to the scanning paths X2 and Y2 described in Figure 6(b).
Neither the FE model nor the experimental profiles exactly reproduce the theoretical profiles used as input for the CAM software, but a good correlation between numerical and experimental results can be observed. In comparison with theoretical profiles, the slopes of the inclined faces are less steep and a lower final height of the tray can be observed. These effects can be associated with the elastic springback of the material, occurring predominantly at the end of the forming process. The convexity at the bottom of the tray, known in the literature as pillow effect, arises after its removal from the blank holder and can be explained considering that the tool does not deform the trays bottom but ends its trajectory only on its border. The fact that the FE analysis can correctly reproduce the final geometry of the tray including its geometrical inaccuracies with respect to input CAM profiles is very important because it suggests that the FE model can be used for the final set-up of the forming process, by introducing in the simulation different tool trajectories to limit the observed imprecision.
Although similar trends between FE and experimental values of the vertical component of load (Fz) applied on the sheets during the process were found, a lower correlation was observed in terms of absolute values of force. The comparison between FE and experimental values of Fz is plotted in Figures 15 and 16 for steel and Al alloy, respectively. The load trend presents a steep gradient in the first part of the forming process, followed by stabilization to a plateau in the final part of the process.
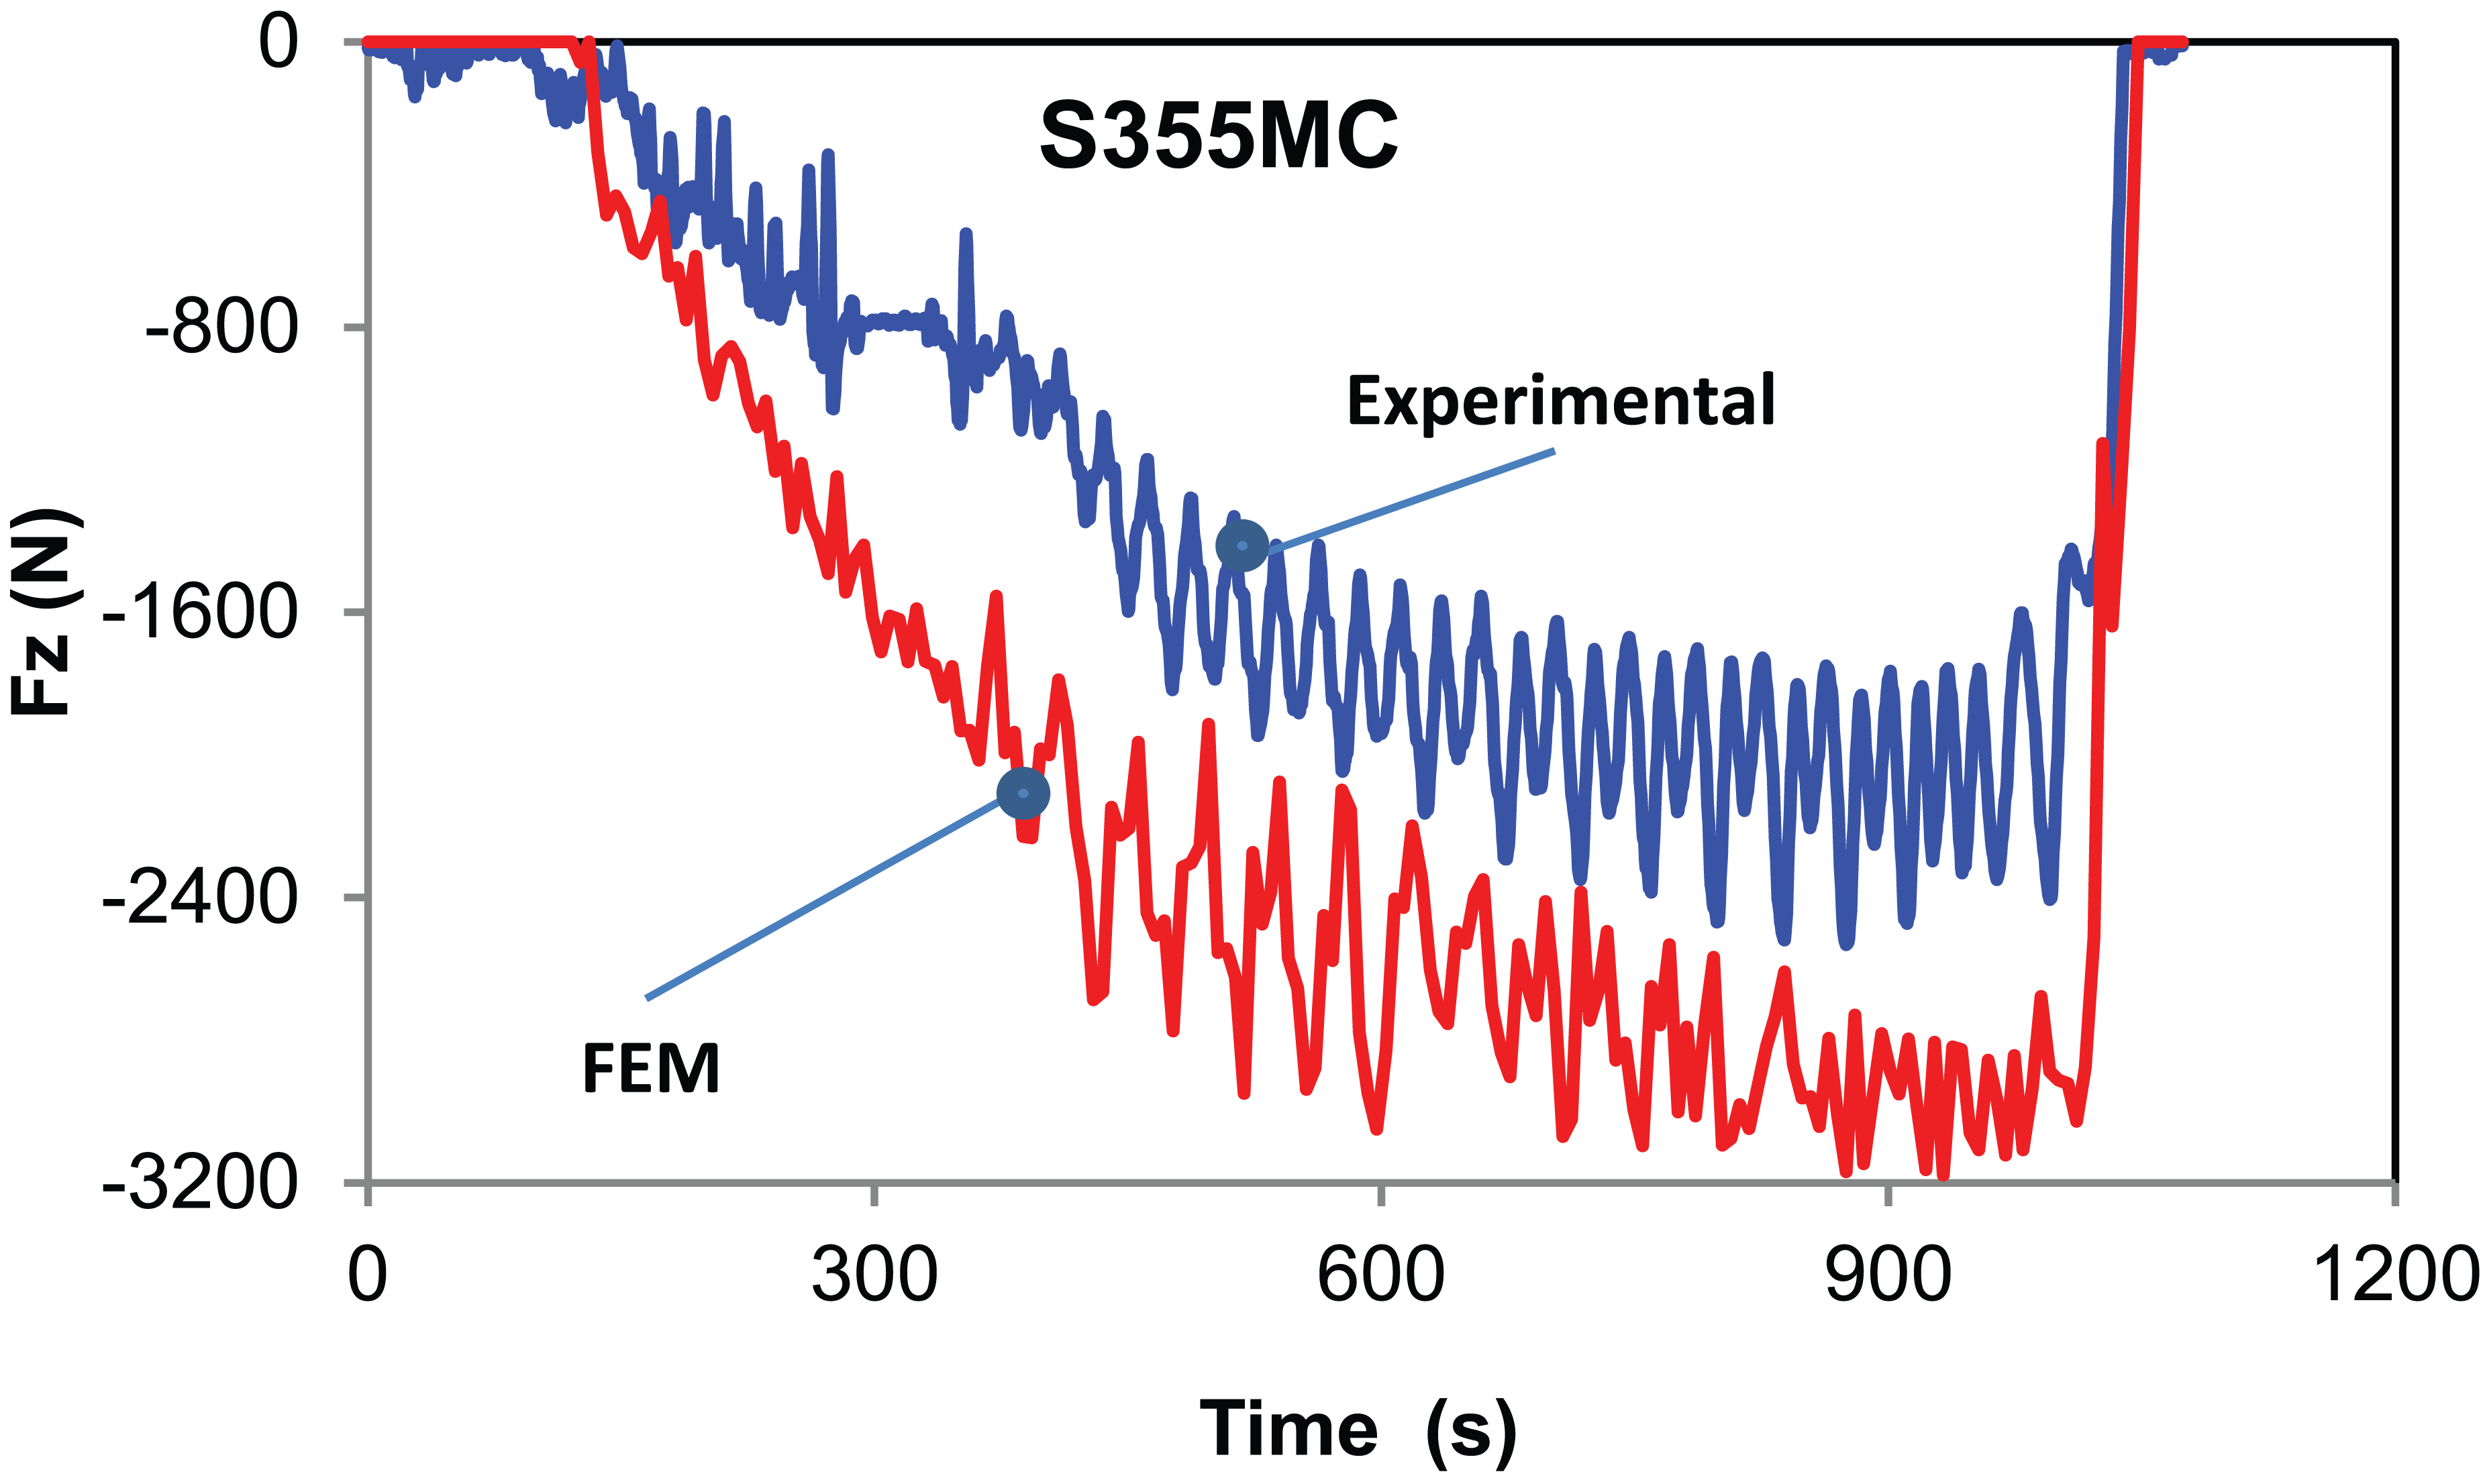
S355MC: comparison between experimental and FE vertical load exerted on to the sheet.
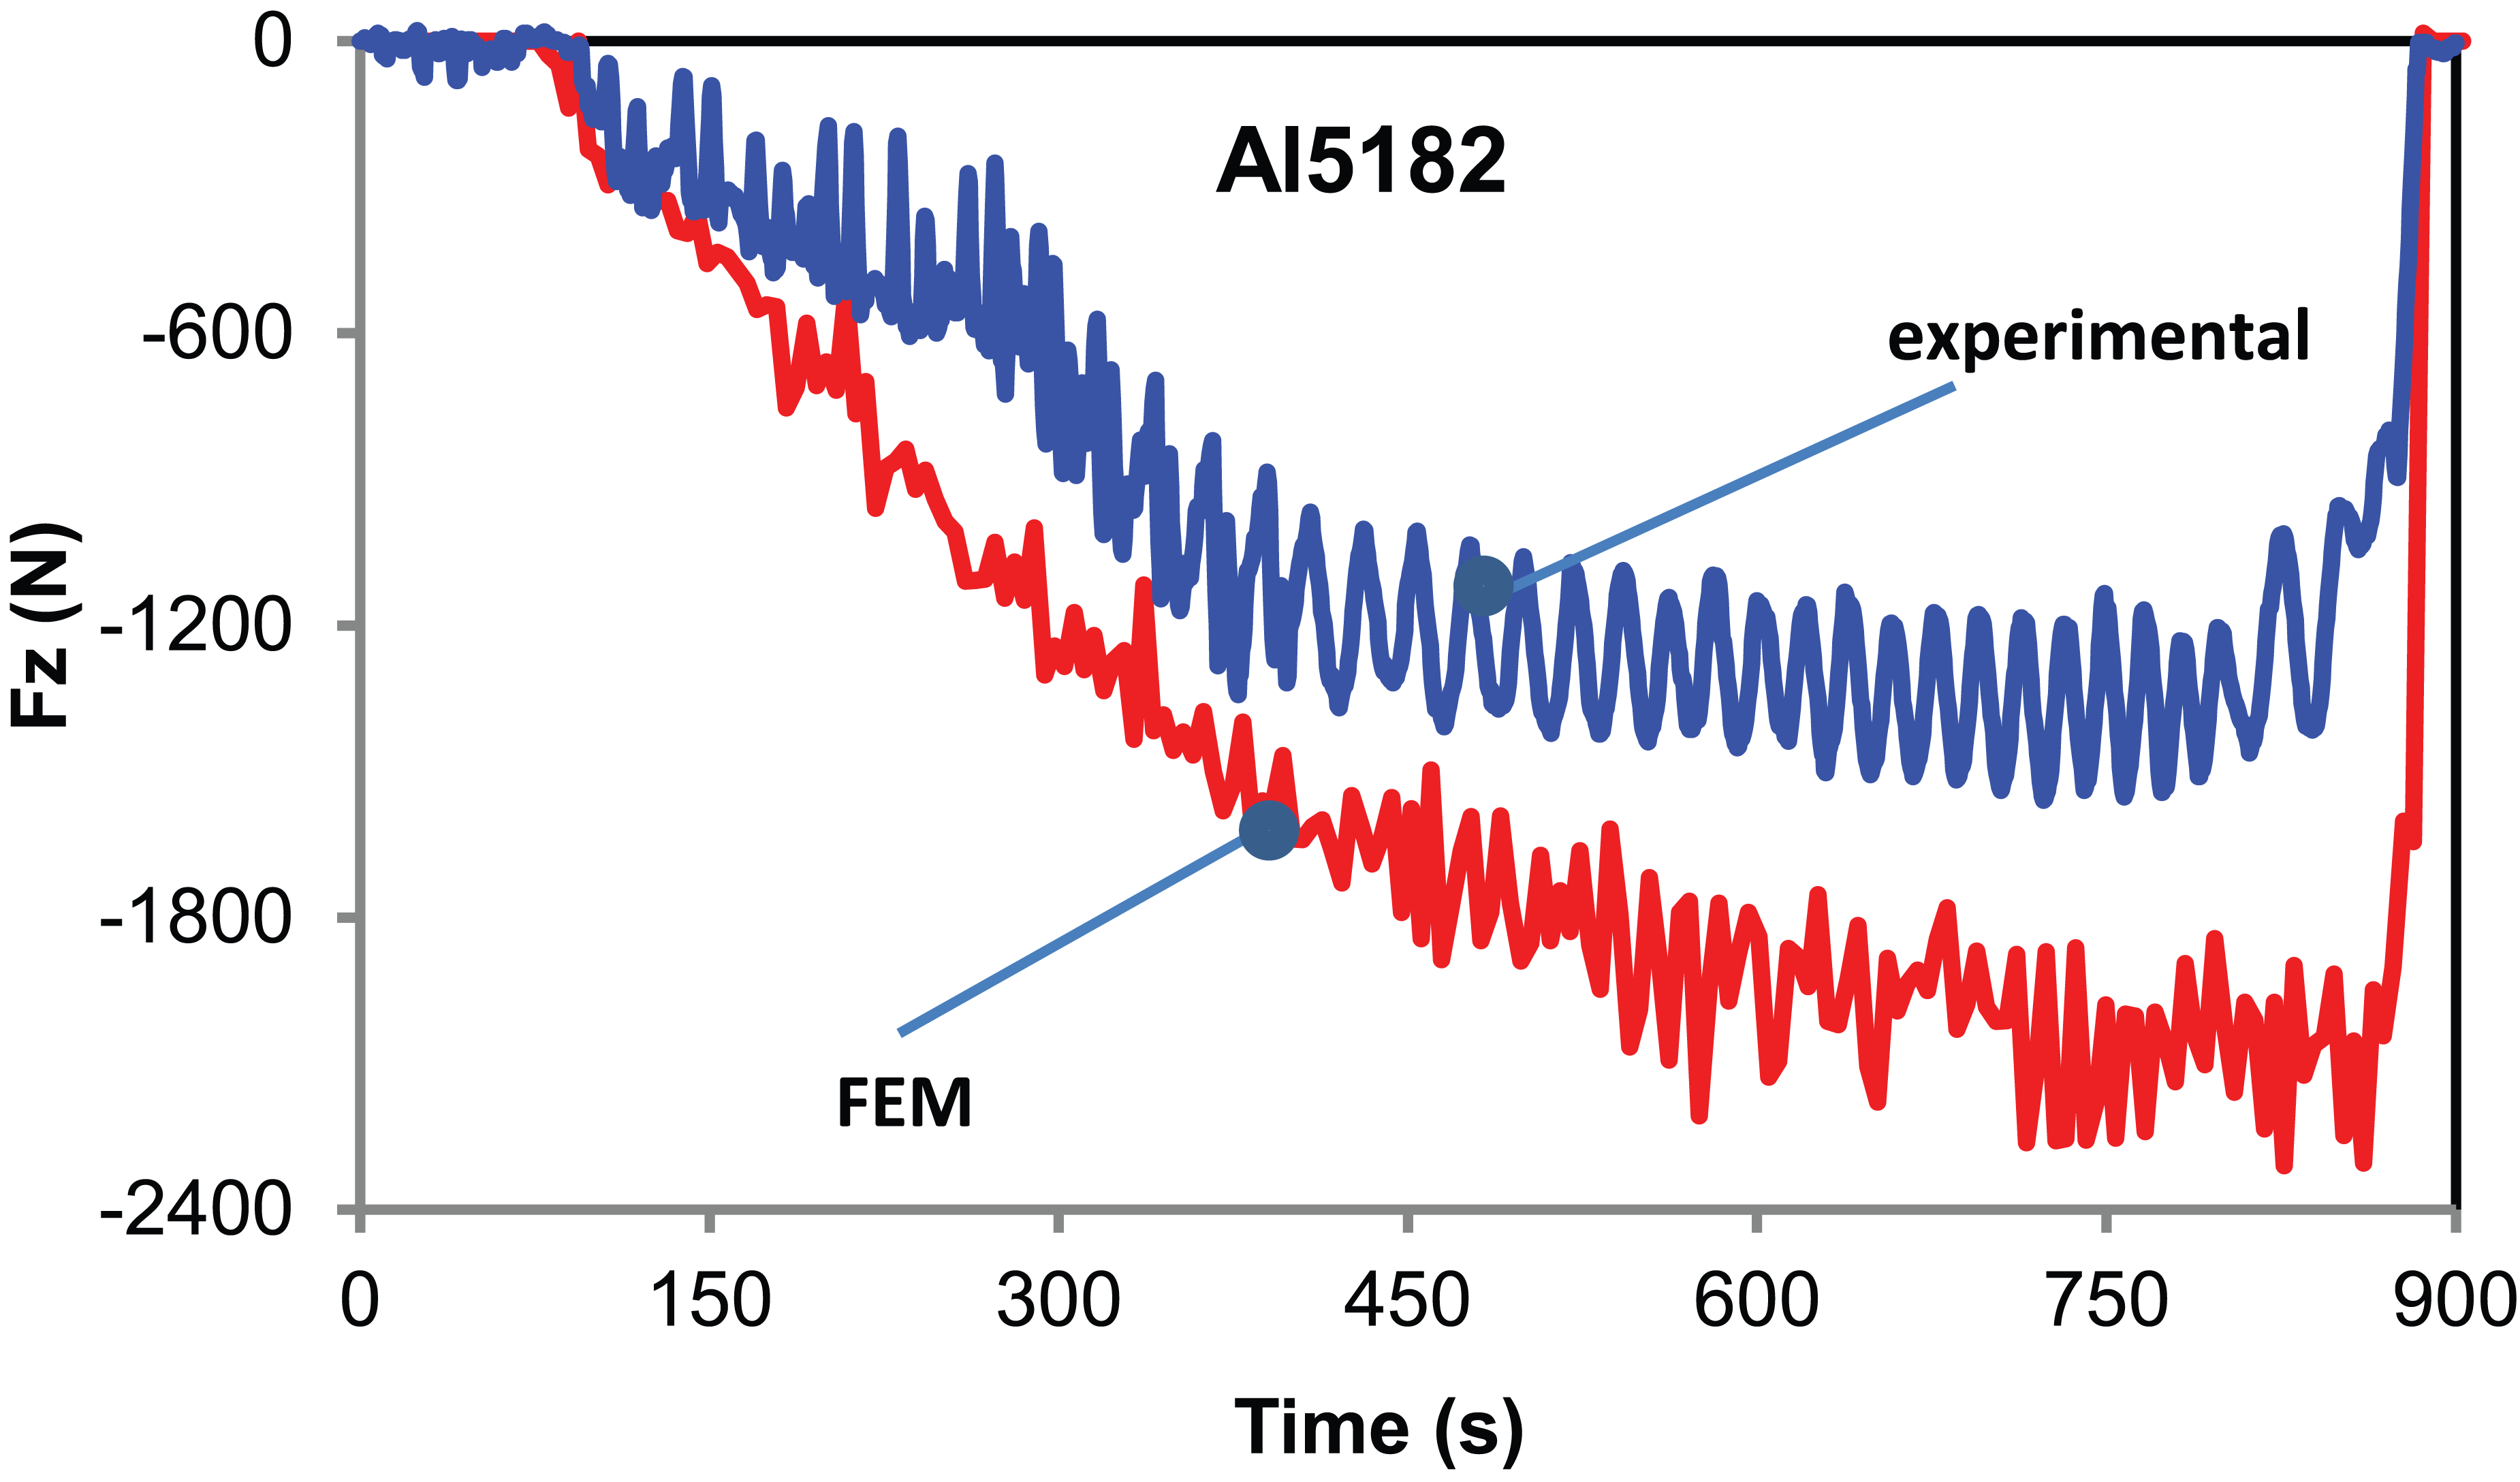
AA5182: comparison between experimental and FE vertical load exerted on to the sheet.
The FE analysis noticeably overestimates the applied load (nearly 40% in the final part of the process, after reaching the load plateau). This overestimation is comparable with data published in the literature, where different hypotheses have been formulated to explain this mismatch, which can be extended also for this work. More precisely
The mass scaling modifies the inertial contribution; the use of a higher density can contribute to the effect of stress stiffening.
The time scaling shortens the simulated duration of the process resulting in an overestimation of the inertial forces associated with the acceleration fields experienced by the forming tool.
Isotropic hardening can overestimate the material response, a mixed formulation, including a isotropic–kinematic hardening rule could be more suitable, to account for the complex stress–strain deformation applied during incremental forming at each element; Henrard 36 showed that the use of a kinematic hardening law produces a noticeable drop (up to 20%) of the estimated forces.
The constraint of any translation degree of freedom of the sheet border to the workbench prevents the local sliding of the material, thus exerting a certain effect of stress stiffening.
The shell element cannot completely account for the transversal shear deformation, which is considered not negligible by some authors.
Conclusion
The presented research investigated, from the experimental and numerical points of view, the entire process of SPIF of a micro-alloyed steel and an Al alloy. Material characterization was carried out to define the parameters of the Hill’s yielding criterion with an isotropic hardening rule, necessary for implementing the FE simulation of the plastic deformation process. A FE dynamic explicit approach was adopted for the analysis, introducing both mass- and time-scaling factors to keep the computational cost of the simulation reasonable. The FE simulation produced interesting results: the model was able to reproduce the most significant aspects of the entire process and correctly described the sheet behaviour during process and the tray geometry upon completion of the forming process. The fact that the FE analysis can correctly reproduce the final geometry, accounting for geometrical inaccuracies with respect to input CAM profiles, suggests that the FE modelling can be used as a powerful tool for the final set-up of the forming process. The analysis of the obtained results pointed out the need for deeper investigation of both sheets’ elastic springback and forming load during the process.
Footnotes
Declaration of Conflicting Interests
The author(s) declared no potential conflicts of interest with respect to the research, authorship and/or publication of this article.
Funding
The author(s) received no financial support for the research, authorship and/or publication of this article.