
Abstract
This research proposed an advance in the prediction of the in-process surface roughness during the ball-end milling process by utilizing the wavelet transform to monitor and decompose the dynamic cutting forces. The chatter detection system has been adopted from the previous research of the author to avoid the chatter first, and hence, the dynamic cutting force ratio is introduced to predict the in-process surface roughness during the normal cutting by taking the ratio of the decomposed dynamic cutting force in X axis to that in Z axis. The Daubechies wavelet transform is employed in this research to analyze the in-process surface roughness. The experimentally obtained results showed that the surface roughness frequency occurred at the same level of the decomposed dynamic cutting forces although the cutting conditions are changed. It is understood that the in-process surface roughness can be predicted effectively under various cutting conditions referring to the proposed monitoring system.
Introduction
The ball-end milling process is one of the most important processes which is widely used in many industries such as the automotive industry, the aerospace industry, and the plastic mold industry. Generally, the surface roughness is required to be controlled by the cutting parameters such as the depth of cut, the spindle speed, the feed rate, and the tool diameter. However, an increase in those cutting parameters may lead to the chatter, which affects the surface finish, the dimensional accuracy, and the tool breakage.
The in-process prediction of surface roughness has been proposed using the static cutting force ratio in the turning process 1 and the milling process 2 in order to monitor the surface roughness during the cutting. However, the proposed system cannot be used in the ball-end milling process, and it is desirable to develop the in-process prediction of surface roughness using the dynamic cutting force ratio. A neural–fuzzy system is used to predict the surface roughness caused by the cutting force in milling operation. 3 But the training data for a specific case are always required. The flank wear is monitored to estimate the surface roughness in face milling with the use of fuzzy logic. 4 Unfortunately, the developed model cannot be used during the in-process cutting. An adaptive control system is employed to predict the surface roughness based on the cutting force signals. 5 The limitation of the system is that the tool diameter has not been studied yet. The prediction of surface roughness is proposed in computer numerical control (CNC) face milling using neural networks and Taguchi’s design of experiments, but the developed system always requires the database to train the system. 6 The simulations had been presented to predict the surface roughness. 7 The disadvantage of the presented model is that it cannot be applied in the real practice for the in-process prediction. The surface topography had been investigated regarding the tool–workpiece intersection, but the model is not applicable to predict the in-process surface roughness. 8 The use of resultant force is measured by utilizing the neural–fuzzy model to estimate the surface roughness. 9 But the proposed system requires the training data whenever the hardness of work material has been changed. It is found that the in-process prediction of surface roughness in the CNC turning process which is developed using the dynamic cutting force ratio is more effective and accurate than the use of the static cutting force ratio. 10 The lack of the developed model is that it cannot be used in the ball-end milling process.
The monitoring of the dynamic cutting force in time domain cannot be used to analyze the surface roughness signal when the chatter and noise signals occur because the surface roughness signal is integrated and mixed with those signals in both time and frequency domains. The dynamometer is installed to detect the chatter in the CNC turning 11 and milling processes. 12 The dynamic cutting force ratio is proposed to eliminate the effects of cutting conditions and reduce the data-processing time from the use of the Fast Fourier Transform (FFT) technique. However, the system had considered the cutting forces in the time domain only. An adaptive resonance theory (ART) network is used to detect the chatter, but the training sets are always required. 13 The dynamic characteristics of a long slender bar were presented with neural networks, but it requires very long training times. 14 The adaptive control system using neural networks and fuzzy logic had been proposed based on the cutting forces to monitor the surface roughness in the ball-end milling.15,16 The proposed system still cannot be used in practice due to the sudden change in the cutting forces and a large amount of experiences. The FFT technique is generally applied to detect the chatter in frequency domain, but the limitation of FFT is that the surface roughness signal cannot be separated from other signals in time domain. 17 The extensive researches have utilized the wavelet transform to detect the tool failure in turning operations 18 and inspect the chatter in end milling 19 both time and frequency domains instead of FFT. The good classification results indicated that the chatter premonitory is suitable based on the wavelet and the feature vector, 20 but those approaches had not been used to detect the surface roughness signal yet during the in-process cutting.
It is already known that the decomposed cutting force signals obtained from the Daubechies wavelet transform can be utilized to detect the chatter effectively during the in-process cutting.21–23 Hence, the in-process chatter detection system in the time domain and the frequency domain of the author is adopted in this research using the Daubechies wavelet transform technique. 21 The wavelet transform can decompose the dynamic cutting forces into many levels to analyze the detail signals and the approximate signals. It is concluded that the high chatter frequency will appear at the low level of the wavelet transform. On the other hand, the low chatter frequency will occur at the high level of the wavelet transform. The experimentally obtained results showed that the wavelet transform is the time–frequency analysis tool which can perform a good resolution in both time domain and frequency domain to detect the chatter and noise signals in the ball-end milling process.
If the chatter signal is detected and separated out from the surface roughness signal, which occurs on the dynamic cutting force signals, into other levels of the wavelet transform, the in-process surface roughness will be effectively predicted. The dynamic cutting forces Fx in X and Fz in Z axis are important 2 and adopted to predict the surface roughness by taking the corresponding time records of them in order to cut off the combinations of the cutting conditions and reduce the data-processing time by calculating the dynamic cutting force ratio in the time domain with a short calculating time. The in-process prediction of surface roughness models are developed utilizing the dimensionless dynamic cutting force ratio. Hence, the aim of this research is to propose the Daubechies wavelet transform to decompose the dynamic cutting forces in order to analyze the in-process surface roughness signal on the decomposed dynamic cutting force in the ball-end milling process during the normal cutting without the chatter. It is expected that the obtained surface roughness models can be used to predict the in-process surface roughness although the cutting conditions are changed because the proposed ratio is not sensitive to the change in the cutting conditions.
Dynamic cutting force and wavelet transform on chatter and surface roughness
The previous research of the author is adopted here to detect the chatter first. 21 While the ball-end milling process runs in the normal cutting, the wavelet transform of dynamic cutting force will be utilized to predict the surface roughness. Otherwise, the cutting parameters will be changed to avoid the chatter until the normal cutting or the non-chatter appears. The new three parameters are introduced to classify the chatter and the non-chatter by taking the ratio of the average variances of dynamic cutting forces to the absolute variances of themselves. The Daubechies wavelet transform is employed in this research to analyze the chatter. The chatter is classified and determined when the ratios of the average variances of the dynamic cutting forces to the absolute variance of themselves (Rx, Ry, and Rz) are less than the critical values of 0.15, 0.17, and 0.20, respectively. It is understood that the parameter Rx, Ry, and Rz can be used to detect and avoid the chatter regardless of the cutting conditions. However, the preliminary experiments are required to obtain the threshold values to identify the chatter because the chatter frequency depends on the cutting conditions and the tool diameters. As a result, the detectable chatter level of the wavelet transform may be changed.
The dynamic cutting force signals can be decomposed using the Daubechies wavelet transform into five levels. The different levels have been sensitive to the different frequency intervals. Hence, it is very important to select the suitable level of the decomposed dynamic cutting force signal, which corresponds with the surface roughness signal. If the obtained level of the wavelet transform is predetermined properly, then the in-process surface roughness will be predicted effectively. The preliminary experiments and the previous research 21 showed that the use of five levels is enough to illustrate the signal occurring at the low-frequency range which is less than 500 Hz. The lower frequency signal appears at the higher level, while the higher frequency signal happens at the lower level.
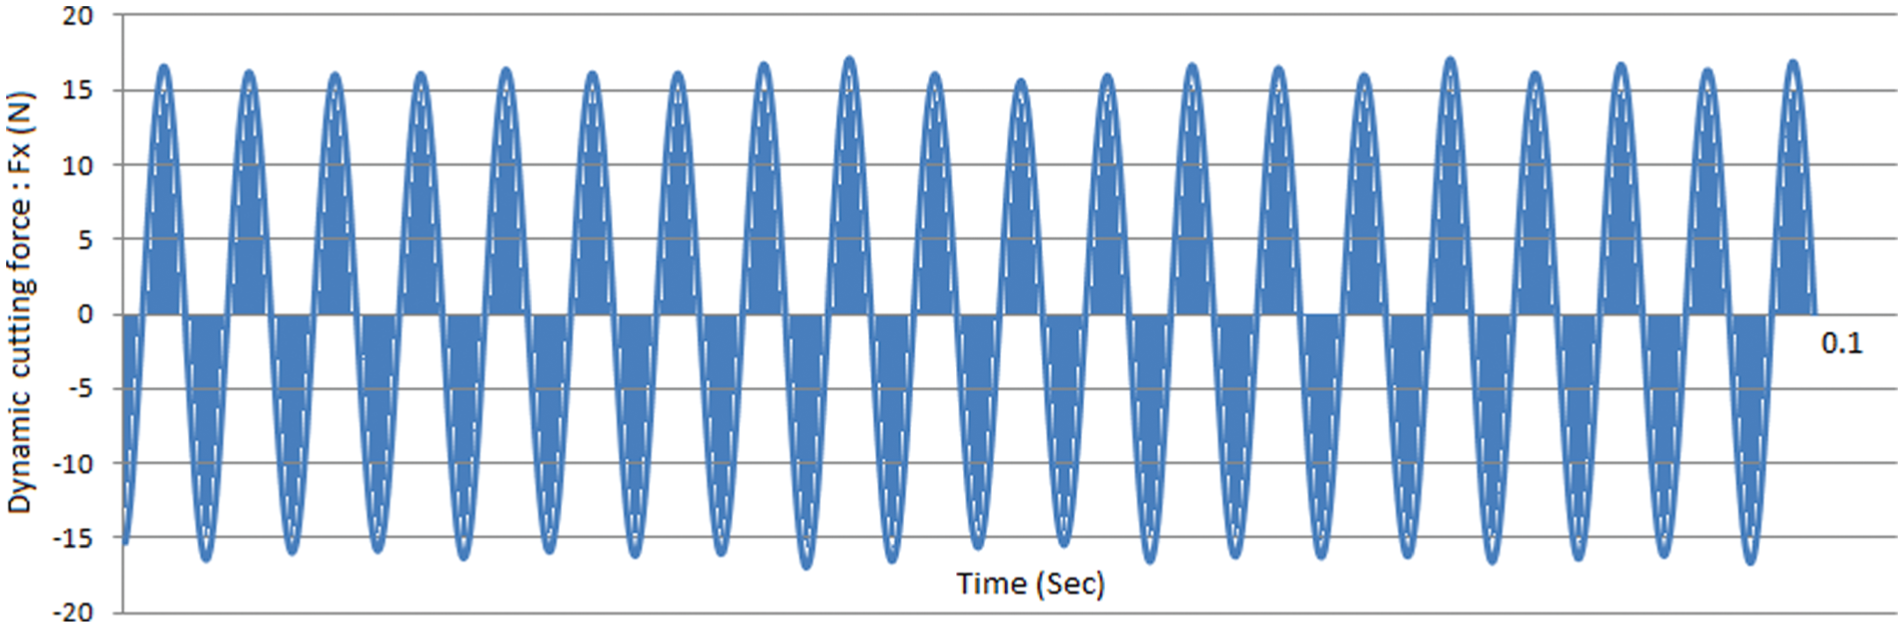
The machined surface roughness, which is corresponding to the in-process dynamic cutting forces, can be measured off-line using the surface roughness tester after the post-process cutting. Figure 1 illustrates the details of dynamic cutting force signals and the corresponding time records of surface roughness signals in the time domain, while Figure 2 shows their frequency domain by taking the FFT of the signal in Figure 1. The dynamic cutting force signals are decomposed into five levels in the time domain and also in the frequency domain using Daubechies wavelet transform as shown in Figures 3 and 4, respectively. It is shown that the decomposed dynamic cutting force frequency corresponds with the surface roughness frequency at the fifth level when the normal cutting appears referring to the preliminary experiments. Hence, the decomposed dynamic cutting force from level 5 will be calculated to predict the in-process surface roughness. However, the dynamic cutting forces depend on the cutting conditions such as the hardness of work material which affects the surface finish. It is necessary to normalize the dynamic cutting forces to eliminate the effect of those combinations of the cutting conditions.
Example of the dynamic cutting force signals and the surface roughness signal in the time domain with the tool diameter of 10 mm, spindle speed of 12,000 r/min, depth of cut of 0.5 mm, and feed rate of 0.03 mm/teeth.
Example of the dynamic cutting force signals and the surface roughness signal in the frequency domain with the tool diameter of 10 mm, spindle speed of 12,000 r/min, depth of cut of 0.5 mm, and feed rate of 0.03 mm/teeth.
Example of the dynamic cutting force signals in the time domain of the wavelet transform with the tool diameter of 10 mm, spindle speed of 12,000 r/min, depth of cut of 0.7 mm, and feed rate of 0.03 mm/teeth.
Example of the dynamic cutting force signals in the frequency domain of the wavelet transform with the tool diameter of 10 mm, spindle speed of 12,000 r/min, depth of cut of 0.7 mm, and feed rate of 0.03 mm/teeth.
Dynamic cutting forces and cutting conditions on surface roughness
According to the theoretical surface roughness, the surface roughness profile should correspond with the dynamic cutting force in the feed direction. It is understood that the frequency of the dynamic cutting force has to be the same as the roughness profile in the frequency domain. Hence, the dynamic cutting forces can be utilized to predict the in-process surface roughness during the cutting.
It is desirable to know the relations of the feed rate, the tool diameter, the spindle speed, the dynamic cutting force, and the surface roughness in order to predict the in-process surface roughness. Referring to the theoretical surface roughness, an increase in tool diameter gives the low theoretical surface roughness while the higher feed rate increases the theoretical surface roughness. However, some previous researches showed that the larger tool diameter causes the poor surface finish due to the effect of the cutting force. 2
The low surface finish is obtained by cutting with the large depth of cut which leads to the vibration of cutting tool during the cutting and results in the poor surface finish. The higher spindle speed also affects the cutting tool vibration. Consequently, the surface roughness becomes higher when the spindle speed increases. 24
The dynamic cutting forces Fx and Fz are considered to predict the surface roughness. The dynamic cutting forces are normalized to eliminate the combinations of cutting conditions by taking the ratio of the areas of dynamic cutting forces in X axis to that in Z axis. It is expected that the developed surface roughness models can be used to predict the in-process surface roughness regardless of the cutting conditions.
In-process surface roughness prediction model
The relation between the surface roughness, the cutting force ratio, and the cutting conditions are proposed here as the non-linear relation. 10 Hence, the exponential function is adopted here to develop the in-process surface roughness models as shown below
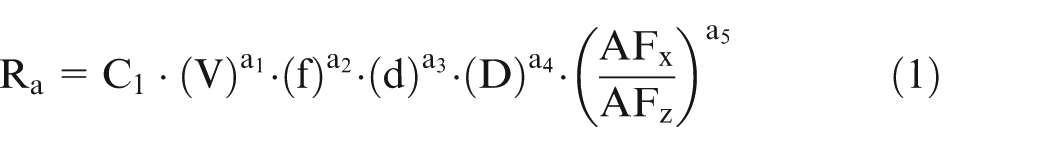
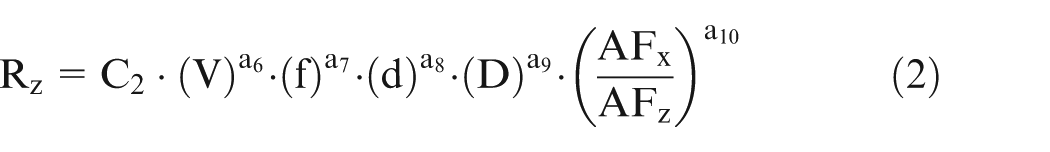
where Ra is the average surface roughness (μm), Rz is the surface roughness (μm), V is the spindle speed (rev/min), f is the feed rate (mm/teeth), d is the depth of cut (mm), D is the tool diameter (mm), (AFx/AFz) is the area of dynamic cutting force ratio, and
Experimental setup and procedure
The cutting tests are performed using the coated carbide ball-end mills (TiAIN) with diameters of 6 and 10 mm, two cutting edges, and 30° helix angle. The five-axis CNC machining center of Mazak Variaxis 500 is employed for the cutting tests. The workpiece material is carbon steel (AISI 1050) with a size of 64 mm × 64 mm × 45 mm. A dynamometer (Kistler 9257B) has been installed on the table of the five-axis CNC machining center as shown in Figure 5. The roughness tester of TSK (model: Surfcom 1400D-12) is employed to measure the machined surface roughness.
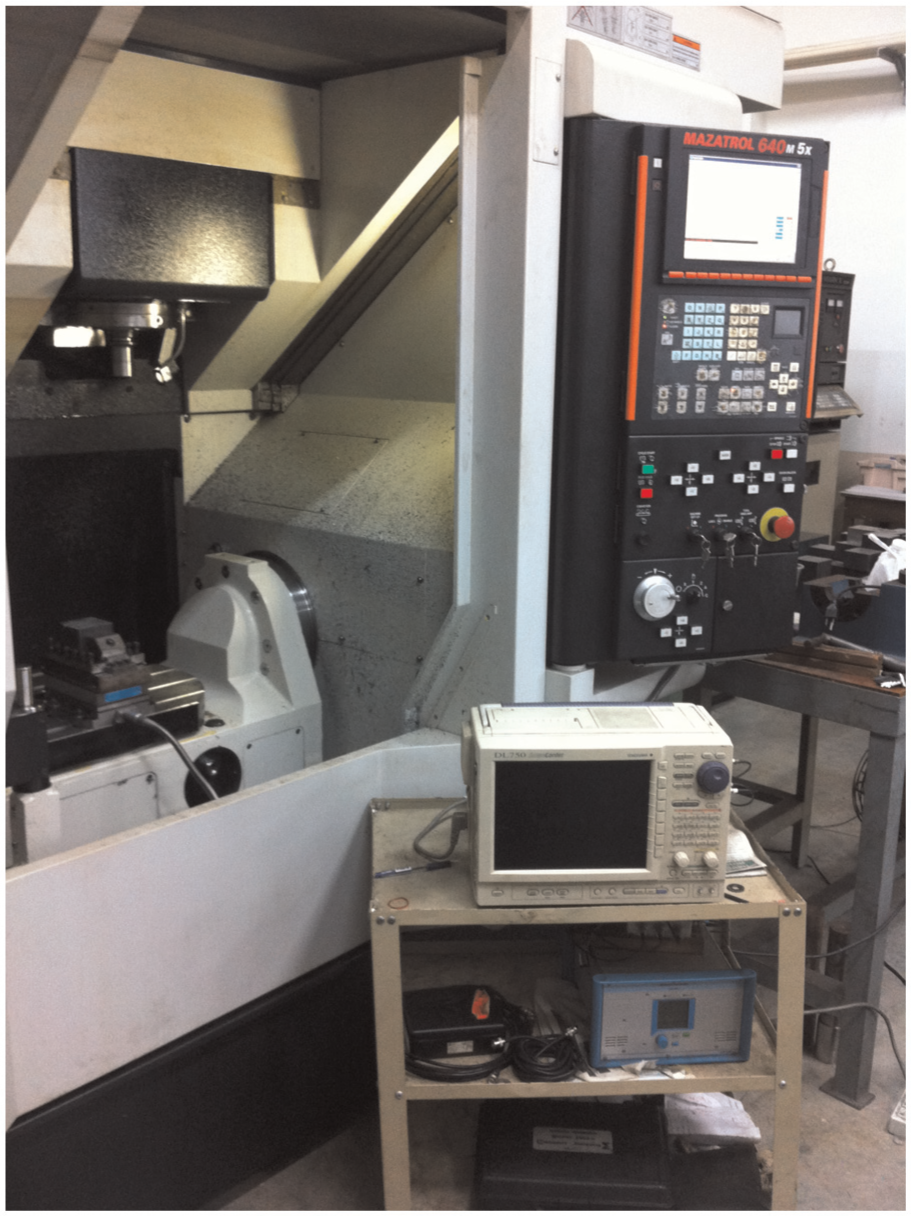
Illustration of experiential setup.
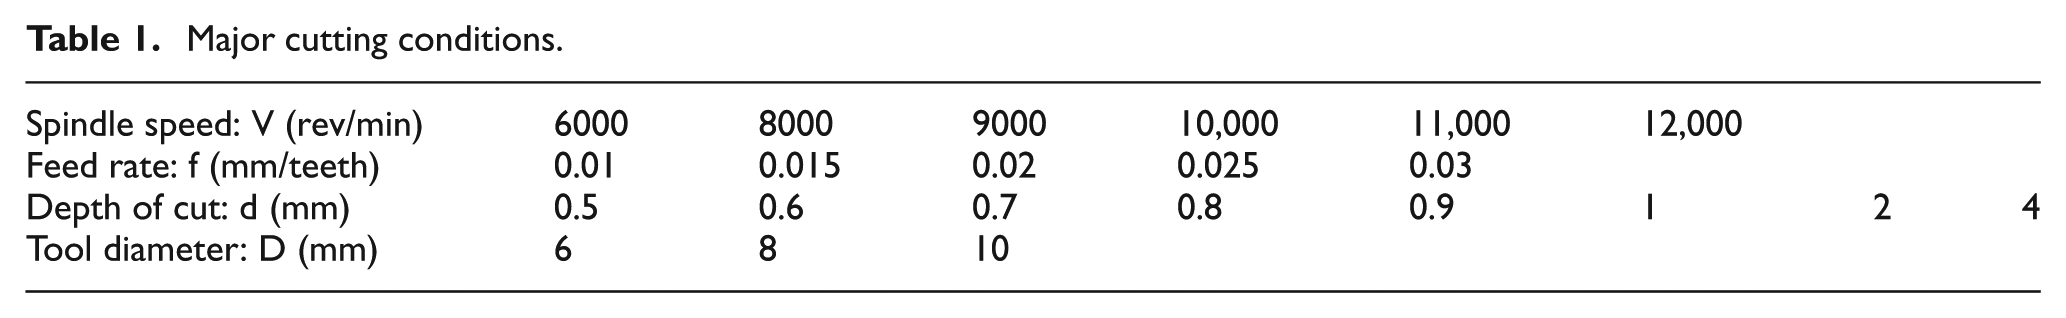
The major cutting conditions are summarized in Table 1. The dynamic cutting force components detected by dynamometer are amplified and low-pass filtered with a cut-off frequency of 5 kHz prior to digitization and calculation within PC. The sampling rate is 10 kHz. The natural frequency of the cutting system, which leads to the chatter frequency, is required to be examined by conducting the preliminary experiments with the hammer tests. The obtained natural frequency of the workpiece clamped in the jig on the table of five-axis CNC machining center is 730 Hz. The natural frequencies of the spindle equipped with the different tool diameters have been examined, which are less than 1.3 kHz. It is proven that the resonant frequency of the dynamometer is about 2.7 kHz, and hence, the dynamic cutting forces are well detected by the dynamometer. In order to detect the above frequency, the minimum sampling rate normally must be at least two times the interesting frequencies, which are the frequencies of the spindle with the cutting tool, and the jig with the workpiece.
Major cutting conditions.
The following experimental procedures are adopted to obtain the relation of the surface roughness, the dynamic cutting force ratio, and the cutting conditions:
Start cutting process in each cutting condition with a new ball-end milling tool.
Calculate the dynamic cutting forces in each component (Fx, Fy, Fz).
Calculate Rx, Ry, and Rz by taking the ratio of the average variances of the dynamic cutting forces to the absolute variances of themselves.
Change the depth of cut, the spindle speed, and the feed rate if Rx, Ry, and Rz are lower than the critical values until the non-chatter appears.
Measure the dynamic cutting forces and the surface roughness in the normal cutting.
Decompose the dynamic cutting force signals into five levels using the Daubechies wavelet transform technique.
Compare and check the relation between the surface roughness profiles and the decomposed dynamic cutting forces in each level of the wavelet transform in the time domain and the frequency domain.
Calculate the area of the decomposed dynamic cutting forces in the time domain of X and Z axes in the fifth level using the trapezoidal rule and take the ratio of them as shown in Figure 6.
Calculate the in-process surface roughness model at 95% confident level.
Repeat the new cutting tests and verify the predicted surface roughness with the measured surface roughness and the ±10% measured surface roughness.
Example of calculation of AFx in the fifth level of the Daubechies wavelet transform using trapezoidal rule with the tool diameter of 10 mm, spindle speed of 12,000 r/min, depth of cut of 0.7 mm, and feed rate of 0.03 mm/teeth.
In order to develop the in-process surface roughness model, the following flowchart is introduced to predict the in-process surface roughness using the cutting force ratio during the actual cutting as shown in Figure 7.
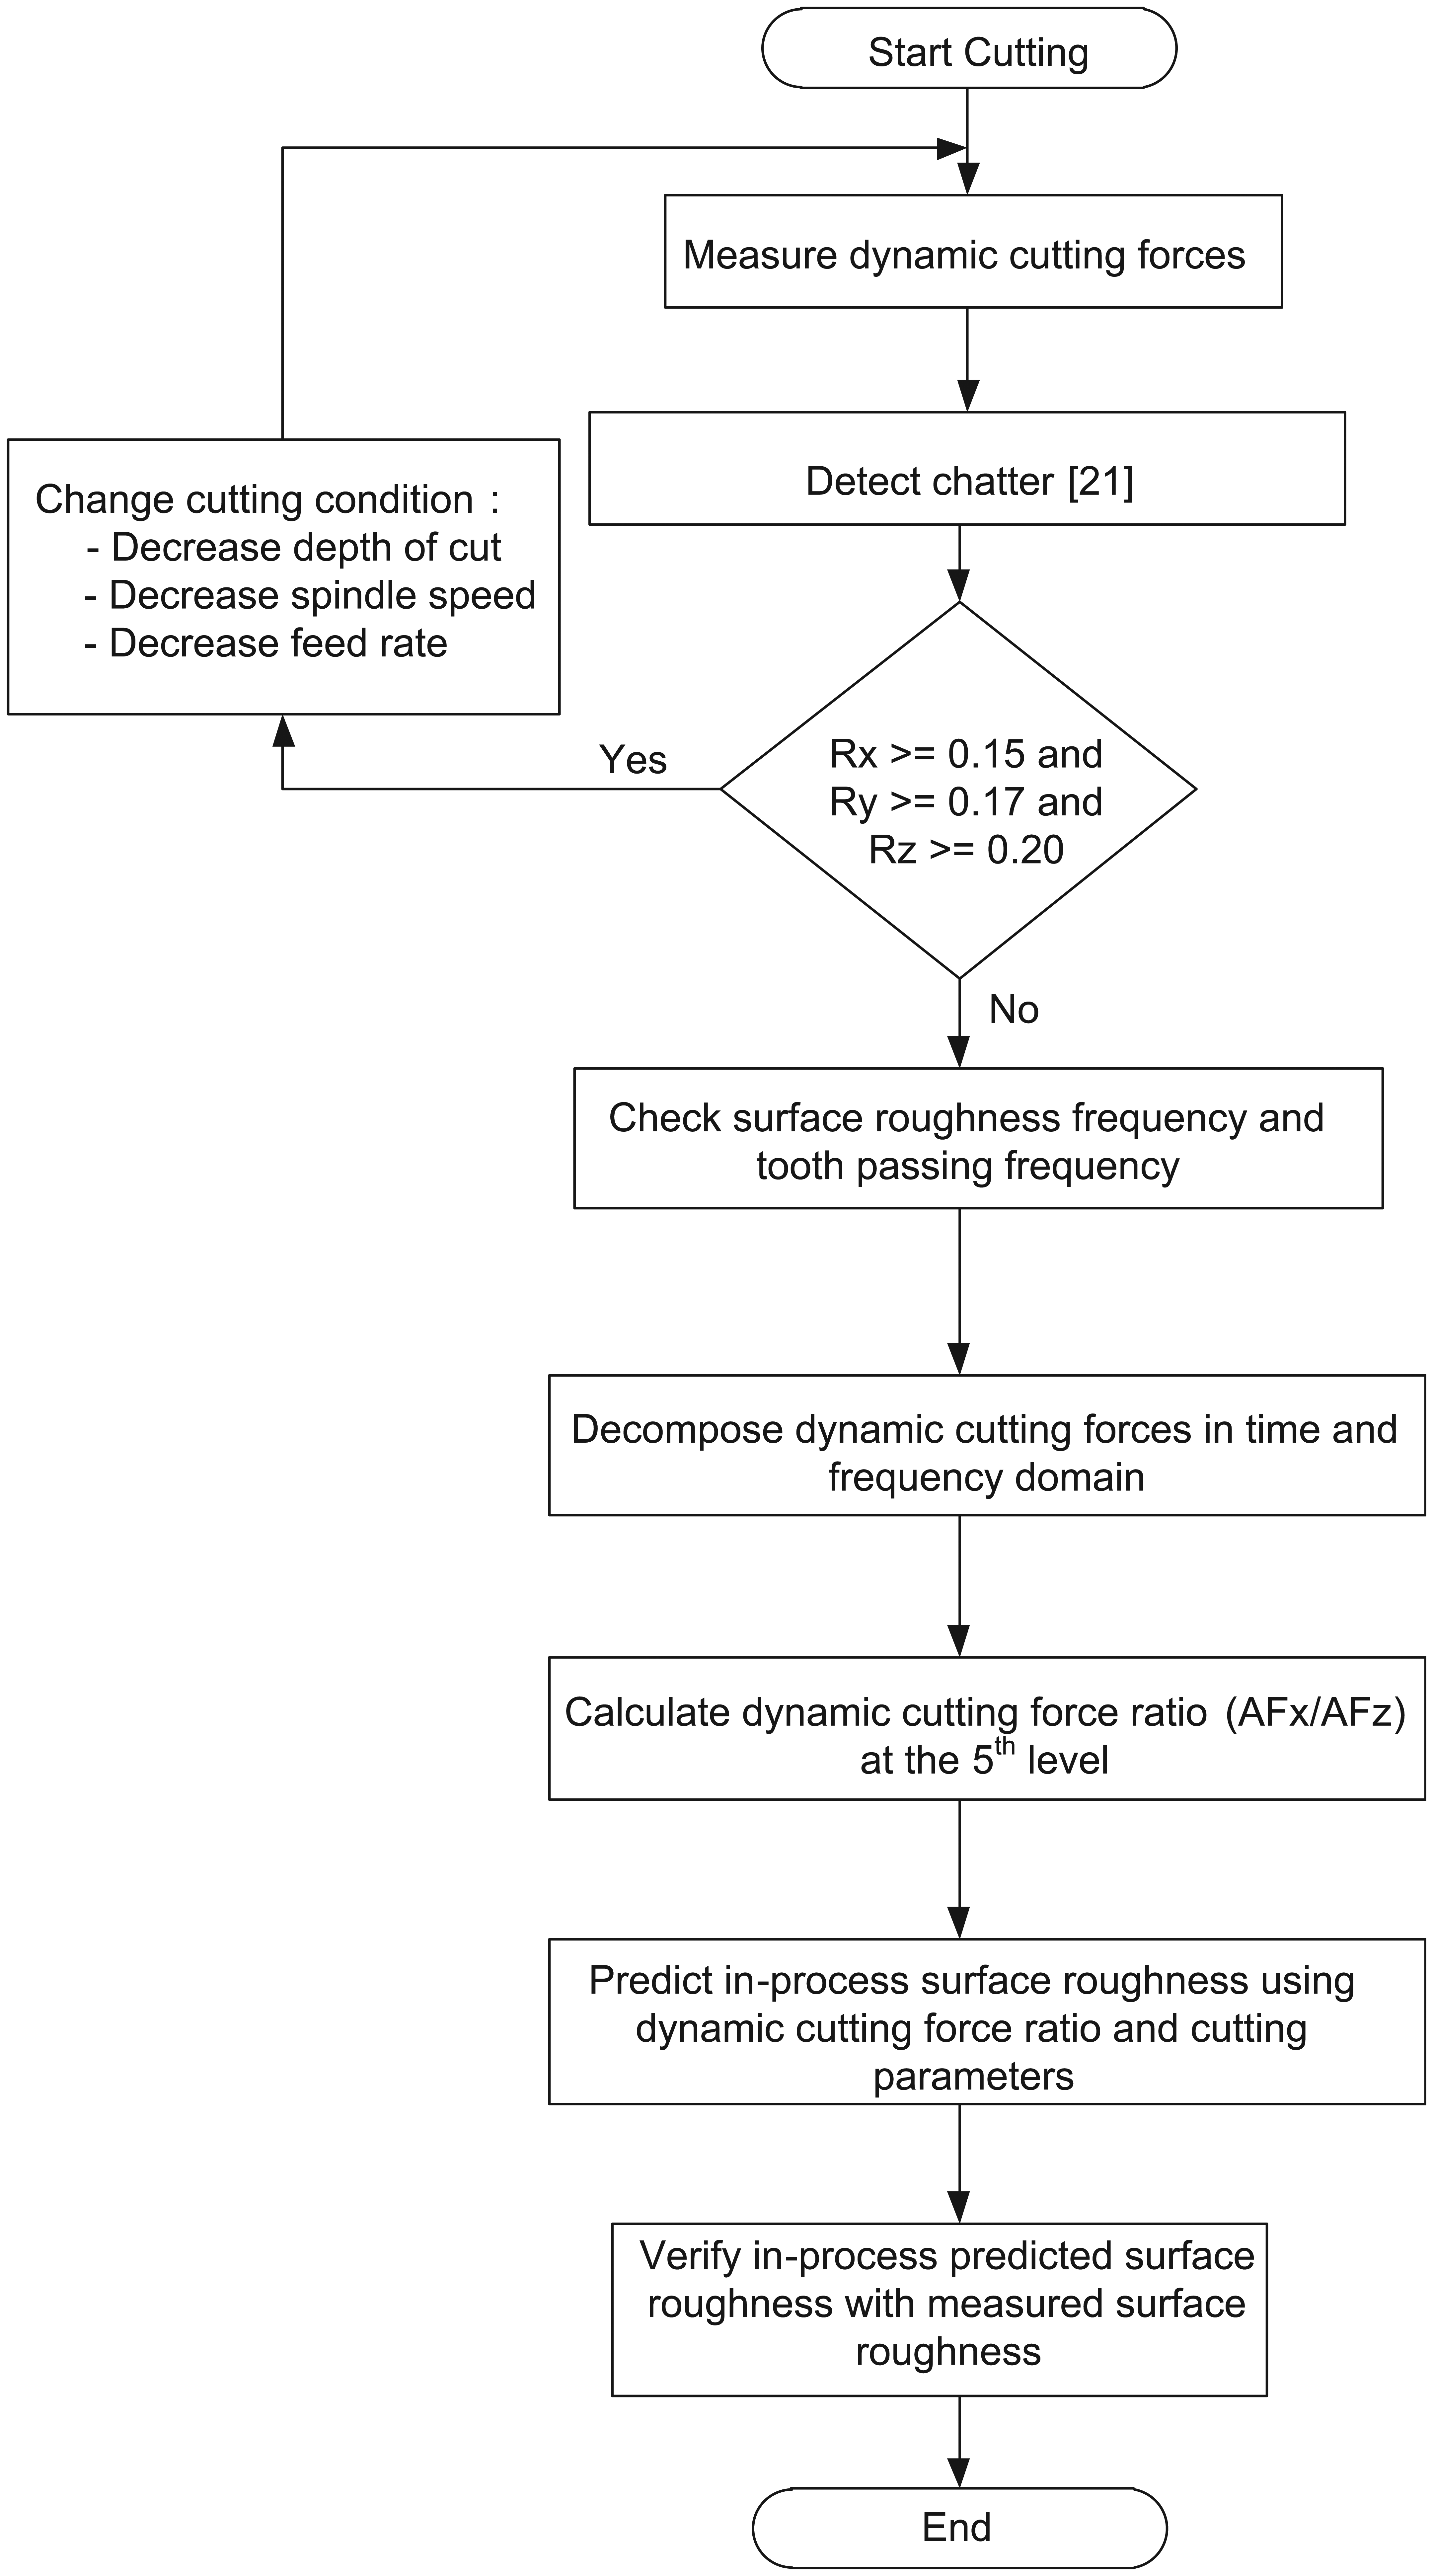
Flowchart to detect the chatter and develop the in-process surface roughness model.
Experimental results and discussions
The experimentally obtained values of parameters Rx, Ry, and Rz are less than the critical values 0.15, 0.17, and 0.20, respectively. The cutting conditions such as the depth of cut, the spindle speed, and the feed rate are altered to avoid the chatter whenever it happens until the normal cutting appears in order to monitor the surface roughness in both time and frequency domains. The in-process surface roughness will be predicted by utilizing the dynamic cutting force ratios, which are decomposed by the Daubechies wavelet transform and calculated by taking the ratio of the decomposed dynamic cutting forces from the fifth level in the X axis to that in the Z axis.
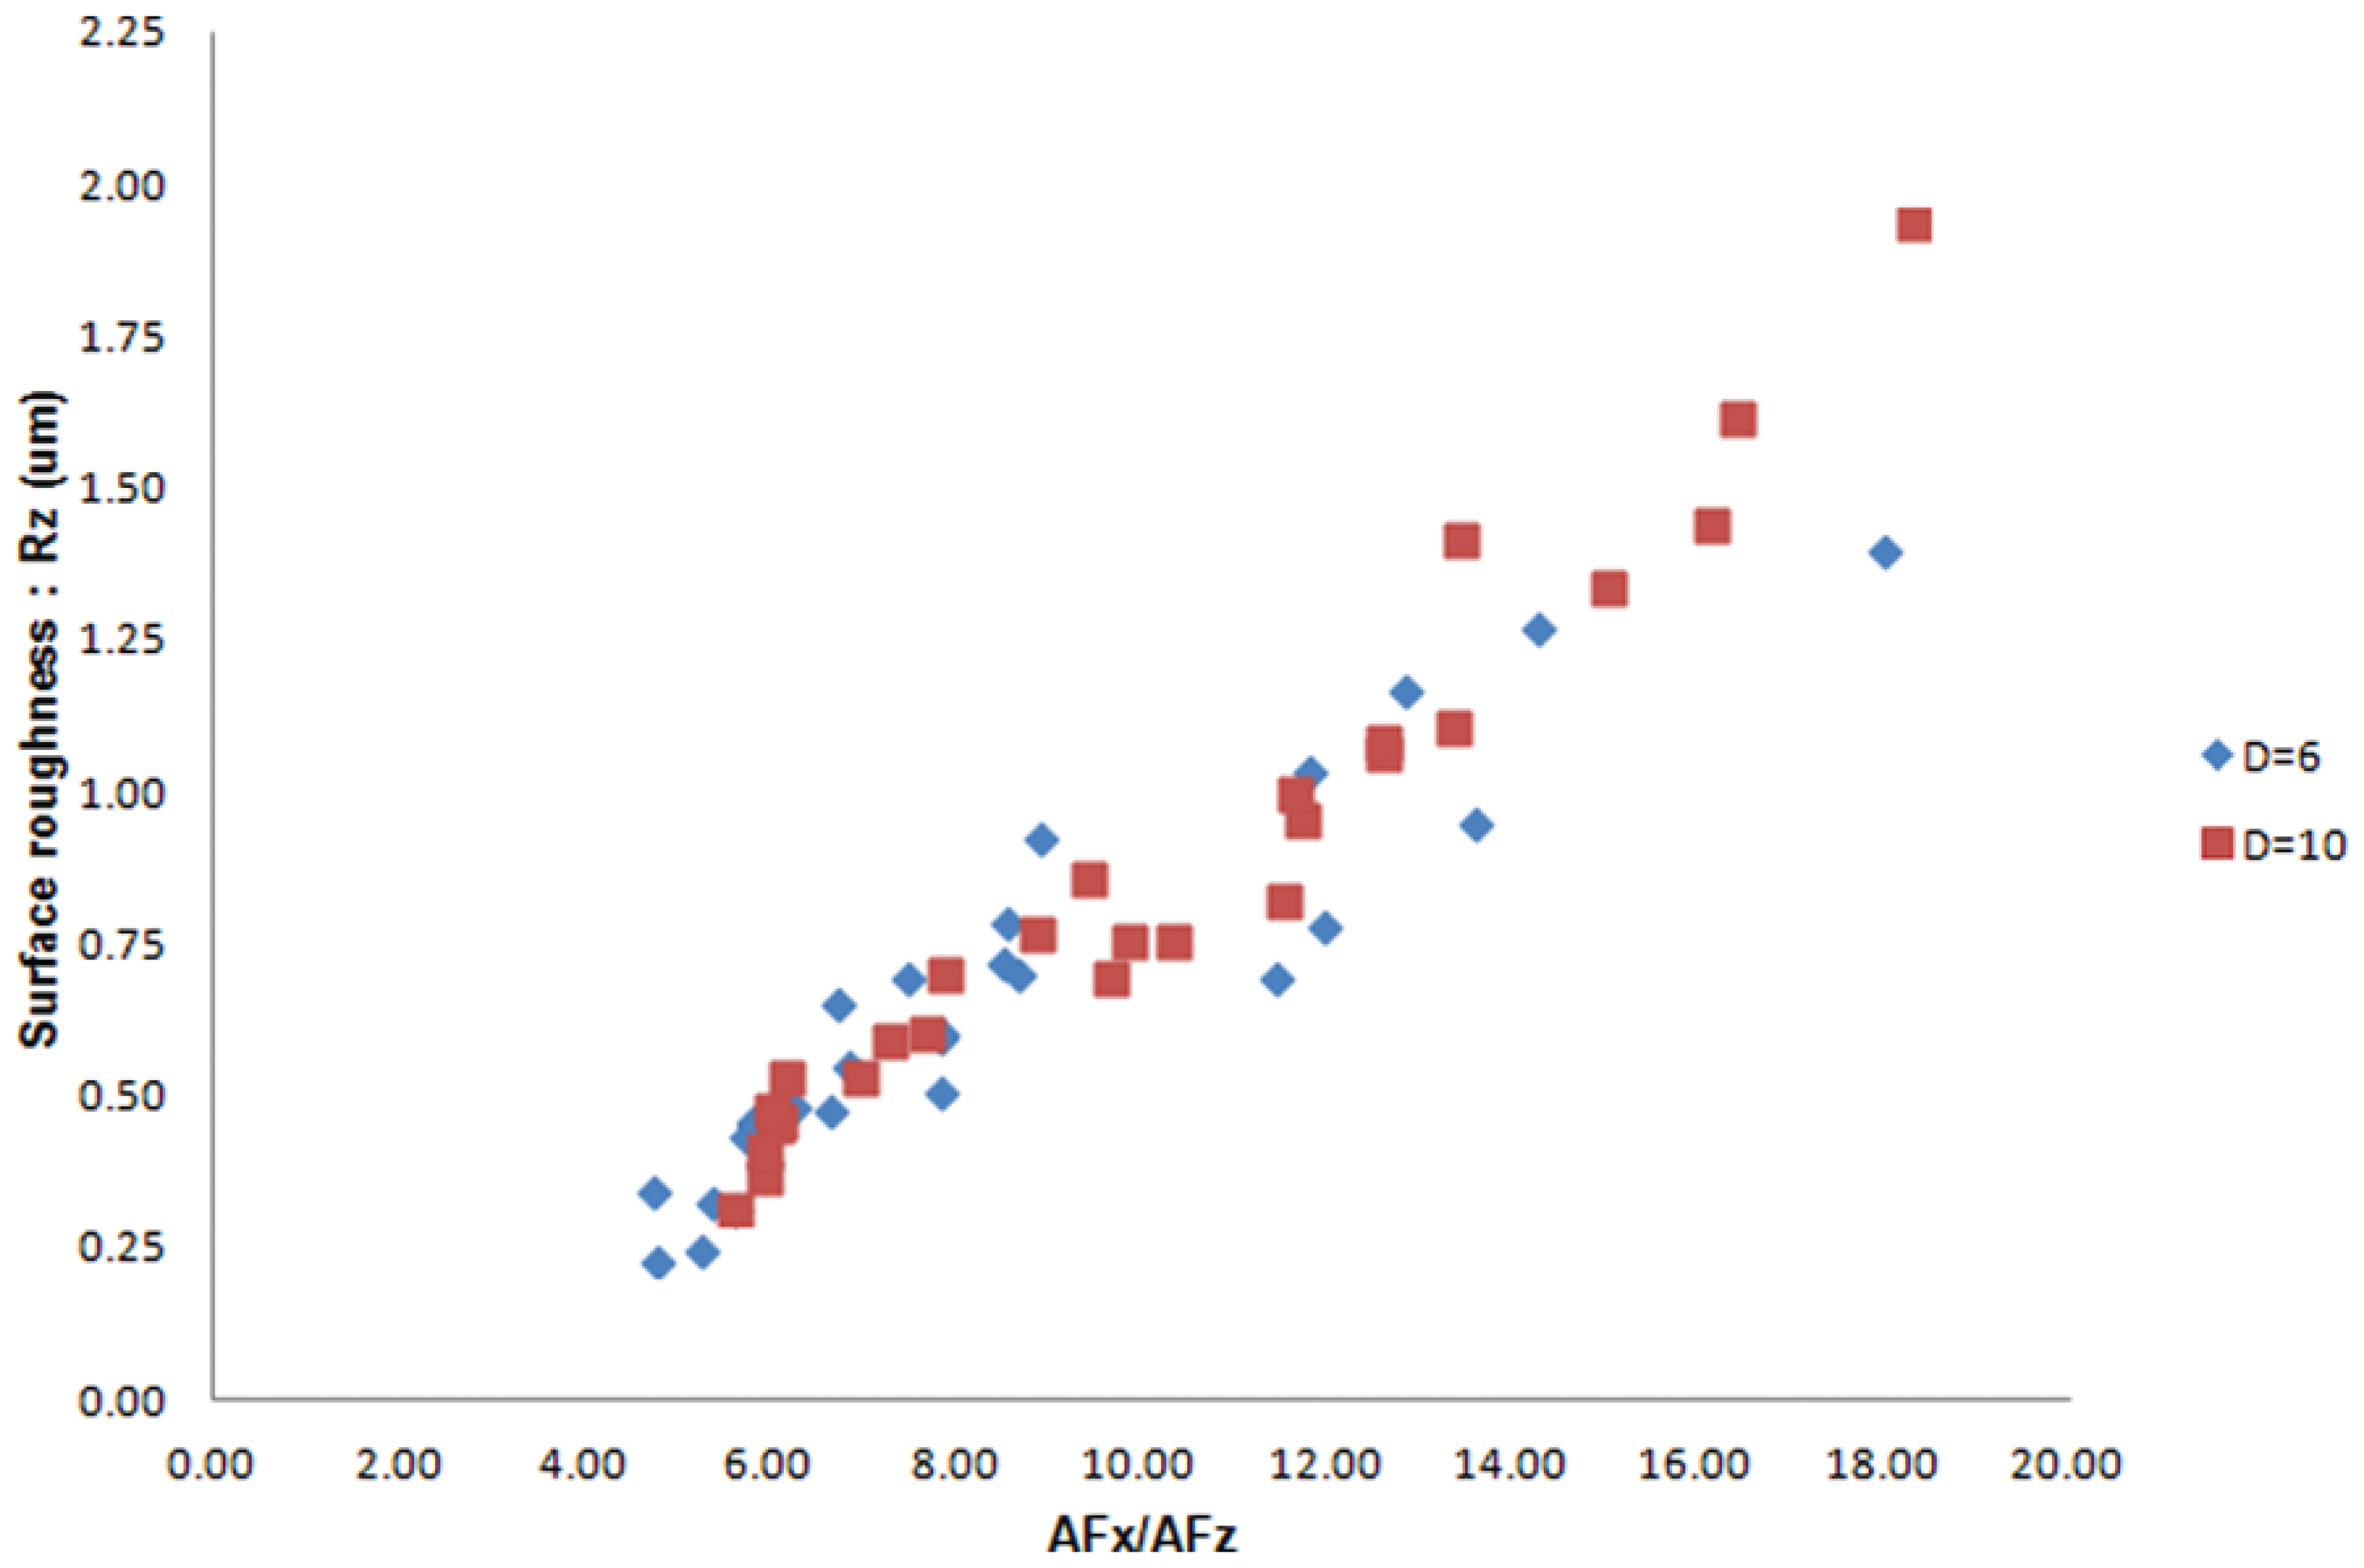
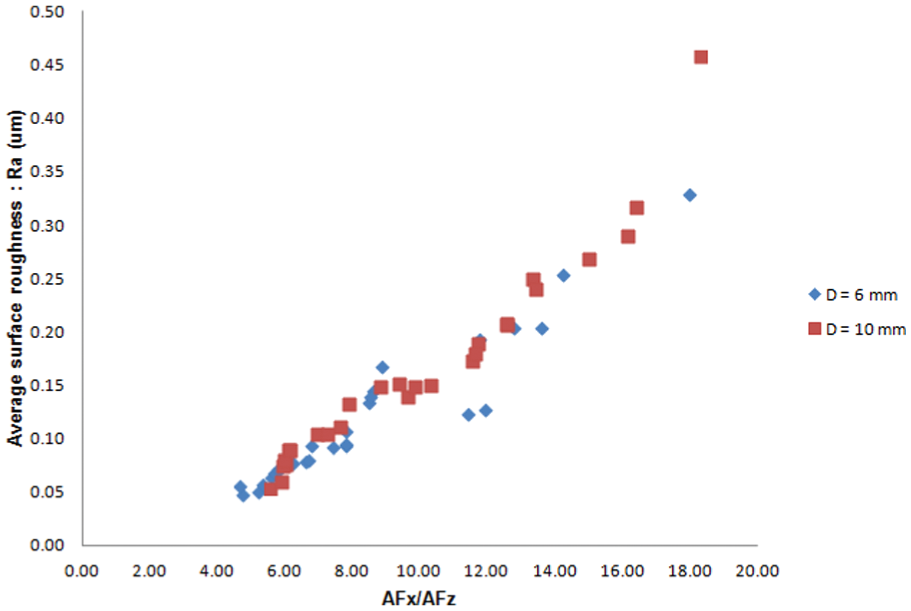
The experimentally obtained relations of the surface roughness and the dynamic cutting force ratio show the same trend although the cutting conditions are different as shown in Figures 8 and 9. It can be stated that the greater the cutting force ratio, the greater the surface roughness. It is interpreted that the surface roughness increases while the cutting area increases in the feed direction. It is understood that the dynamic cutting force ratio obtained from the fifth level of the Daubechies wavelet transform can be used to predict the in-process surface roughness during the cutting process.
Example of experimentally obtained relation between average surface roughness and dynamic cutting force ratio.
Example of experimentally obtained relation between surface roughness and dynamic cutting force ratio.
The experimentally obtained in-process surface roughness models are expressed in equations (3) and (4)
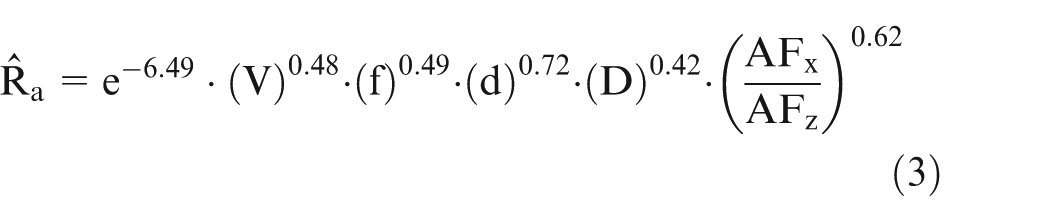
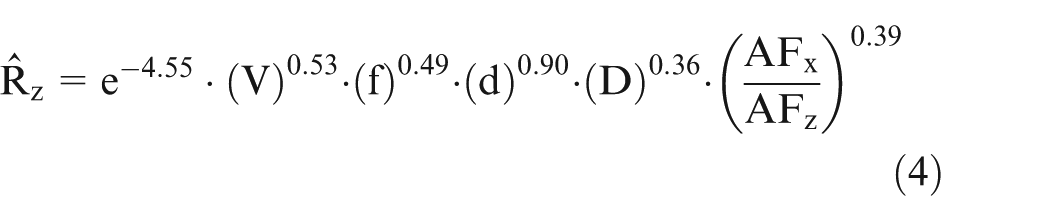
The in-process surface roughness models are obtained at 95% confident level. Therefore, the proposed models are reliable to predict the in-process surface roughness by utilizing the proposed Daubechies wavelet transform to calculate the dynamic cutting force ratio with the cutting parameters of the spindle speed, the feed rate, the tool diameter, and the depth of cut.
According to equations (3) and (4), it is understood that an increase in spindle speed causes the vibration of the cutting tool as a result of the higher surface roughness. It is well known that the higher feed rate causes the poor surface finish which corresponds to the theoretical surface roughness. It is implied that the surface roughness can be improved using a small depth of cut due to the less cutting area. As the tool diameter increases, the cutting area becomes larger which results in higher cutting force, and consequently, the surface roughness increases. The magnitudes of the powers of all parameters in the models respond to those parameters, while the signs of the powers represent the effects of them on the surface roughness, which are consistent with the experimentally obtained results.
The new cutting tests are conducted to verify the model accuracy using the new cutting conditions as shown in Table 2. The algorithm to decompose the dynamic cutting forces to check the chatter and predict the in-process surface roughness is proposed in Figure 10. Figure 10 also illustrates that if Ra and Rz exceed the limited values due to the tool wear effect after the cutting tool is used for a while, the cutting tool will be replaced with a new one. 24
New cutting conditions.
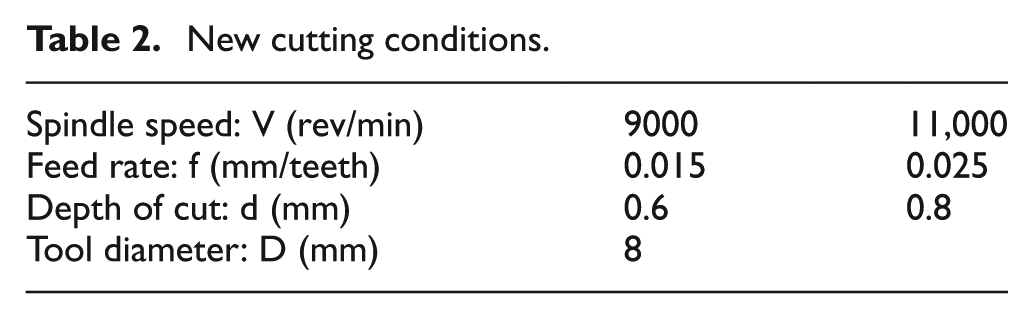
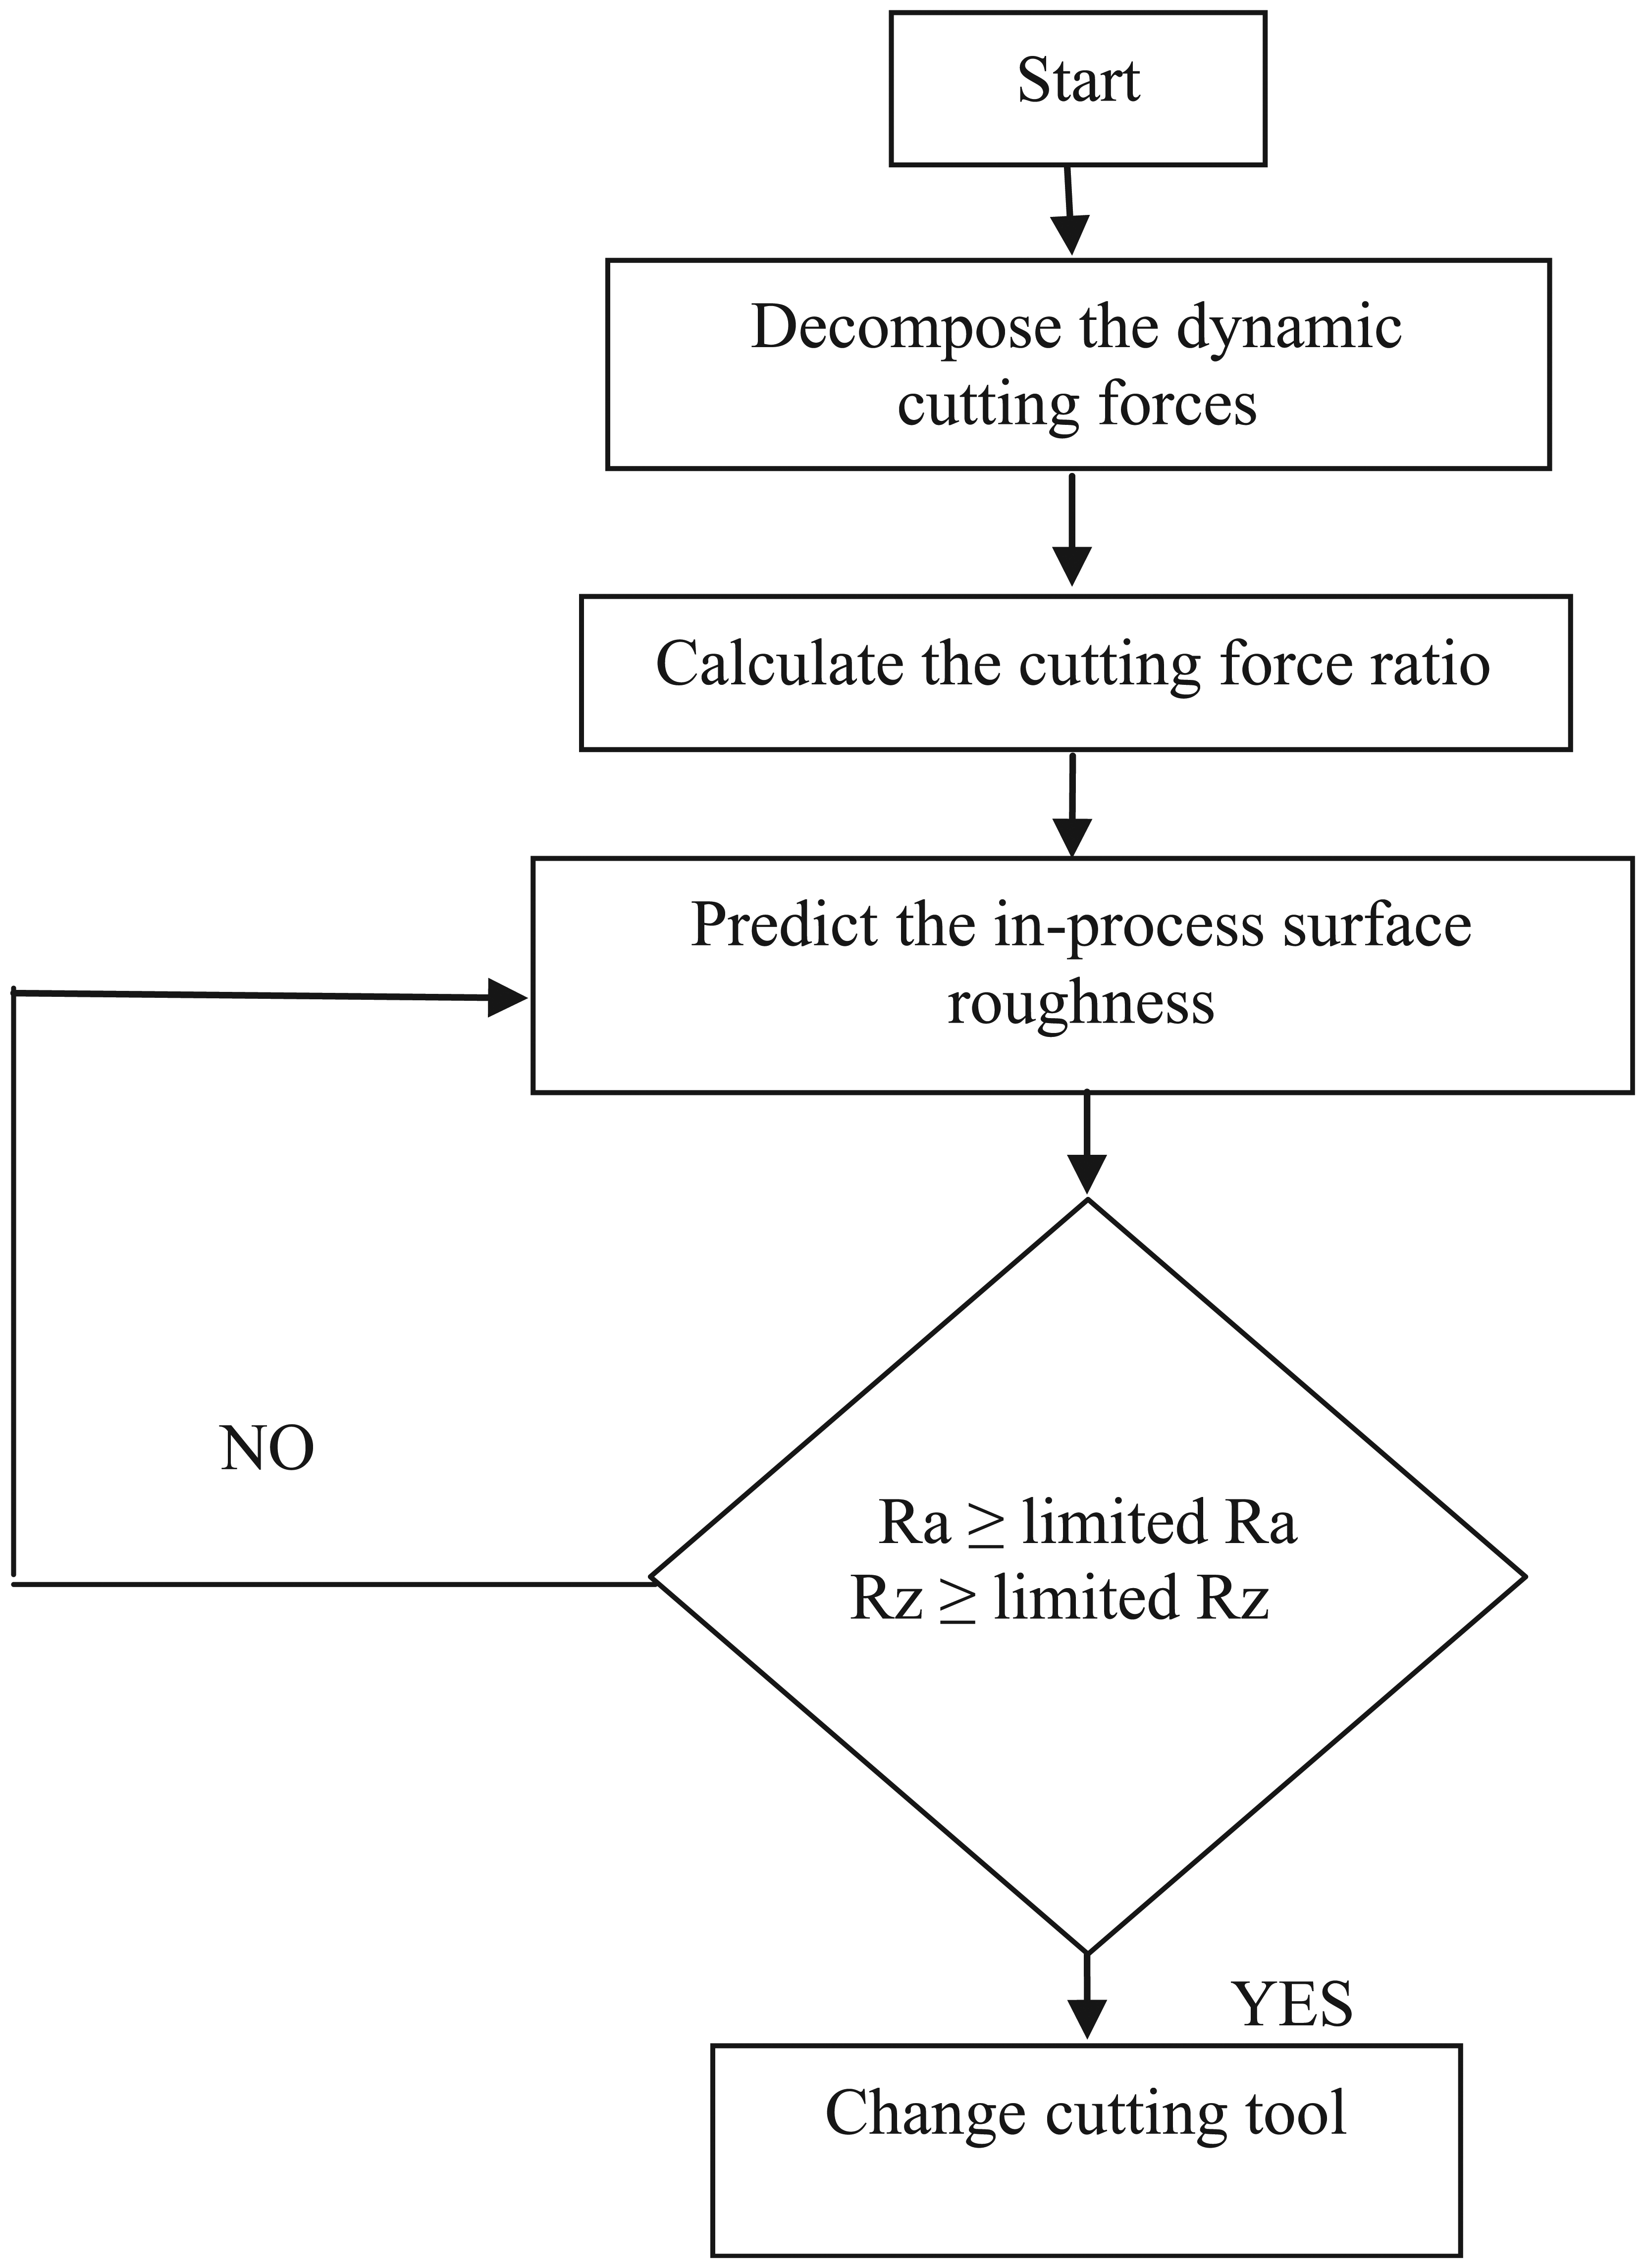
Illustration of algorithm to decompose the dynamic cutting forces to detect the chatter and predict the in-process surface roughness.
Figures 11 and 12 show the experimentally measured surface roughness of the new cutting test and the in-process predicted surface roughness obtained from the models. The values of the in-process predicted surface roughness fall in the ±10% measured surface roughness. It implied that the proposed in-process surface roughness models can be effectively used to monitor and predict the in-process surface roughness referring to the ±10% lines of the specific surface roughness during the cutting regardless of the chatter and the cutting conditions.
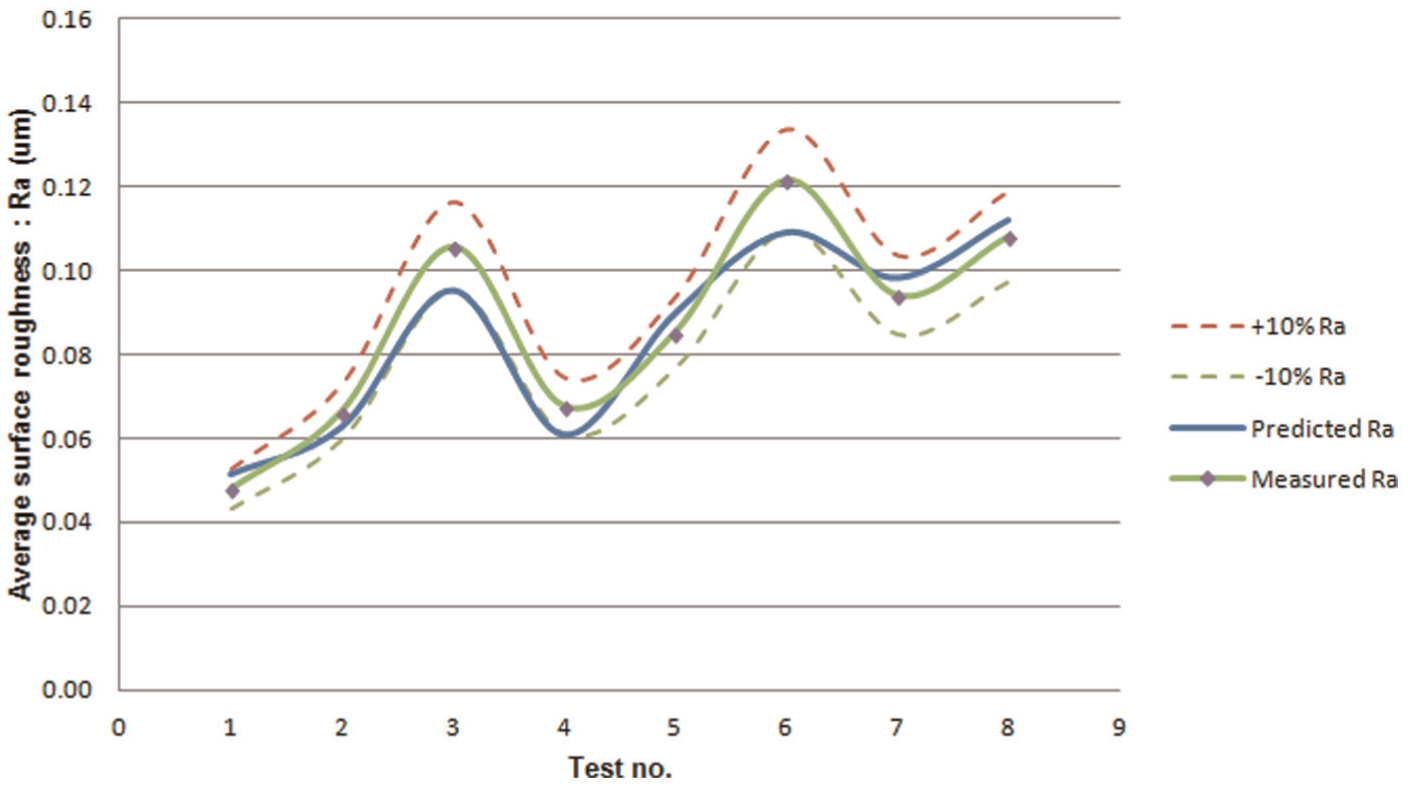
Illustration of the measured average surface roughness, the in-process predicted surface roughness, and the ±10% measured surface roughness.
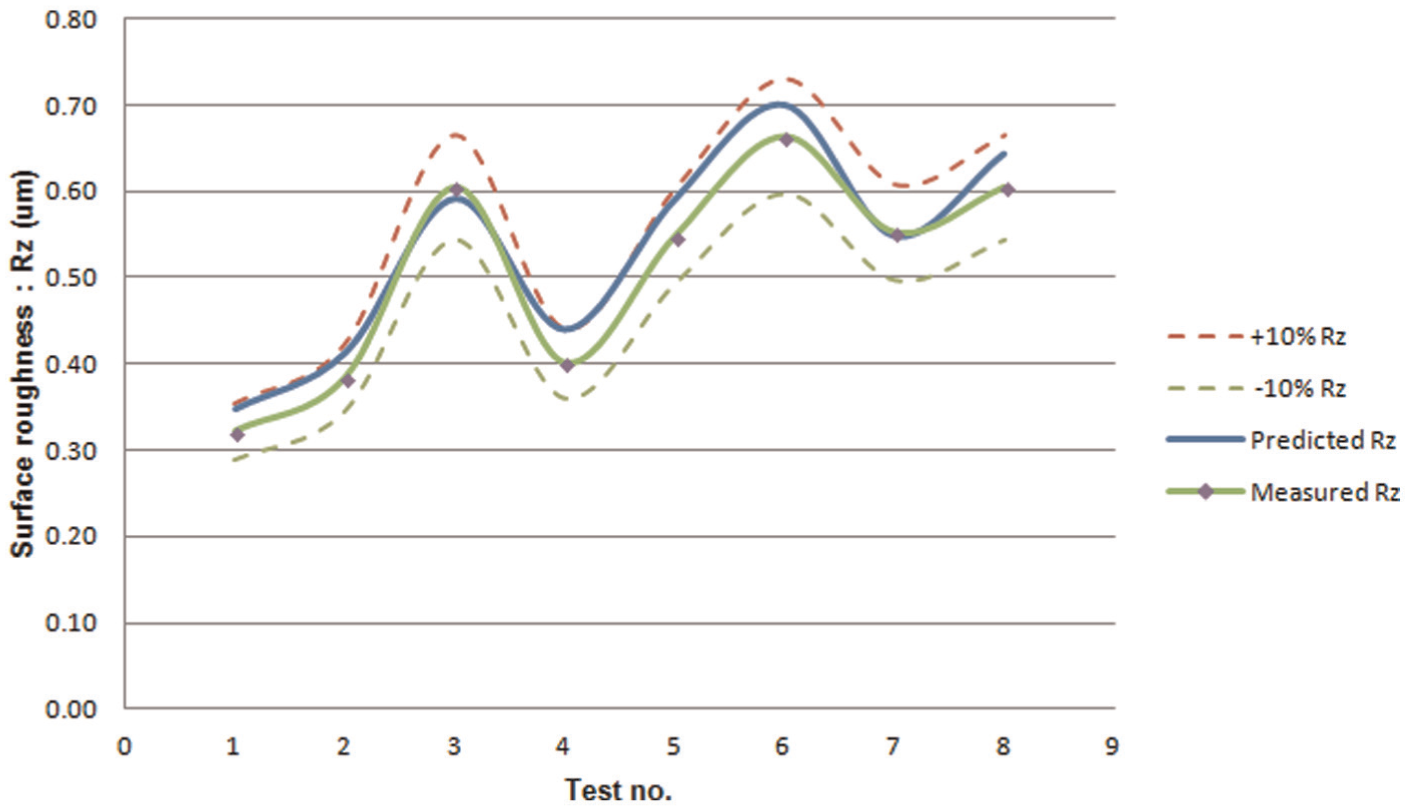
Illustration of the measured surface roughness, the in-process predicted surface roughness, and the ±10% measured surface roughness.
Conclusion
The proposed system in this research can detect the chatter and monitor the surface roughness during the in-process ball-end milling using the Daubechies wavelet transform. First, the previous research of the author is adopted to detect and avoid the chatter. Second, the in-process surface roughness models are proposed and developed by decomposing the dynamic cutting forces to check the surface roughness signal during the normal cutting process without the chatter.
The proposed method decomposes the dynamic cutting forces into five levels in both time and frequency domains to determine the suitable level which corresponds to the surface roughness frequency, which is the fifth level. Hence, the decomposed dynamic cutting force signals obtained from the fifth level are taken into the ratio which is the area of the decomposed dynamic cutting force in X axis to that in Z axis in order to develop the in-process surface roughness prediction models, including the cutting parameters of the spindle speed, the depth of cut, the feed rate, and the tool diameter.
It has been tested that the in-process surface roughness can be predicted effectively under various cutting conditions without the chatter and noise signals during the in-process ball-end milling using the proposed algorithm and system. The highest advantage of the developed method is that the in-process surface roughness can be predicted close to the measured surface roughness within the ±10% lines of the measured surface roughness regardless of the cutting conditions. However, the preliminary experiments are required to obtain the critical values in order to classify the chatter when the cutting conditions have been changed due to the change in the detectable chatter level of the Daubechies wavelet transform.
Footnotes
Declaration of conflicting interests
The author(s) declared no potential conflicts of interest with respect to the research, authorship, and/or publication of this article.
Funding
The author(s) disclosed receipt of the following financial support for the research, authorship, and/or publication of this article: This work was performed by the partial funding of Office of National Research Council of Thailand, Thailand, from October 2008 to September 2010 and The Asahi Glass Foundation, Japan, from 2010 to 2011.