
Abstract
The aim of this research is to monitor and classify the broken chip signals from the dynamic cutting forces, in order to predict the surface roughness during the computer numerical control turning process utilizing the Meyer wavelet transform to decompose the dynamic cutting forces. The dynamic cutting forces of the broken chips and the surface roughness can be decomposed into the different levels. The levels of decomposed cutting forces can aid to explain the broken chip formation and the surface roughness profile in both time and frequency domains. The experimentally obtained results showed that the surface roughness frequency occurs at the higher level of decomposed cutting forces, especially at the fifth level, although the cutting conditions are changed. However, the chip breaking frequency appears at the lower level, which depends on the cutting conditions and the chip length. The ratio of the fifth level of decomposed feed forces to that of main forces is proposed to predict the surface roughness during the in-process cutting. It is understood that the broken chip formation can be separated clearly and the surface roughness can be predicted well during the cutting, regardless of the cutting conditions.
Keywords
Introduction
This article presents a development of the previous researches by Tangjitsitcharoen and colleagues1–3 utilizing the wavelet transform to decompose the dynamic cutting forces in order to classify the surface roughness signal from the chip breaking signals since it is difficult to predict and control the in-process surface roughness while the broken chips occur. However, the relations among the cutting force, the broken chip, and the surface roughness had not been studied.4,5 According to the previous researches, an in-process surface roughness prediction had been developed using the cutting force ratio and the experimentally obtained results showed that the ratio of dynamic cutting forces is more effective and accurate than the use of the static cutting force ratio.2,3 The dynamic cutting forces are hence adopted to monitor the surface roughness. The dynamometer is able to generate the dynamic cutting forces corresponding to the continuous chip, the broken chip, and the surface roughness.
The cutting conditions affect the surface roughness and the dynamic cutting forces such as the cutting speed, the feed rate, the tool nose radius, the depth of cut, and the rake angle.6,7 It is therefore required to investigate the relation between the dynamic cutting force and the surface roughness under various cutting conditions to develop the in-process prediction of surface roughness models, regardless of the cutting conditions and the broken chip formations.
Literature review and wavelet transform approach
Extensive research efforts have been devoted so far to develop the surface roughness models. 8 Unfortunately, the models cannot be used to predict the in-process surface roughness. The artificial neural network and design of experiment have been used in different ways to develop the surface roughness models with some sensor technologies by many researches.9–12 However, the preliminary experiments for specific cases of different conditions are always required to set up the database and train the system. The sensors and the methodologies have been developed to predict the surface roughness.13–15 The proposed techniques had not studied the relation between the chip breaking and the surface roughness because it is difficult to predict the surface roughness due to the noise signals. The feed force is most sensitive to the surface roughness while the main force is affected by the cutting conditions.1–3,16,17 The main force and the feed force are hence normally adopted to predict the surface roughness during the in-process cutting.
It had been proved that the dynamic cutting forces are correspondent with the surface roughness profiles using the fast Fourier transform (FFT) technique. However, the FFT technique cannot be used to analyze the surface roughness signal from the dynamic cutting forces while the broken chip occurs. Since the amplitudes of dynamic cutting forces are relatively large when the broken chips appear during the cutting which leads to the difficulty to estimate the surface roughness.18,19 Moreover, the surface roughness profile cannot be identified from the dynamic cutting forces while the broken chips happen because the surface roughness signal is dominant by the effect of chip breaking frequency and its amplitude in both time and frequency domains.2,3,20,21 Hence, it is necessary to decompose the dynamic cutting forces in order to classify the broken chip signals from the surface roughness signal in order to develop the in-process prediction of surface roughness models.
The wavelet transform technique is the time-frequency analysis tool which has been widely used to detect the chatter,22–24 the tool failure, 25 the tool life, 26 the tool wear, and the chip formation 27 in both time and frequency domains. However, a wavelet technique has still not been approached to identify the surface roughness and broken chip signals. The wavelet transform can decompose the dynamic cutting forces into many levels to analyze the detail signals and the approximation signals. The different levels of wavelet transform correlate with the different frequency ranges.22,24,25 It is expected that the chip breaking frequency may appear on the lower level of decomposed cutting forces while the higher level of them is proper to examine the surface roughness frequency. If the decomposed level of the dynamic cutting force is determined suitably, the surface roughness will be calculated correctly without the chip breaking and noise signals.
The Meyer wavelet transform is one of the most promising wavelet and its pattern is similar to the dynamic cutting forces in turning. Hence, the Meyer wavelet transform is employed to monitor the level of decomposed cutting forces which corresponds to the surface roughness profile and frequency to develop the in-process surface roughness models which can be used in practice.
Therefore, the aim of this research is to propose and develop the in-process prediction of surface roughness models in the computer numerical control (CNC) turning using the Meyer wavelet transform to decompose the dynamic cutting forces to classify the broken chip and surface roughness signals in both time and frequency domains. Consequently, the in-process prediction of surface roughness models will be developed utilizing the decomposed cutting forces, which corresponds to the surface roughness profile and frequency. However, the dynamic cutting forces depend on the cutting conditions, such as the hardness of work material, which affect the quality of the surface roughness. It is necessary to normalize and dimensionless the decomposed cutting forces to eliminate the effect of those combinations of the cutting conditions. The ratio of the decomposed cutting forces, which can cut-off the variation of the cutting conditions in its components,1–3 is proposed to predict the in-process surface roughness, although the cutting conditions are changed.
Preliminary experimental results
Dynamic cutting forces of surface roughness and continuous chip formation
According to the theoretical surface roughness and the previous researches by Tangjitsitcharoen and colleagues,2,3 the surface roughness profile is correspondent with the dynamic cutting forces as shown in Figure 1. It is implied that the dynamic cutting forces can be utilized to predict the in-process surface roughness during the CNC cutting.
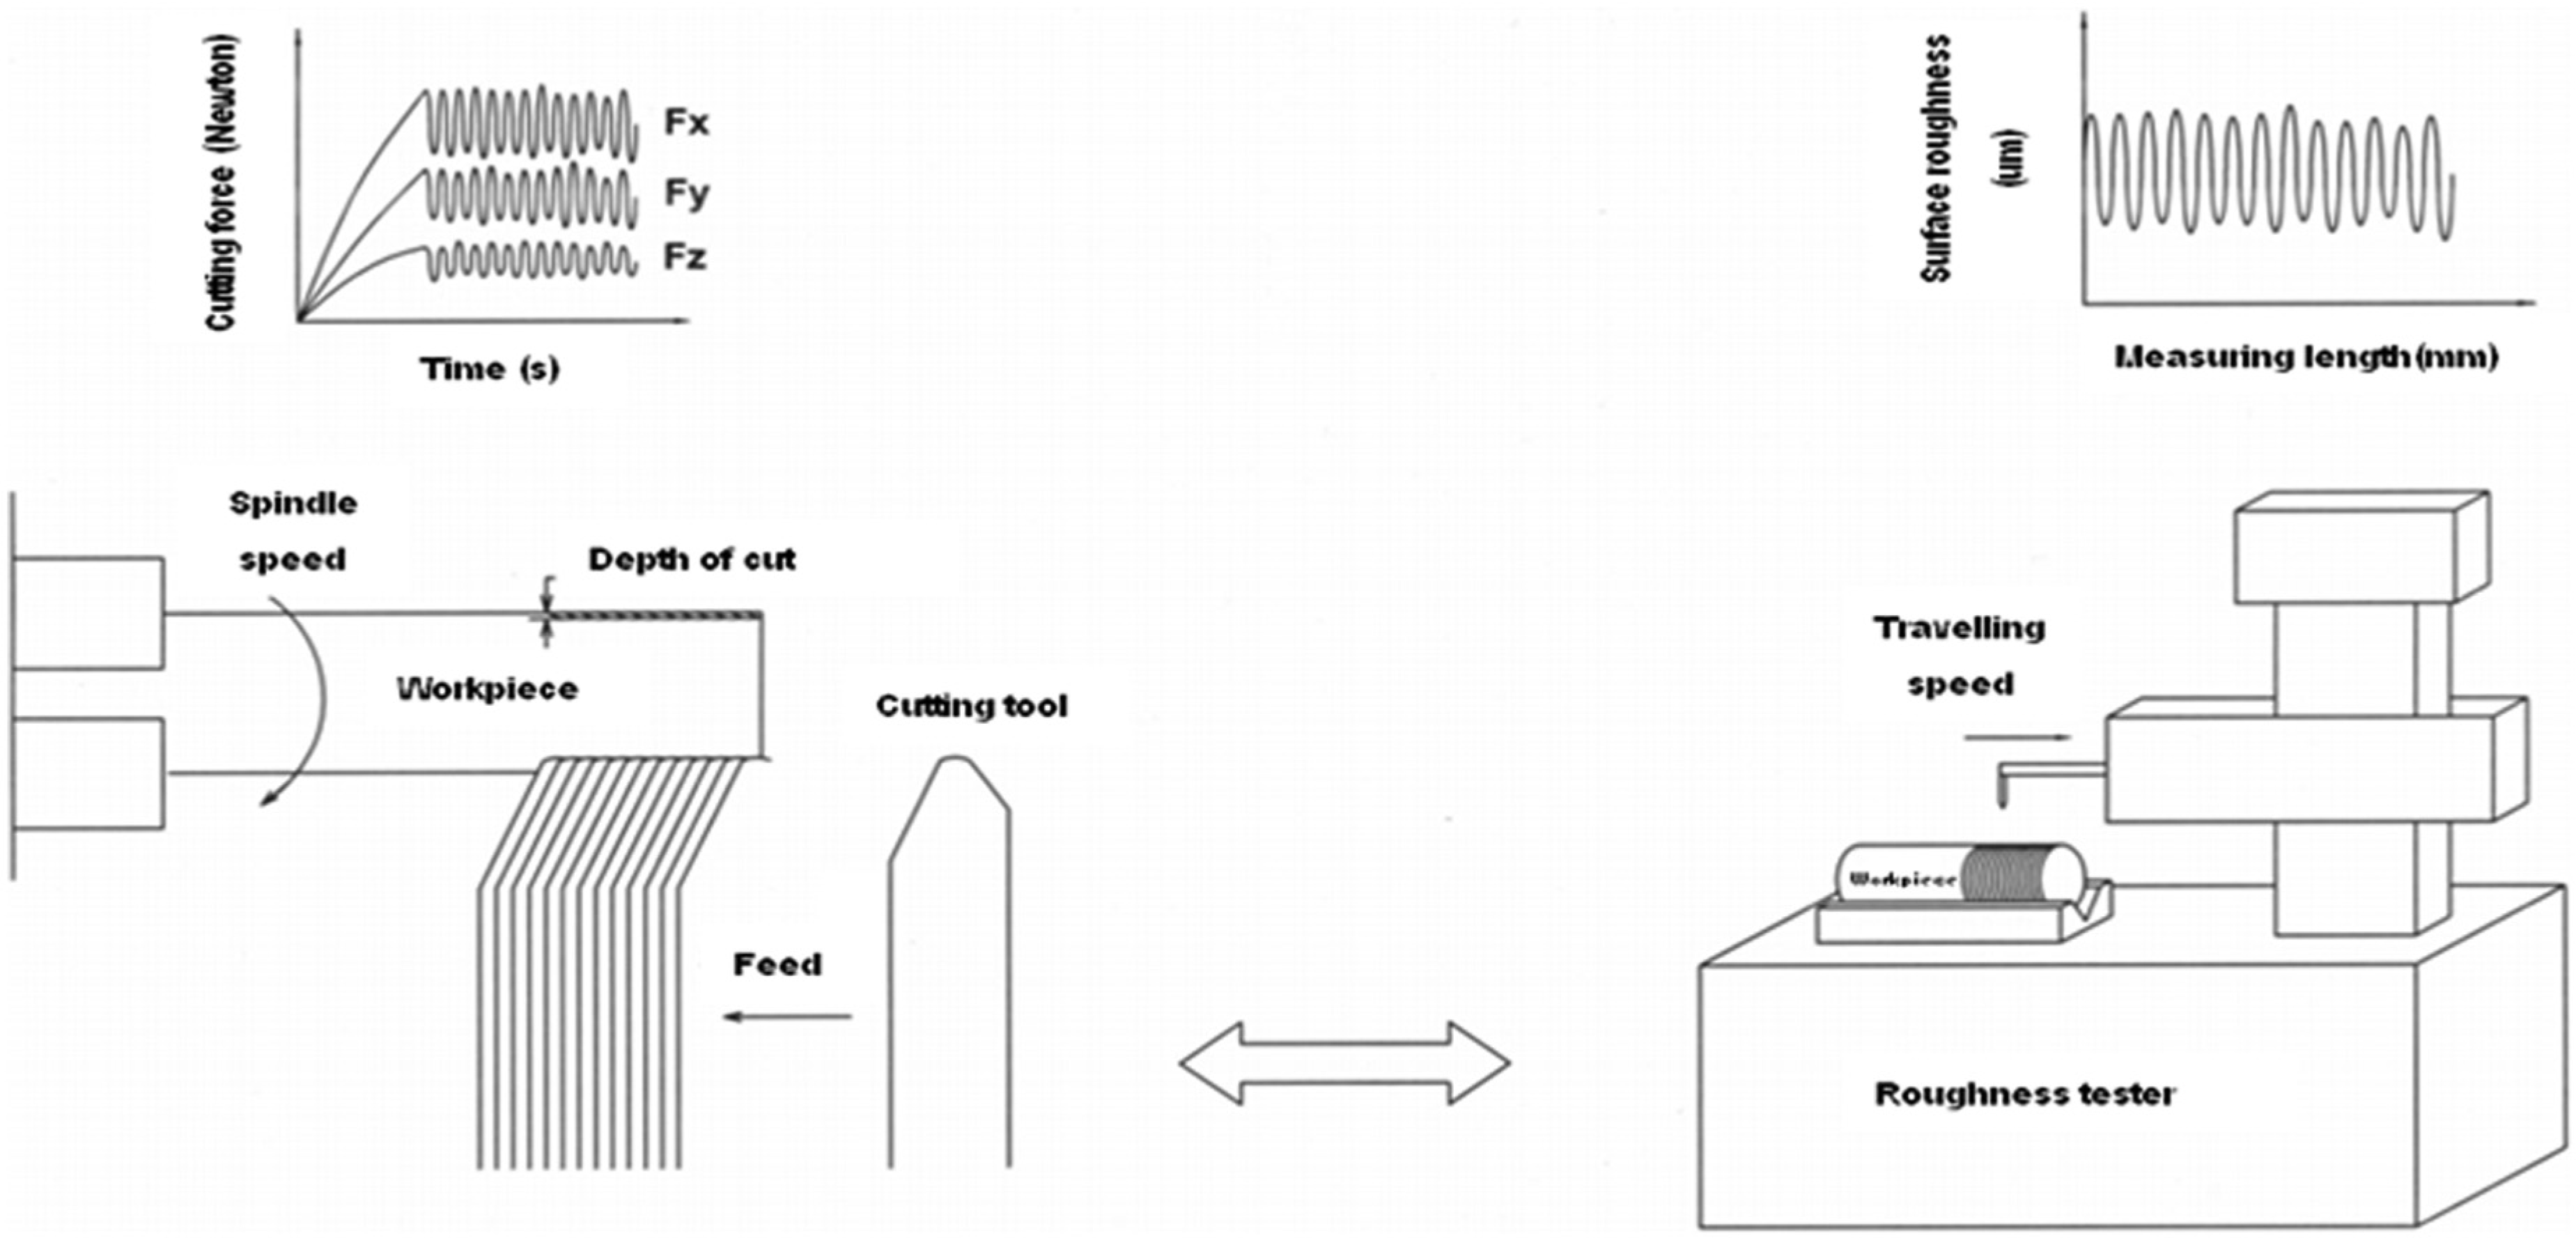
Illustration of relation between dynamic cutting forces and surface roughness profile in CNC turning process.
Figure 2 illustrates the preliminary experiments of the dynamic cutting forces and the surface roughness profile when the continuous chip occurs in the time domain. The surface roughness profile is correspondent with the dynamic cutting forces. The experimentally obtained dynamic cutting forces are small in amplitude when the chips are continuous. Figure 3 shows their power spectrum densities (PSDs) in the frequency domain by taking the FFT of the signals in Figure 2. The PSDs of dynamic cutting forces and surface roughness profile appear at the same frequency of 22.5 Hz as shown in Figure 3. But their PSDs of dynamic cutting forces are relatively small, which compare to the one from the surface roughness profile, and appear at low-frequency range due to the longer chip length.18,19
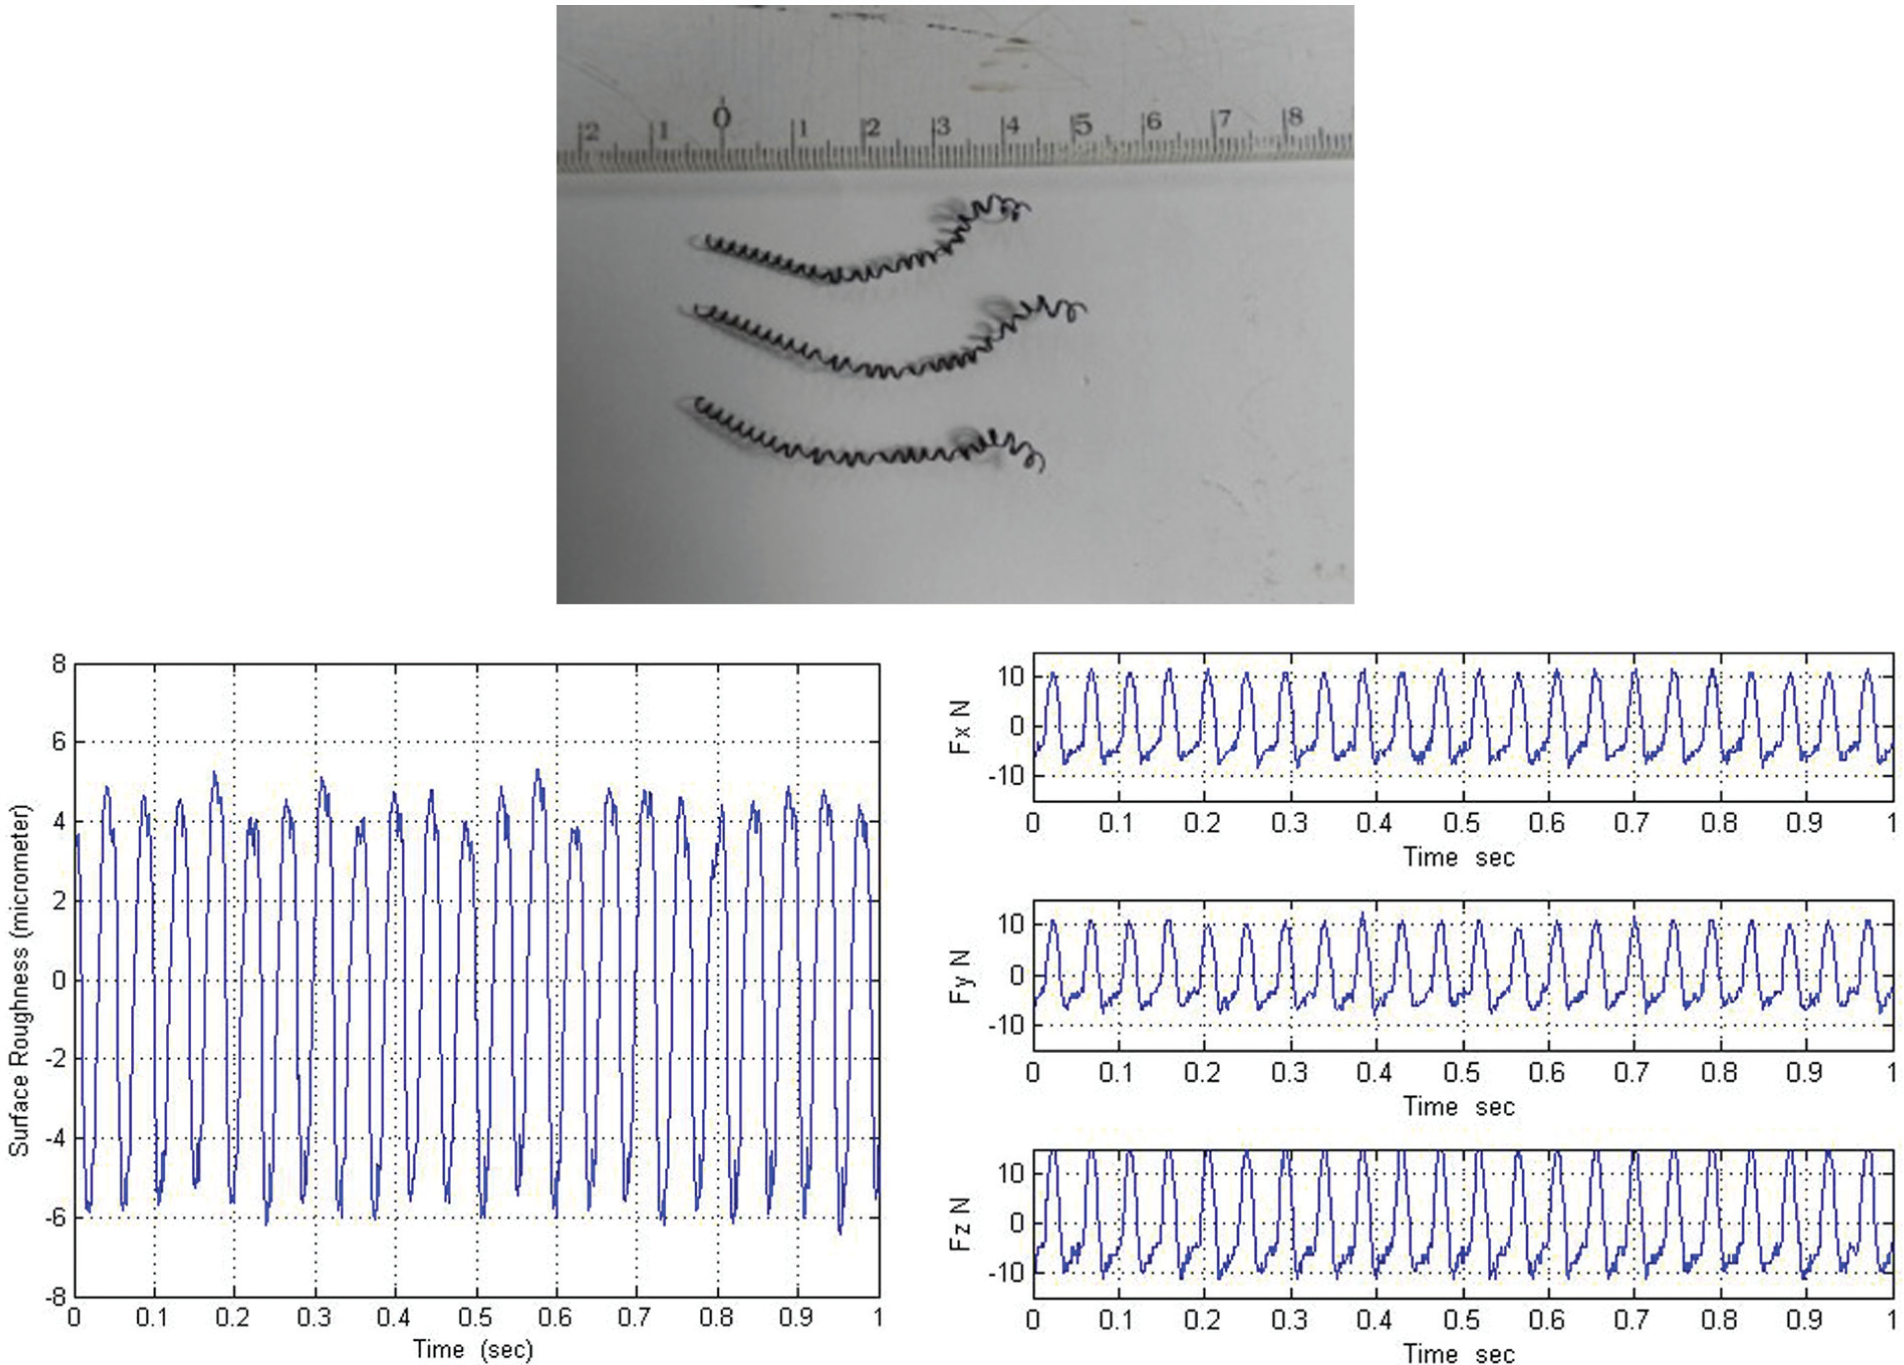
Example of the dynamic cutting forces of continuous chip and the surface roughness profile in the time domain with the cutting speed of 180 m/min, the feed rate at 0.2 mm/rev, the depth of cut of 0.2 mm, the tool nose radius of 0.4 mm, and the rake angle of −6°.
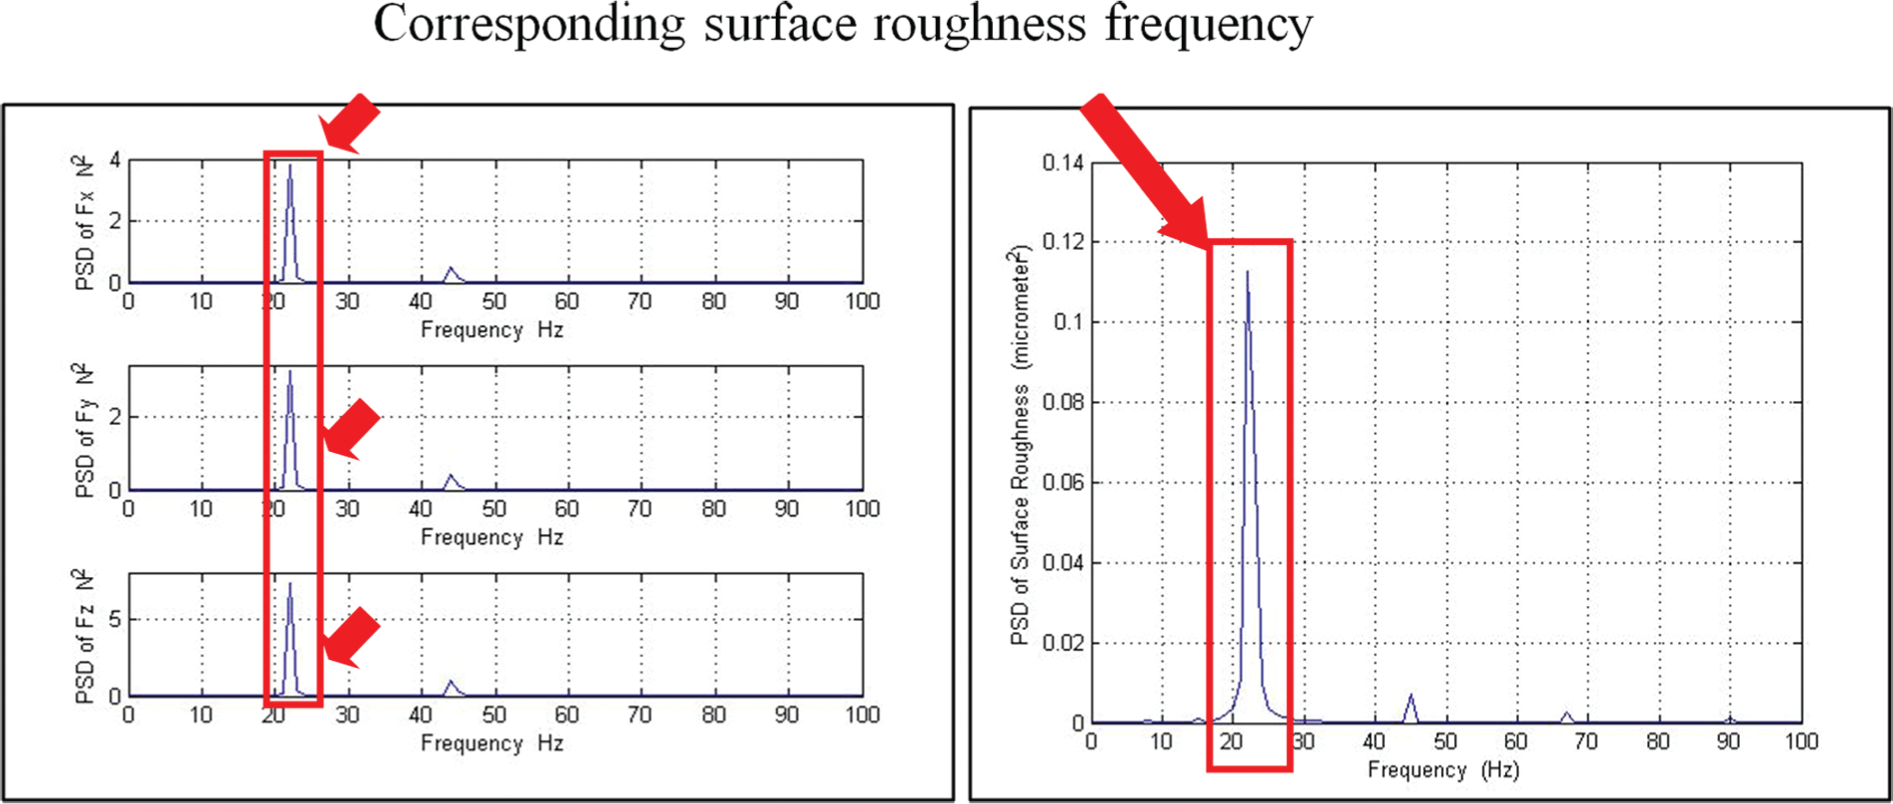
Example of the PSD of dynamic cutting forces of continuous chip and the PSD of surface roughness profile in the frequency domain with the cutting speed of 180 m/min, the feed rate at 0.2 mm/rev, the depth of cut of 0.2 mm, the tool nose radius of 0.4 mm, and the rake angle of −6°.
The dynamic cutting forces can be decomposed by the Meyer wavelet transform into many levels for the detail signals and the approximate signals to analyze the surface roughness signal and the broken chip signal. The different levels have been sensitive to the different frequency intervals. Hence, it is very important to select the suitable level of the decomposed cutting force, which corresponds with the surface roughness signal. If the decomposed level of the wavelet transform is predetermined properly, the in-process surface roughness will be predicted correctly. The preliminary experiments and the previous research 22 showed that the use of five levels of wavelet transform is proper to detect the chip breaking and surface roughness signals occurring at the low-frequency range which is less than 500 Hz. It is understood that the lower frequency signal will appear at the higher level of the wavelet transform. In contrast, the higher frequency signal will happen at the lower level of the wavelet transform.
The dynamic cutting forces are decomposed into five levels in the time domain and also in the frequency domain as shown in Figures 4 and 5, respectively. It is shown that the frequency of decomposed cutting forces is the same as the surface roughness frequency at the fifth level when the continuous chip occurs. Hence, the fifth level of the decomposed cutting forces will be calculated to predict the in-process surface roughness.
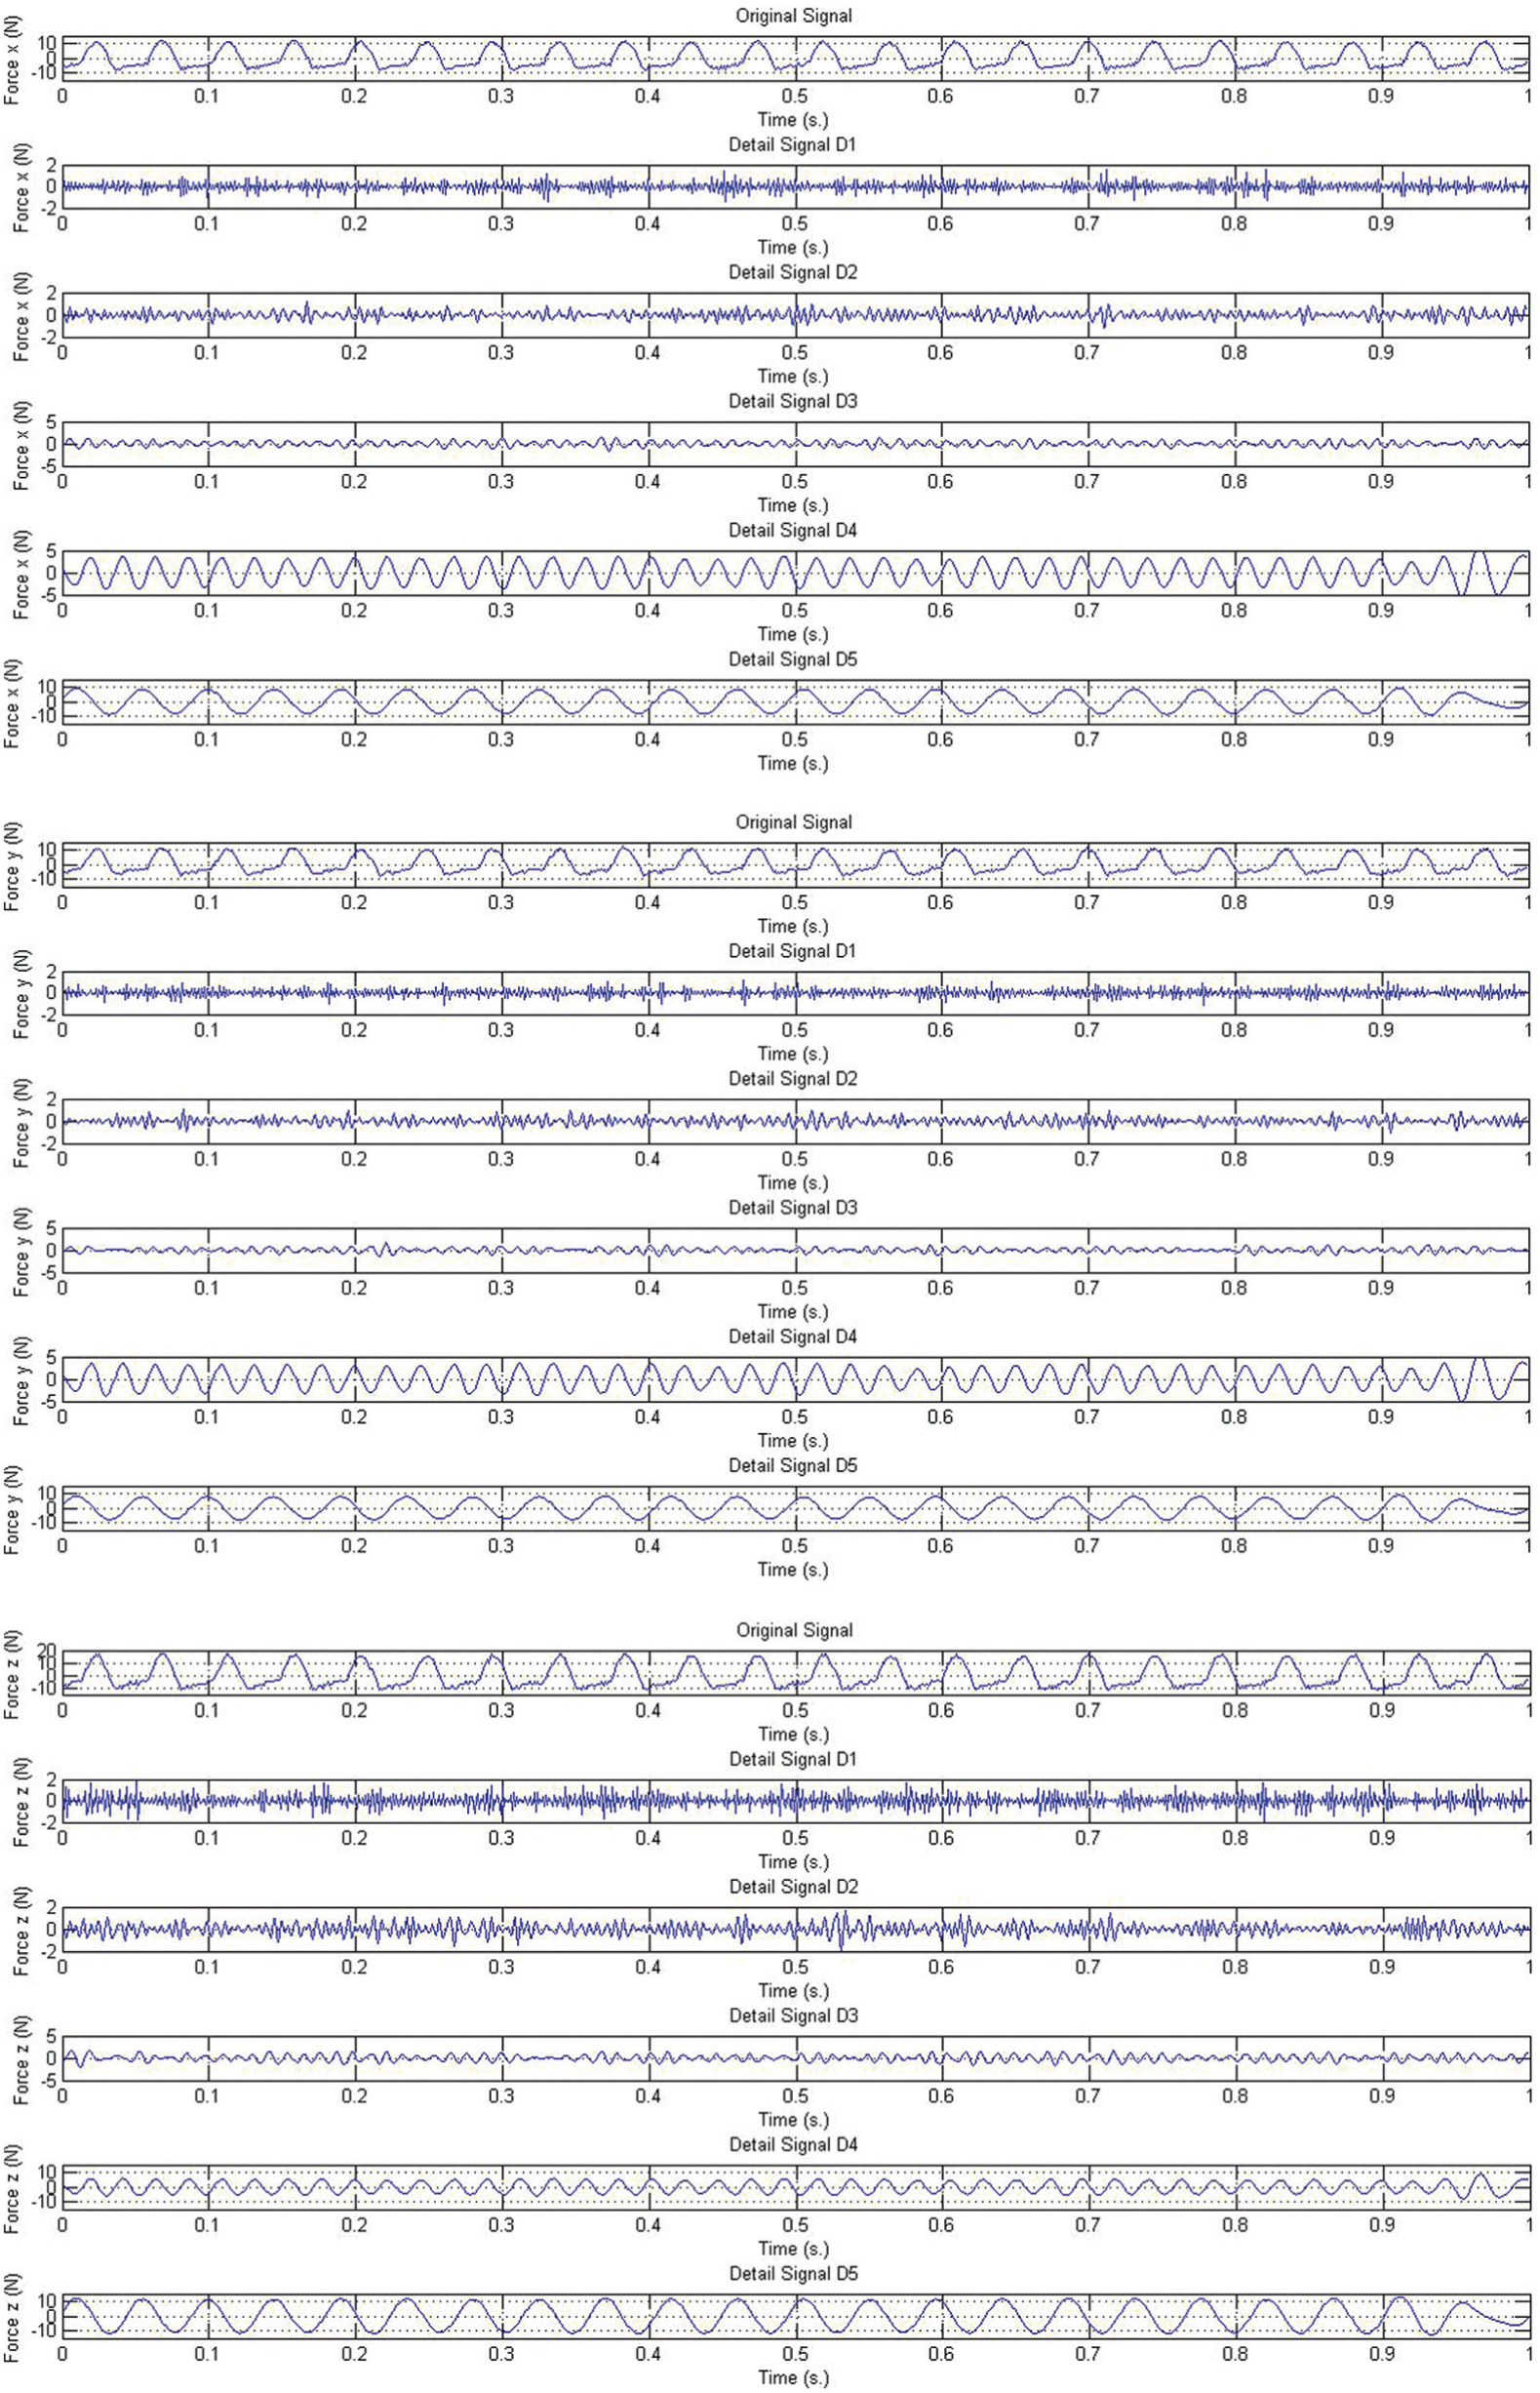
Example of the decomposed cutting forces of continuous chip in the time domain of the wavelet transform with the cutting speed of 180 m/min, the feed rate at 0.2 mm/rev, the depth of cut of 0.2 mm, the tool nose radius of 0.4 mm, and the rake angle of −6°.
Example of the PSD of decomposed cutting forces of continuous chip in the frequency domain of the wavelet transform with the cutting speed of 180 m/min, the feed rate at 0.2 mm/rev, the depth of cut of 0.2 mm, the tool nose radius of 0.4 mm, and the rake angle of −6°.
The ratio of the decomposed dynamic cutting forces is proposed to predict the surface roughness regardless of cutting conditions because it can cut-off the variation of the cutting conditions in its components. The dimensionless ratio of decomposed dynamic cutting force consists of the decomposed dynamic main force
Relations of cutting conditions, dynamic cutting forces, and surface roughness
In case of turning process, the cutting conditions such as the feed rate, the cutting speed, the depth of cut, and the tool nose radius affect the surface roughness. 6 Since the feed rate and the tool nose radius are generally adopted to be monitored, as they are directly related to the theoretical surface roughness.
The larger tool nose radius gives the low theoretical surface roughness, while the higher feed rate increases the theoretical surface roughness. The better surface roughness is expected to be obtained at small depth of cut since the surface roughness depends on the cutting force. The cutting force affects the vibration of cutting tool during the cutting which leads to the poor surface roughness.
Generally, the cutting force increases with an increase in the depth of cut and the feed rate. Hence, as the larger cutting force appears, the higher surface roughness will occur. A selected cutting speed may cause the suitably in-process cutting temperature, and hence, the work material becomes soft and easy to cut. Consequently, the quality of surface roughness is good.
It is therefore required to know the relations of the feed rate, the tool nose radius, the cutting speed, the depth of cut, the cutting force, and the surface roughness. Hence, the above cutting parameters will be considered to estimate the in-process surface roughness.
In-process prediction of surface roughness
In order to estimate the in-process surface roughness during the cutting, the ratio of decomposed dynamic forces and the cutting parameters are utilized in the models. The decomposed feed and main forces can be calculated utilizing the trapezoidal rule. According to the preliminary experiments, Figure 6 shows the example of calculation of the fifth level of decomposed feed force (
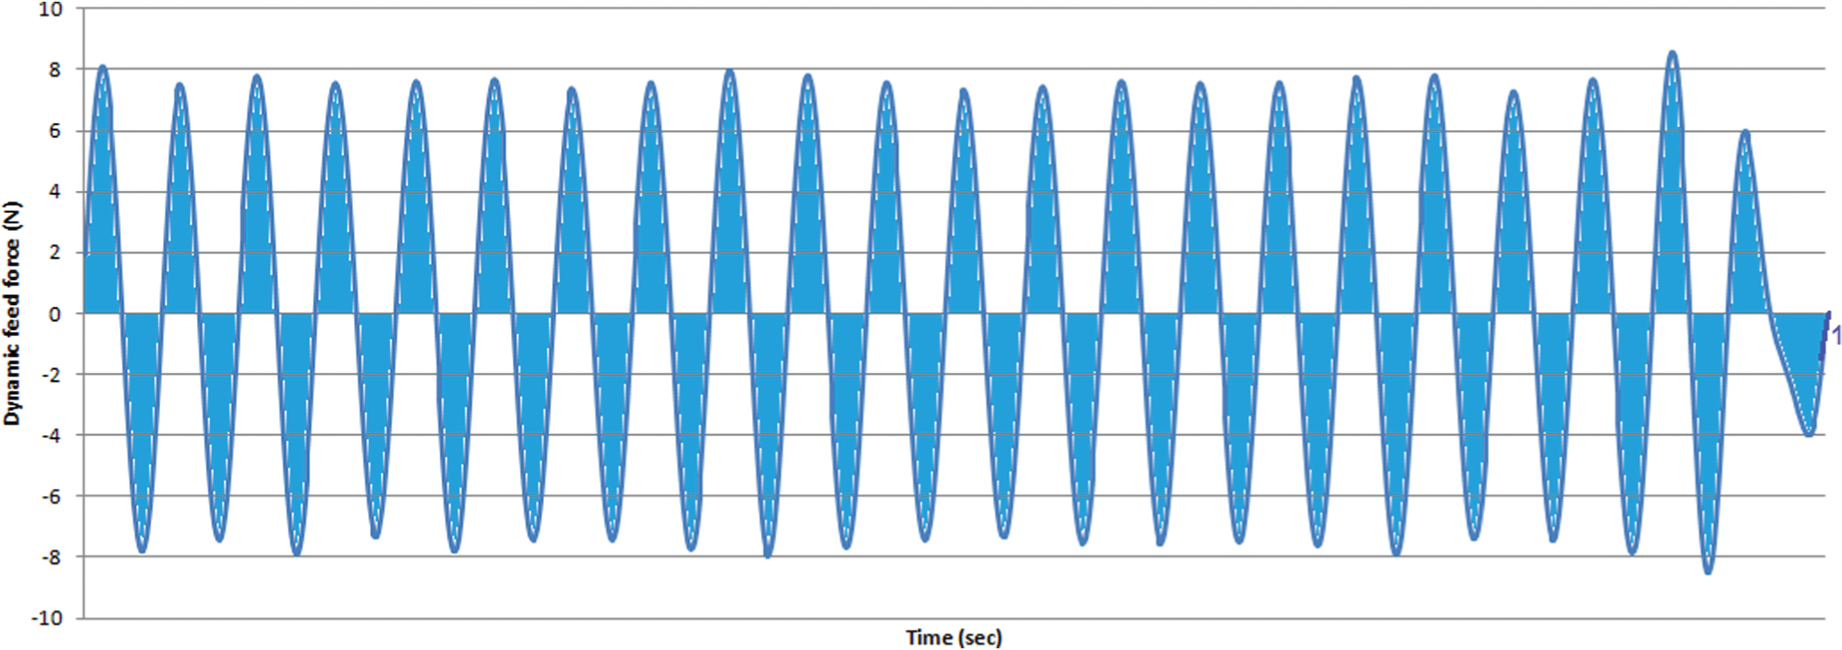
Example of calculation of the fifth level of decomposed feed force (
The relations of the arithmetic average surface roughness, the surface roughness, the ratio of decomposed cutting forces, and the cutting parameters are proposed here as
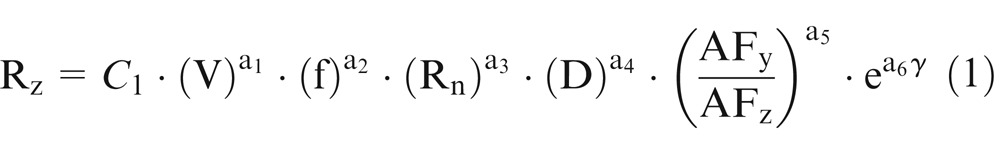
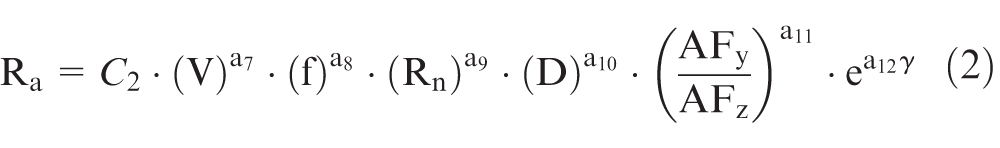
where Rz is the surface roughness in µm, Ra is the average surface roughness in µm, V is the cutting speed in m/min, f is the feed rate in mm/rev, Rn is the tool nose radius in mm, D is the depth of cut in mm,
Experimental cutting conditions and procedures
The cutting tests are conducted to obtain the regression coefficients in the equations (1) and (2) on a commercially available small CNC turning machine as shown in Figure 7. The dynamometer is employed and installed on the turret of CNC turning machine in order to measure the in-process cutting forces as shown in Figure 1.
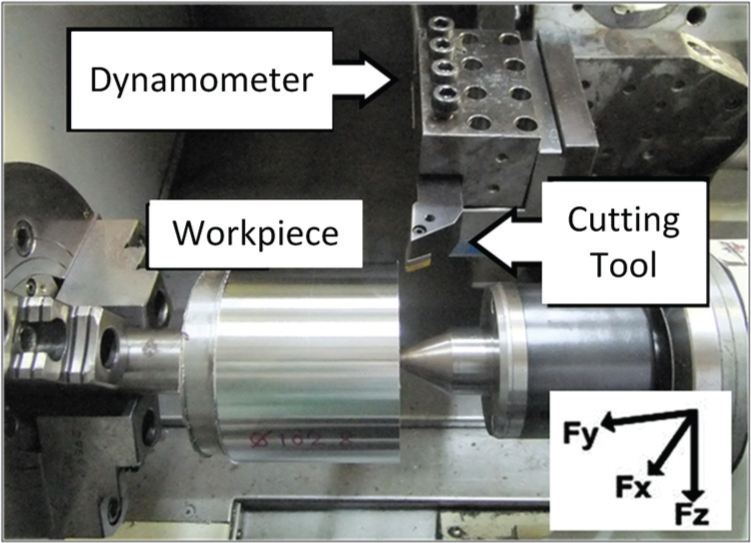
Illustration of the experimental setup.
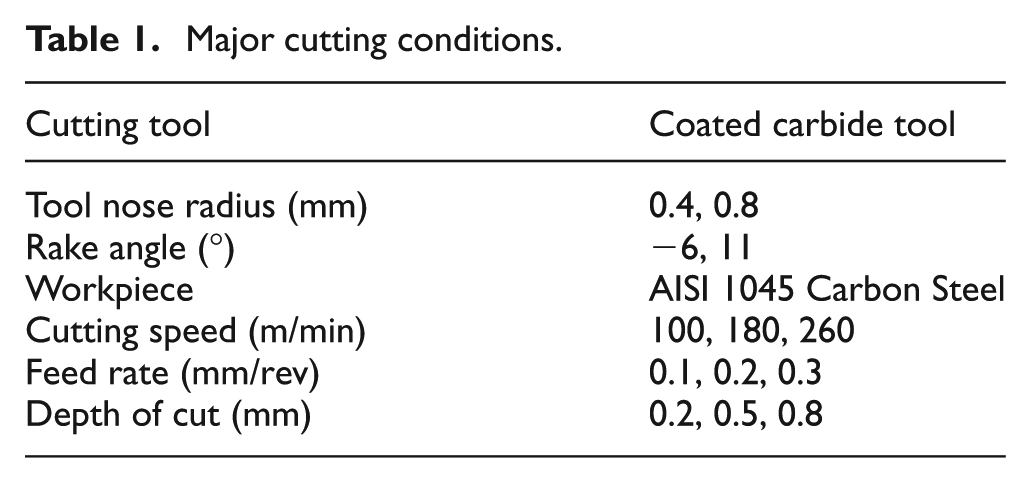
The dynamic cutting force components detected by the dynamometer are amplified and low-pass filtered with the cut-off frequency of 500 Hz prior to digitization and calculation within PC. The sampling rate is 1 kHz. It is proven that the resonant frequency of the dynamometer is about 2.7 kHz, and hence, the dynamic cutting force components are well detected by the dynamometer. The carbon steel (AISI 1045) is adopted in the cutting experiments and the cutting tool is coated carbide with the different tool nose radiuses of 0.4 and 0.8 mm. The rake angles of cutting tools are −6° and 11°. The major cutting conditions are summarized in Table 1. The limited Ra and Rz are set at 10 and 25 µm, respectively.
Major cutting conditions.
The following experimental procedures are adopted to obtain the relation of the surface roughness, the chip breaking, the decomposed cutting force, and the cutting parameters:
Start cutting with a new cutting tool at a constant cutting speed and a depth of cut and measure the dynamic cutting forces.
Decompose the dynamic cutting forces into five levels using the Meyer wavelet transform.
Monitor and separate the decomposed levels of dynamic cutting forces of the chip breaking and the surface roughness in both time and frequency domains.
Compare and check the relation between the surface roughness profile and the decomposed cutting forces in each level of the wavelet transform.
Compute the decomposed feed and main forces from the levels which corresponds to the surface roughness profile using the trapezoidal rule, and take the ratio of them
Repeat the procedures (1)–(5) for other cutting conditions.
Plot the relation of the surface roughness, the cutting conditions, and the ratios of decomposed cutting forces.
Repeat the procedures (1)–(7) with another cutting tool for other cutting speeds and depths of cut.
Calculate the in-process surface roughness models at 95% confidence level.
Repeat the new cutting tests with the new cutting conditions and measure the ratios of decomposed cutting force when the in-process surface roughness is to be predicted.
Verify the in-process surface roughness model by comparing with the experimentally measured surface roughness, and the ±10% measured surface roughness with the limited Ra and Rz.
Experimental results and discussions
Decomposed cutting forces of chip breaking and surface roughness profile
The relation between the dynamic cutting forces and the surface roughness profile is shown in Figures 8 and 9. As the chips are broken during cutting, the dynamic cutting forces vary either due to chips hitting upon the cutting tool or workpiece. The dynamic cutting forces are relatively large in amplitude when the chips are broken into pieces and the relatively large PSDs appear in the higher frequency range, which corresponds to the chip breaking frequency, typically more than 50 Hz due to the shorter chip length.18,19 The experimentally obtained dynamic cutting forces are correspondent with the experimentally obtained surface roughness profile as shown in Figures 8 and 9. The FFT is utilized to check the frequency of the dynamic cutting forces and the surface roughness profile, which are the same frequency of 24 Hz as shown in Figure 9.
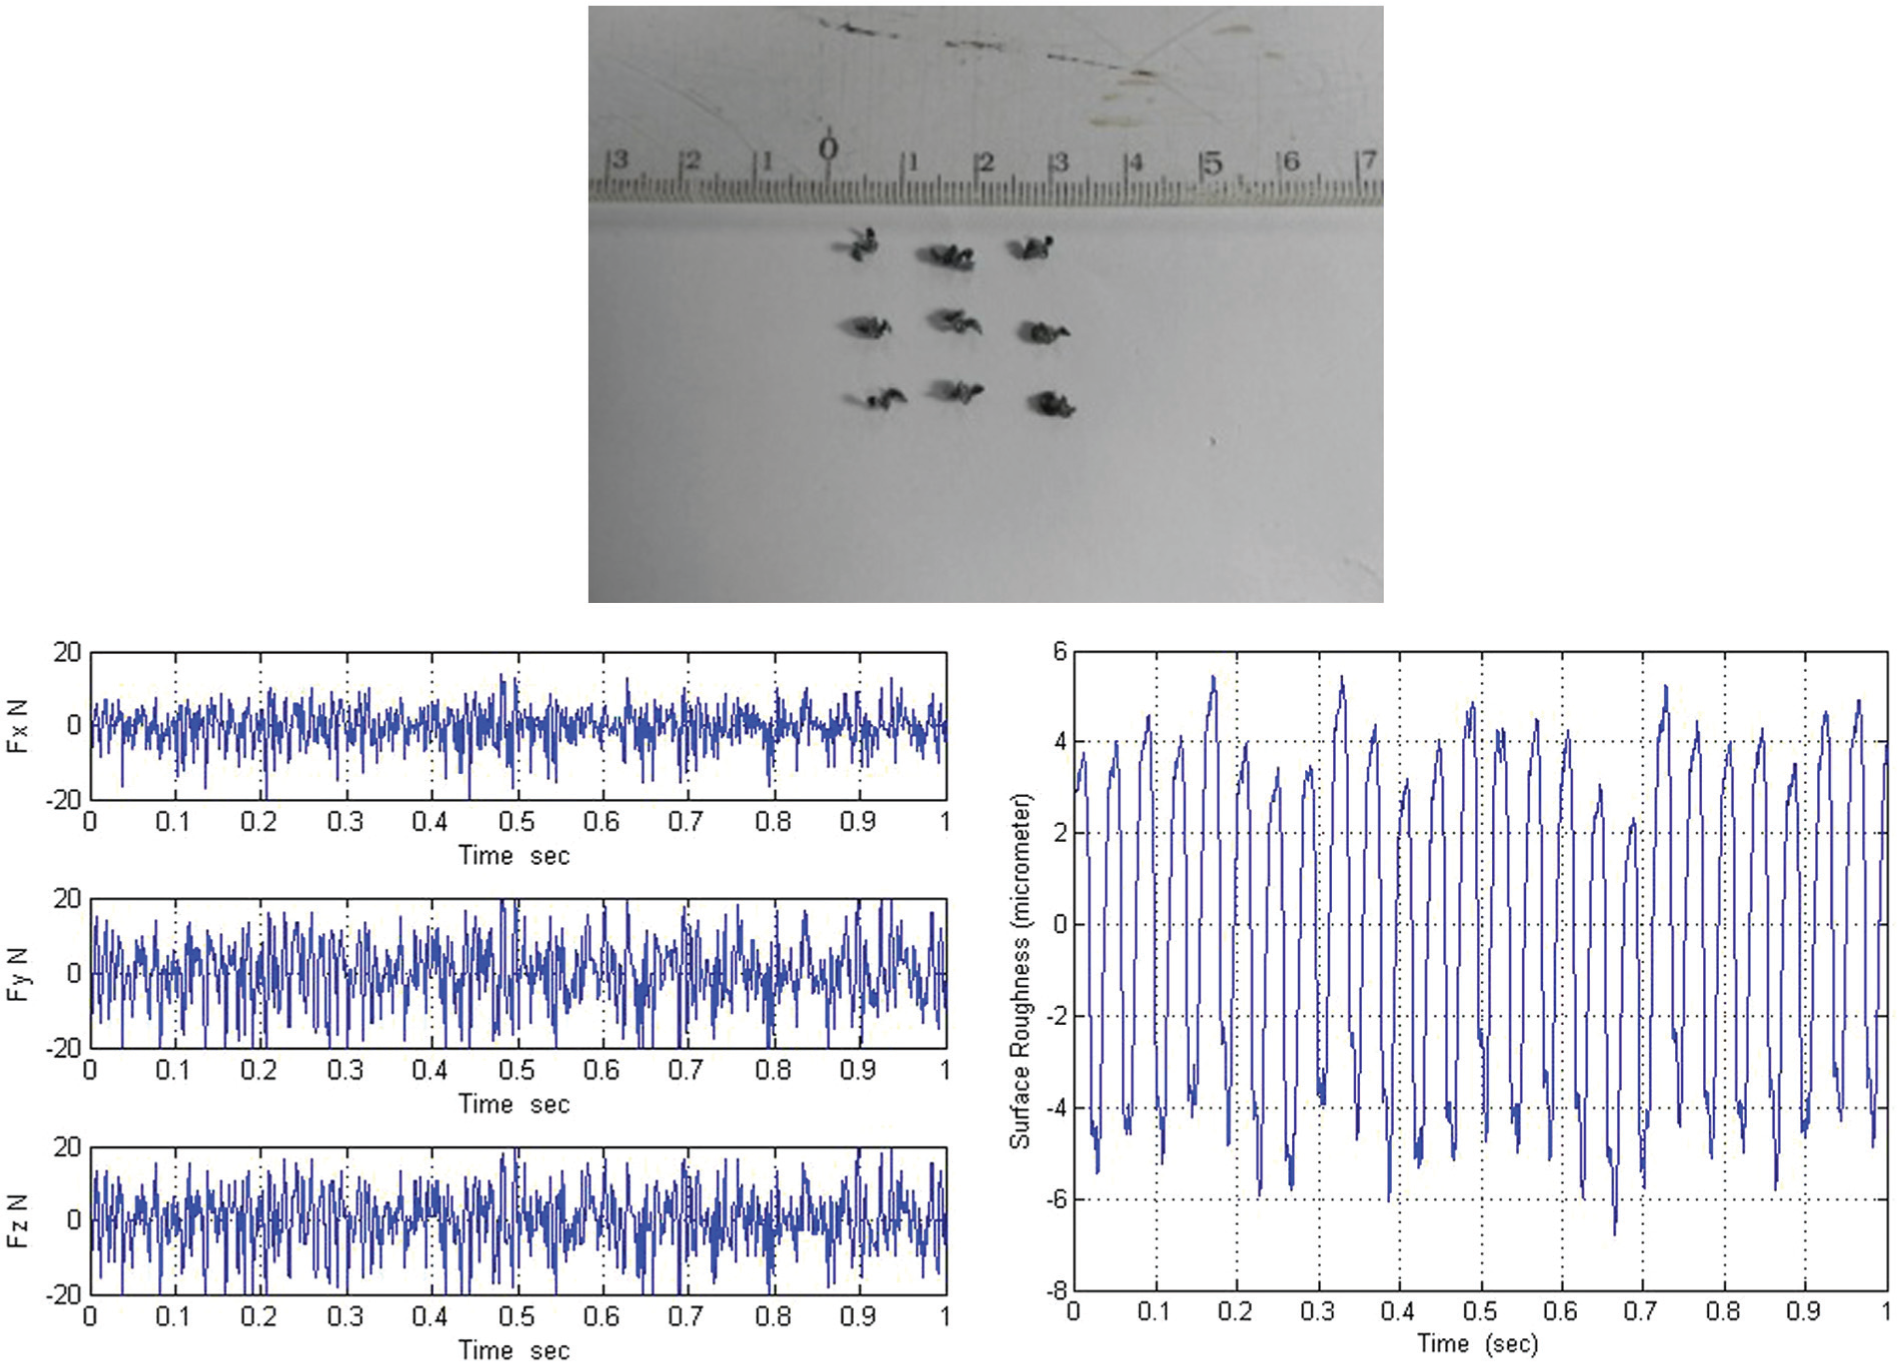
Example of the dynamic cutting forces of broken chip and the surface roughness profile in the time domain with the cutting speed of 180 m/min, the feed rate at 0.2 mm/rev, the depth of cut of 0.8 mm, the tool nose radius of 0.4 mm, and the rake angle of −6°.
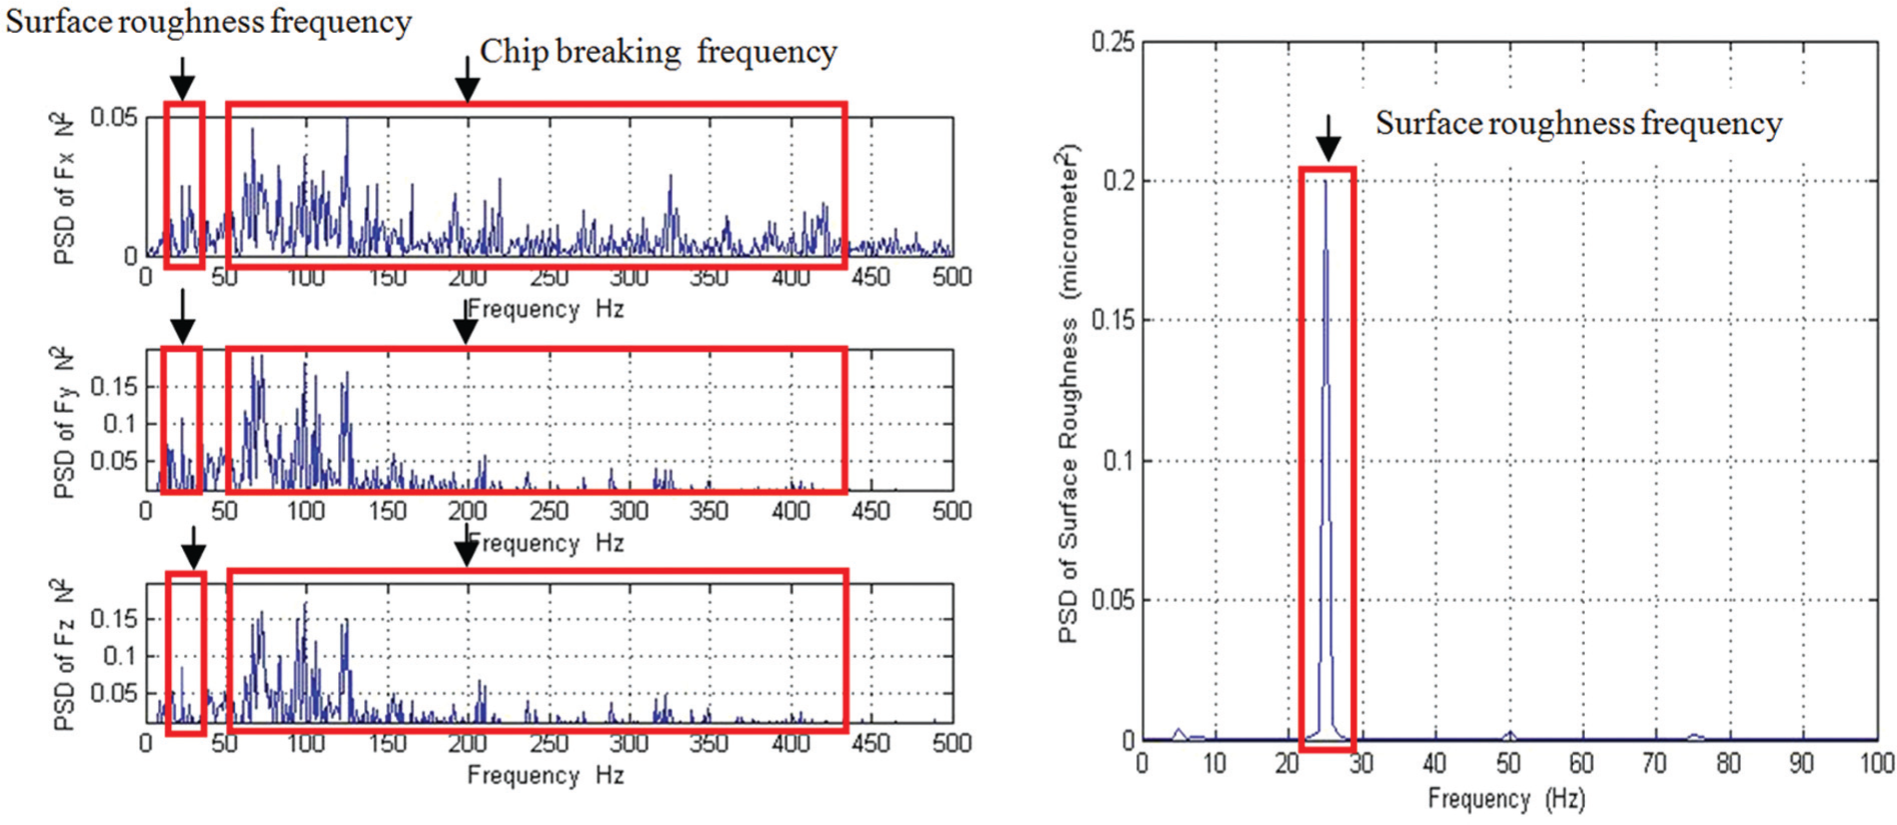
Example of the PSD of dynamic cutting forces of broken chip and the PSD of surface roughness profile in the frequency domain with the cutting speed of 180 m/min, the feed rate at 0.2 mm/rev, the depth of cut of 0.8 mm, the tool nose radius of 0.4 mm, and the rake angle of −6°.
However, the profile of surface roughness is difficult to be separated from the dynamic cutting forces while the broken chips happen due to the chip breaking frequency and its amplitude. If the chip breaking and noise signals are classified and separated out from the dynamic cutting forces into different levels of the wavelet transform, the surface roughness profile will be obtained. Therefore, the in-process surface roughness will be effectively predicted. It is necessary to classify and decompose the broken chip signals out from the surface roughness signal in both time and frequency domains before calculating the surface roughness models.
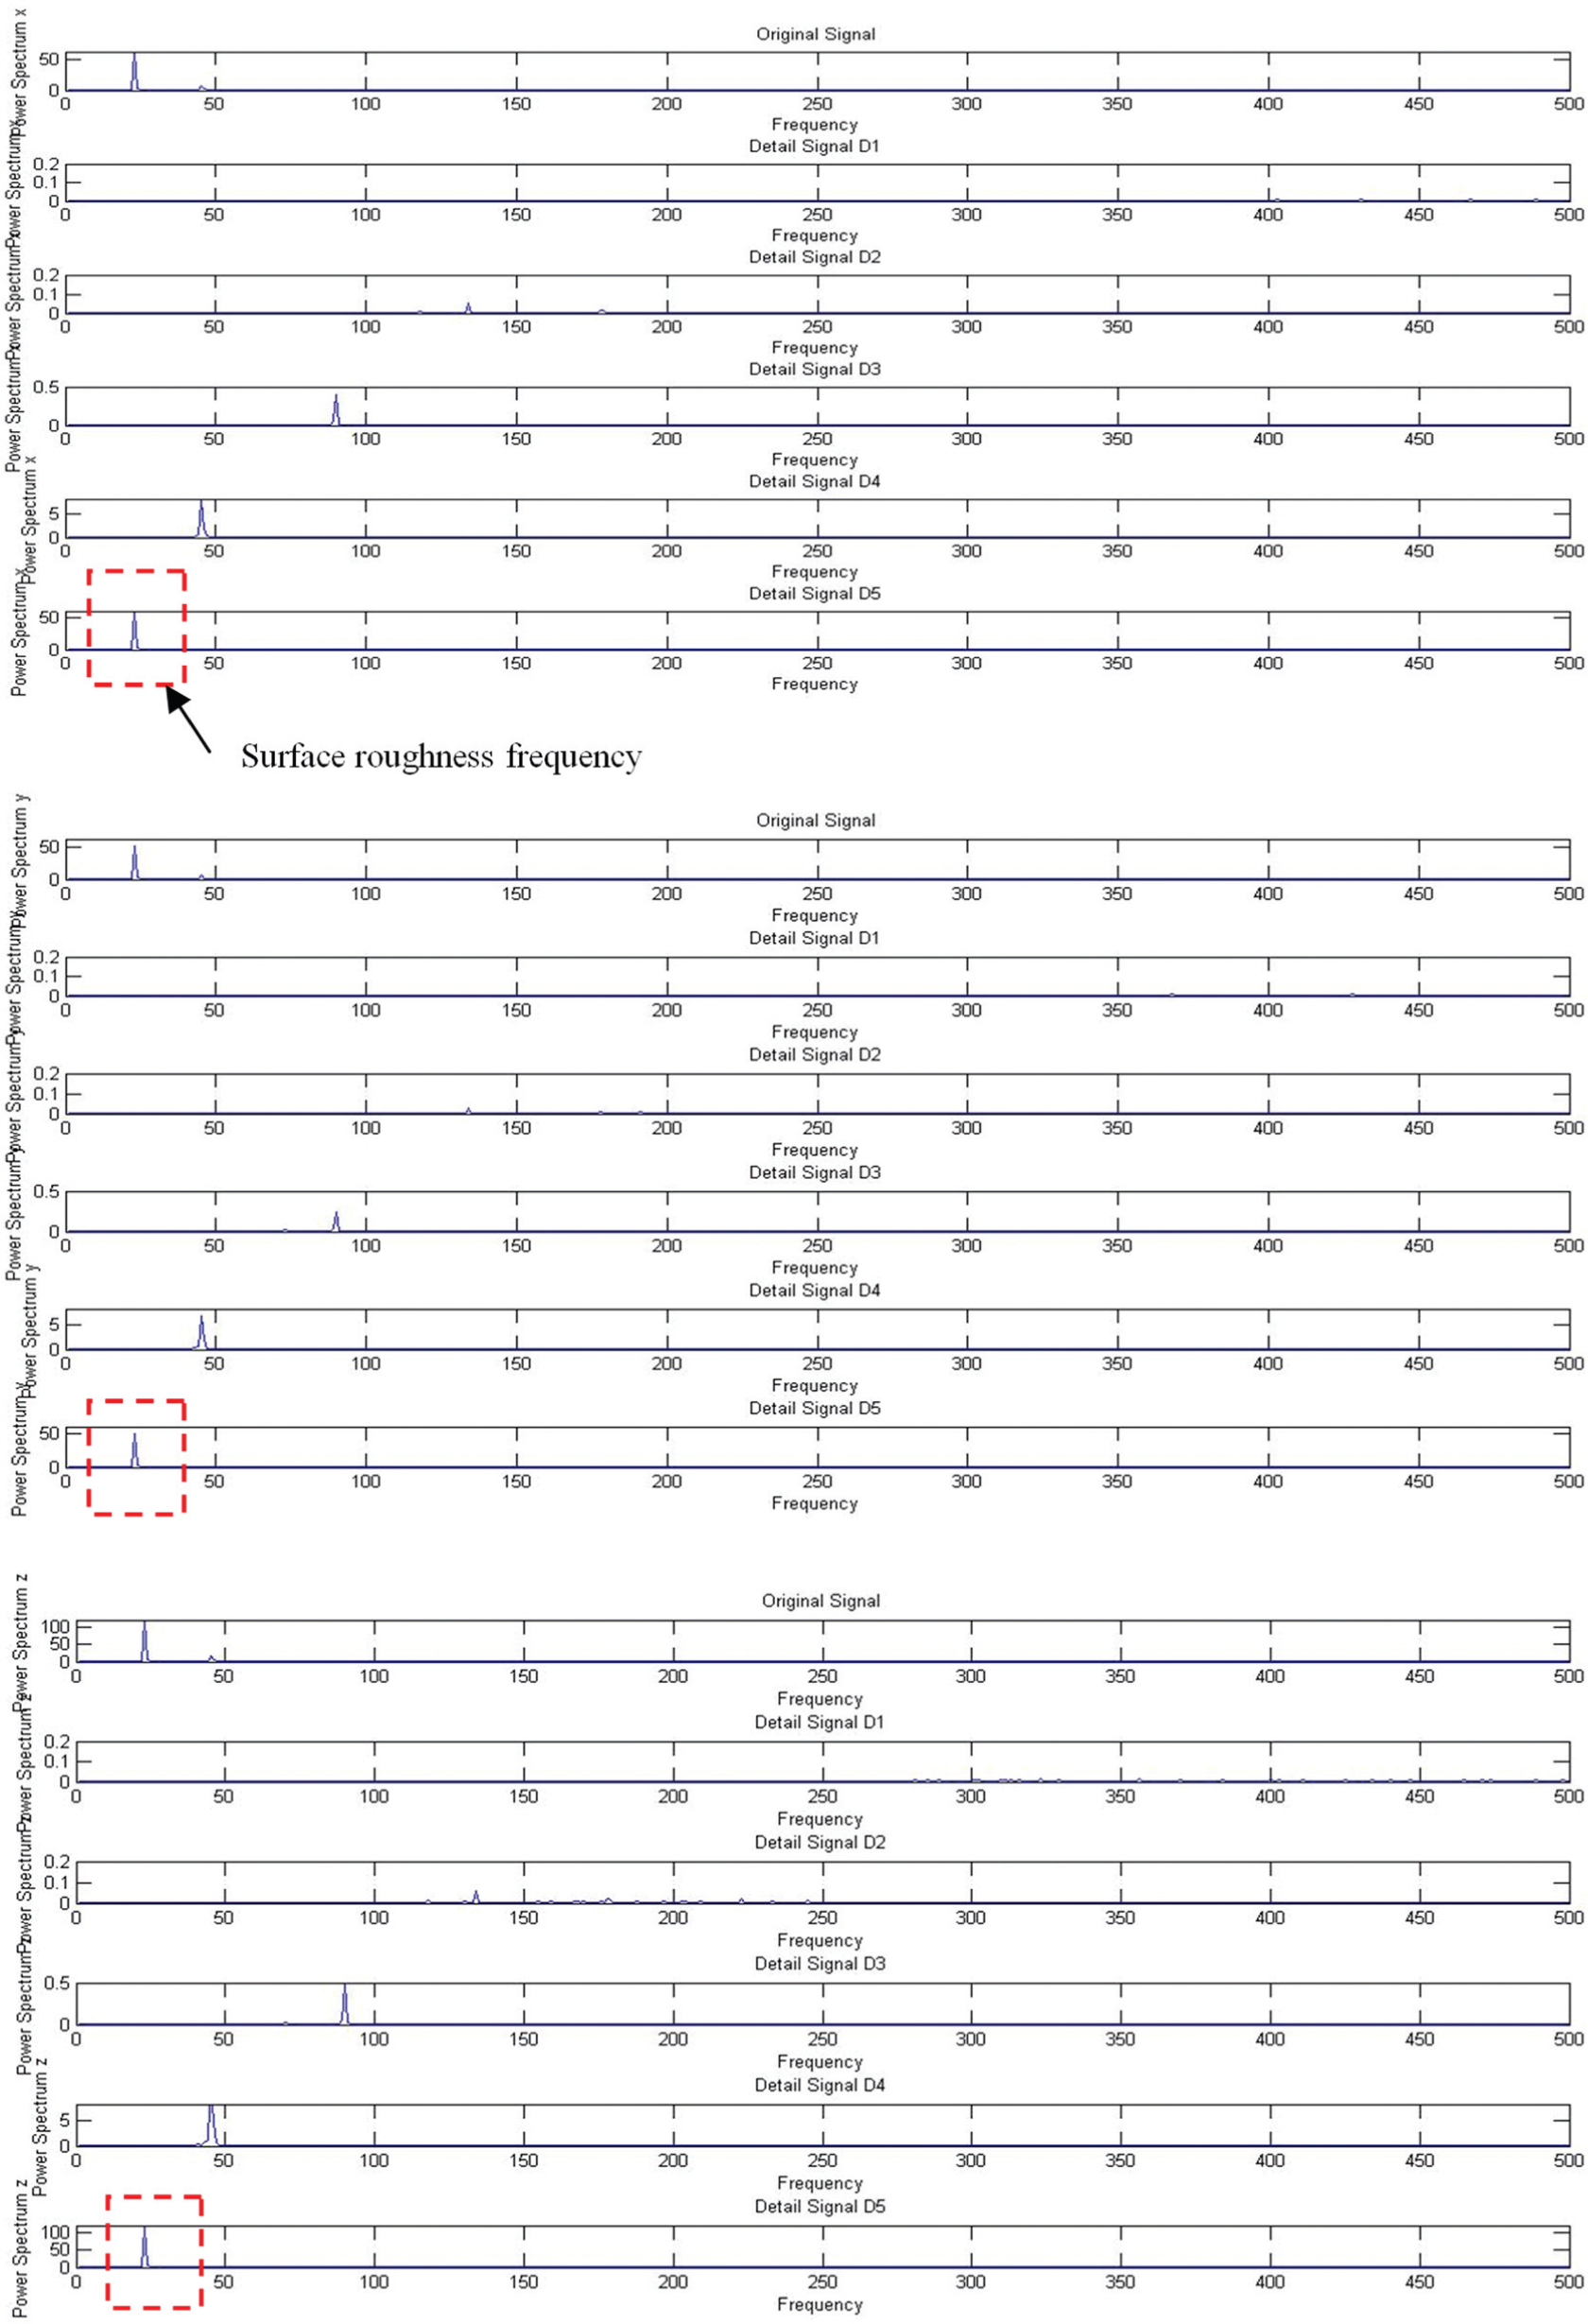
Figures 10 and 11 illustrate the decomposed cutting forces in both time and frequency domains, respectively, when the broken chip appears. The experimentally obtained results showed that the Meyer wavelet transform is a time-frequency analysis tool which can perform a good resolution in both time and frequency domains to monitor the broken chip and surface roughness signals in the CNC turning process. It is noticed that the broken chip and noise signals are separated from the surface roughness signal. Since the chip breaking frequency is higher than the surface roughness frequency. The broken chip signal appears at the low level of the wavelet transform while the surface roughness signal happens at the higher level, which is the fifth level. Hence, the decomposed cutting forces from the fifth level will be calculated to predict the in-process surface roughness, regardless of the chip formation. The proposed surface roughness models are developed from the ratio of decomposed cutting force, although the broken chips occur utilizing the Meyer wavelet transform as shown in Figures 10 and 11. The surface roughness can be predicted by monitoring the fifth level of decomposed cutting forces. The ratio of decomposed cutting forces is calculated utilizing the trapezoidal rule.
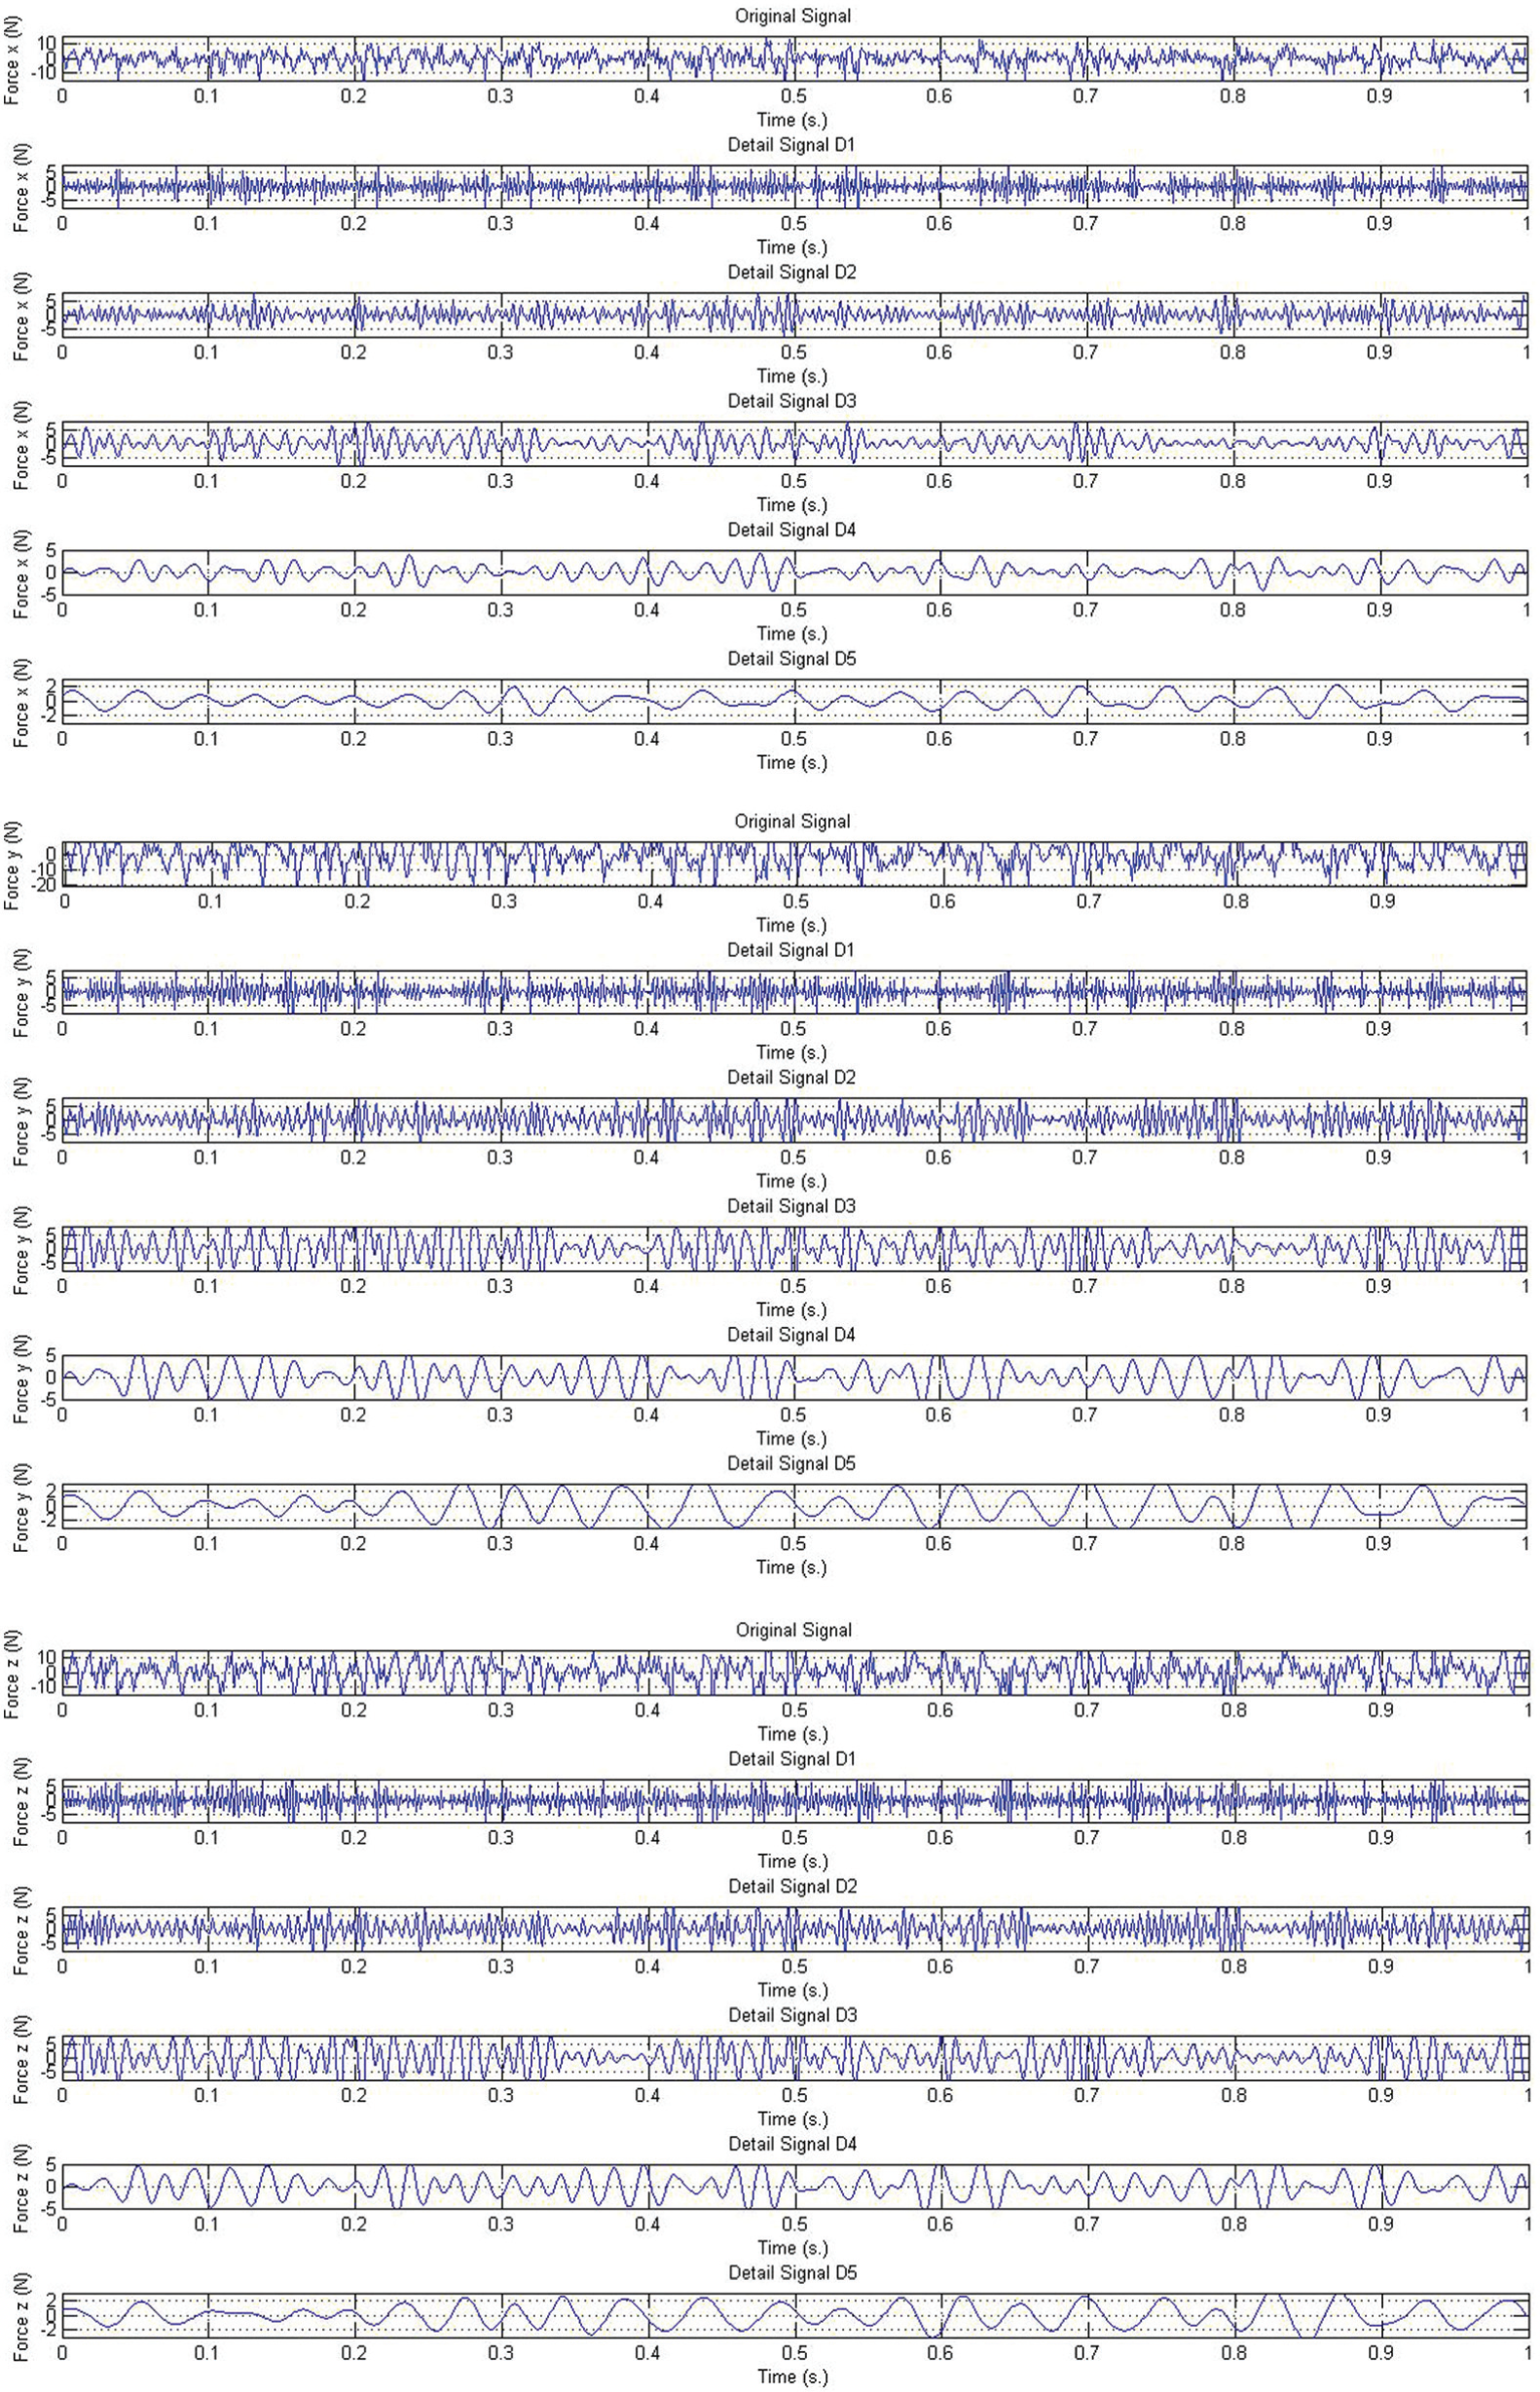
Example of the decomposed cutting forces of broken chip in the time domain of the wavelet transform with the cutting speed of 180 m/min, the feed rate at 0.2 mm/rev, the depth of cut of 0.8 mm, the tool nose radius of 0.4 mm, and the rake angle of −6°.
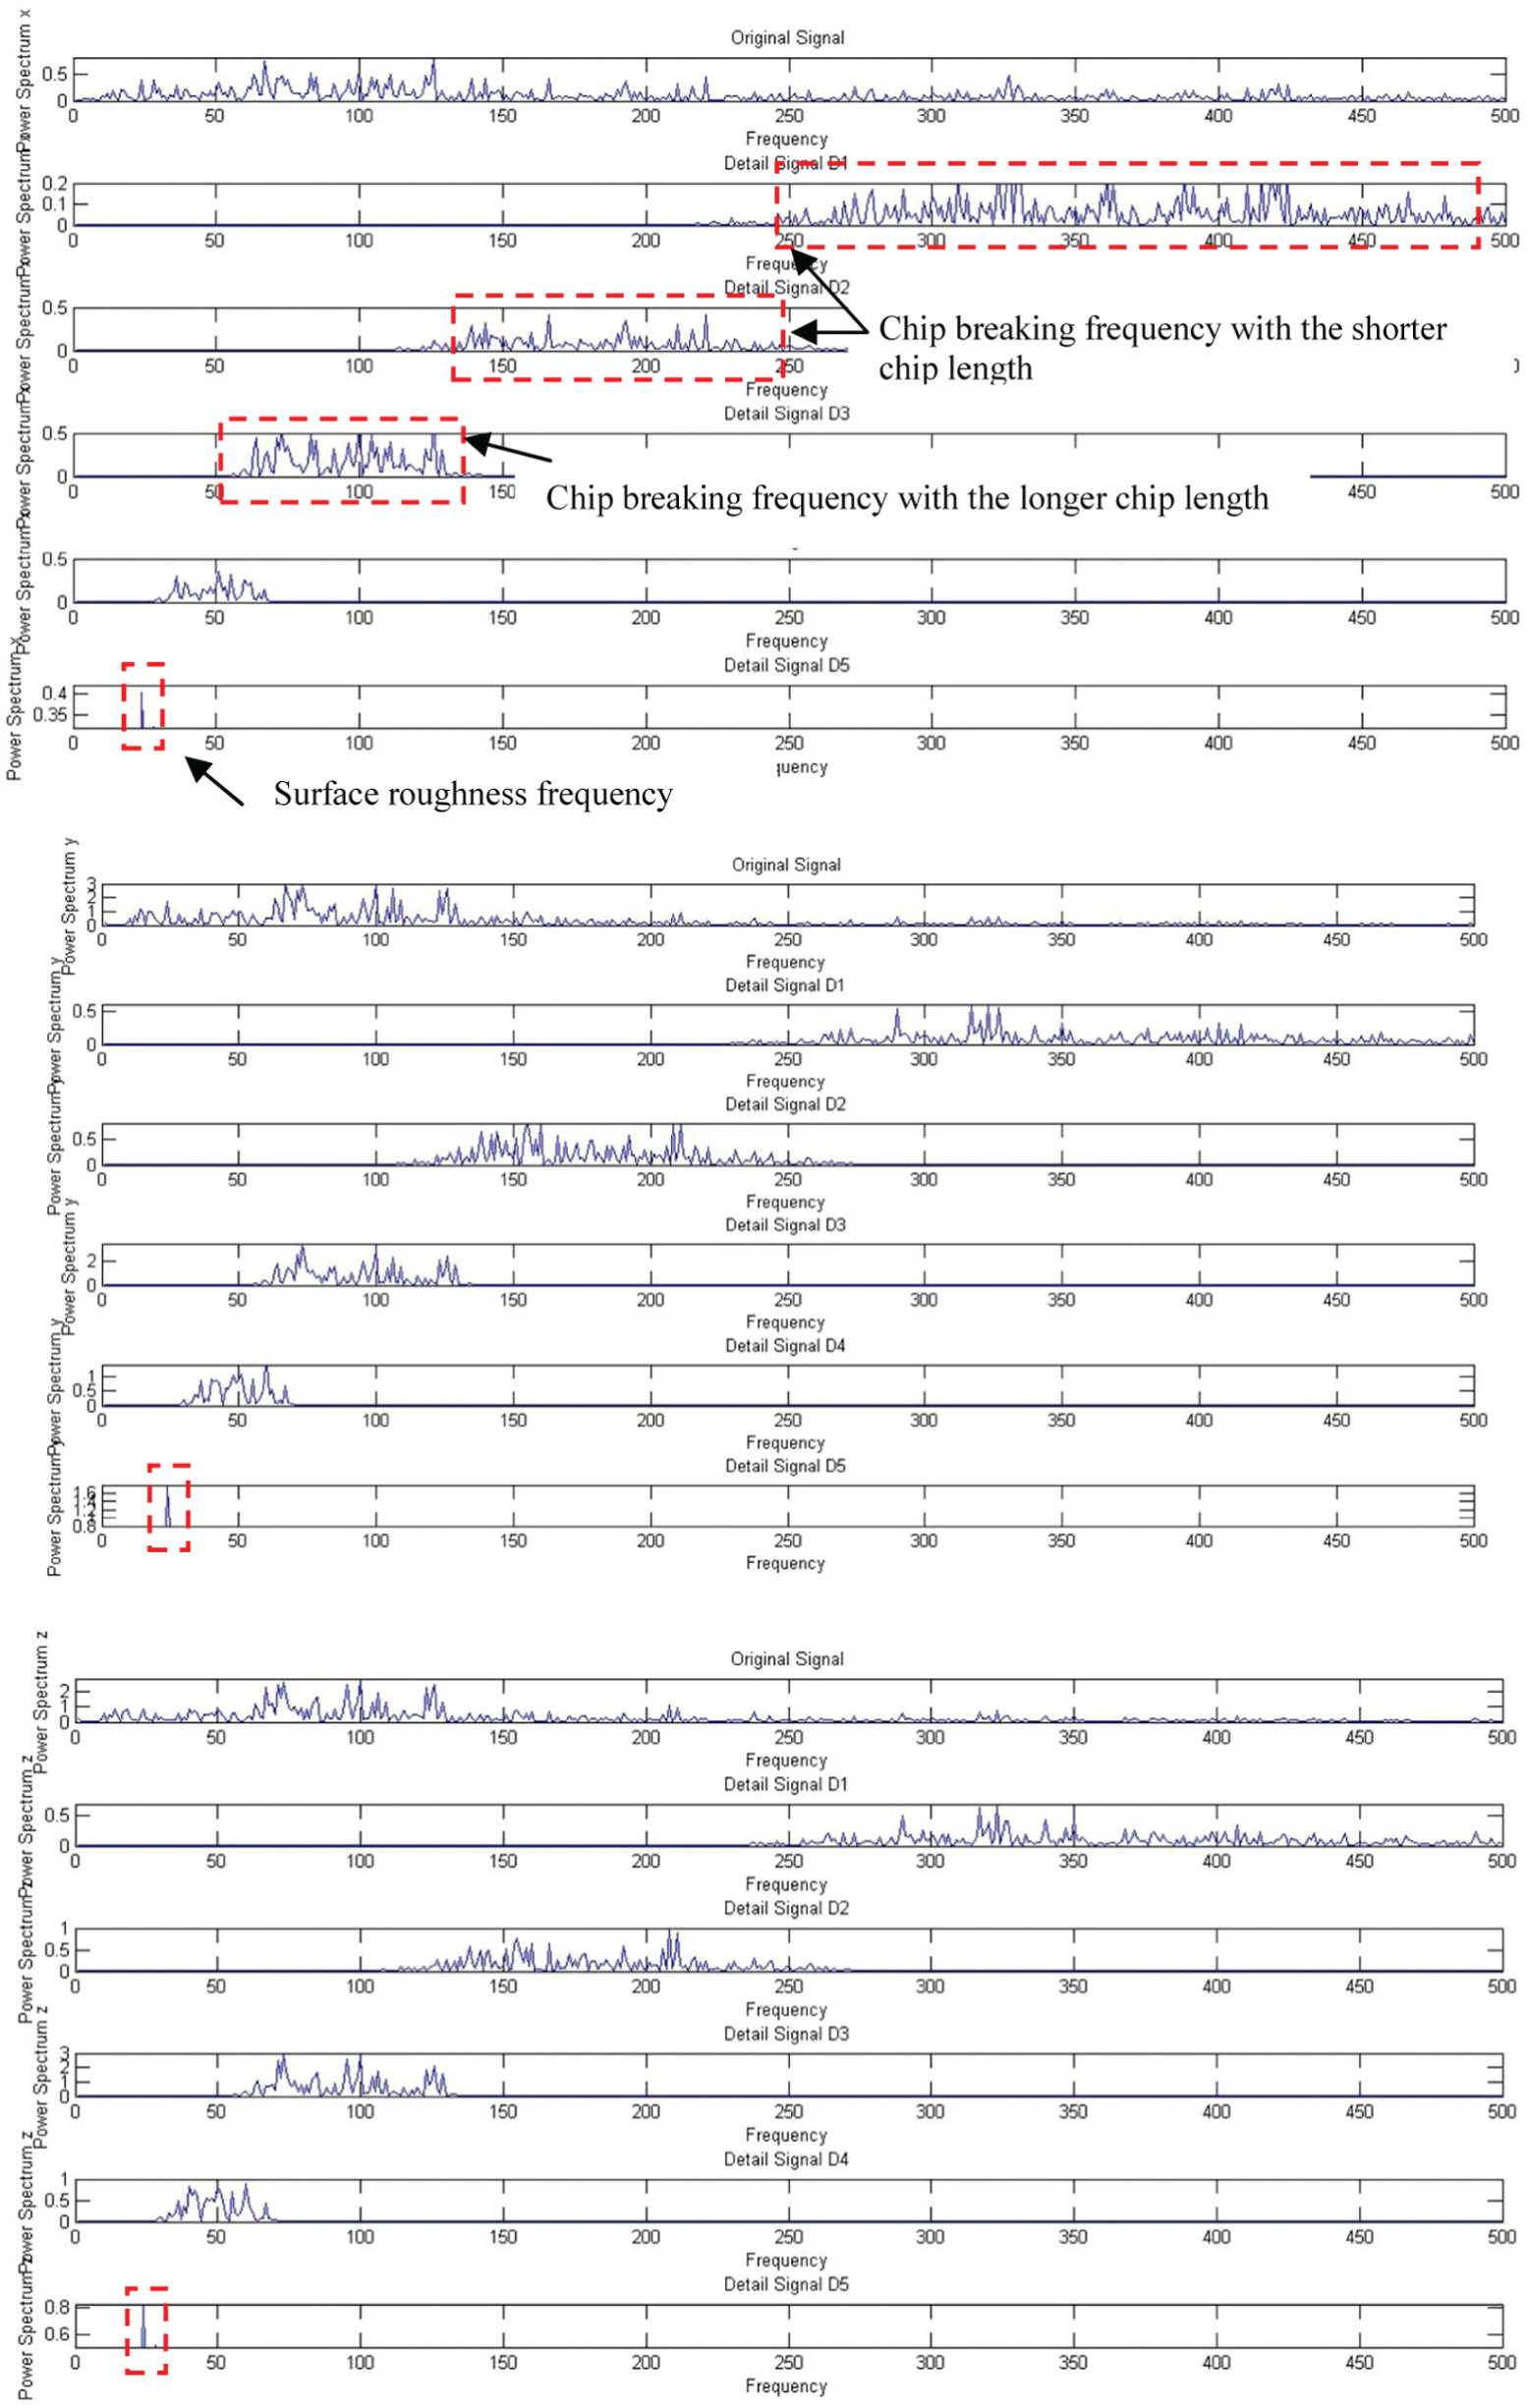
Example of the PSD of decomposed cutting forces of broken chip in the frequency domain of the wavelet transform with the cutting speed of 180 m/min, the feed rate at 0.2 mm/rev, the depth of cut of 0.8 mm, the tool nose radius of 0.4 mm, and the rake angle of −6°.
Effects of cutting conditions and ratio of cutting forces on surface roughness
The effect of the cutting speed is shown in Figure 12. It is understood that the surface roughness decreases while the cutting speed increases. The higher cutting speed causes the high cutting temperature, and hence, the work material is softer and easy to cut. Consequently, the obtained surface roughness becomes lower.
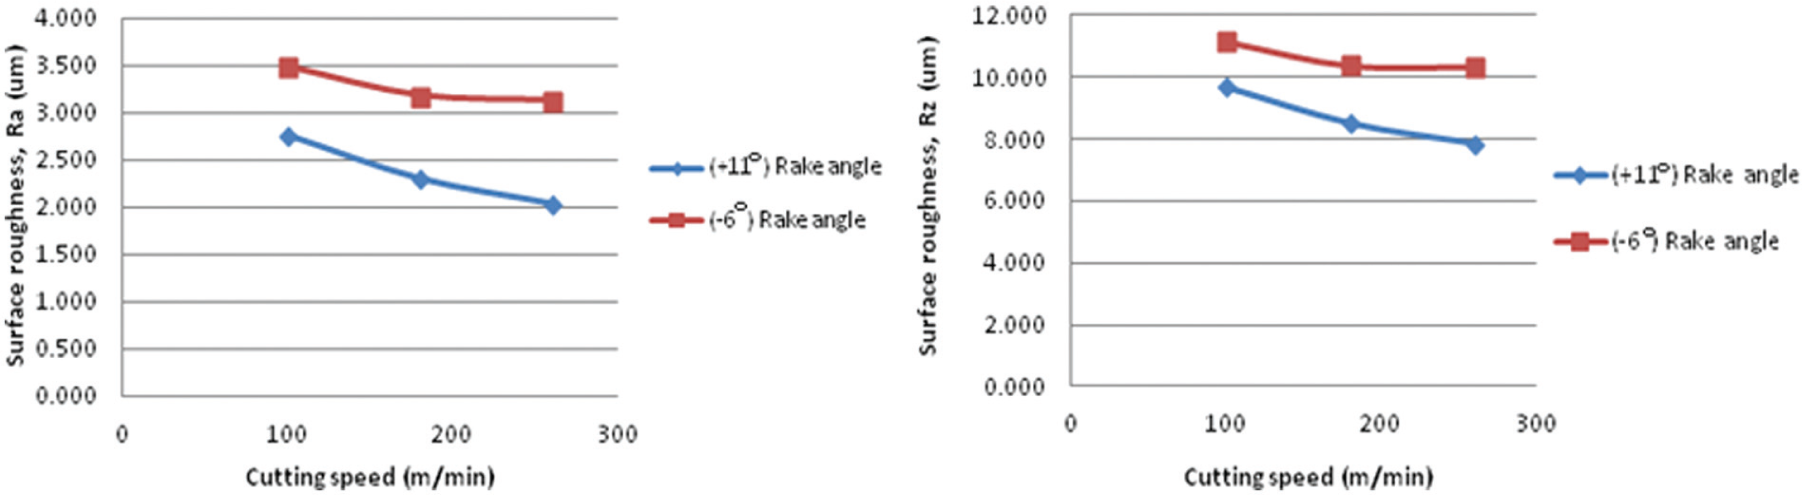
Example of experimentally obtained relation between surface roughness and cutting speed at the feed rate of 0.2 mm/rev, the depth of cut of 0.2 mm, and the tool nose radius of 0.4 mm.
The cutting forces tend to decrease while the cutting speed is higher due to the softening of work material. At the same time, the better surface roughness is obtained as the cutting force decreases. The surface roughness also improves while cutting with the positive rake angle due to the better heat and chip flowability which leads to the lower rate of tool wear and the lower cutting force as shown in Figure 12.
An increase in feed rate results in poor surface finish which corresponds to the theoretical surface roughness as shown in Figure 13. It is well known that the larger feed rate gives the higher cutting force due to the larger cutting area which causes the vibration as a result of the higher surface roughness as shown in Figure 14.
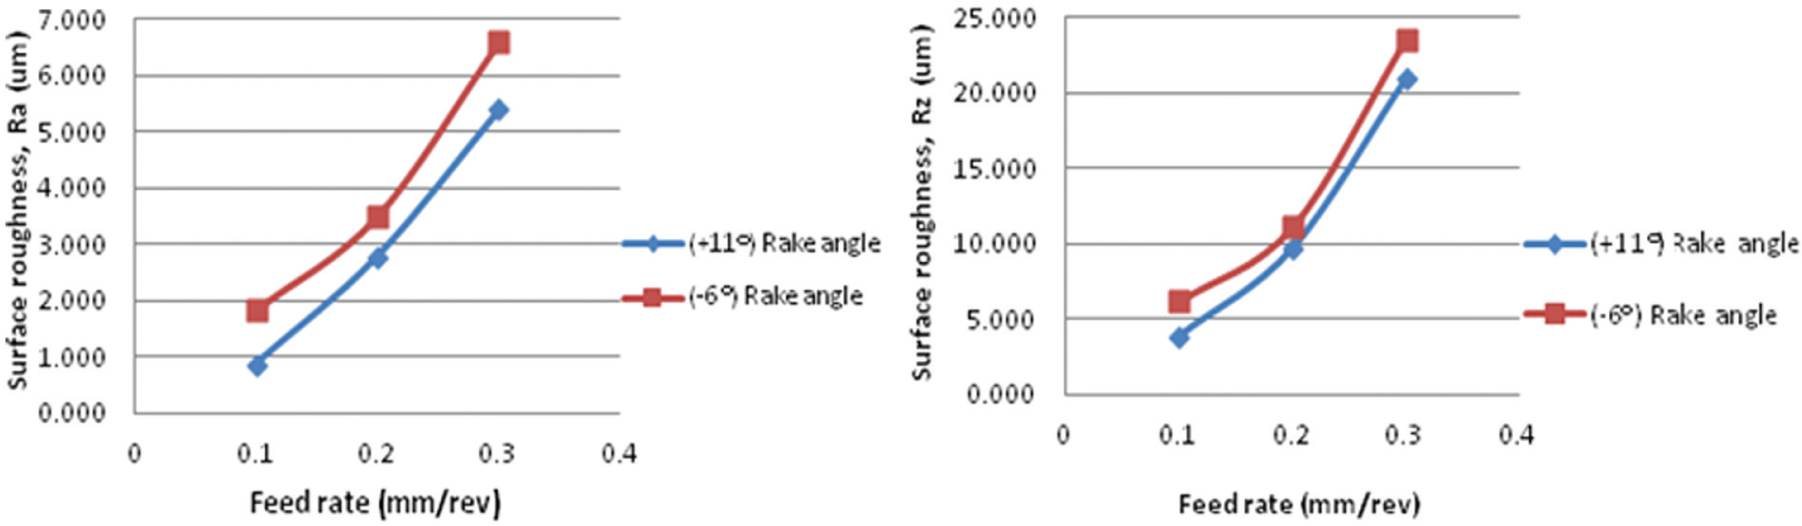
Example of experimentally obtained relation between surface roughness and feed rate at the cutting speed of 100 m/min, the depth of cut of 0.2 mm, and the tool nose radius of 0.4 mm.
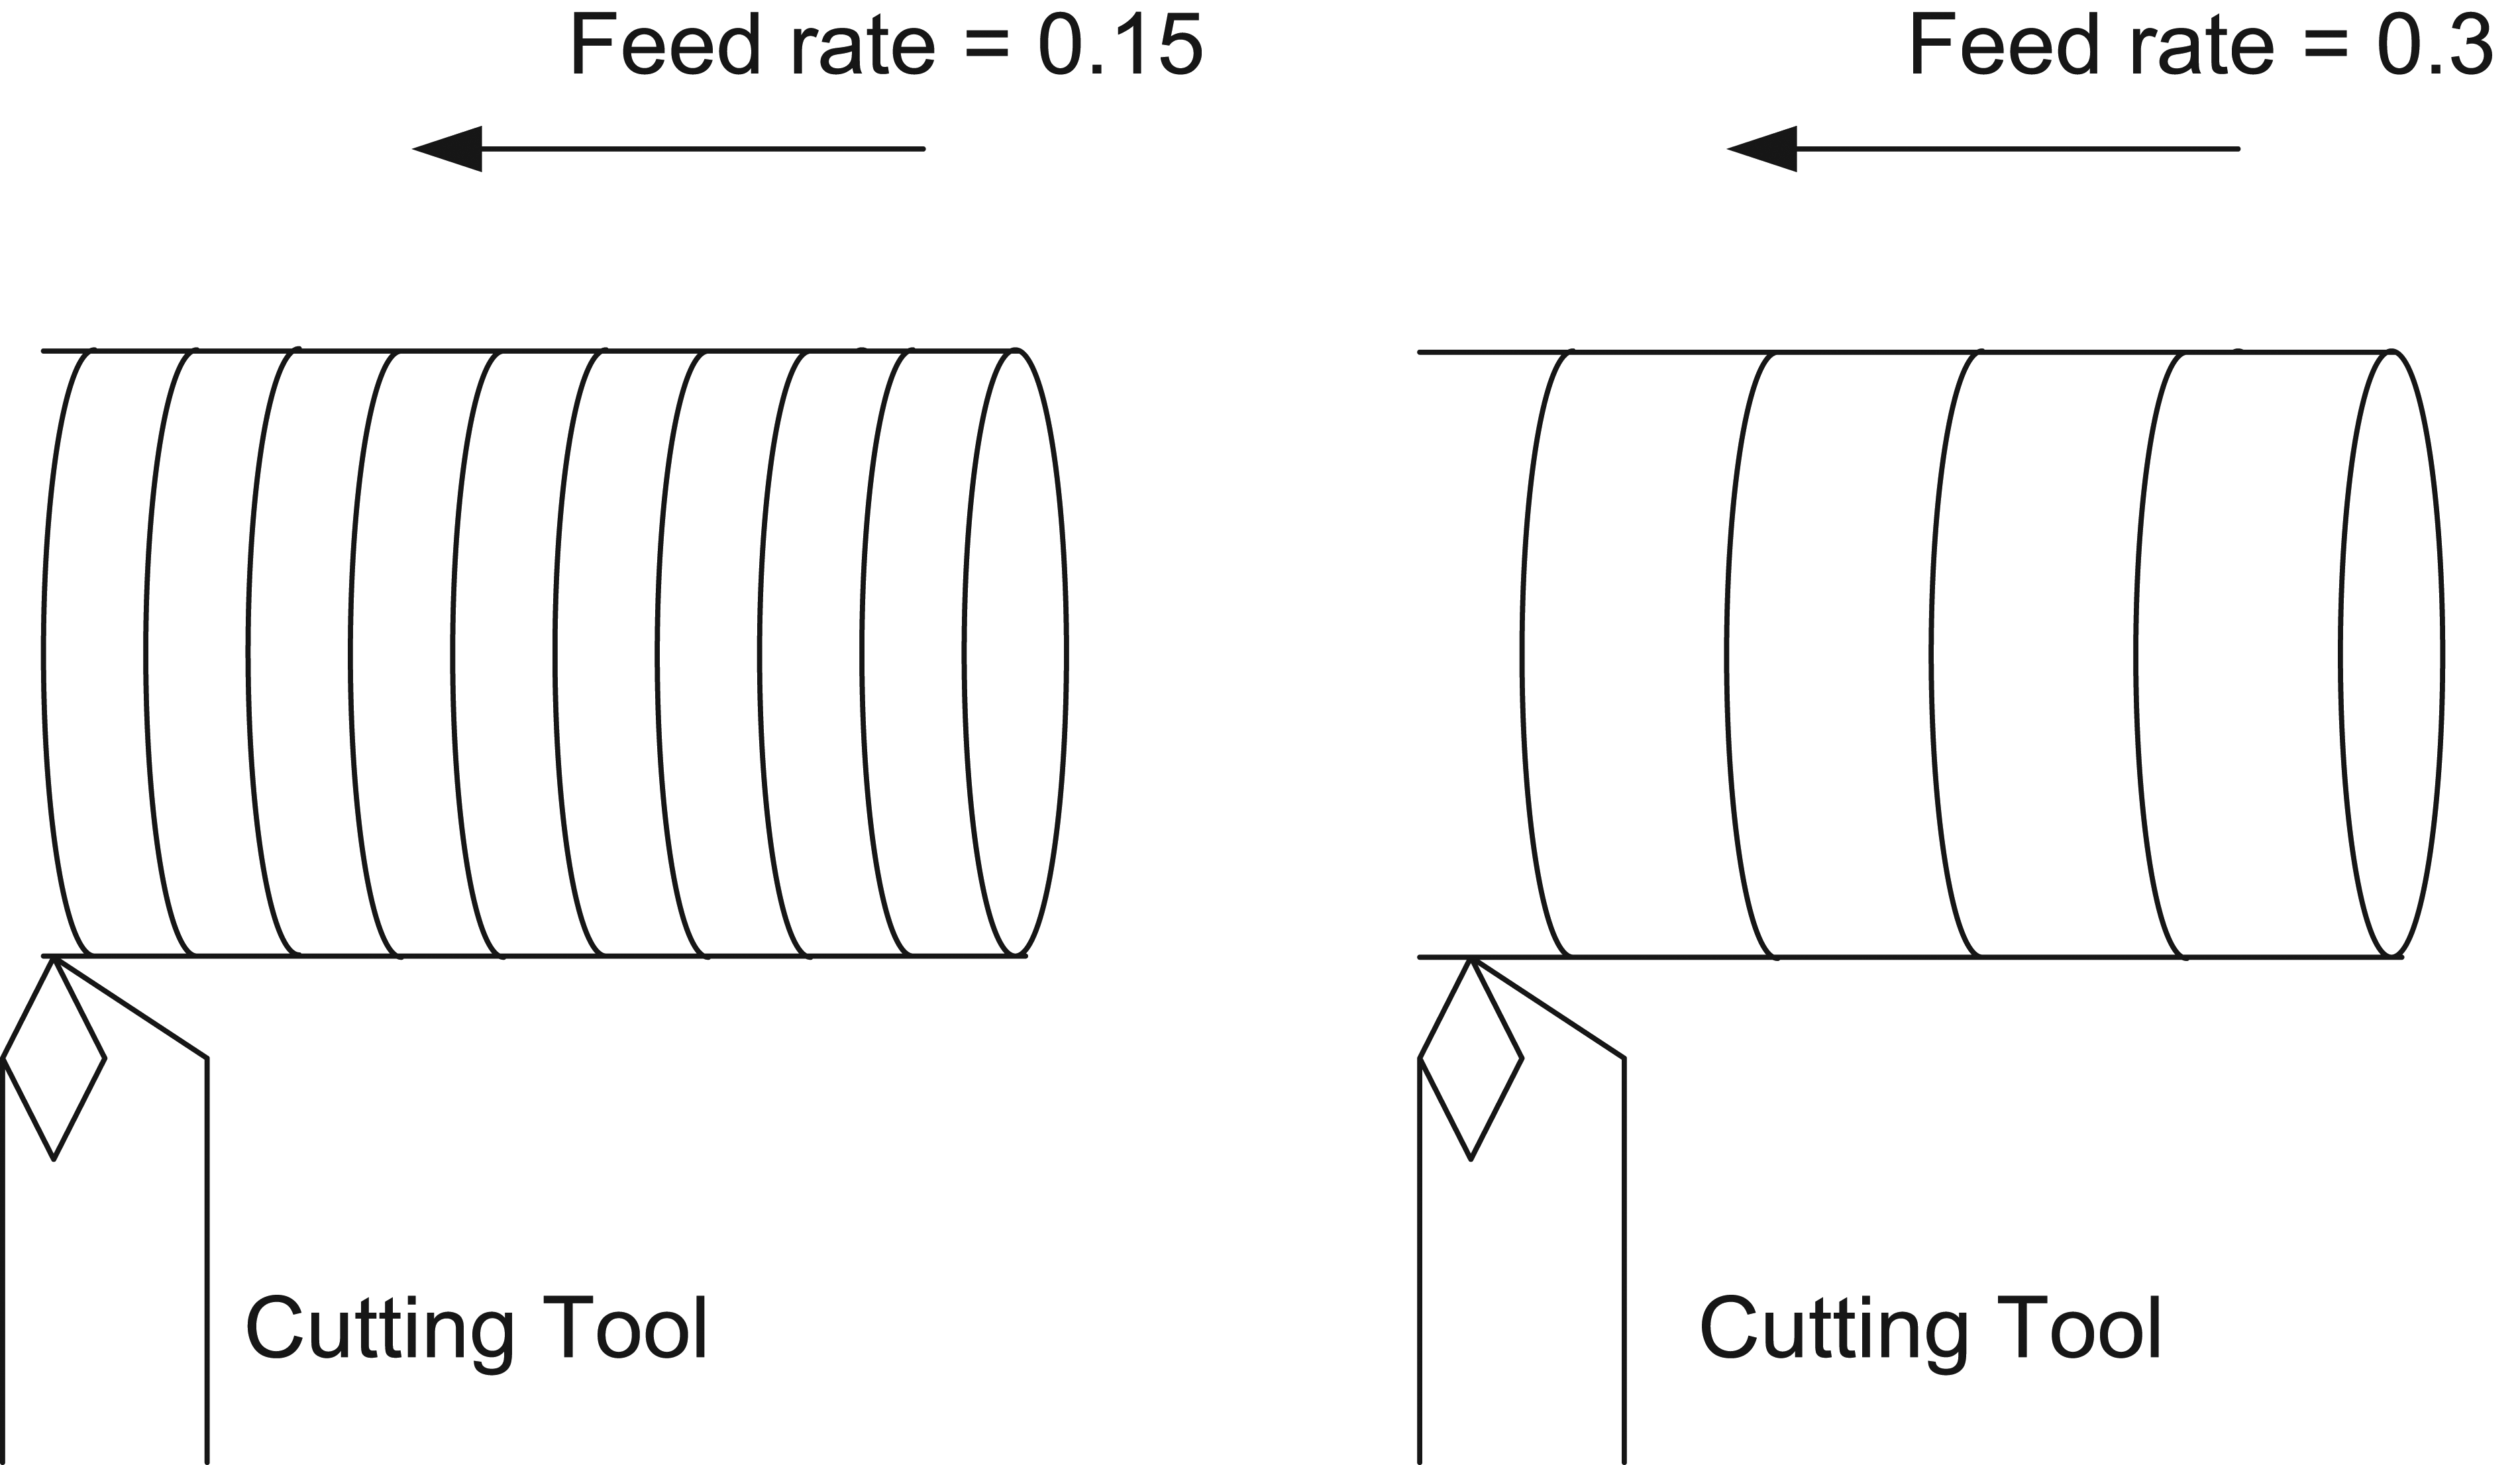
Illustration of relation between surface roughness and feed rate.
The better surface finish is obtained at a small depth of cut as shown in Figure 15. Since the larger depth of cut causes the higher cutting force due to the larger cutting area as shown in Figure 16. It is implied that the surface roughness can be improved by cutting with a small depth of cut.
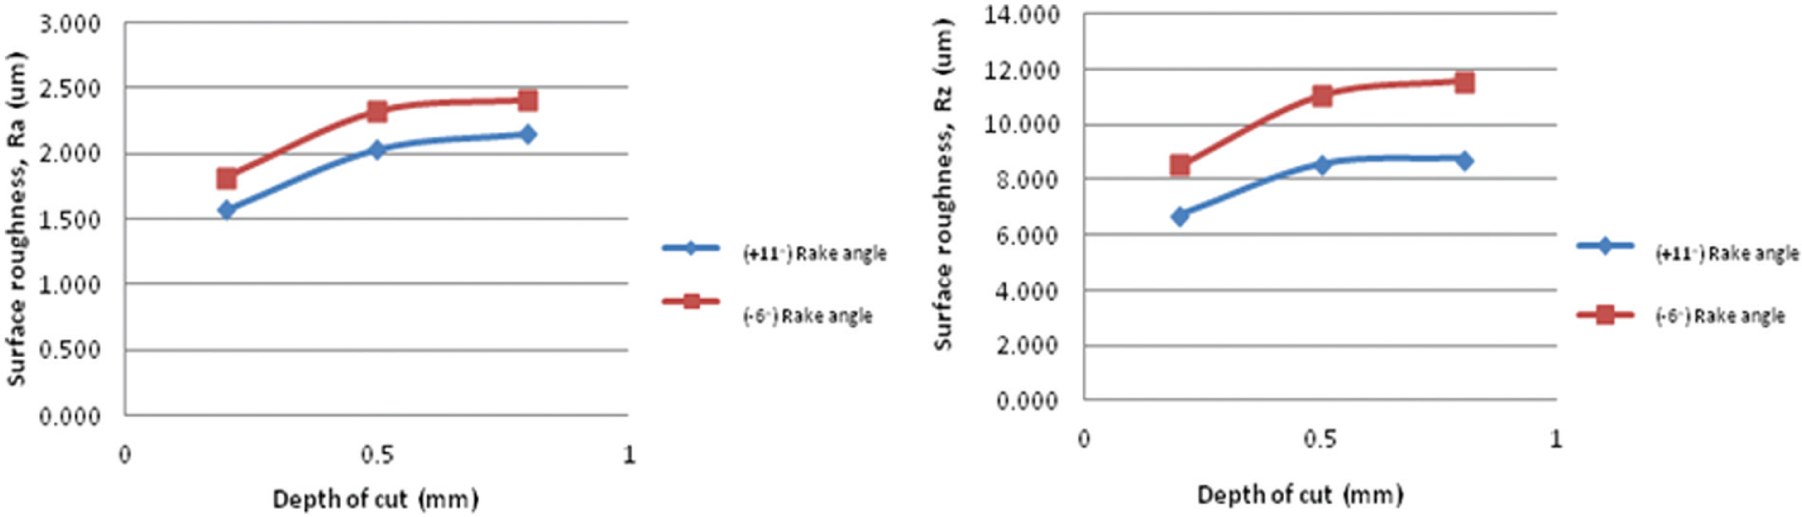
Example of experimentally obtained relation between surface roughness and depth of cut at the cutting speed of 100 m/min, the feed rate of 0.2 mm/rev, and the tool nose radius of 0.8 mm.
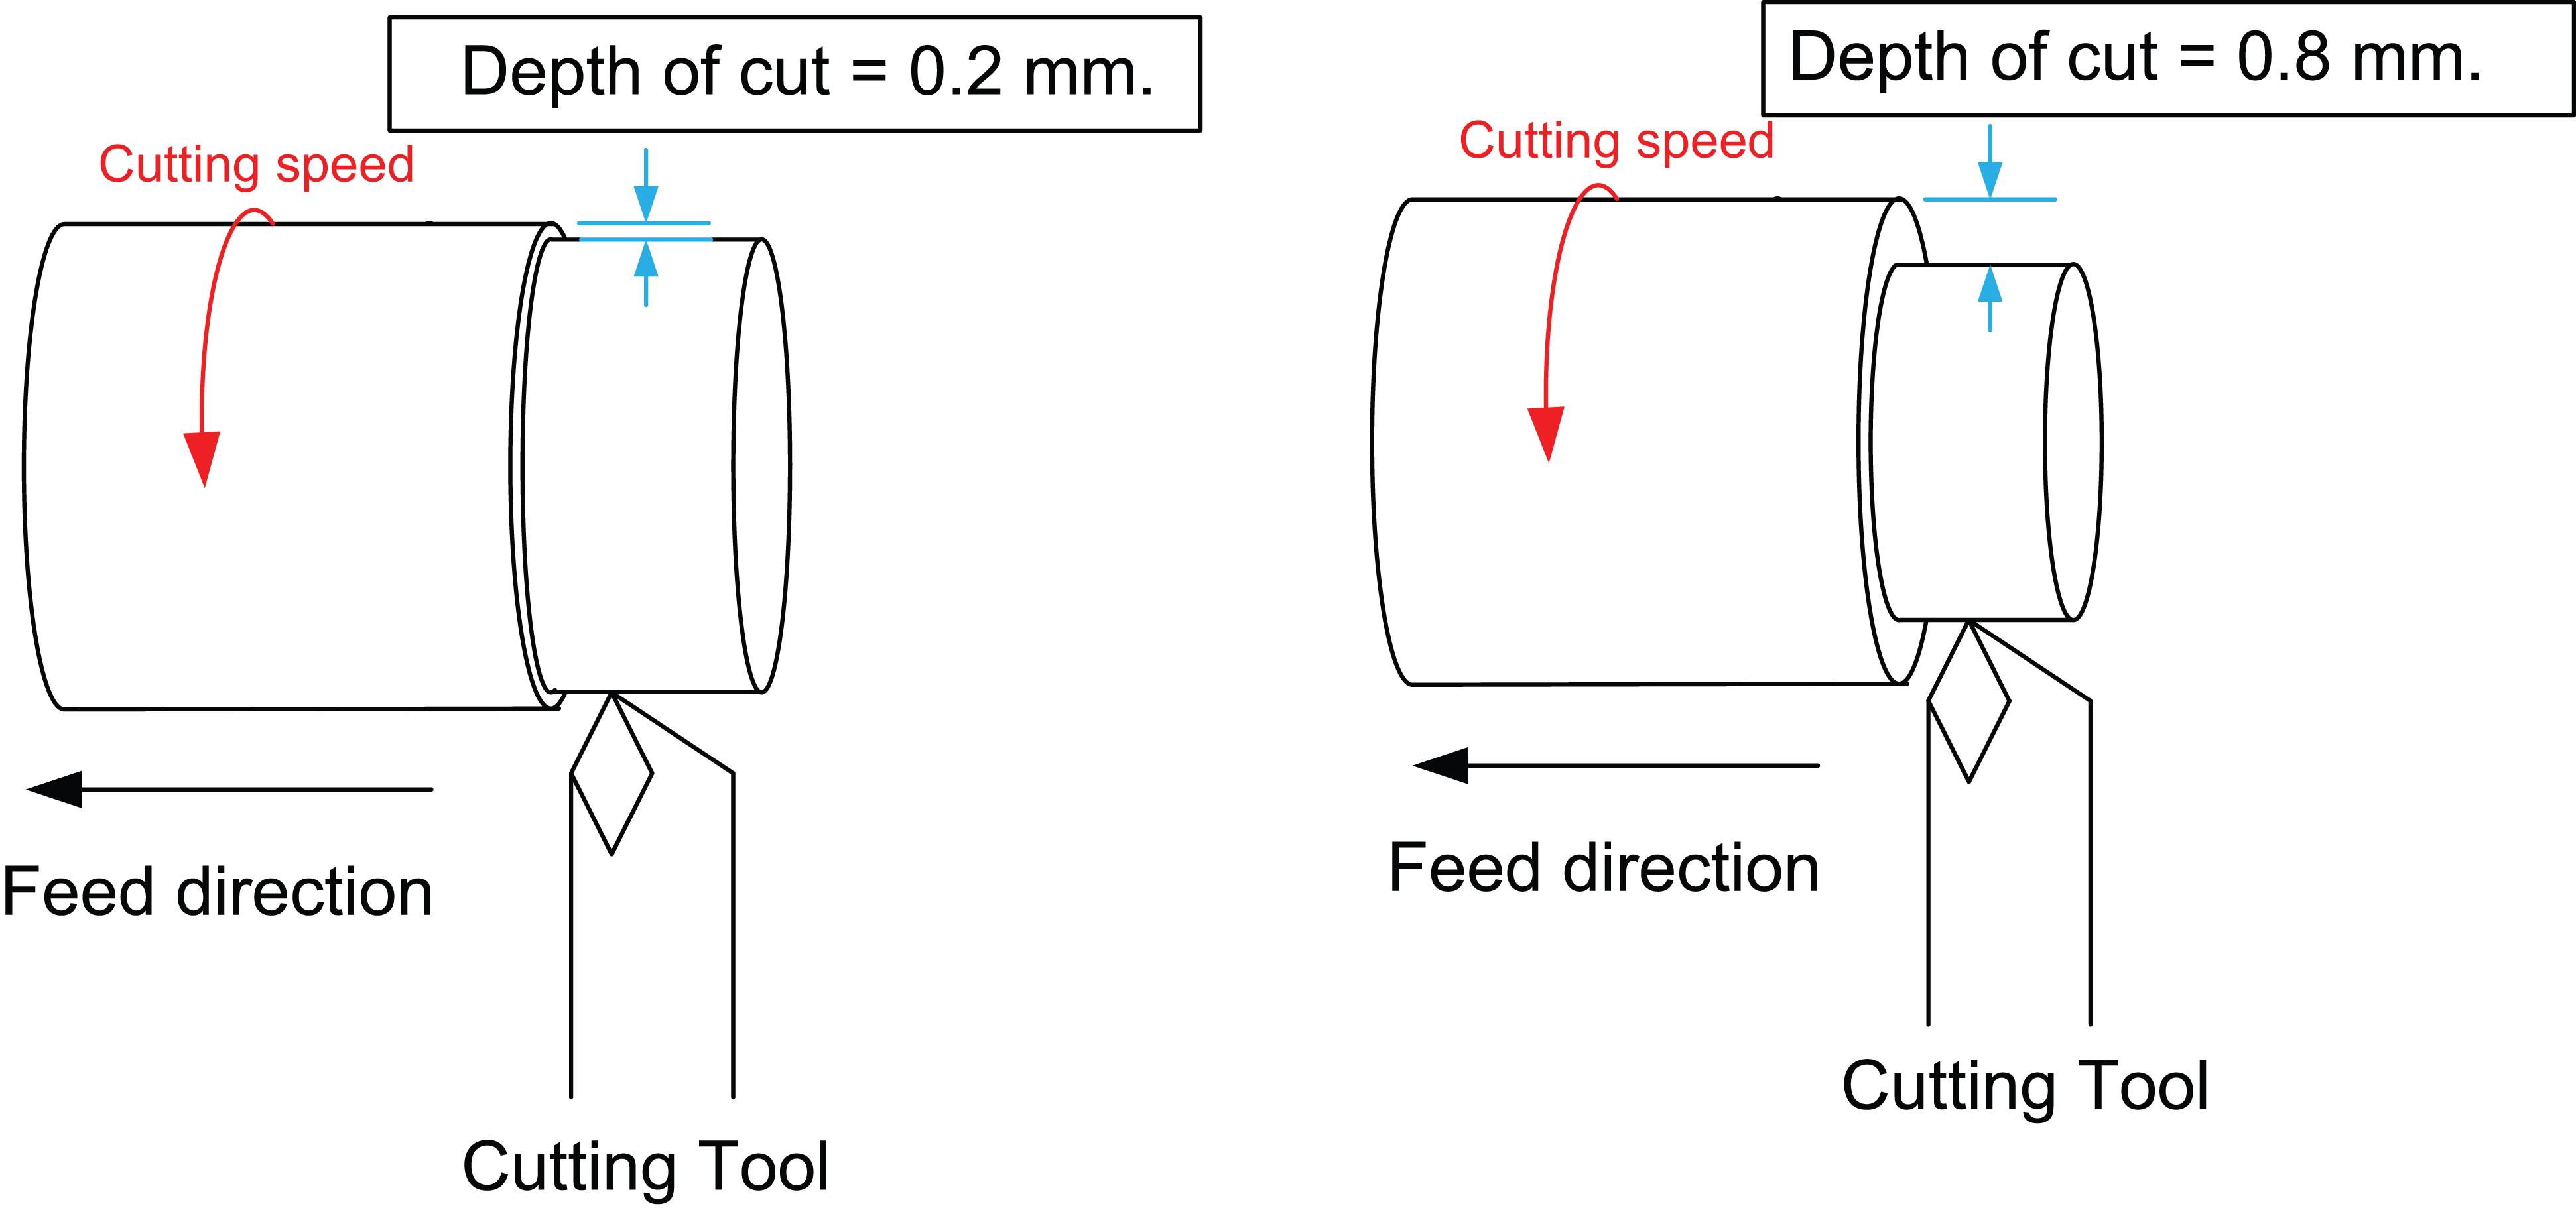
Illustration of relation between surface roughness and depth of cut.
Figure 17 shows that the experimentally obtained surface roughness decreases as the tool nose radius increases which corresponds to the theoretical surface roughness. The tool nose radius helps to reduce the feed marks on the machining surface, and consequently, the surface roughness decreases as shown in Figure 18.
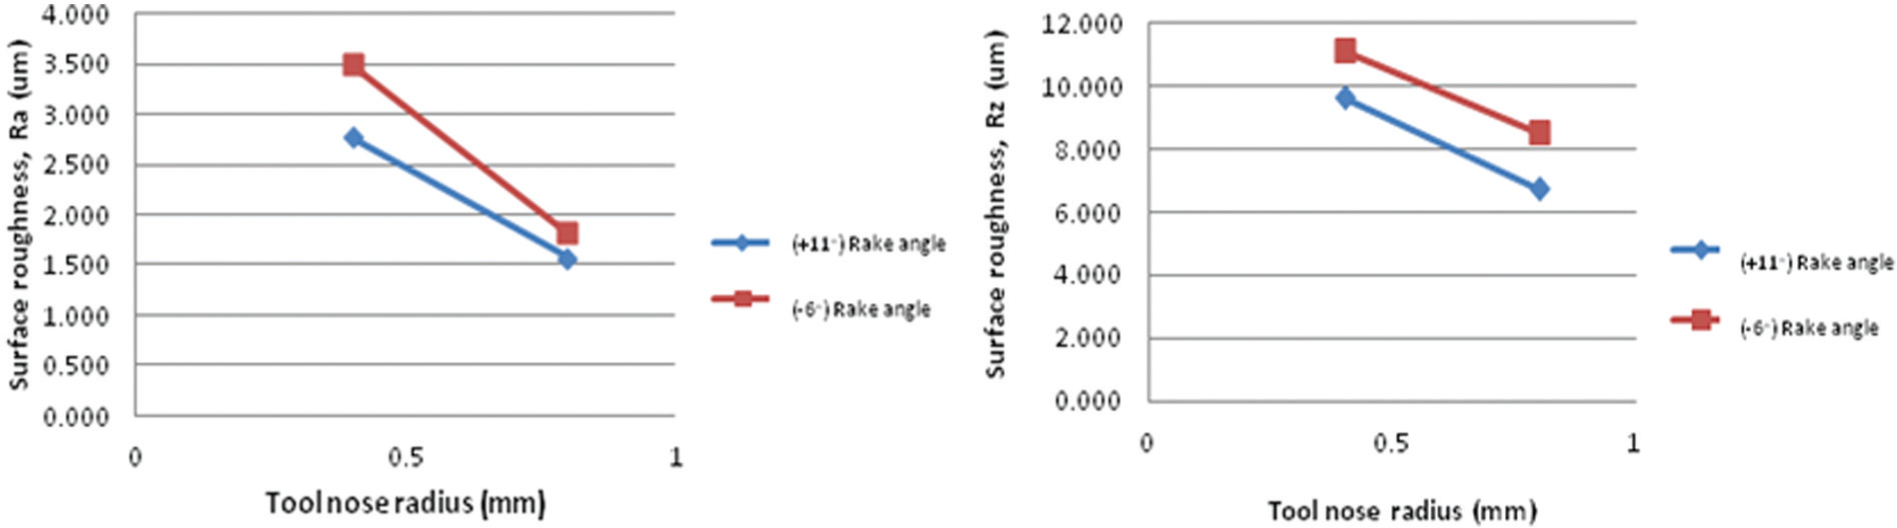
Example of experimentally obtained relation between surface roughness and tool nose radius at the cutting speed of 100 m/min, the feed rate of 0.2 mm/rev, and the depth of cut of 0.2 mm.
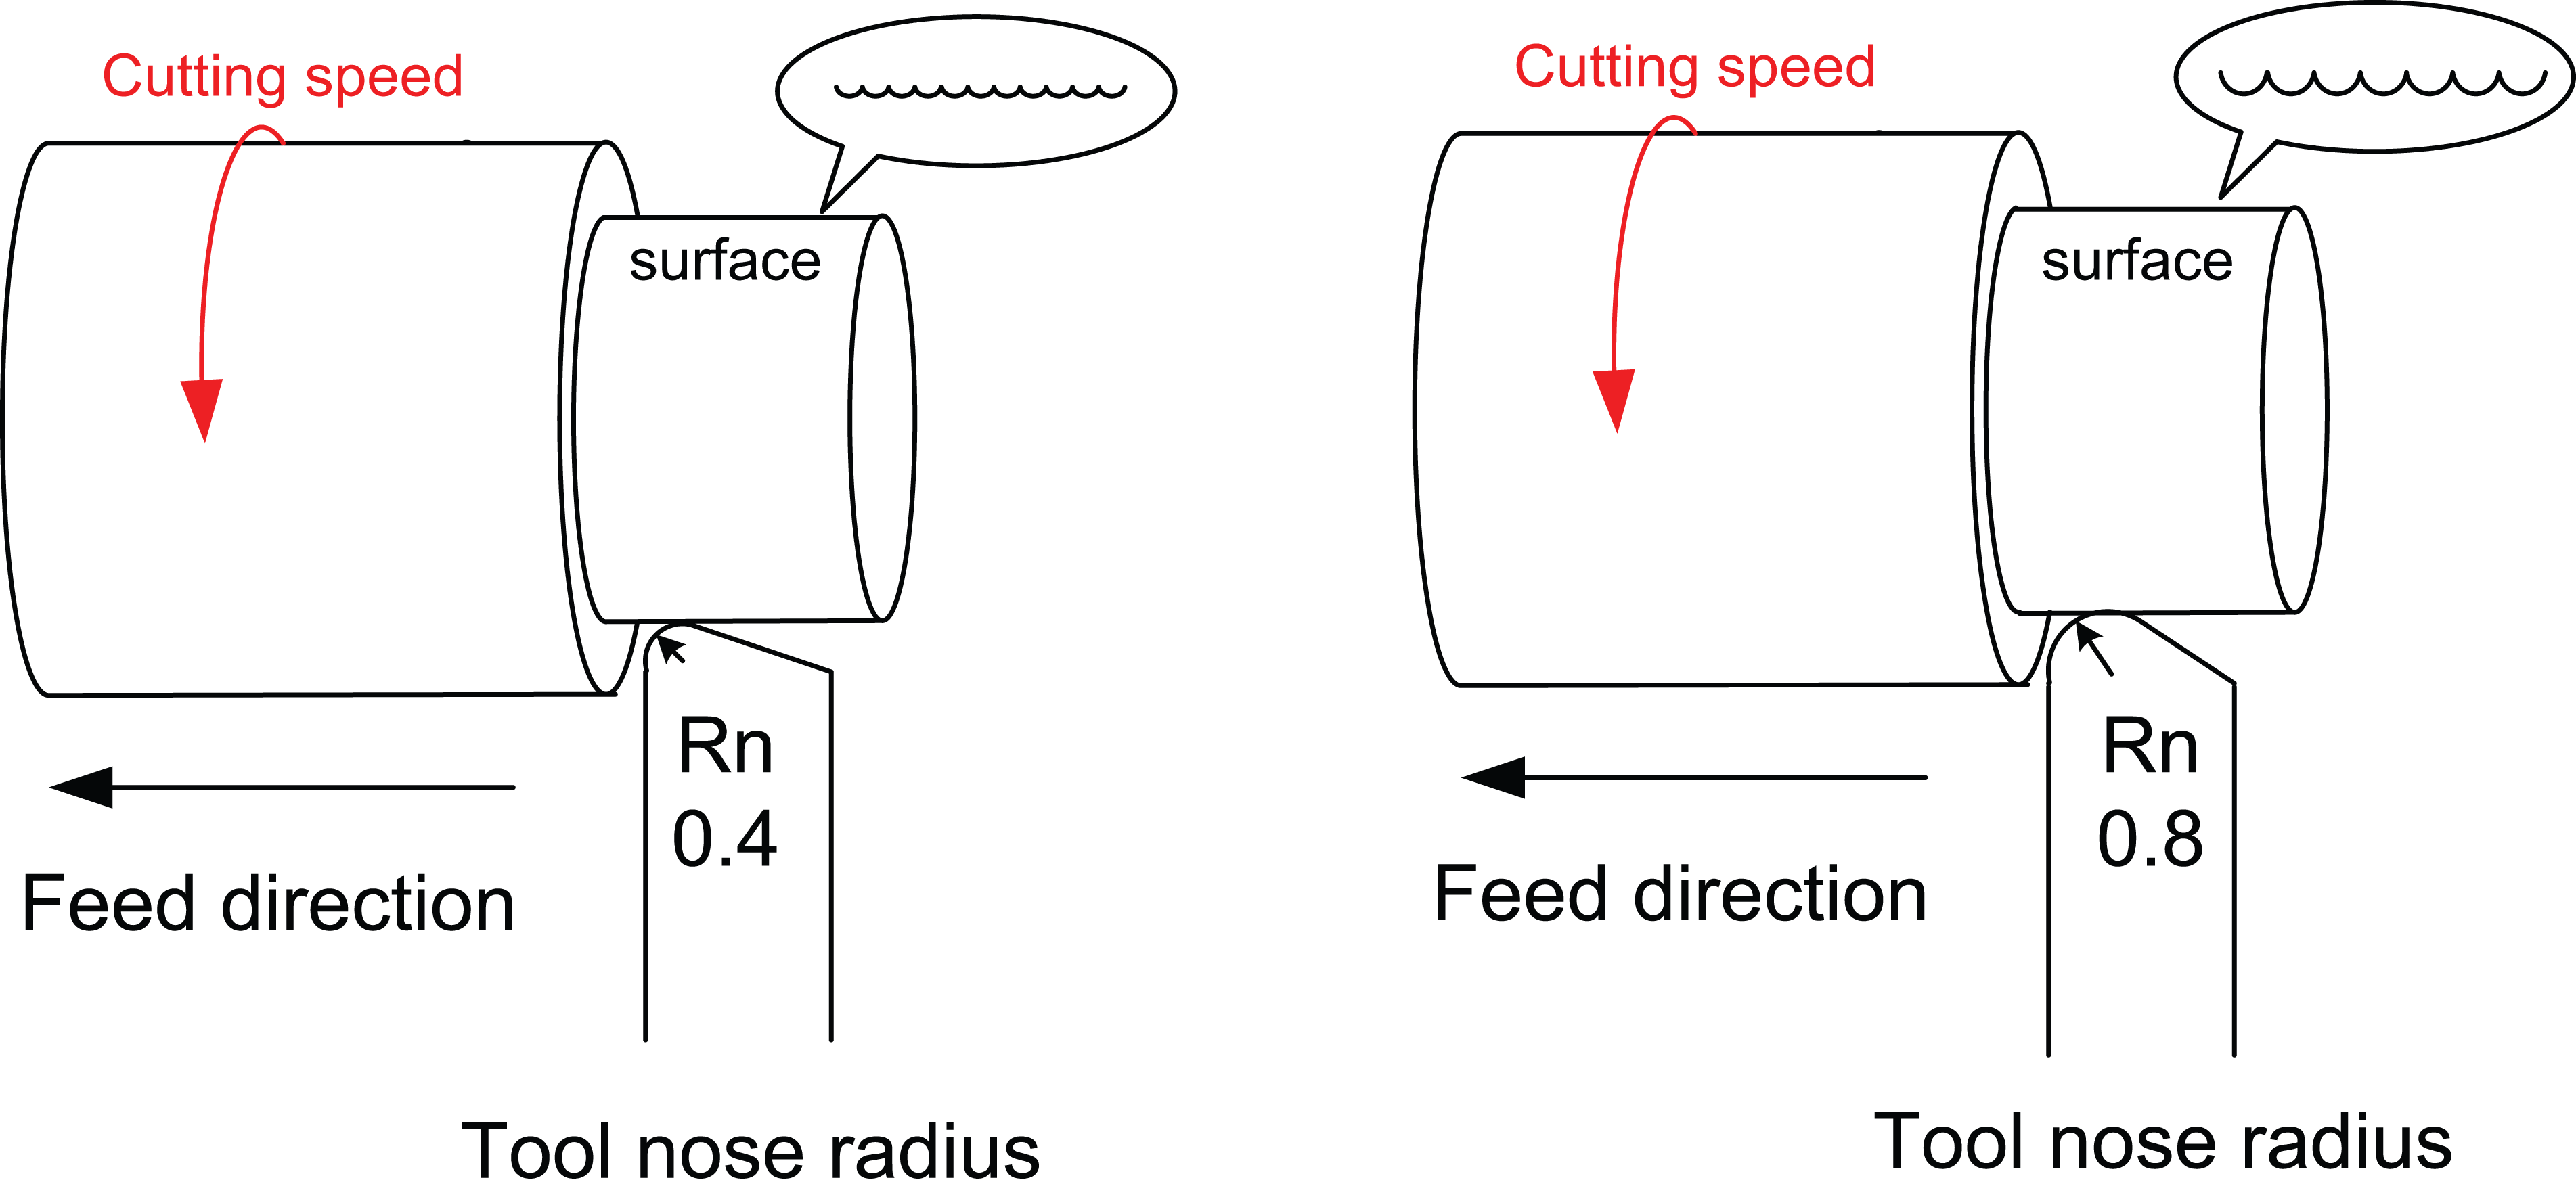
Illustration of relation between surface roughness and tool nose radius.
The other reason is that the larger contact length between the tool nose radius and the workpiece helps to dissipate the heat on the cutting edge which results in lower surface roughness as shown in Figure 17.
The surface roughness tends to decrease as the rake angle increases. The reason is that an increase in rake angle makes the chip flowability easier which helps to reduce the tool wear rate and the surface roughness. It means that the rake angle has the large effect on the surface roughness.
The experimentally obtained relations of the surface roughness and the ratio of decomposed cutting forces show the same trend, although the cutting conditions are different as shown in Figure 19. It can be stated that the greater the ratio of decomposed cutting forces, the less the surface roughness. The dynamic main force is larger than the dynamic feed force when the tool wear progresses, which causes the higher surface roughness at the low ratio of decomposed cutting forces. It is concluded that the ratio of decomposed cutting forces affects the surface roughness which can be used to predict the in-process surface roughness during the cutting process, although the cutting conditions are changed.
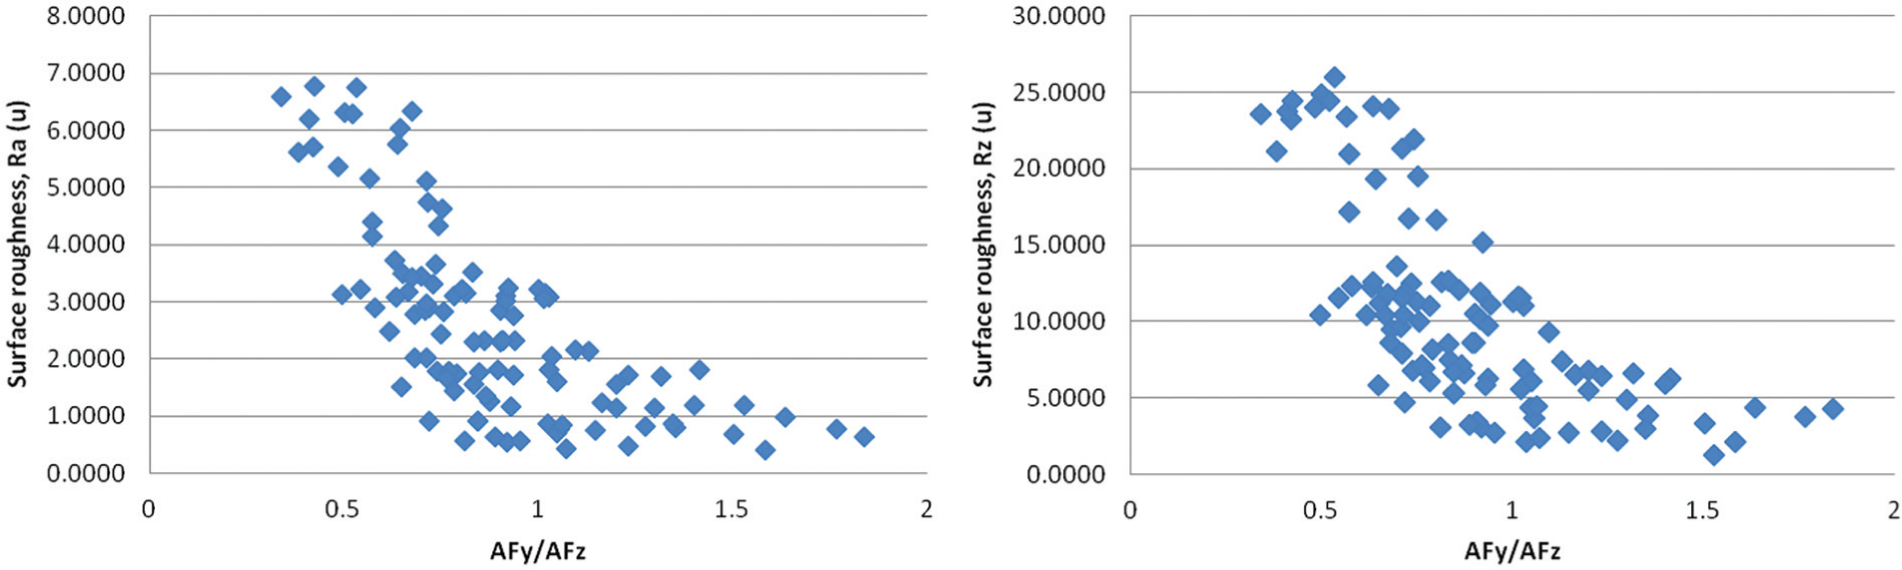
Example of experimentally obtained relation between surface roughness and ratio of decomposed cutting forces.
Referring to the experimentally obtained results, it is shown that the surface roughness will increase proportionally to the feed rate and the depth of cut. In contradictory, the surface roughness is inversely proportional to the cutting speed, the tool nose radius, the rake angle, and the ratio of decomposed cutting forces.
In-process surface roughness prediction and accuracy
The experimentally obtained in-process surface roughness models are expressed in equations (3) and (4)
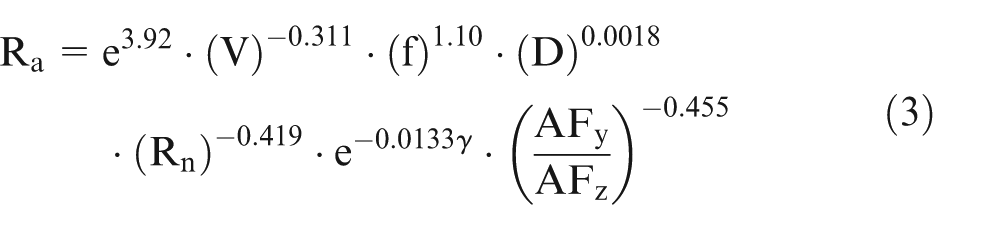
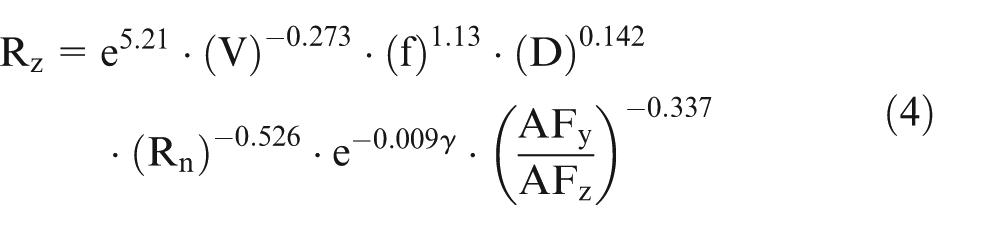
The above models are obtained at 95% confidence level. According to the above models, the magnitude of the power of each parameter means to the responsibility of that parameter to the surface roughness, while the sign of the power means how it affects to the surface roughness, which are consistent with the experimental results as shown in Figures 12–19. Therefore, the proposed models are reliable to predict the in-process surface roughness by monitoring the ratio of decomposed cutting forces with the cutting conditions of the cutting speed, the feed rate, the depth of cut, the tool nose radius, and the rake angle.
The new cutting tests are conducted to verify the model accuracy using the new cutting conditions as shown in Table 2. The algorithm to decompose the dynamic cutting forces and predict the in-process surface roughness is proposed in Figure 20.
New cutting conditions.
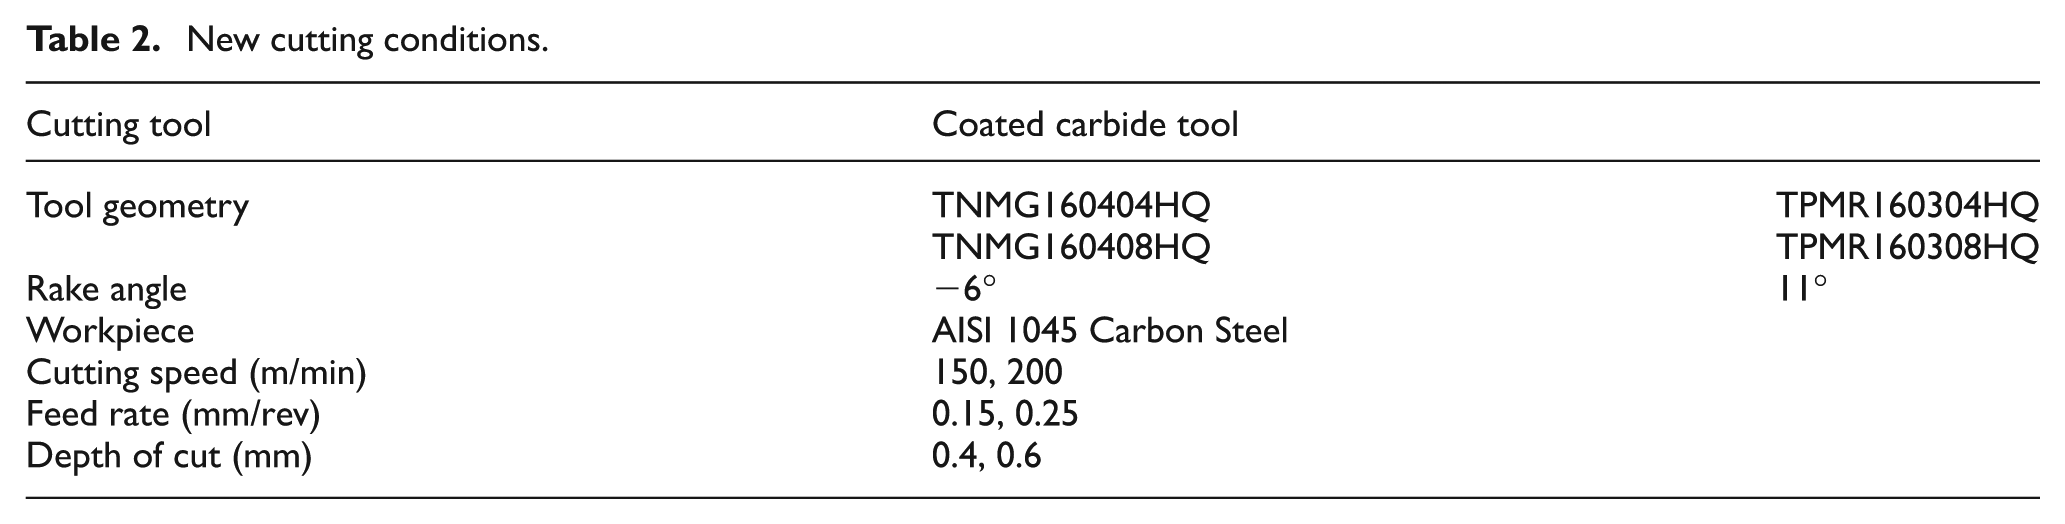
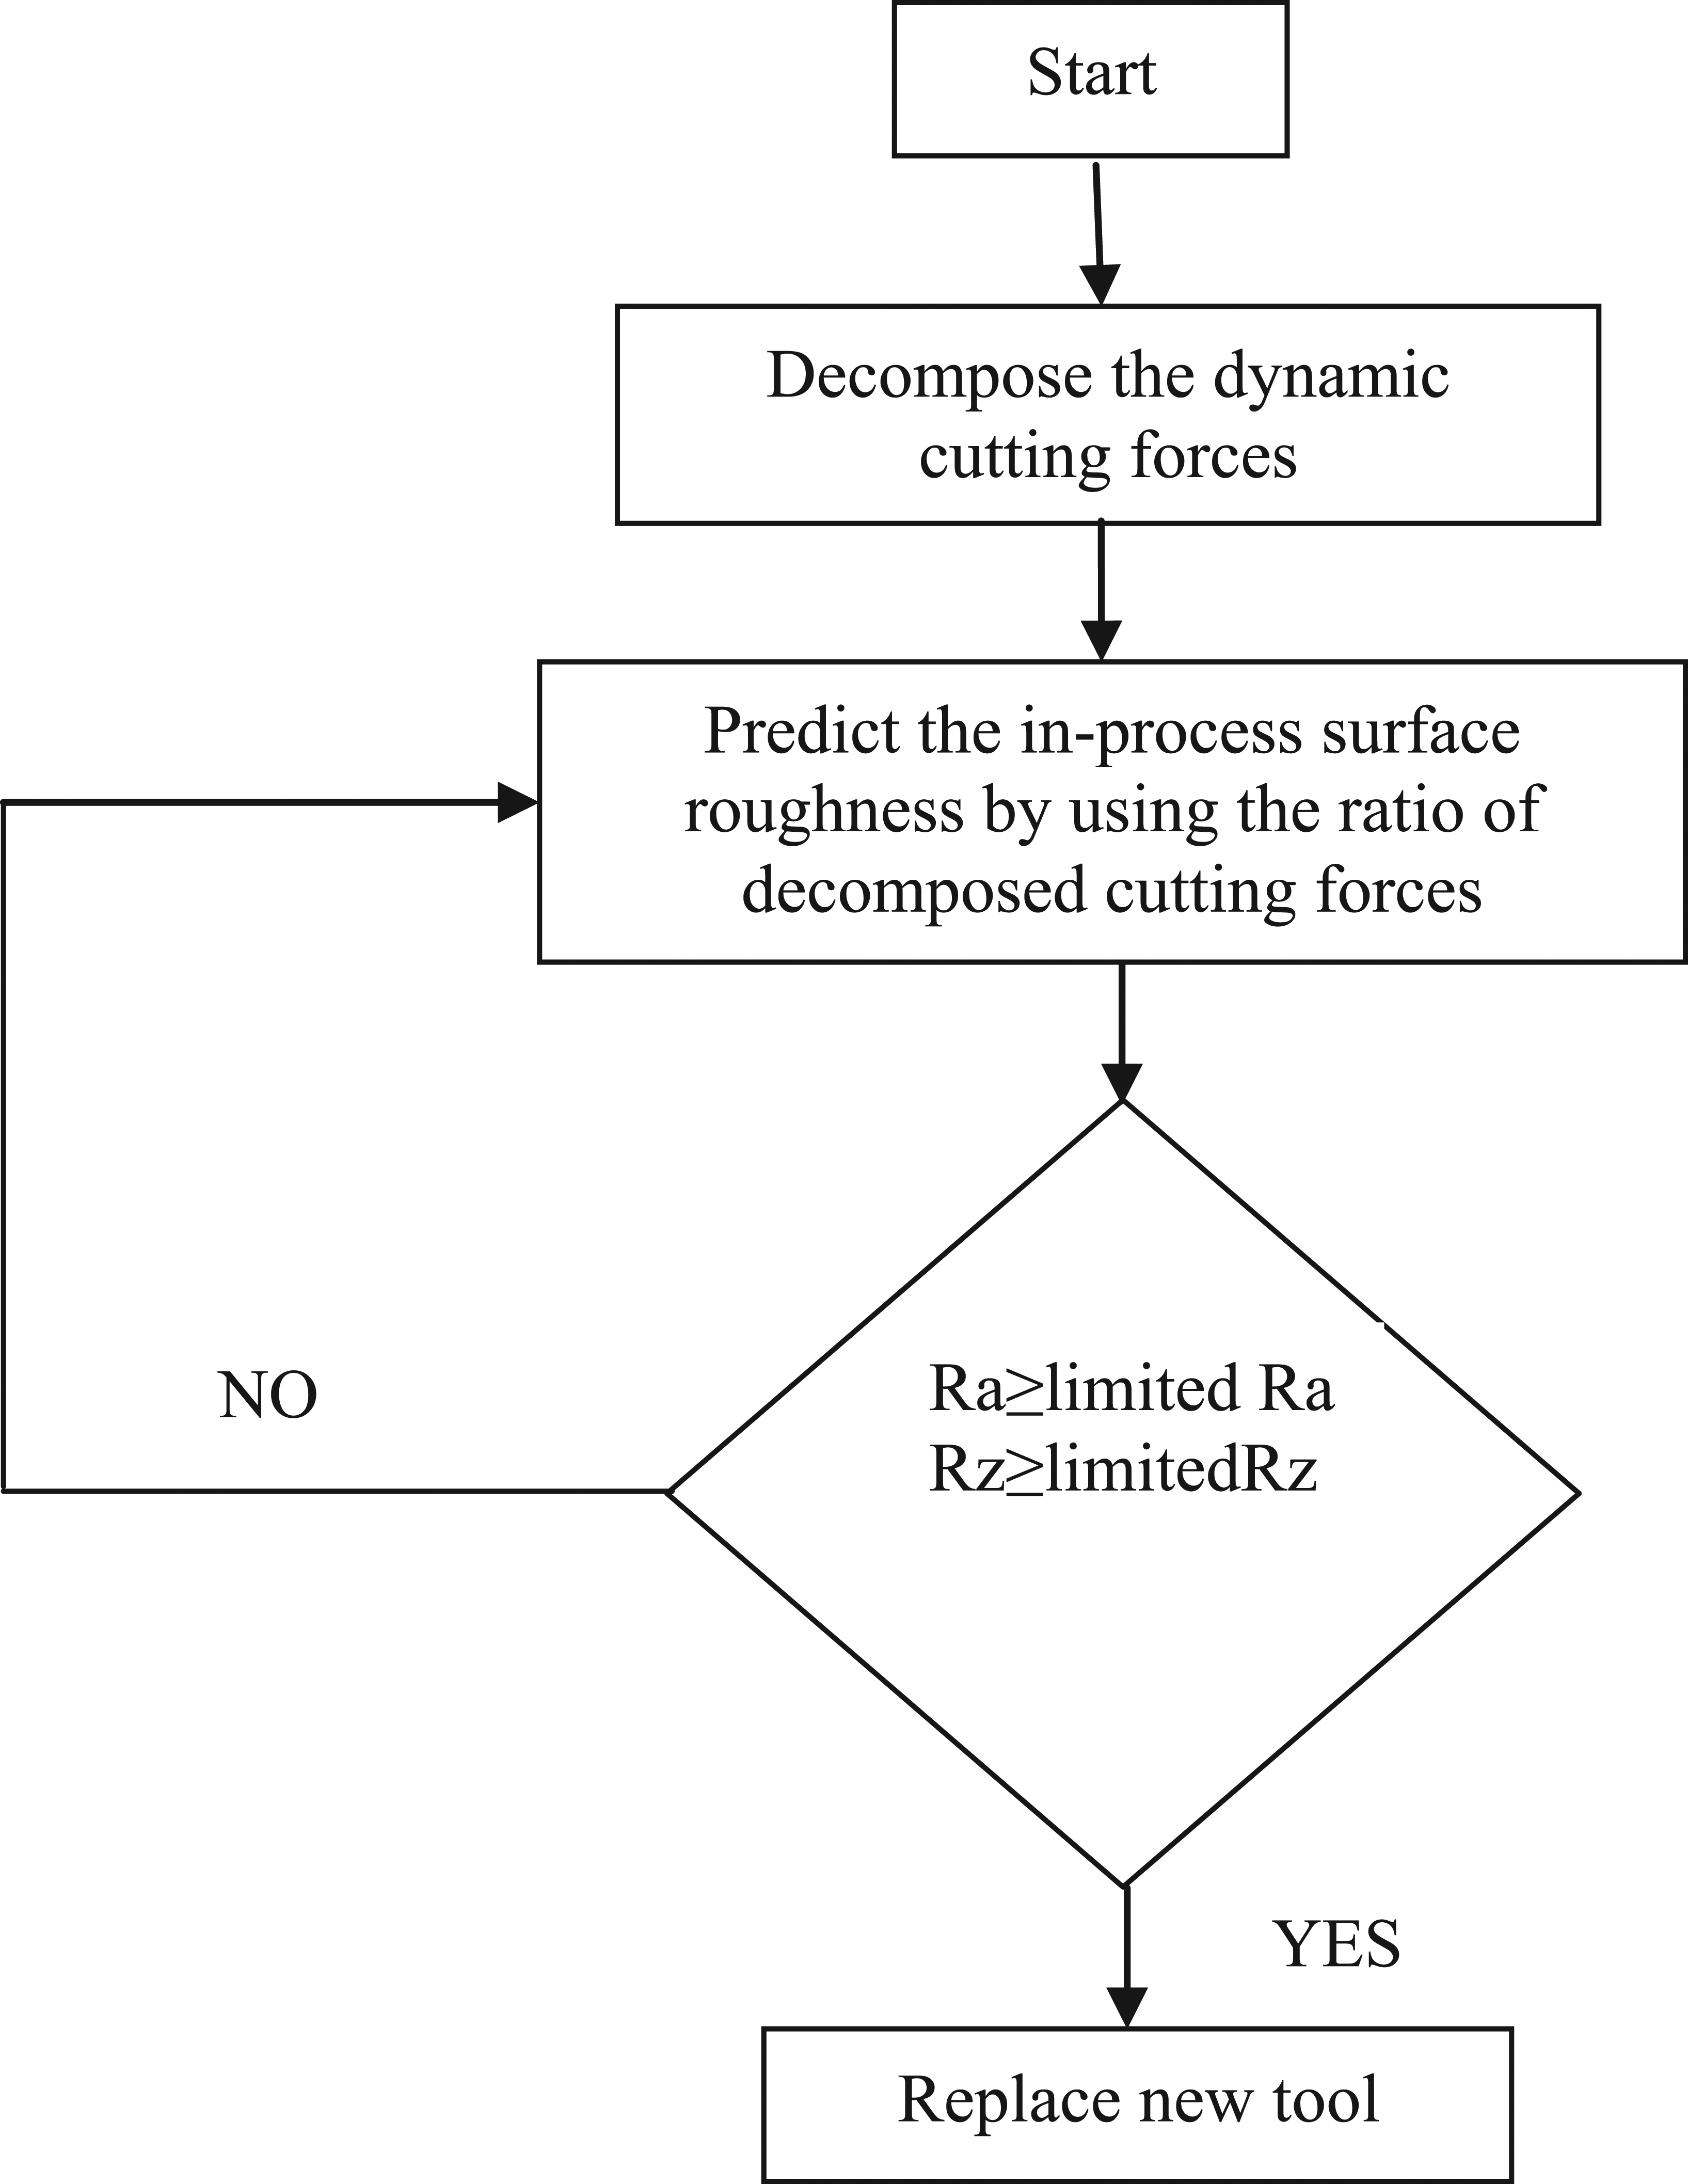
Illustration of algorithm to decompose the dynamic cutting forces and predict the in-process surface roughness.
Figures 21 and 22 show the experimentally measured surface roughness and the in-process predicted surface roughness obtained from the models. The prediction accuracy of the Ra is about 93.67% and the Rz is about 93.22%, which are higher than the ones from the previous researches of author.1–3 The values of the in-process predicted surface roughness fall in the ±10% measured surface roughness and less than the limited Ra of 10 µm and Rz of 25 µm. It indicates that the proposed models can be used to predict and control the in-process surface roughness referring to the ±10% lines of the specific surface roughness and the limited Ra and Rz, although the cutting conditions are changed.
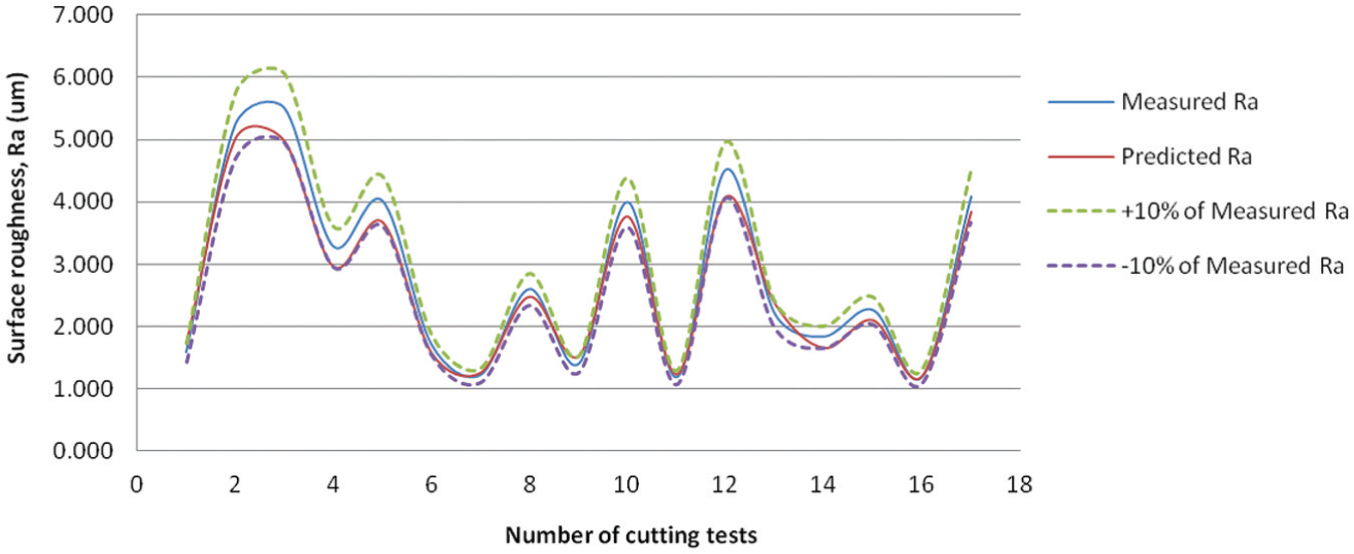
Illustration of the measured average surface roughness, the in-process predicted surface roughness, and the ±10% measured surface roughness.
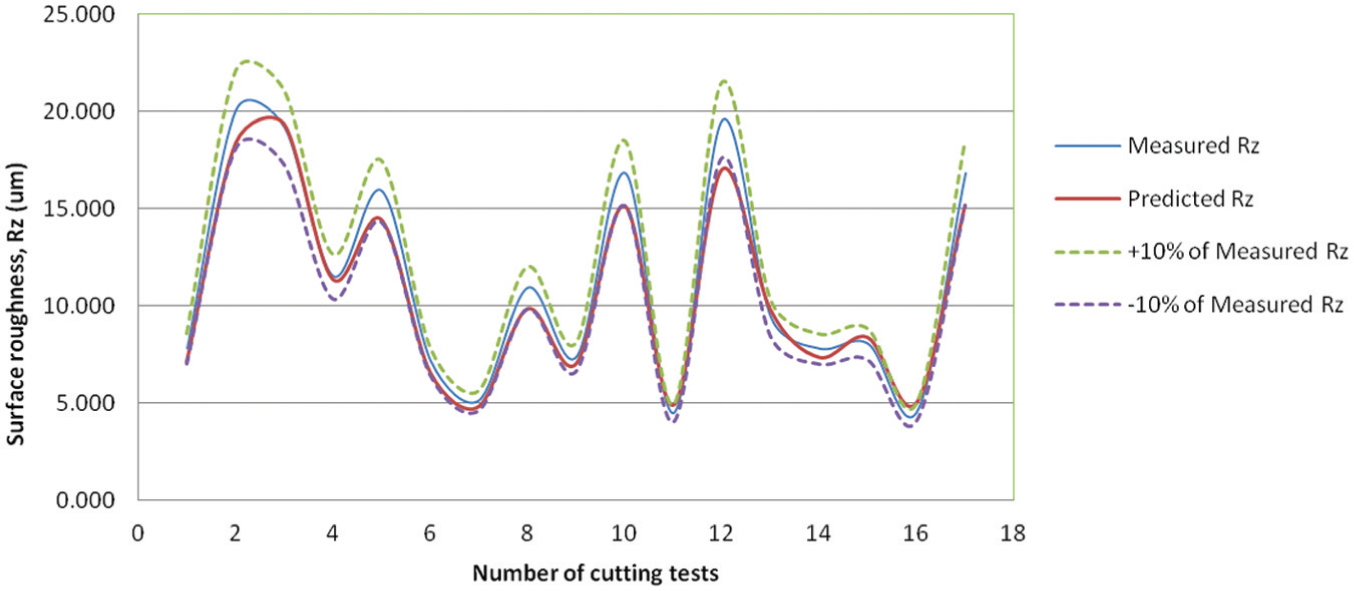
Illustration of the measured surface roughness, the in-process predicted surface roughness, and the ±10% measured surface roughness.
Conclusion
This article presents the advanced works of author in CNC turning which is normally used to generate the surface roughness of the mechanical parts as required. However, the surface roughness cannot be predicted when the broken chips occur during the cutting. It is therefore desirable to know the in-process surface roughness regardless of the broken chip formation and the cutting conditions by monitoring the dynamic cutting forces. The in-process monitoring of dynamic cutting forces is proposed and developed to classify the broken chip signal in order to predict the in-process surface roughness.
First, the Meyer wavelet transform has been utilized to decompose the dynamic cutting forces in both time and frequency domains to determine the suitable levels for the surface roughness frequency and the chip breaking frequency. The decomposed main and feed forces obtained from the fifth level are correspondent with the surface roughness profile in both time and frequency domains. It is understood that the broken chip signals can be separated from the surface roughness signal and the chip breaking frequency is higher than the surface roughness frequency. The broken chip signal appears at the low level of the wavelet transform but the higher level of it will be suitable to monitor the surface roughness frequency, which is the fifth level.
Second, the in-process surface roughness models are proposed and developed using the decomposed cutting forces. The relations of the surface roughness, the cutting conditions, and the decomposed cutting forces are examined to develop the in-process prediction of surface roughness models. The decomposed cutting forces obtained from the fifth level are taken into the ratio in order to cut-off the effects of the cutting conditions. The dimensionless ratio of decomposed cutting forces can be calculated by taking the ratio of the decomposed feed force to that of the decomposed main force, which is proposed to predict the in-process surface roughness, although the cutting conditions are changed.
Finally, the in-process surface roughness models are developed including with the cutting parameters of the cutting speed, the feed rate, the tool nose radius, the depth of cut, and the rake angle. The exponential function is employed to represent the relation of the surface roughness, the cutting parameters, and the ratio of decomposed cutting forces. The multiple regression analysis has been utilized to calculate the regression coefficients of the in-process prediction of surface roughness models using the least square method.
It has been proved by the new cutting tests that the in-process surface roughness can be predicted and obtained with the high accuracy regardless of the broken chip signals and the cutting conditions using the experimentally obtained models at 95% confidence level.
The largest advantage of the proposed method here is that the in-process surface roughness models can be utilized to predict and control the in-process surface roughness during the CNC turning referring to the ±10% lines of the specific surface roughness and the limited surface roughness.
Footnotes
Declaration of conflicting interests
The author(s) declared no potential conflicts of interest with respect to the research, authorship, and/or publication of this article.
Funding
The author(s) disclosed receipt of the following financial support for the research, authorship, and/or publication of this article: This work was performed and supported by The Thailand Research Fund (TRF) from March 2009 to March 2011.