
Abstract
The accurate modeling of thermal gradients and distortion generated by directed energy deposition additive manufacturing requires a thorough understanding of the underlying physical processes. One area that has the potential to significantly affect the accuracy of thermomechanical simulations is the complex forced convection created by the inert gas jets that are used to deliver metal powder to the melt pool and to shield the laser optics and the molten material. These jets act on part surfaces with higher temperatures than those in similar processes such as welding and consequently have a greater impact on the prevailing heat transfer mechanisms. A methodology is presented here which uses hot-film sensors and constant voltage anemometry to measure the forced convection generated during additive manufacturing processes. This methodology is then demonstrated by characterizing the convection generated by a Precitec® YC50 deposition head under conditions commonly encountered in additive manufacturing. Surface roughness, nozzle configuration, and surface orientation are shown to have the greatest impact on the convection measurements, while the impact from the flow rate is negligible.
Keywords
Introduction
In additive manufacturing (AM), components are produced in a layer-by-layer manner directly from a digital file. Directed energy deposition (DED) is a major subset of currently available AM processes, in which a high-energy density heat source, such as a laser, electron beam, or arc, is used to create a melt pool into which metal powder or wire is injected. The localized heat input and the heat removed through conduction, convection, and radiation create complex thermal gradients. When combined with the contraction of the melt pool during rapid solidification, plastic deformation and residual stress are induced and negatively affect the finished part, causing it to crack or distort. Finite element analysis (FEA) is often used to simulate the thermal cycles and distortion experienced by discrete components during DED and similar processes. However, useful FEA results can only be achieved when the underlying physical processes are accurately captured.
The high-energy density heat source and the resulting distortion modes in DED are very similar to those found in welding. FEA has been used extensively to simulate welding processes,1–3 and many aspects of these studies are useful in defining models of the DED process. Unfortunately, the convection models used to simulate shielding gas flows in welding may not be useful. During welding, the rate of convective heat transfer from the weld bead to the environment is low compared to the rate of conductive heat transfer from the bead into the part. 4 As a result, convective heat loss has been excluded in some models, 5 while natural convection has been applied to all free surfaces in others.6–10 However, weld models are not very sensitive to convection because of the comparatively short processing times, low bulk temperatures, and the relatively small amount of filler material addition compared to the size of the existing part.
Even though there are similarities with welding, DED processes have unique characteristics that complicate the convective heat transfer conditions. For example, laser-based processes utilize inert gas jets that are much more concentrated than those used in welding. These jets are used to shield the melt pool, protect the laser optics, and deliver powder to the melt pool. Consequently, localized forced convection is generated on the surfaces of the melt pool and the rapidly solidifying material. In addition, the long processing times and high bulk temperatures prevalent during DED processes allow a great deal of heat to be evacuated through convection. 11 Furthermore, the role of forced convection becomes more significant when the large surface area of the deposition and the localization of the convection are considered.
Michaleris 4 demonstrated that the thermal results of FEA models of DED process are sensitive to surface convection. Despite this sensitivity, convection has been inconsistently applied to FEA models of the process. For example, surface convection has been neglected12–15 or assumed to be equal to natural convection,16–18 much like the conditions used in the welding literature. Dai and Shaw 19 use an atypically high value of 60 W/m2/K for natural convection, although the motivation for this choice is unclear. Some of the results from these studies were not validated with experiments, while others were validated with small builds that did not allow sufficient time for the convective heat loss to become significant.
Other researchers have included forced convection models in their simulations of laser-based DED processes. Qi et al. 20 considered forced convection when modeling laser cladding; however, the value of the coefficient of convection was not reported. Michaleris 4 approximated the forced convection as a sphere of higher convection surrounding the melt pool, while free convection was applied on all surfaces outside of this sphere. Ghosh and Choi implemented forced convection from the shielding jet using the empirical equation defined by Gardon and Cobonque21, 22 and natural convection on all free surfaces not affected by the gas flow. 23 Zekovic et al. 24 included the forced convection on a thin wall and substrate caused by four radially symmetric nozzles blowing an argon gas carrying powder onto the deposition zone. Flow modeling software was used to calculate the velocity contours of the gas around the wall and substrate, and analytical relations were used to calculate local coefficient of convection for the velocity. However, none of these convection models have been validated for the processes being modeled.
Heat transfer resulting from gas jets has been experimentally and numerically studied.25–34 Many of these works have concluded that the heat transfer is dependent upon the velocity of the jet and its turbulence, which is directly affected by the geometry of the nozzle. Researchers have also investigated how the impingement angle affects the heat transfer on a plate.25–28 Others have studied the velocity field and heat transfer resulting from two coaxial jets29–33 and the effect of particles in the flow. 34 However, these studies are typically performed using nozzles that are designed to achieve desired flow characteristics, not using nozzles designed for industrial applications. The complexity of the laser deposition process introduces a number of other considerations when attempting to quantify coefficients of convection for improved simulation results. For example, the interaction of the shielding and powder delivery jets, the effect of the metal powder in the jet, and the effect of the deposited surface roughness on the rate of heat transfer have unknown impacts on the predicted convection and the accuracy of these deposition process models.
Measurements of the convection generated during deposition processes are required to produce accurate FEA thermal models. 4 A technique based on the use of hot-film constant voltage anemometry is developed here to measure the heat transfer from the forced convection produced by laser deposition heads. Calibrations are made to then extract the coefficient of convection from the heat dissipated from the sensor. The forced convection is then characterized at multiple locations around the deposition head to generate a map of the forced convection acting on the surface. This technique is demonstrated by characterizing the forced convection from a Precitec® YC50 deposition head. An integrated distribution of these measurements is compared to the average convection measured using the lumped capacitance method. Convection resulting from jets impinging onto a flat surface or being bisected by a wall is measured to demonstrate the effect of different surface orientations which are common in AM. In addition, the effects of changes in gas flow rate, nozzle configuration, and surface roughness are investigated to illustrate how convection is affected by changes in common processing parameters.
Methodology
A new method is presented here that utilizes hot-film sensors and constant voltage anemometry to obtain the coefficient of convection from heat transfer measurements at locations on a flat surface relative to the deposition head. Typically, these sensors are used to measure gas velocity based on empirically derived relationships that are dependent upon the gas properties. In the method presented here, the coefficient of convection is extracted from the direct measurement of the heat transfer from the sensor. When a voltage is supplied by a Constant Voltage Anemometer (CVA) to a hot-film sensor, the heat generated through resistive heating is dissipated into the environment through convection and radiation and into the substrate through conduction. Each sensor must be calibrated to determine the conductive heat transfer and the effective area over which the radiation and convection occur. The results allow the coefficient of convection (
Calculating
from hot-film anemometry measurements
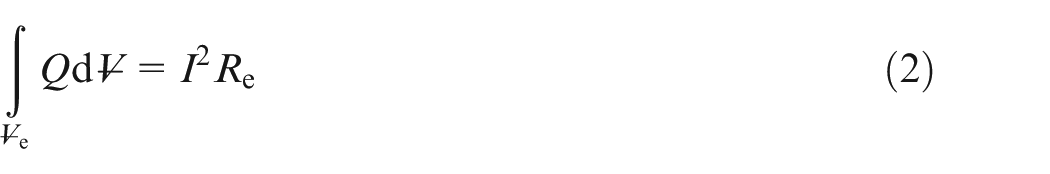
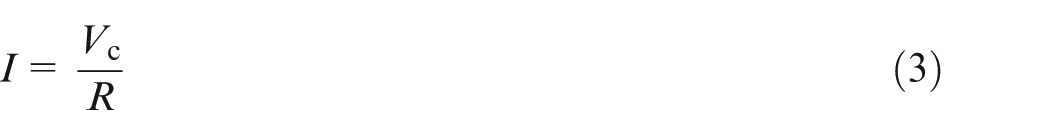
Constant voltage anemometry is used to measure the steady-state heat transfer from the element of a hot-film sensor into its surroundings, as shown in Figure 1, and defined by the following energy balance
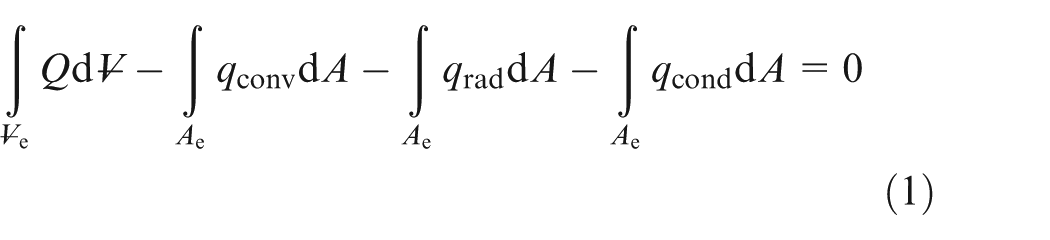
where
where the variables
where

Energy balance of the sensor element.
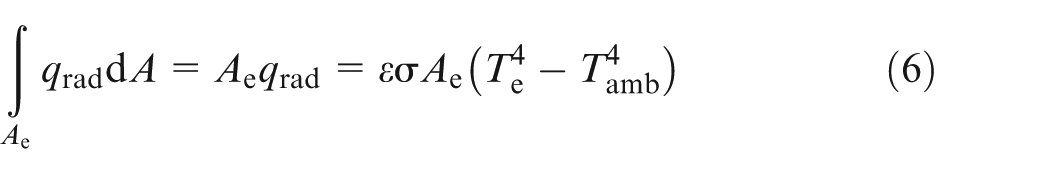
The total convective heat flux (
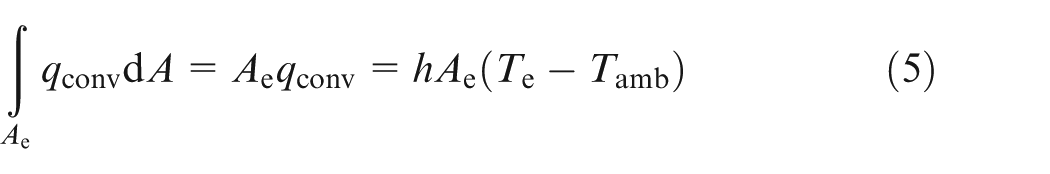
The variables
where
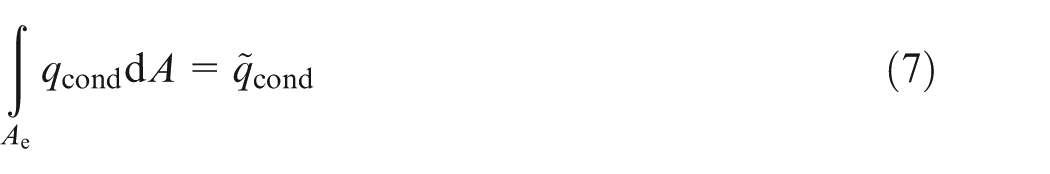
The total conductive heat transfer is derived empirically in section “Conduction into the substrate.” As a result, the total energy balance of the sensor is

The total energy balance is maintained despite changes in the heat transfer acting on the sensor element because its resistance changes in response. For example, an increase in the convection acting on the element decreases its temperature. In turn, both the element resistance and the total resistance of the circuit decrease, causing the current flowing through the element to increase and leading to more resistive heating that balances the increase in convective heat transfer. The following equation relates the temperature and resistance of the element
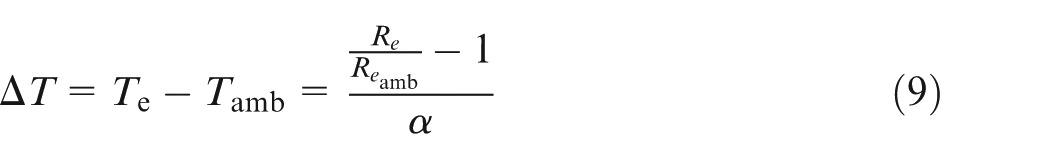
The resistance increases from its initial value (
Based on these measurements, the coefficient of convection can be determined using the following relationship
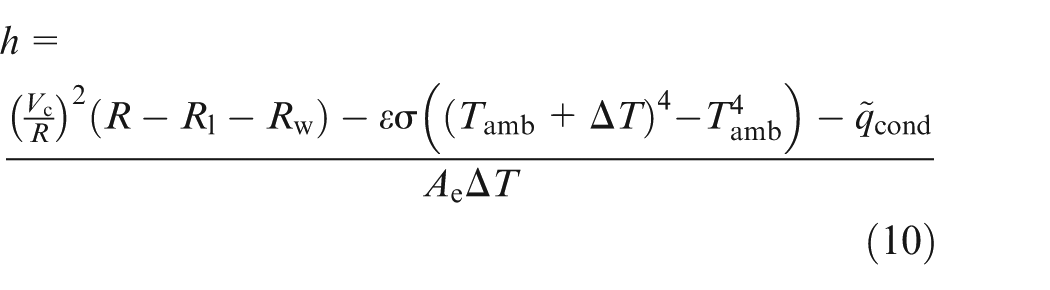
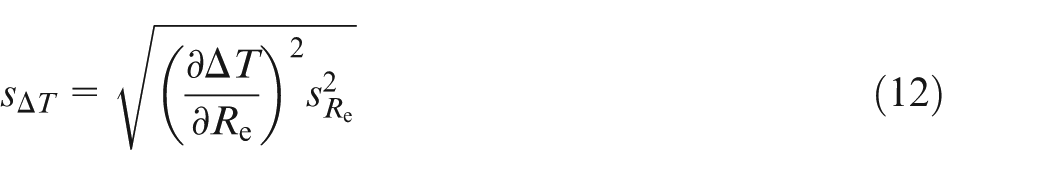
The standard deviation of the coefficient of convection (
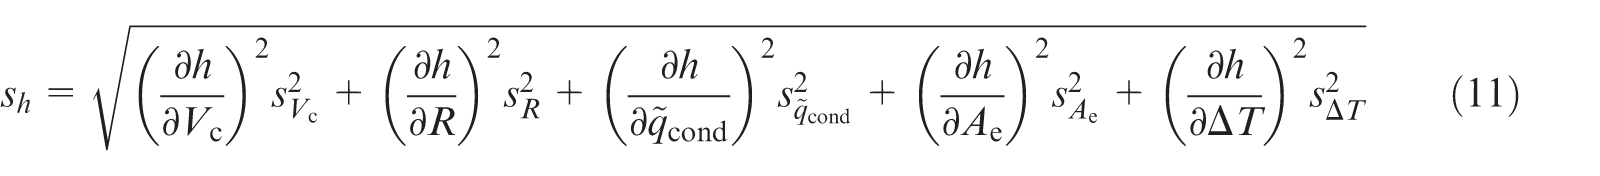
where
where
Sensor calibration
Conduction into the substrate
Conduction from the sensor element into the substrate is complex and cannot be easily calculated. Both the thin film onto which the sensor element is deposited and the adhesive used to mount the sensor to the substrate impact the conduction in unknown ways. Empirically derived functions must, therefore, be developed to take into account the variations within the sensors, adhesives, and substrates.
In order to measure the conduction, the sensor must be insulated from convection and radiation. Insulation is used to eliminate the convective and radiative heat transfer components and allow conduction to be measured using the following relationship

A range of constant voltages are applied to the sensor to heat the element to different temperatures. Measurements of the heat transfer from the element are made at each constant voltage increment once the element temperature has stabilized. It is assumed that the substrate temperature is equal to the ambient temperature (
The average values of the constant voltage and the output signal during the steady-state measurement at each increment are used to calculate the increase in sensor element temperature (
Effective surface area of the element
Resistive heating within the sensor element generates a greater temperature in the element than in the leads. This temperature gradient effectively spreads the heat over a greater area than the nominal area of the element, as demonstrated by O’Donovan et al.
36
using a FEA model of a sensor. In the method presented here, the effective surface area is empirically derived (as a function of
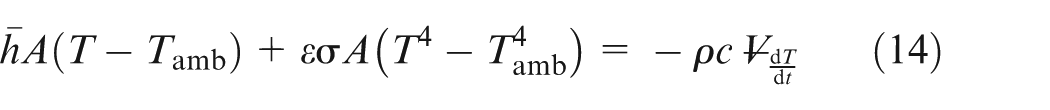
where
The lumped capacitance method is valid when the ratio of convection to internal conduction is sufficiently small. This ratio is described by the nondimensional Biot number (
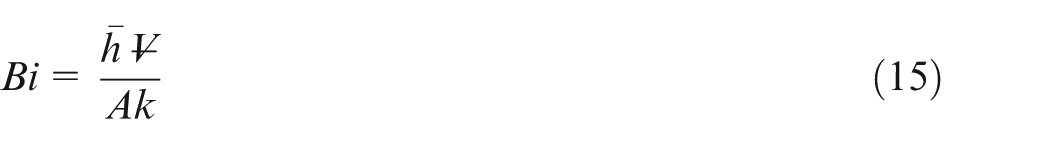
where
Map the distribution of convection
The distribution of the localized forced convection generated by a deposition head is characterized using measurements made at incremental locations, as shown in Figure 1. When the gas flow is begun, the sensor is allowed to achieve equilibrium, as defined in equation (8). The time required for this to occur is dependent upon the sensor and substrate. Once the output signal from the CVA becomes steady, the constant voltage and the sensor output are recorded and then the mean values and standard deviations of these signals are used to calculate the coefficient of convection (
Validation of the methodology
Equipment
Demonstration of the convection measurement method is performed using a commercially available Precitec YC50 clad head and nozzles, which are schematically depicted in Figure 2. In this specific design, argon gas flows through the center of the clad head to shield the melt pool and to protect the laser optics positioned upstream from the head. The inner nozzle constricts the flow from a diameter of 42.0 mm at the interface with the head to a diameter of 10.4 mm at the nozzle exit over a length of 60.1 mm, allowing the shield flow to exit the nozzle through an 85-mm2 area. Powder and argon gas are delivered to the part through a 2.5-mm-wide circumferential channel in the clad head. The clearance between the outer nozzle and the inner nozzle is 0.7 mm, and the powder delivery flow exits through a 65-mm2 area between the inner and outer nozzles. During processing, the bottom of the outer nozzle is positioned at a constant height of 10 mm above the target surface.
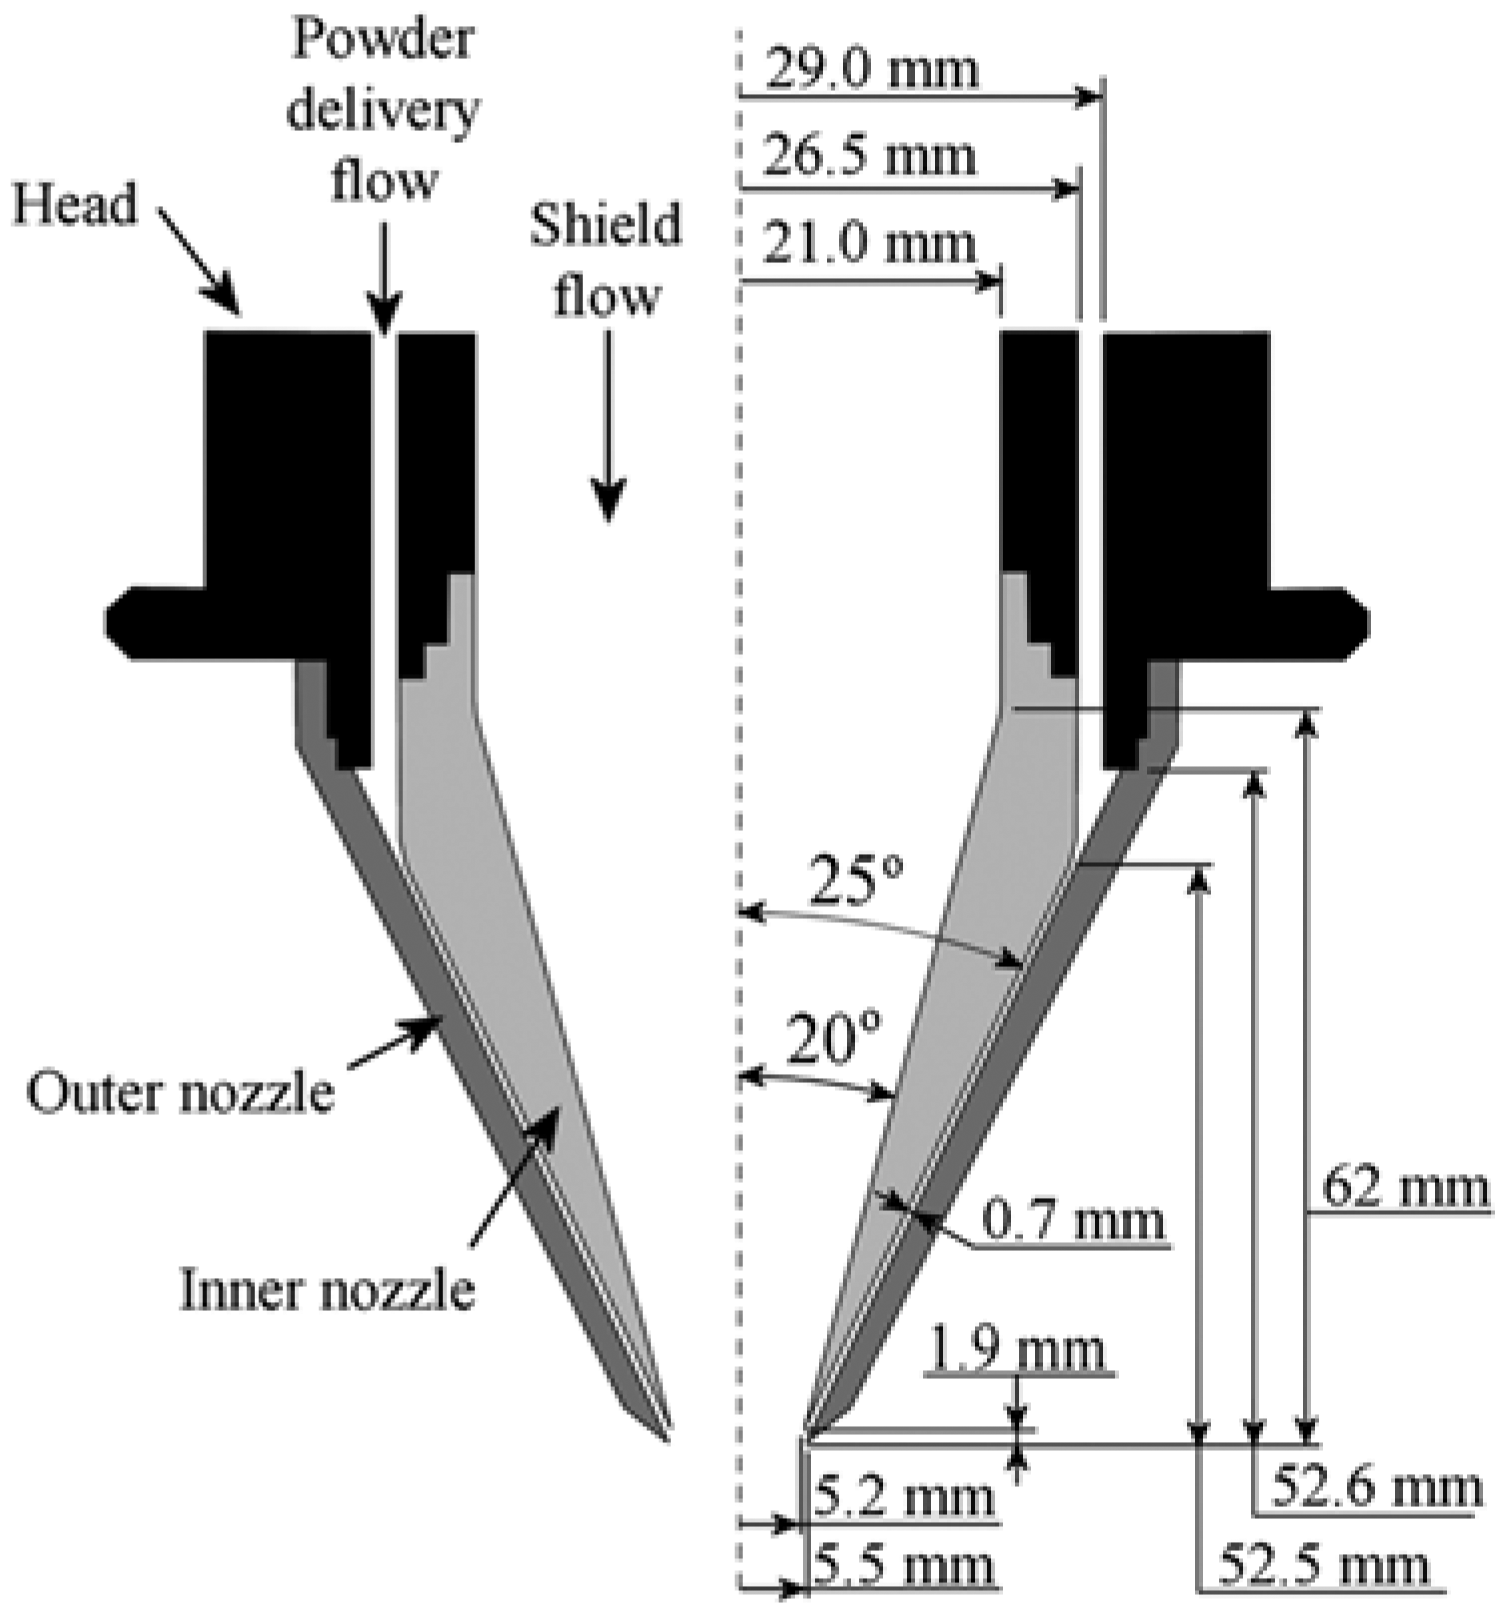
Cross-sectional view of the Precitec® YC50 head and nozzles.
Senflex® SF9902 single-element hot-film sensors from Tao of Systems Integration, Inc. are used to measure the convective heat transfer generated by the deposition head. The sensors are chosen because their small element size results in a fine resolution of the measurement distribution. Figure 3 shows a schematic diagram of a characteristic sensor that consists of a nickel element and copper leads. The nickel element, which is nominally 0.20 μm thick, 0.1 mm wide, and 1.4 mm long, has been deposited onto 0.2-mm-thick Upilex® polyimide film. Copper leads that are nominally 12 μm thick and 0.76 mm wide are also deposited onto the film. Copper wires with diameters of 0.25 mm and lengths between 3.3 and 3.6 m are used to connect the sensors to a four-channel Tao of Systems Integration, Inc. Model 4-600 CVA. The relationship between the output voltage (
where
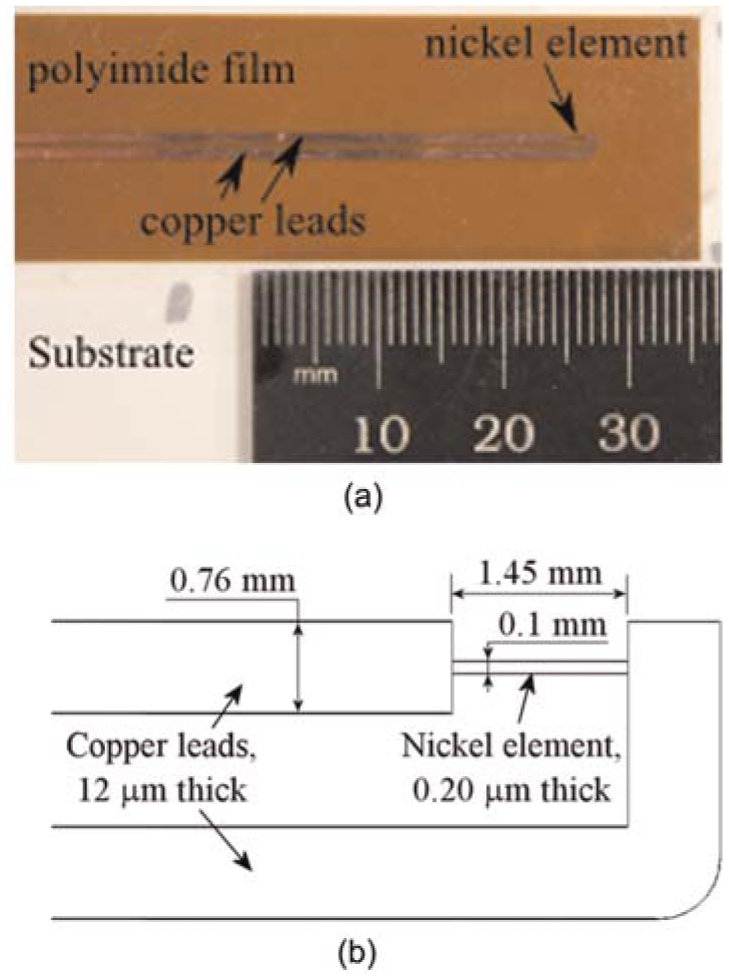
Senflex® SF9902 hot-film sensor with dimensions of the nickel element and copper leads: (a) sensor and (b) schematic diagram of sensor with dimensions.
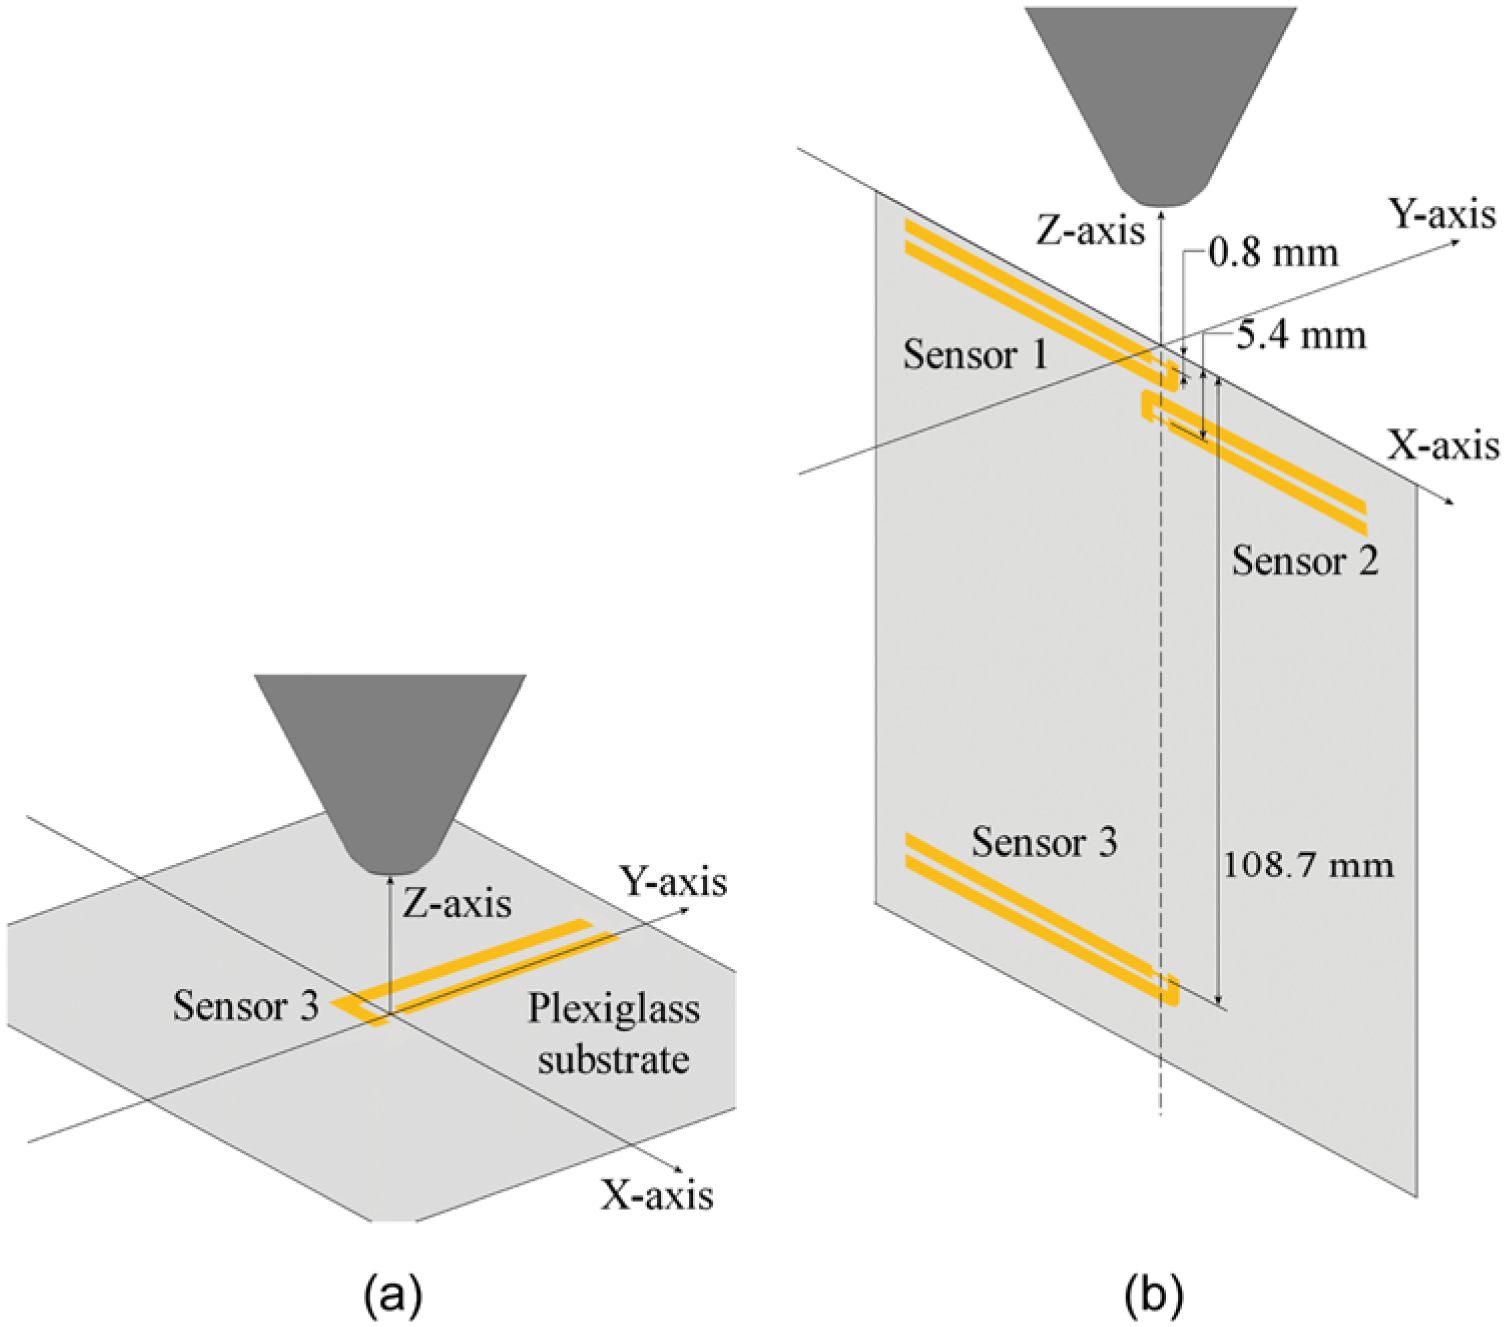
Three sensors are attached to a 222-mm-long, 123-mm-wide, and 3.2-mm-thick plexiglass substrate using MACfilm® IF-2012 adhesive, as shown in Figure 4. This configuration allows the convection acting on a wall to be measured at different distances from the top edge when the substrate is mounted vertically. A plexiglass substrate was chosen because it has a lower thermal conductivity than the metallic materials typically used in cladding operations. This selection decreases the energy transfer through conduction. A 45° edge is ground into the back edge of the substrate, so that this edge has a minimal impact on the gas flow when the substrate is mounted vertically to bisect the flow. Sensors 1 and 2 are placed 0.8 and 5.4 mm from this edge, respectively. Sensor 3 is mounted near the middle of the substrate, 108.7 mm from the ground edge.
Schematic diagram of the plexiglass substrate and the three hot-film sensors mounted on it.
Heat loss through conduction
The process described in section “Conduction into the substrate” is used to empirically derive functions that describe the conductive heat loss from each sensor into the plexiglass substrate. Fiberglass insulation, 90 mm thick, is placed on top of the substrate. Measurements are made using constant voltages between 0.3 and 1.0 V, in 0.1-V increments, to heat the nickel elements. At each setting, the energy balance is allowed approximately 30 s to reach equilibrium before

For each sensor, the heat loss through conduction is dependent on the element temperature: (a) sensor 1, (b) sensor 2, and (c) sensor 3.
The quality of these fits is described by the difference between the calculations and measurements at one standard deviation. These values are less than 1% of the rate of conduction into the substrate from each sensor.
Effective surface area
The effective area of each sensor is found using the process described in section “Effective surface area of the element” using aluminum, copper, and steel plates. Different plates are used to demonstrate that this calibration is independent of the chosen plate material. Table 1 presents the properties of these plates. Each plate is heated and then placed on an insulated fixture, to restrict the heat loss to one side of the plate, and cooled in four different airflows. The chosen reference flows have average velocities that are similar to the output from the deposition head. Three of the reference flows, with velocities of 1.3, 1.8, and 2.5 m/s, are parallel to the plate. A fourth reference flow with a velocity of 2.8 m/s is perpendicular to the cooling plate.
Properties of the plates used in the modified lumped capacitance analysis to determine the effective surface area of each sensor element.
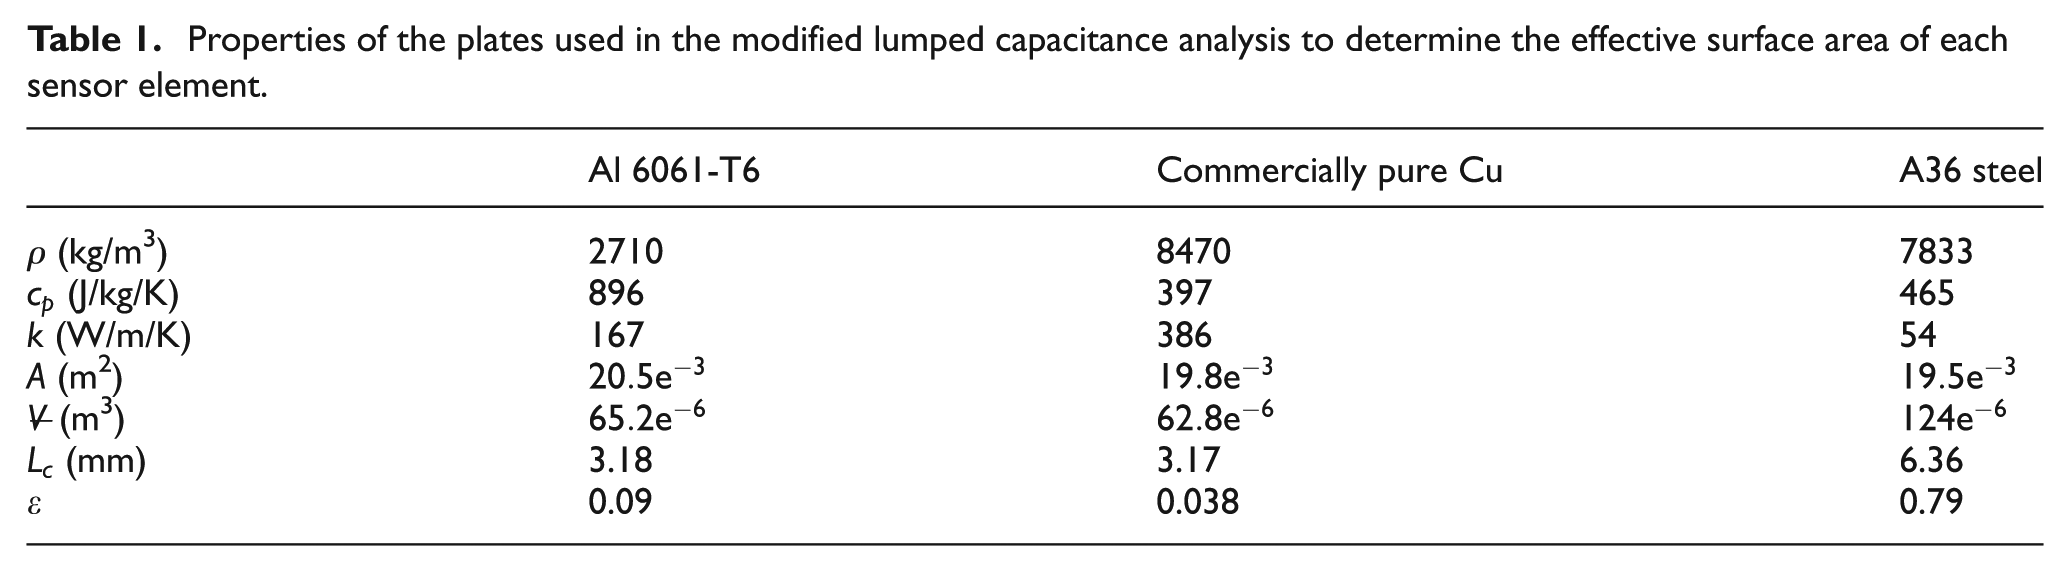
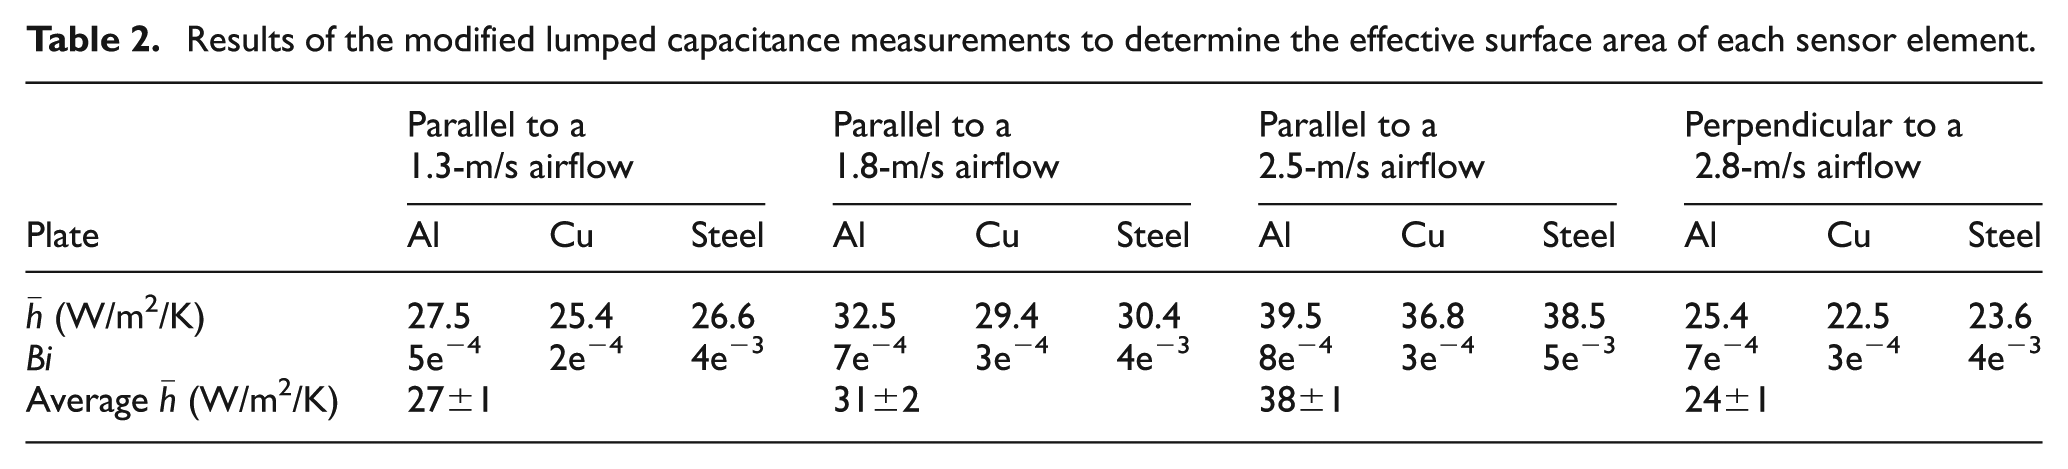
Table 2 presents the results of the modified lumped capacitance measurements. The negligible differences between the measurements made using each plate indicate that the plate material has no impact on the calibration. The mean and standard deviation of the average coefficient of convection is calculated for each airflow. Considering the difference in properties of the three plates, the small standard deviation in each airflow illustrates the consistency of the lumped capacitance method to determine the average convection resulting from each reference flow condition.
Results of the modified lumped capacitance measurements to determine the effective surface area of each sensor element.
After the average convection resulting from each reference flow is determined, measurements are made using the hot-film sensors with the substrate placed in the insulated fixture. Measurements are made in each airflow using constant voltages (

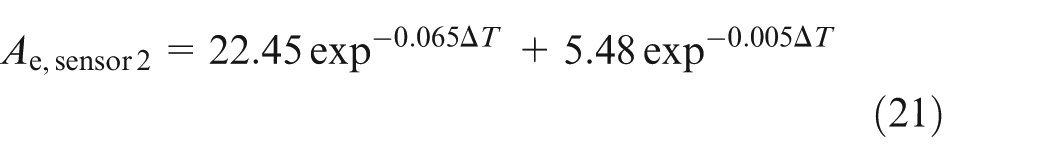

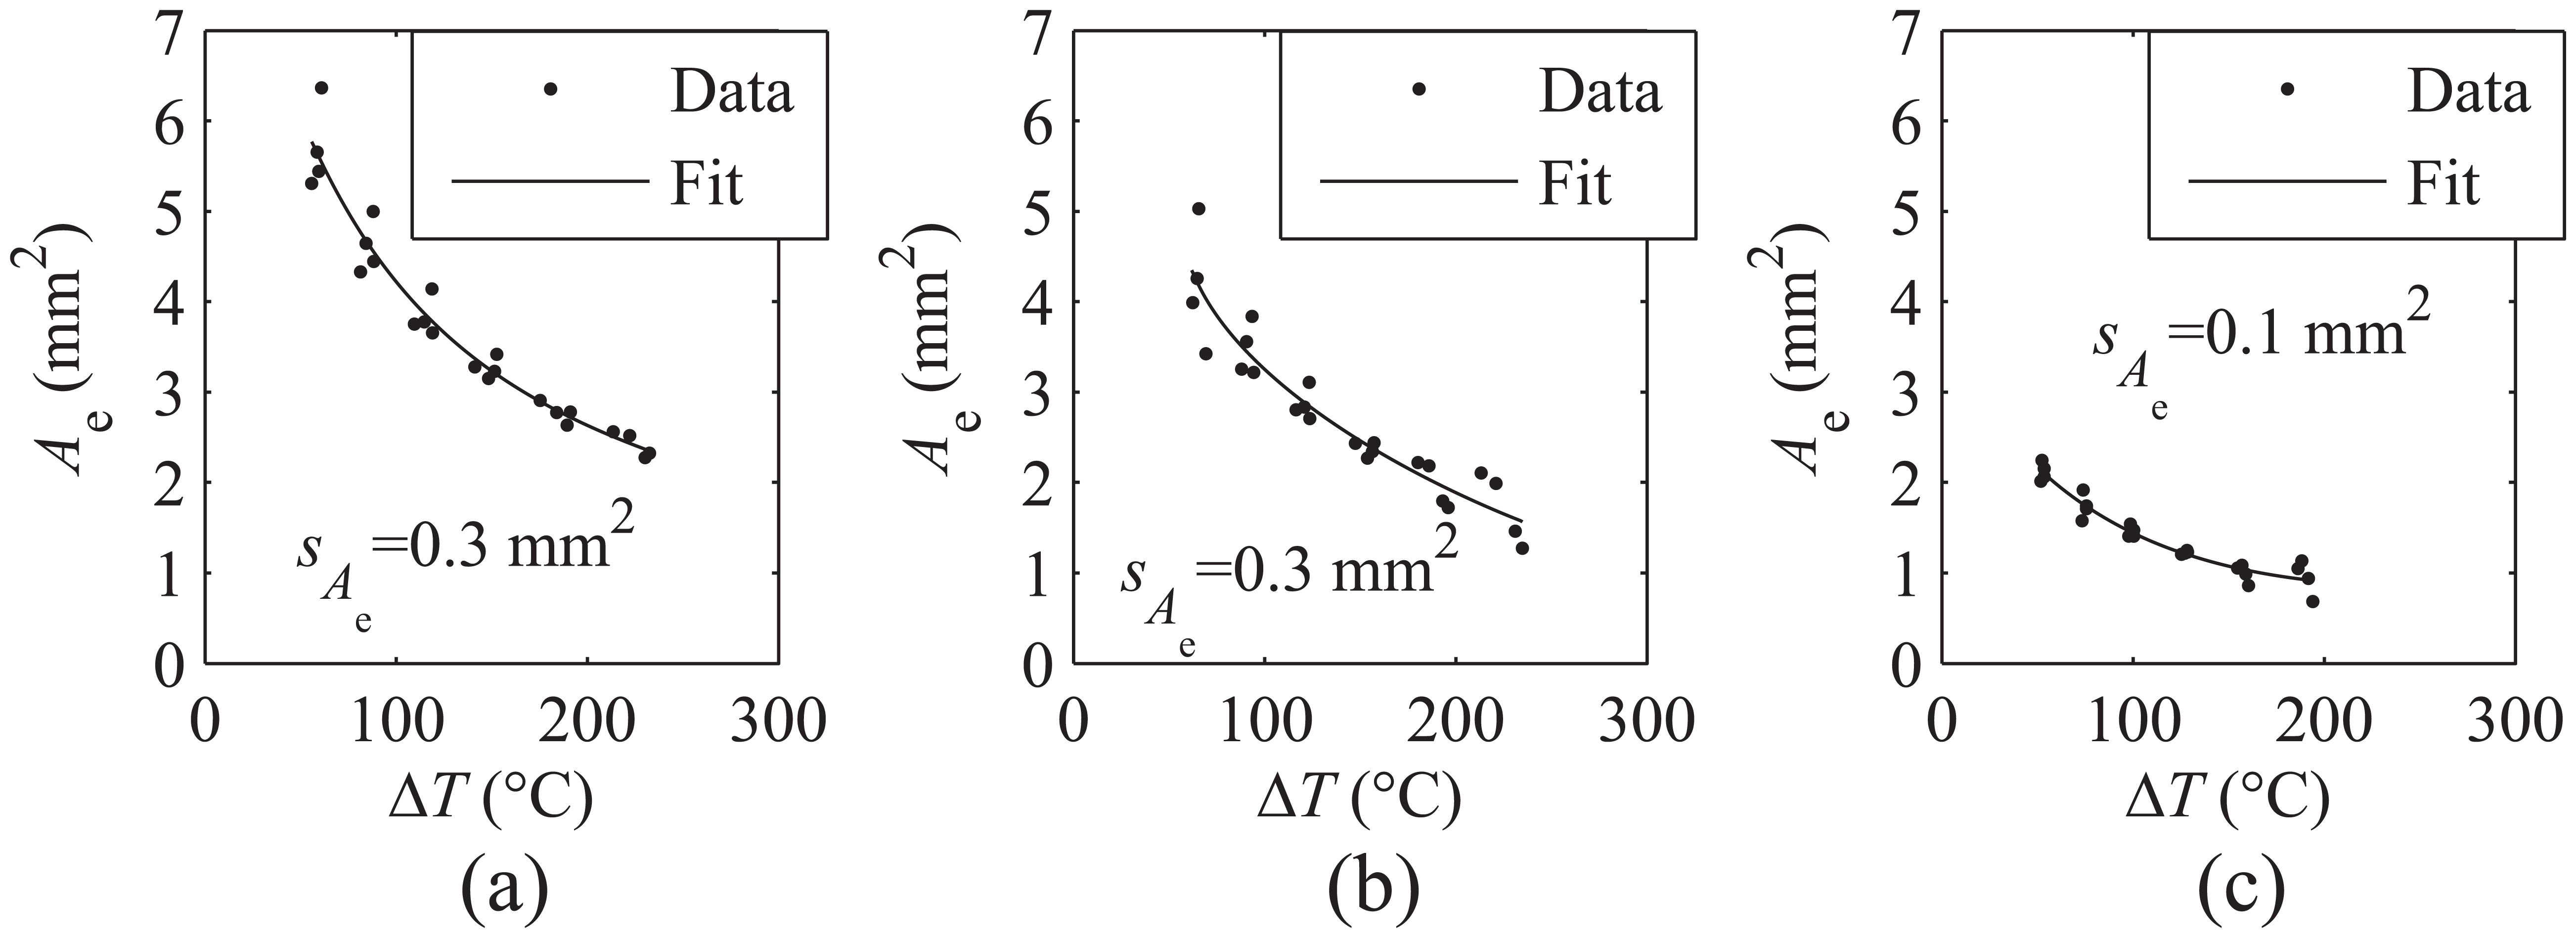
Measurement data and the corresponding second-order exponential fit used to calculate the effective area for each sensor: (a) sensor 1, (b) sensor 2, and (c) sensor 3.
Measurement cases
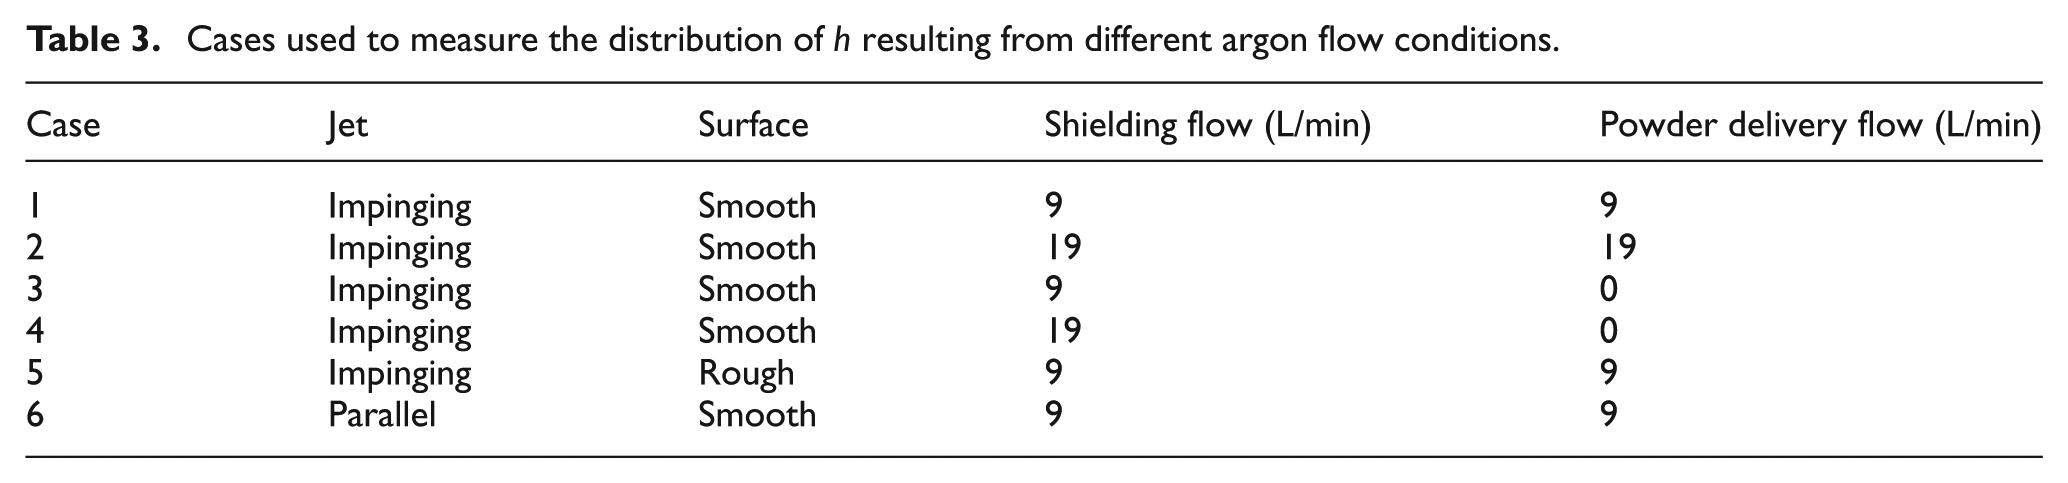
Table 3 presents the hot-film constant voltage anemometry measurement cases, and Figure 7 illustrates the different measurement setups used to map the convection generated by the deposition head. Powder is not included during these hot-film measurements because its abrasive nature could deteriorate the nickel element, changing its resistance and affecting the calculation of the coefficient of convection according to equation (10).
Cases used to measure the distribution of
Illustrations of the experimental setups: (a) the distribution of
The hot-film measurement method is used to map the distribution of
In case 5, Shurtape® anti-skid tread tape is applied to the plexiglass substrate to simulate the rough surface typically produced in a powder-based deposition. Figure 8 shows the similarity of a powder-clad surface
11
and the tread tape. The roughness of these two surfaces was measured by Gouge et al.
39
using optical profilometry. The roughness average (
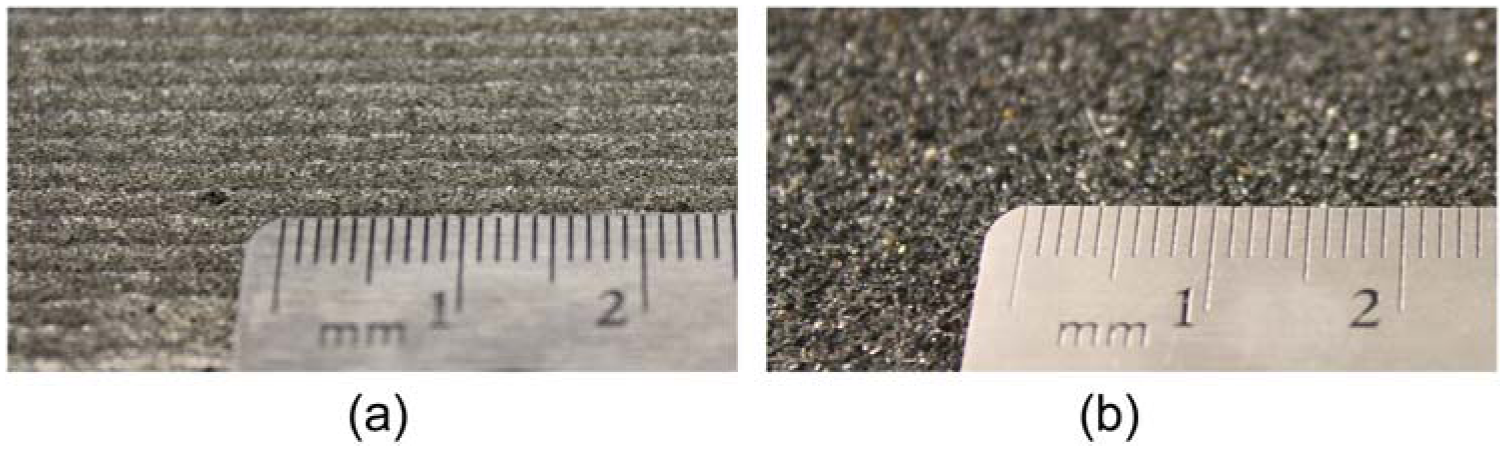
Images of (a) the clad surface produced in Heigel et al. 11 using a laser power of 2.5 kW, a travel speed of 10.6 mm/s, a hatch spacing of 2 mm, and a powder flow delivery rate of 19 g/min and (b) the Shurtape® anti-skid tread tape that is applied to the surface around the sensor to approximate the clad surface.
In case 6, the distribution of
Comparison with the lumped capacitance method
Modified lumped capacitance measurements are performed, using copper and aluminum plates, to verify the hot-film measurement method. Both argon flows are used to create an impinging jet to cool the plates, and the rate of each flow is 9 L/min. Each plate is heated to a temperature greater than 100 °C and then placed on an insulated fixture under the deposition head, as shown in Figure 9. Measurements are made with and without the inclusion of powder in the flow to determine its impact on the measurement of the average coefficient of convection.
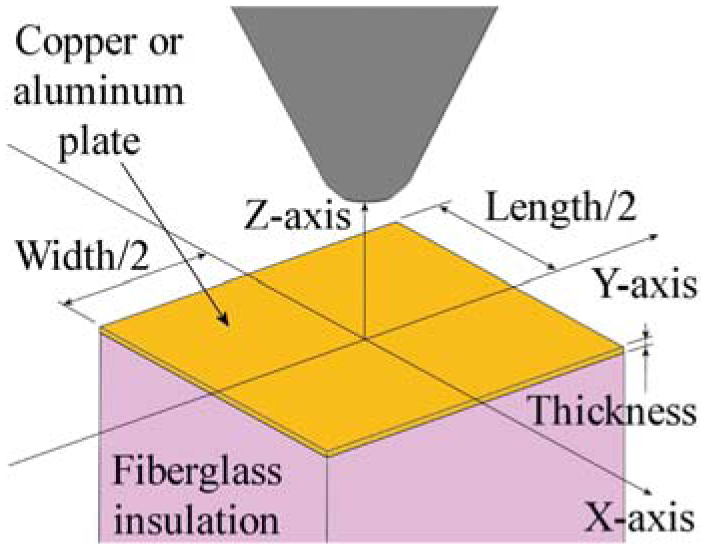
Illustration of the modified lumped capacitance method.
Effect of metal powder in the flow
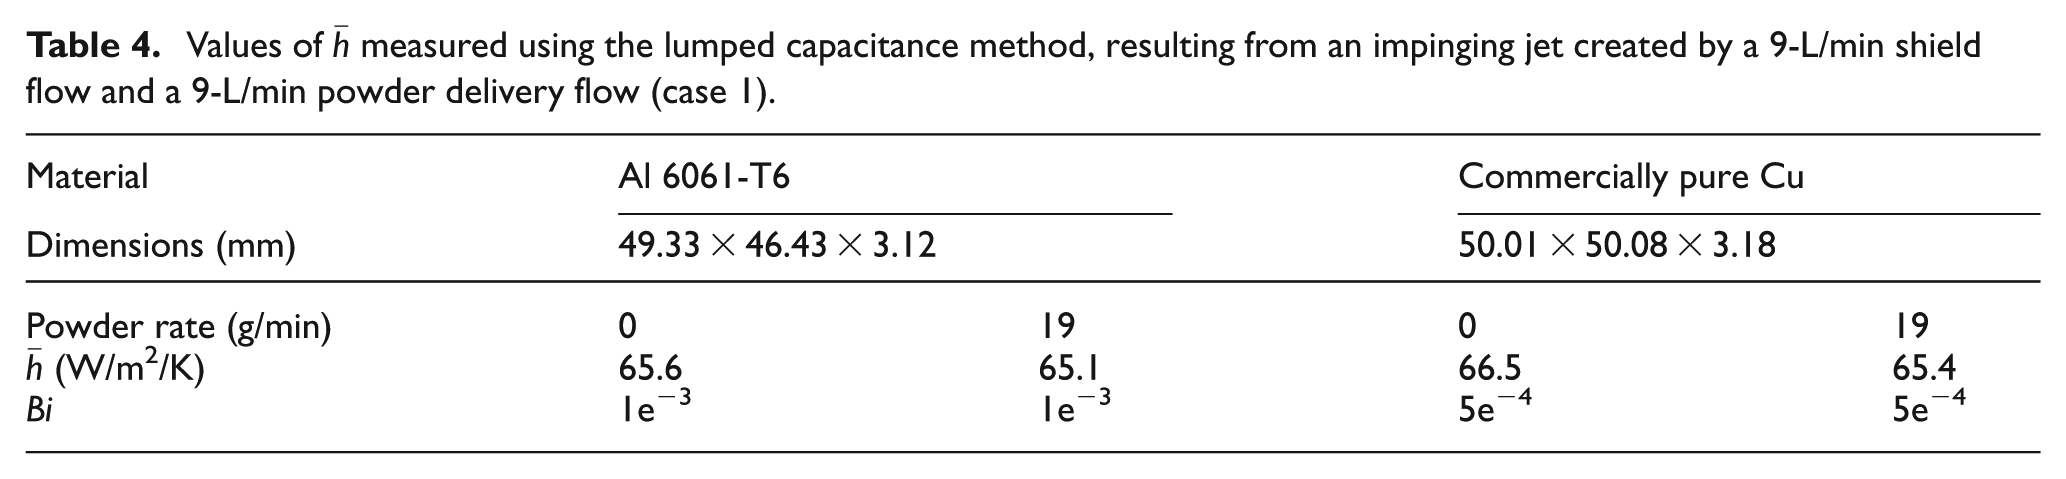
It is necessary to determine the impact of powder on the coefficient of convection because it cannot be used during the hot-film anemometry measurements. Table 4 presents the average coefficient of convection (
Values of
Comparison between the methods
The surface convection resulting from an impinging jet is characterized by taking measurements at discrete points on the X- and Y-axes. By compiling these individual measurements, the distribution of the coefficient of convection can be compared to the average coefficient of convection measured using the lumped capacitance method. Figure 10 presents the hot-film measurement results from case 1 in which both the shielding and powder delivery argon jets impinge upon the substrate at a rate of 9 L/min. Figure 9 shows that
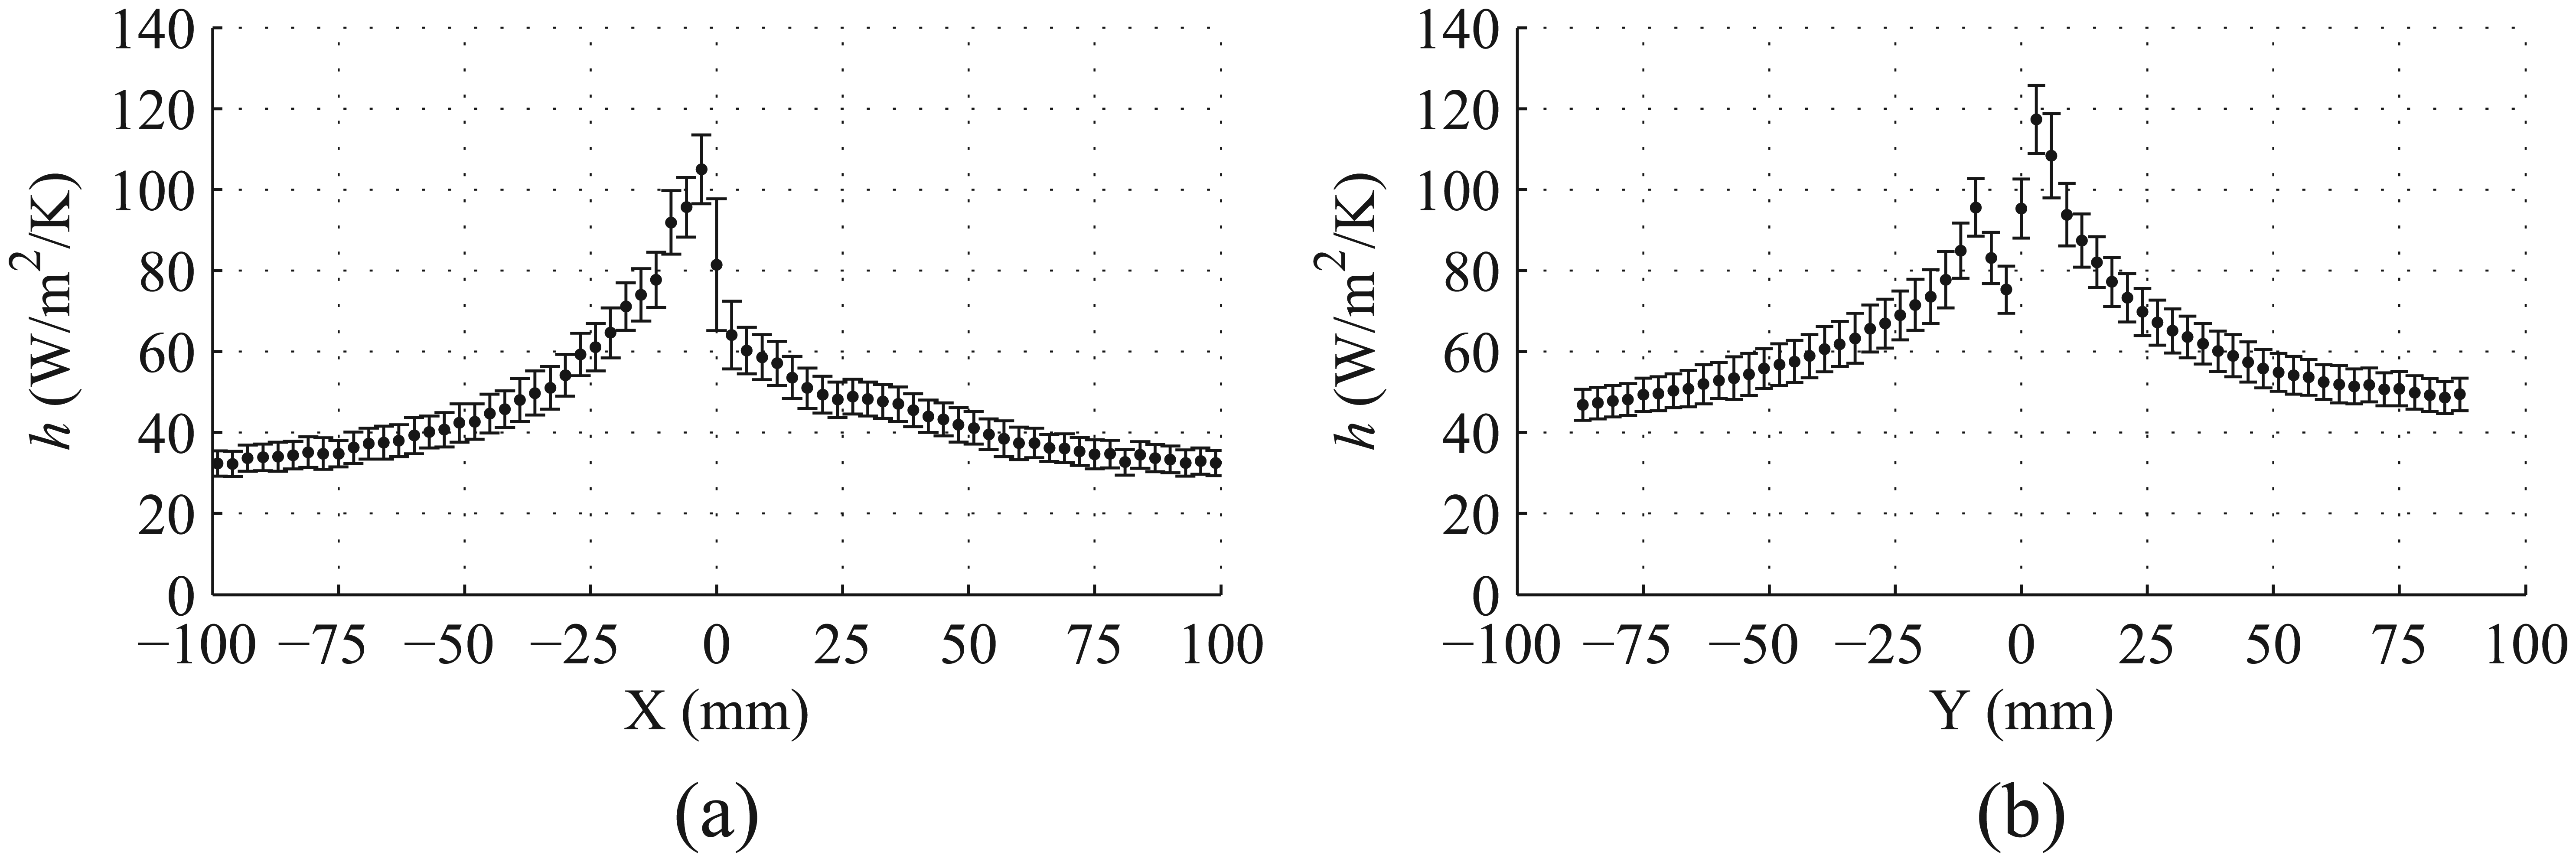
Results from case 1 in which the shielding and powder delivery jet impinge upon the substrate. The rate of each flow is 9 L/min. Measurements are performed in 3-mm increments along (a) the X-axis and (b) the Y-axis.
The hot-film measurement results are compared to those obtained using the lumped capacitance method. To make this comparison, the average coefficient of convection (
Measurement results and discussion
The impact of flow rate on convection is investigated by first comparing the two cases along the X-axis with different argon flow rates supplying each jet. Figure 11 compares the results measured in case 1 with those obtained in case 2, in which both the shielding and powder delivery argon jets impinge upon the substrate at a rate of 19 L/min. This flow rate is approximately twice the flow rate used in case 1. The value of
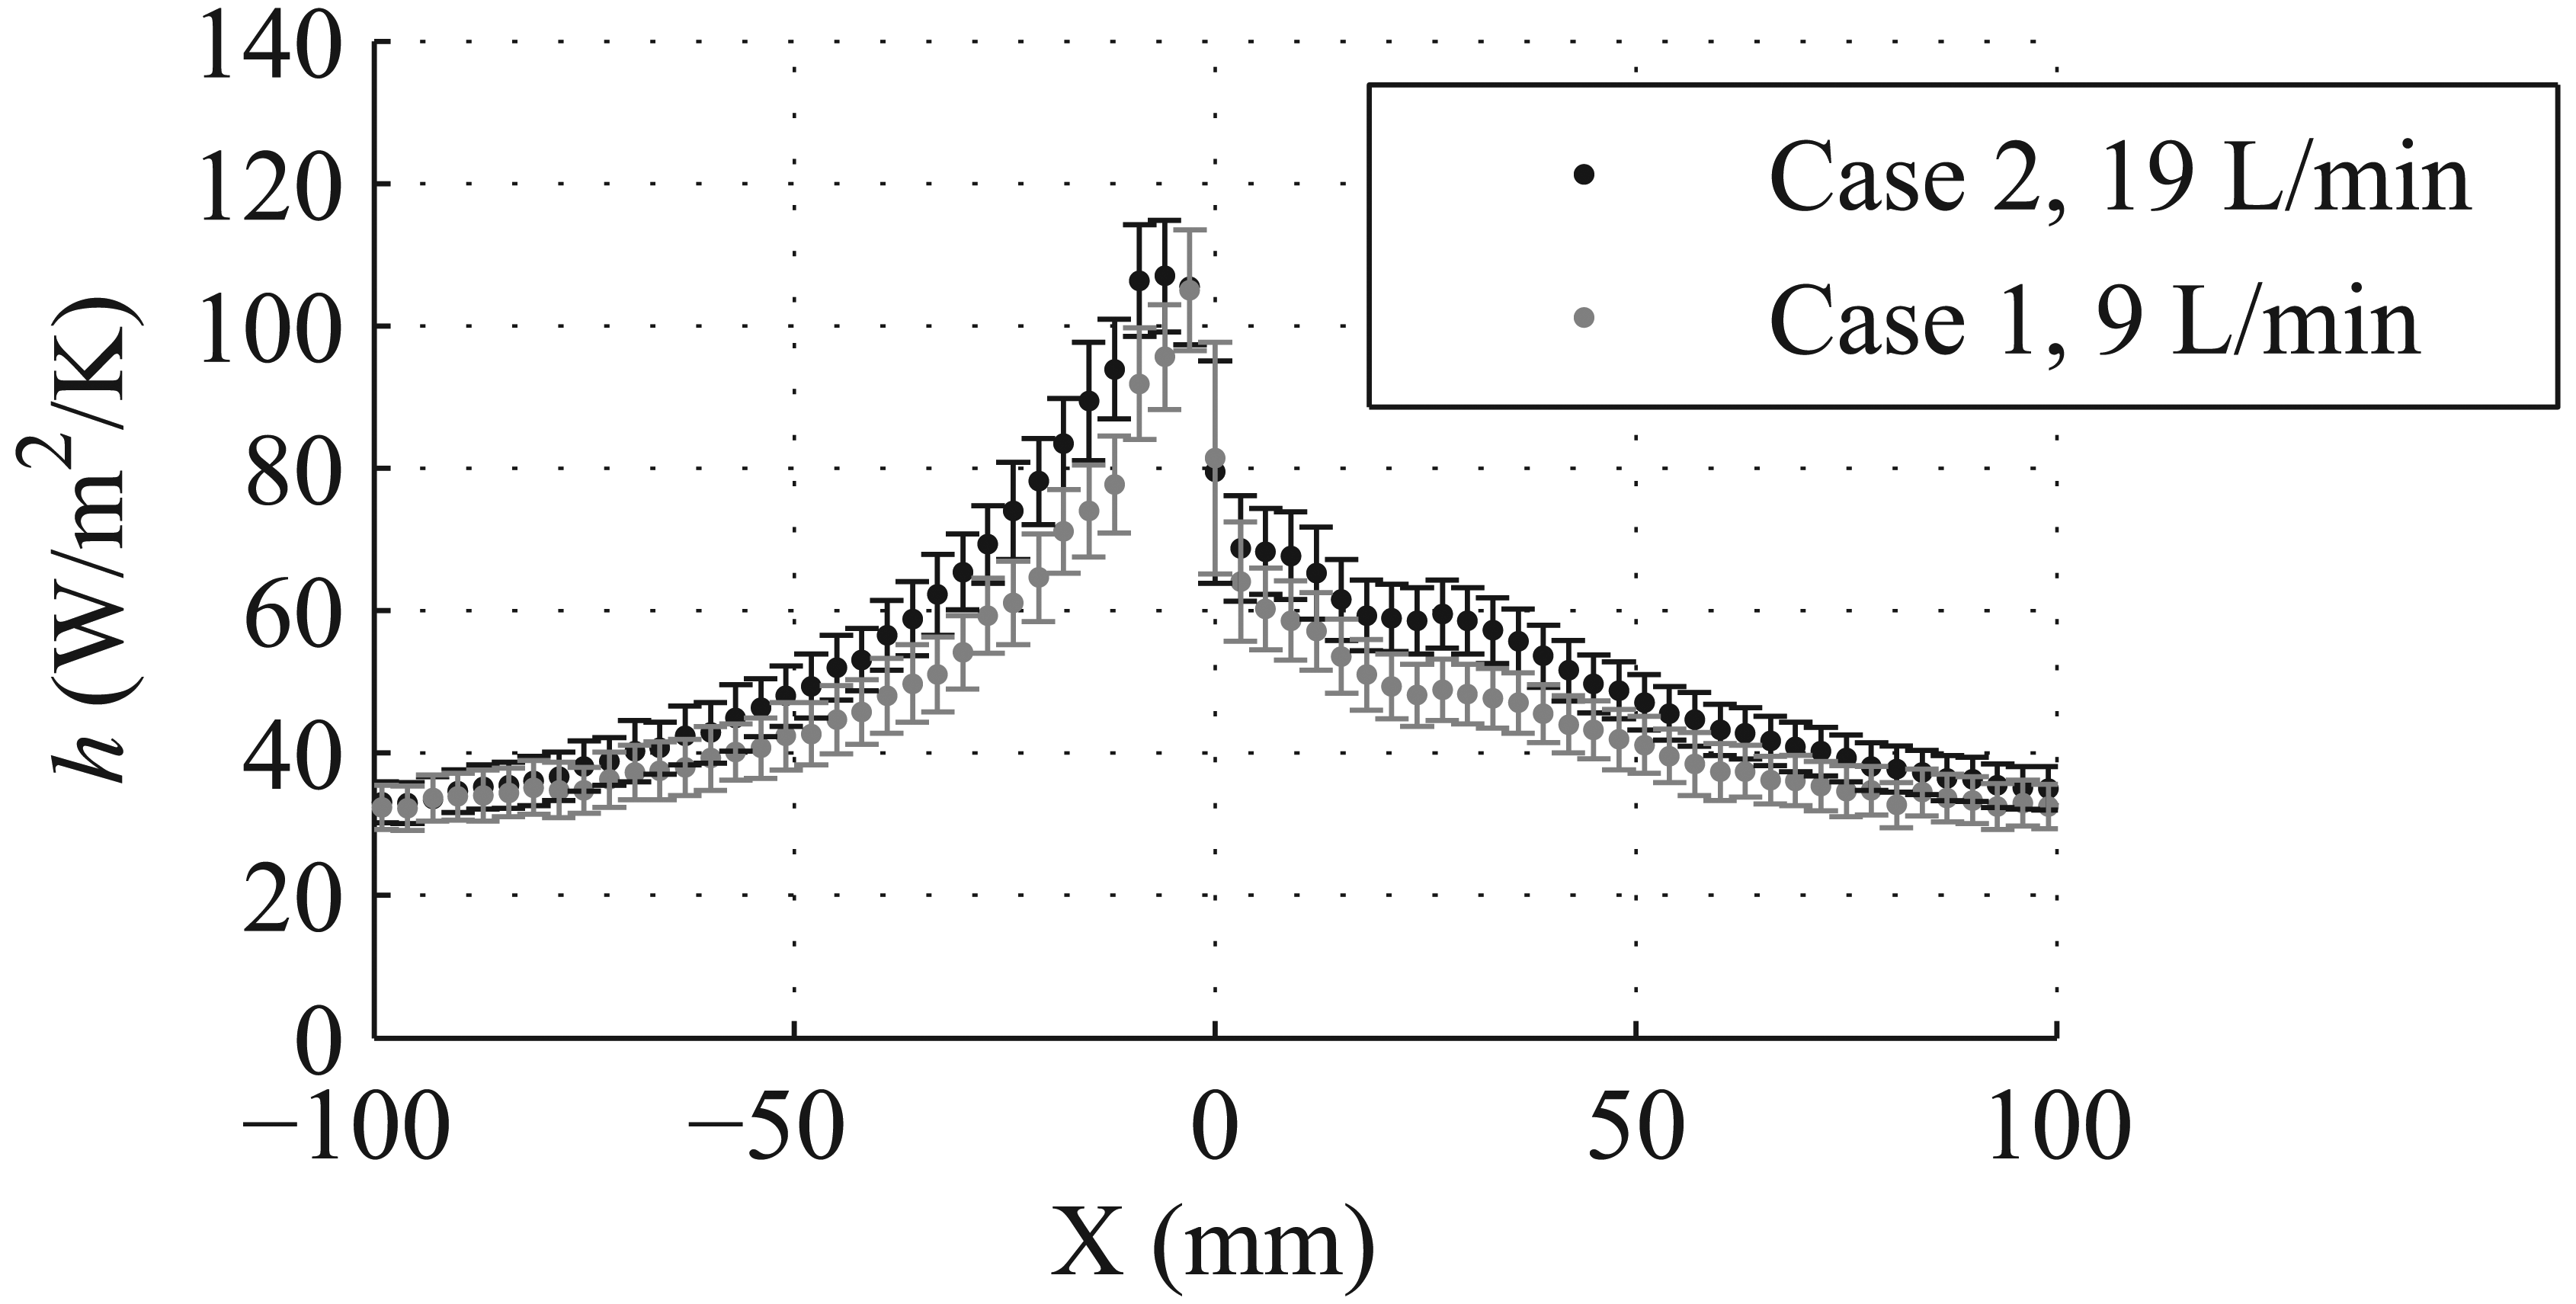
Comparison of the convection generated by two different flow rates for each argon flow.
Increasing the flow rate supplying each jet has little effect on the convection generated by the deposition head. Figure 11 shows that increasing the rate of each flow from 9 L/min in case 1 to 19 L/min in case 2 increases the maximum measured value of
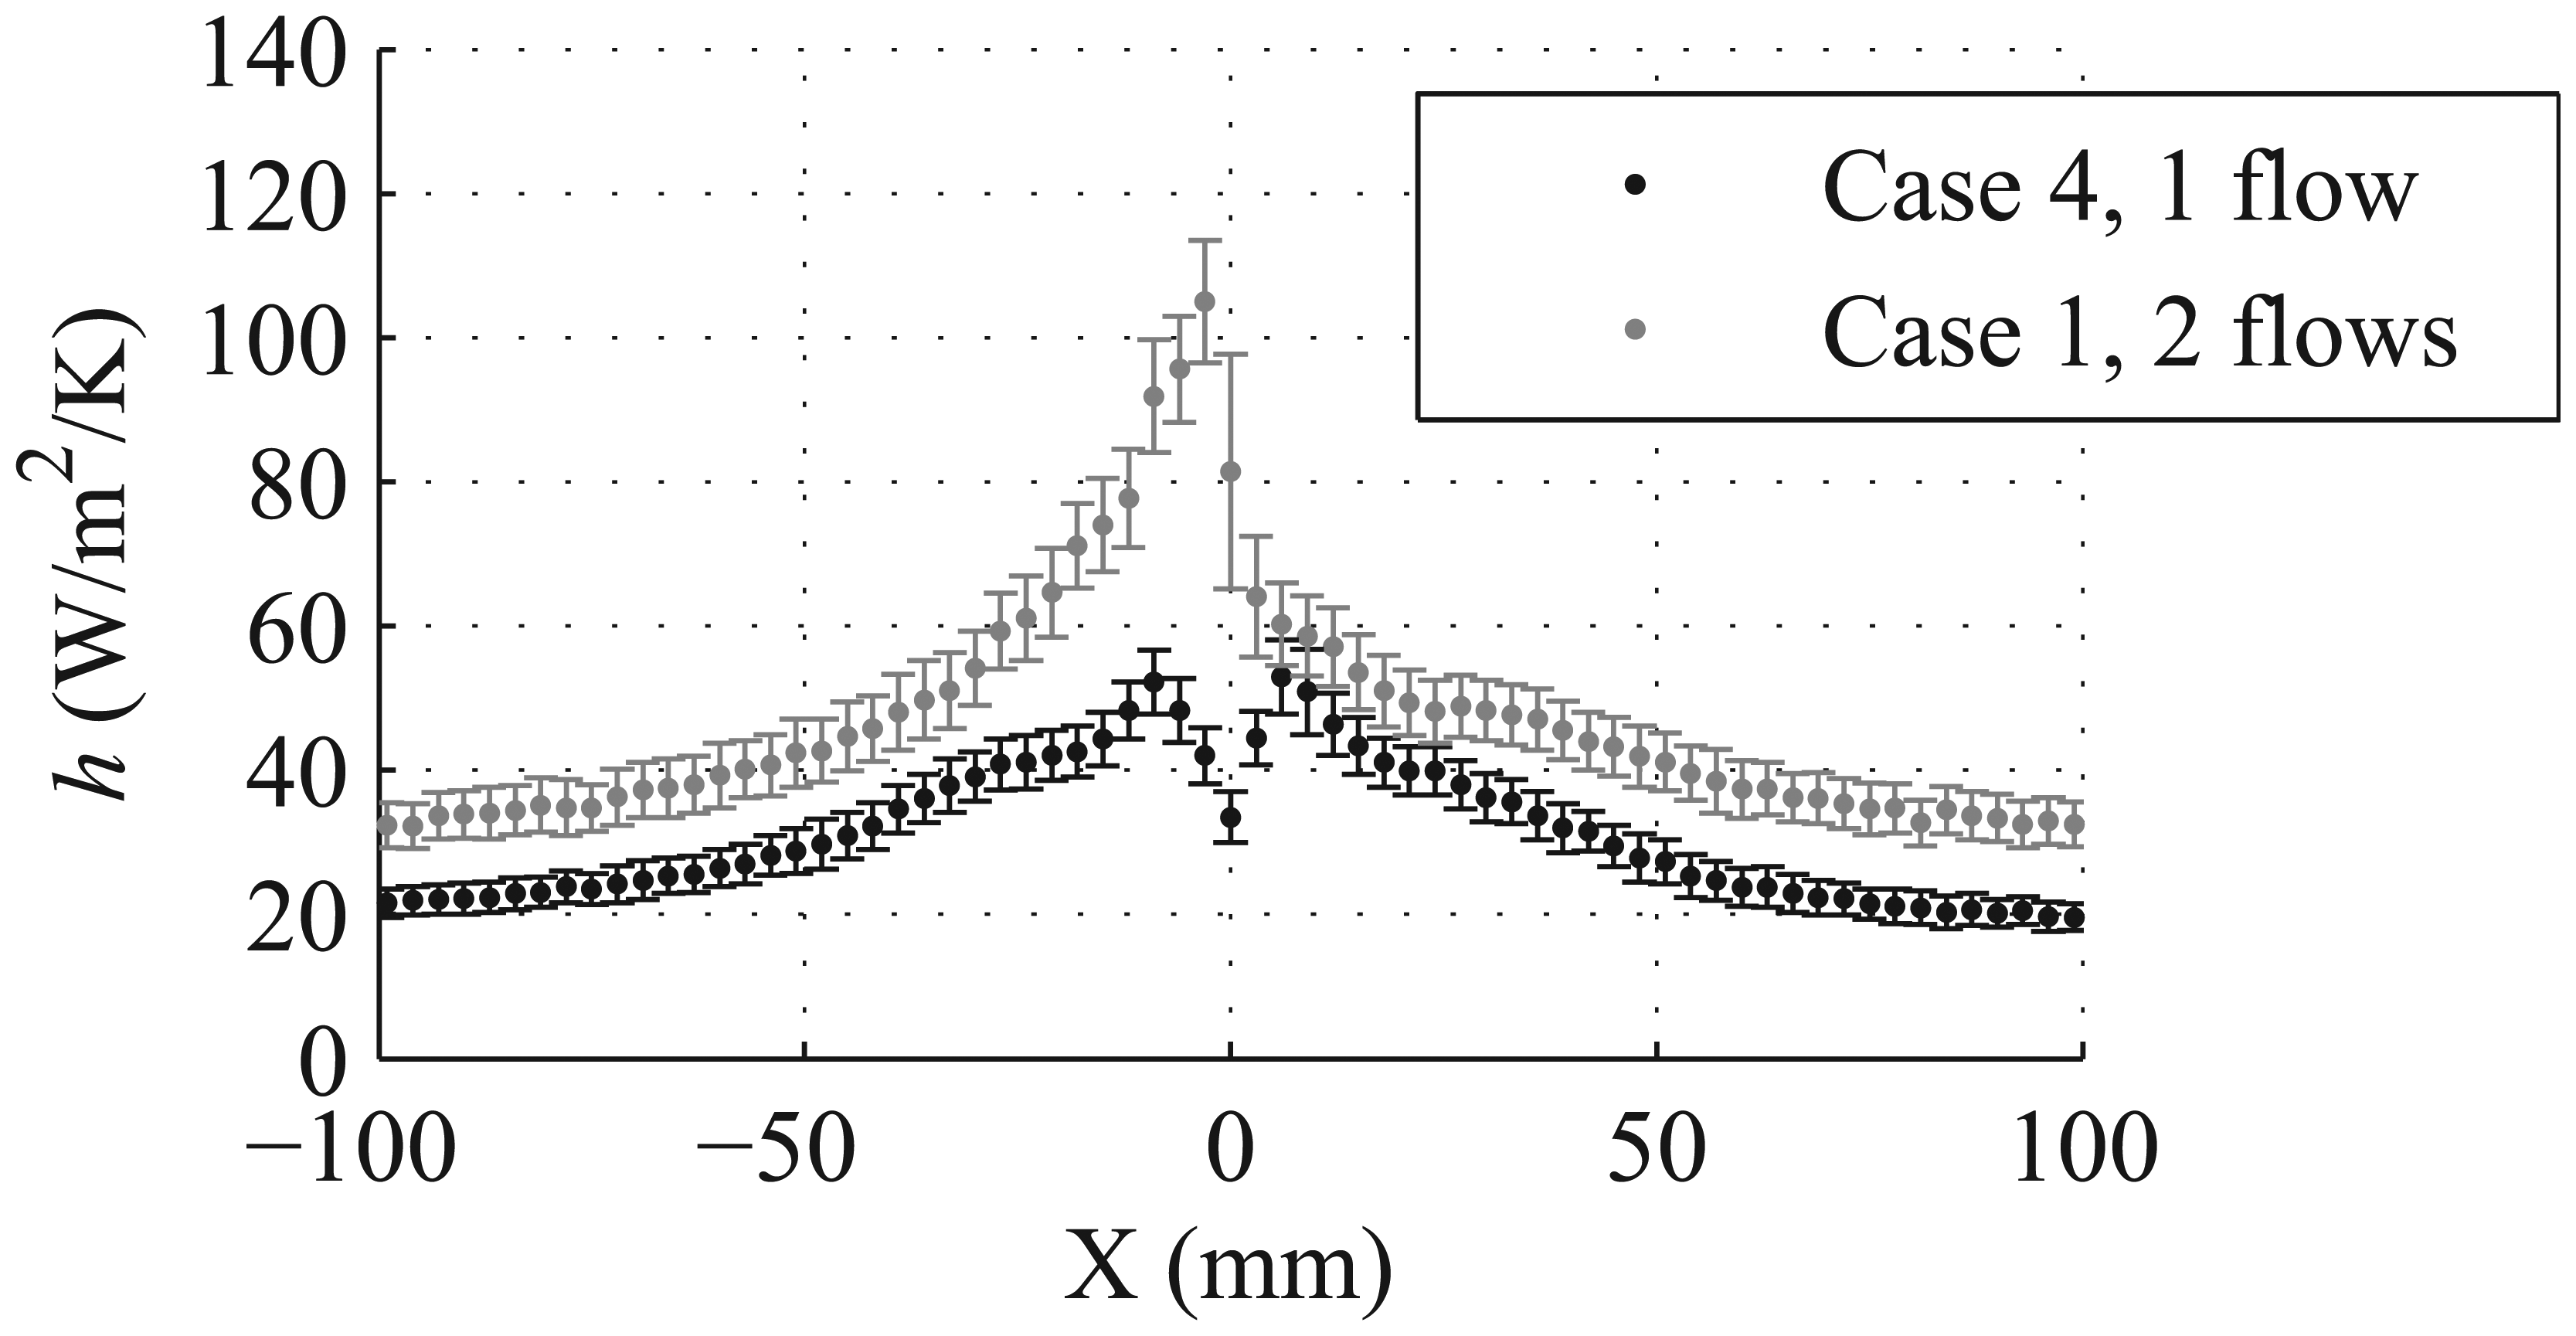
Figure 12 presents the results from cases 3 and 4 in which only the shielding jet impinges upon the substrate at a rate of 9 and 19 L/min, respectively. In case 3, two local maxima with values of
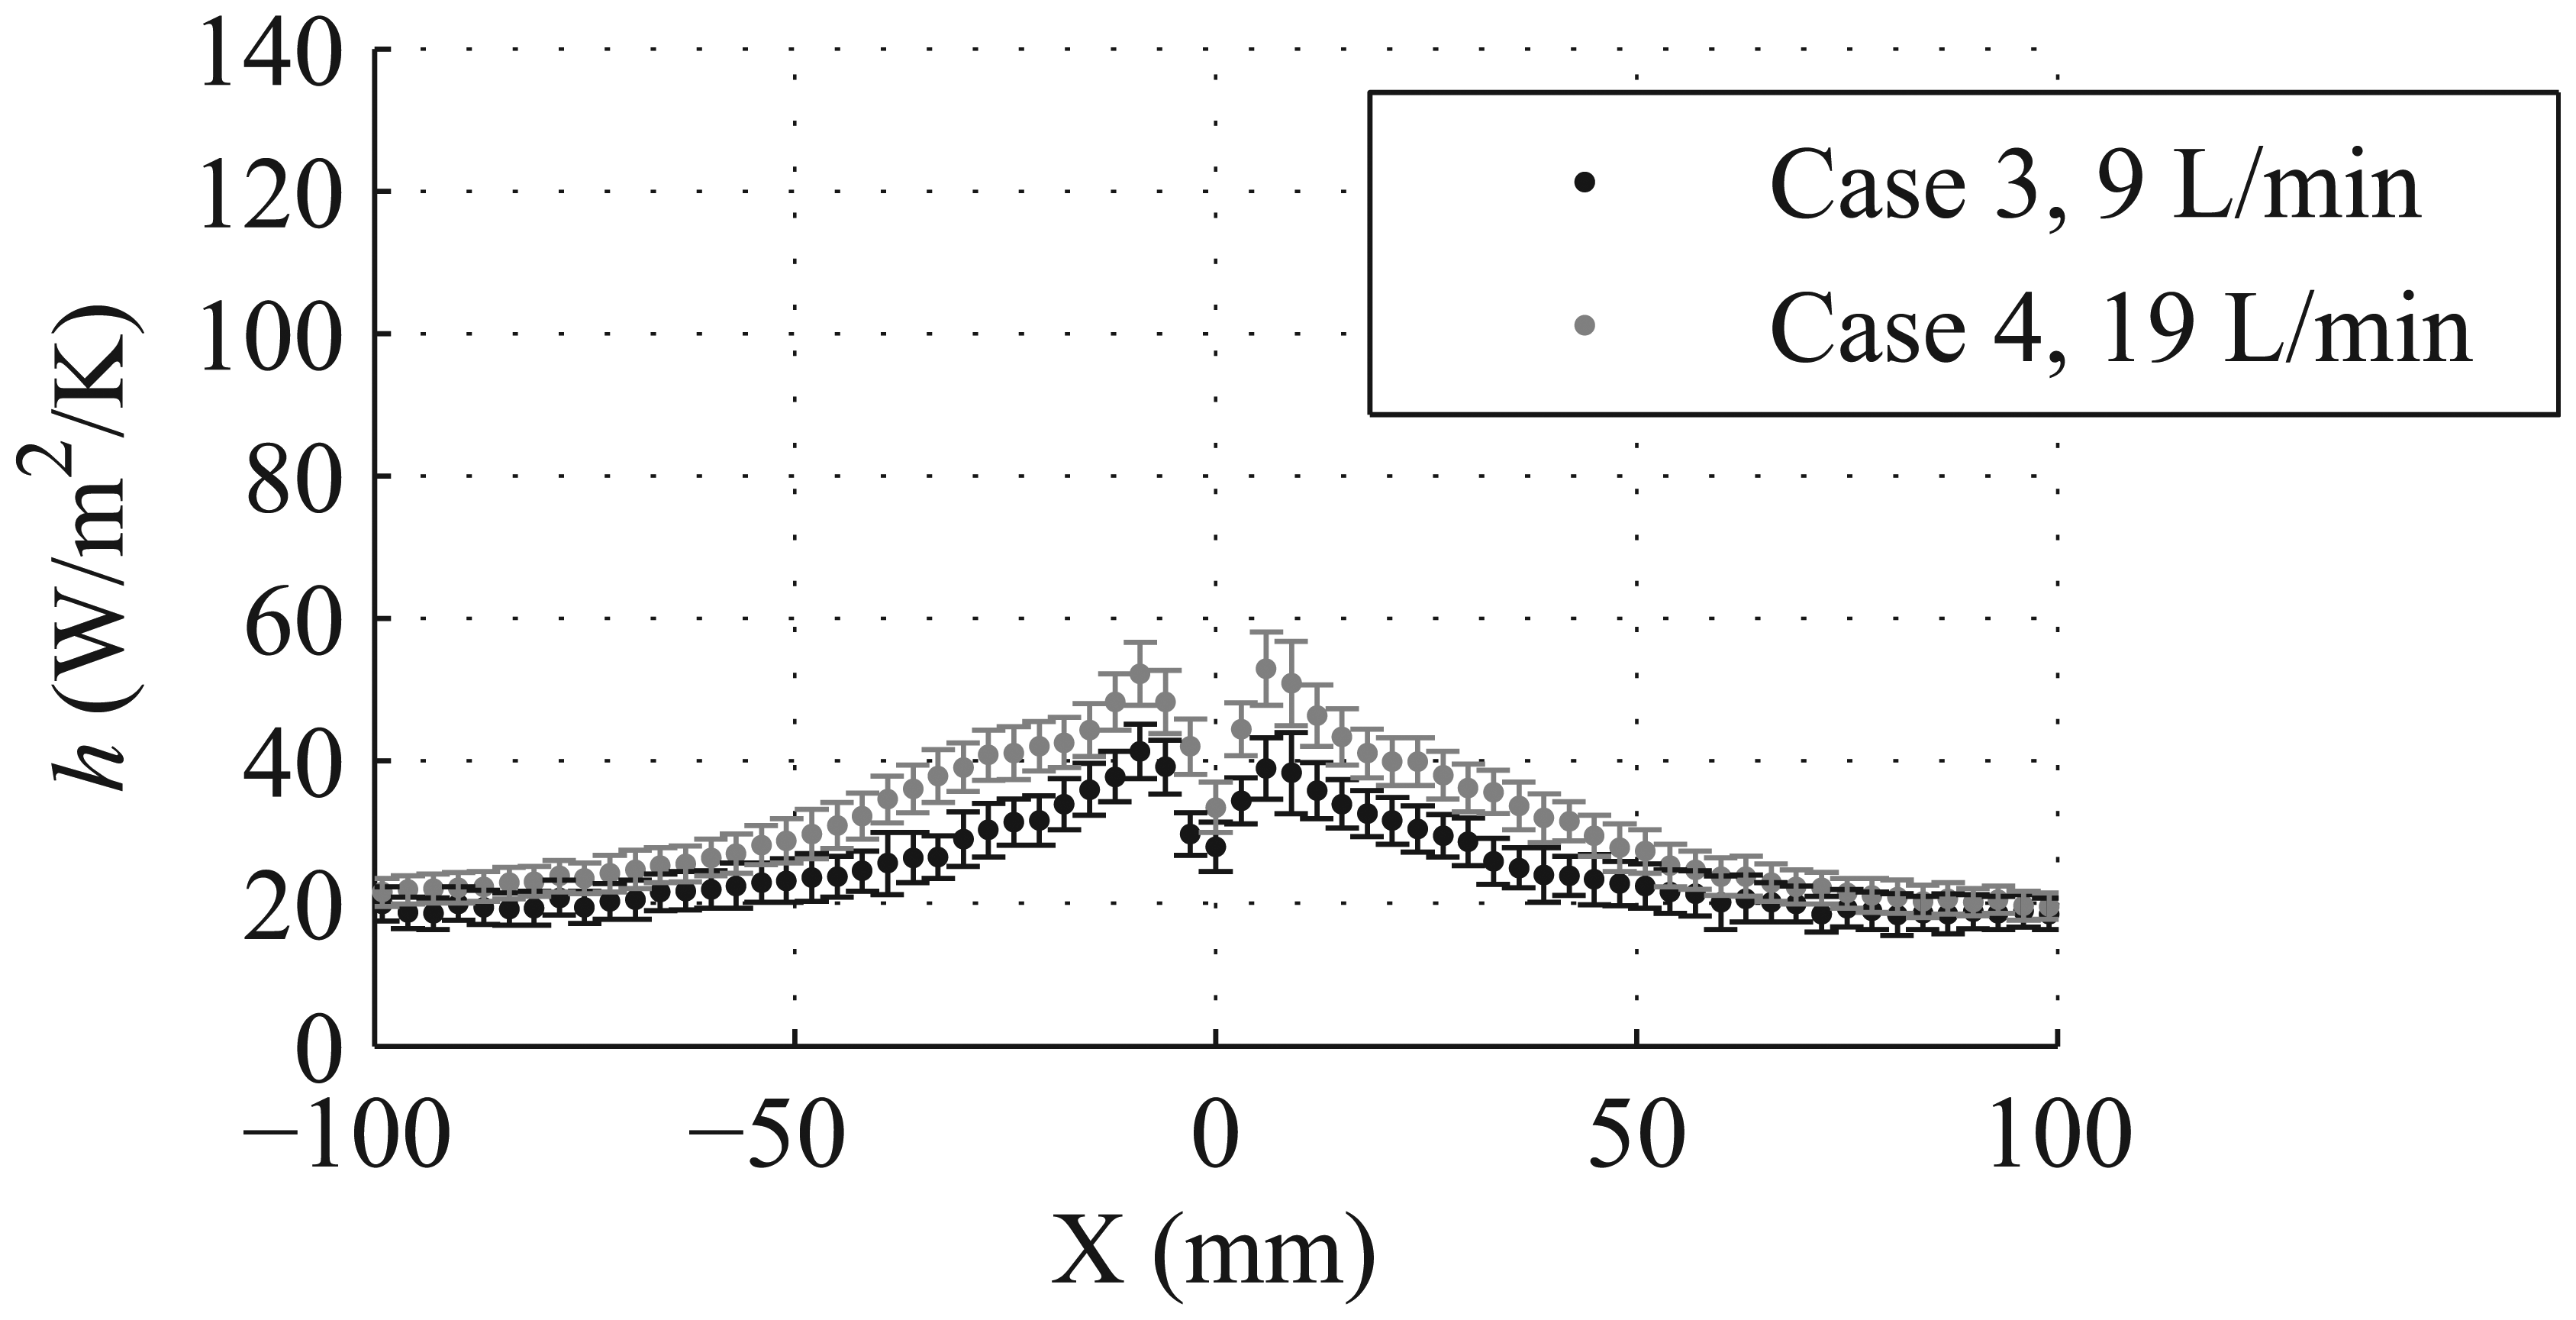
Comparison of the convection generated only by the shielding jet using different flow rates.
Increasing the rate of the shielding flow from 9 L/min in case 3 to 19 L/min in case 4 increases the values of
Figure 13 presents a comparison of the heat transfer caused by a single impinging jet compared to two coaxial impinging jets. The combined flow rate of the two jets in case 1 is 18 L/min, and the flow rate of the shielding jet in case 4 is 19 L/min. Despite these similar flow rates, the distribution of
Convection generated by both the shielding and powder delivery jets compared to the convection generated only by the shielding jet.
Although the flow rates of the shielding and powder delivery jets are the same in case 1, the average velocity of the shielding jet as it exits the inner nozzle is 1.8 m/s, whereas the average velocity of the powder delivery jet as it exits the outer nozzle is 2.3 m/s. This difference in velocity creates a shear between the jets that alters the flow structure, as shown by Hwang et al.
33
In that study, two coaxial jets with different exit velocities created vortices, so that their effect on heat transfer could be investigated. It was shown that the induced vortices could increase the rate of heat transfer on the surface. This effect explains the increased distribution of
The impact of surface roughness on convection is investigated by comparing cases 1–5, as shown in Figure 14. In each case, both argon jets impinge upon the surface at a rate of 9 L/min. In case 5, in which the surface surrounding the sensor is rough, the value of
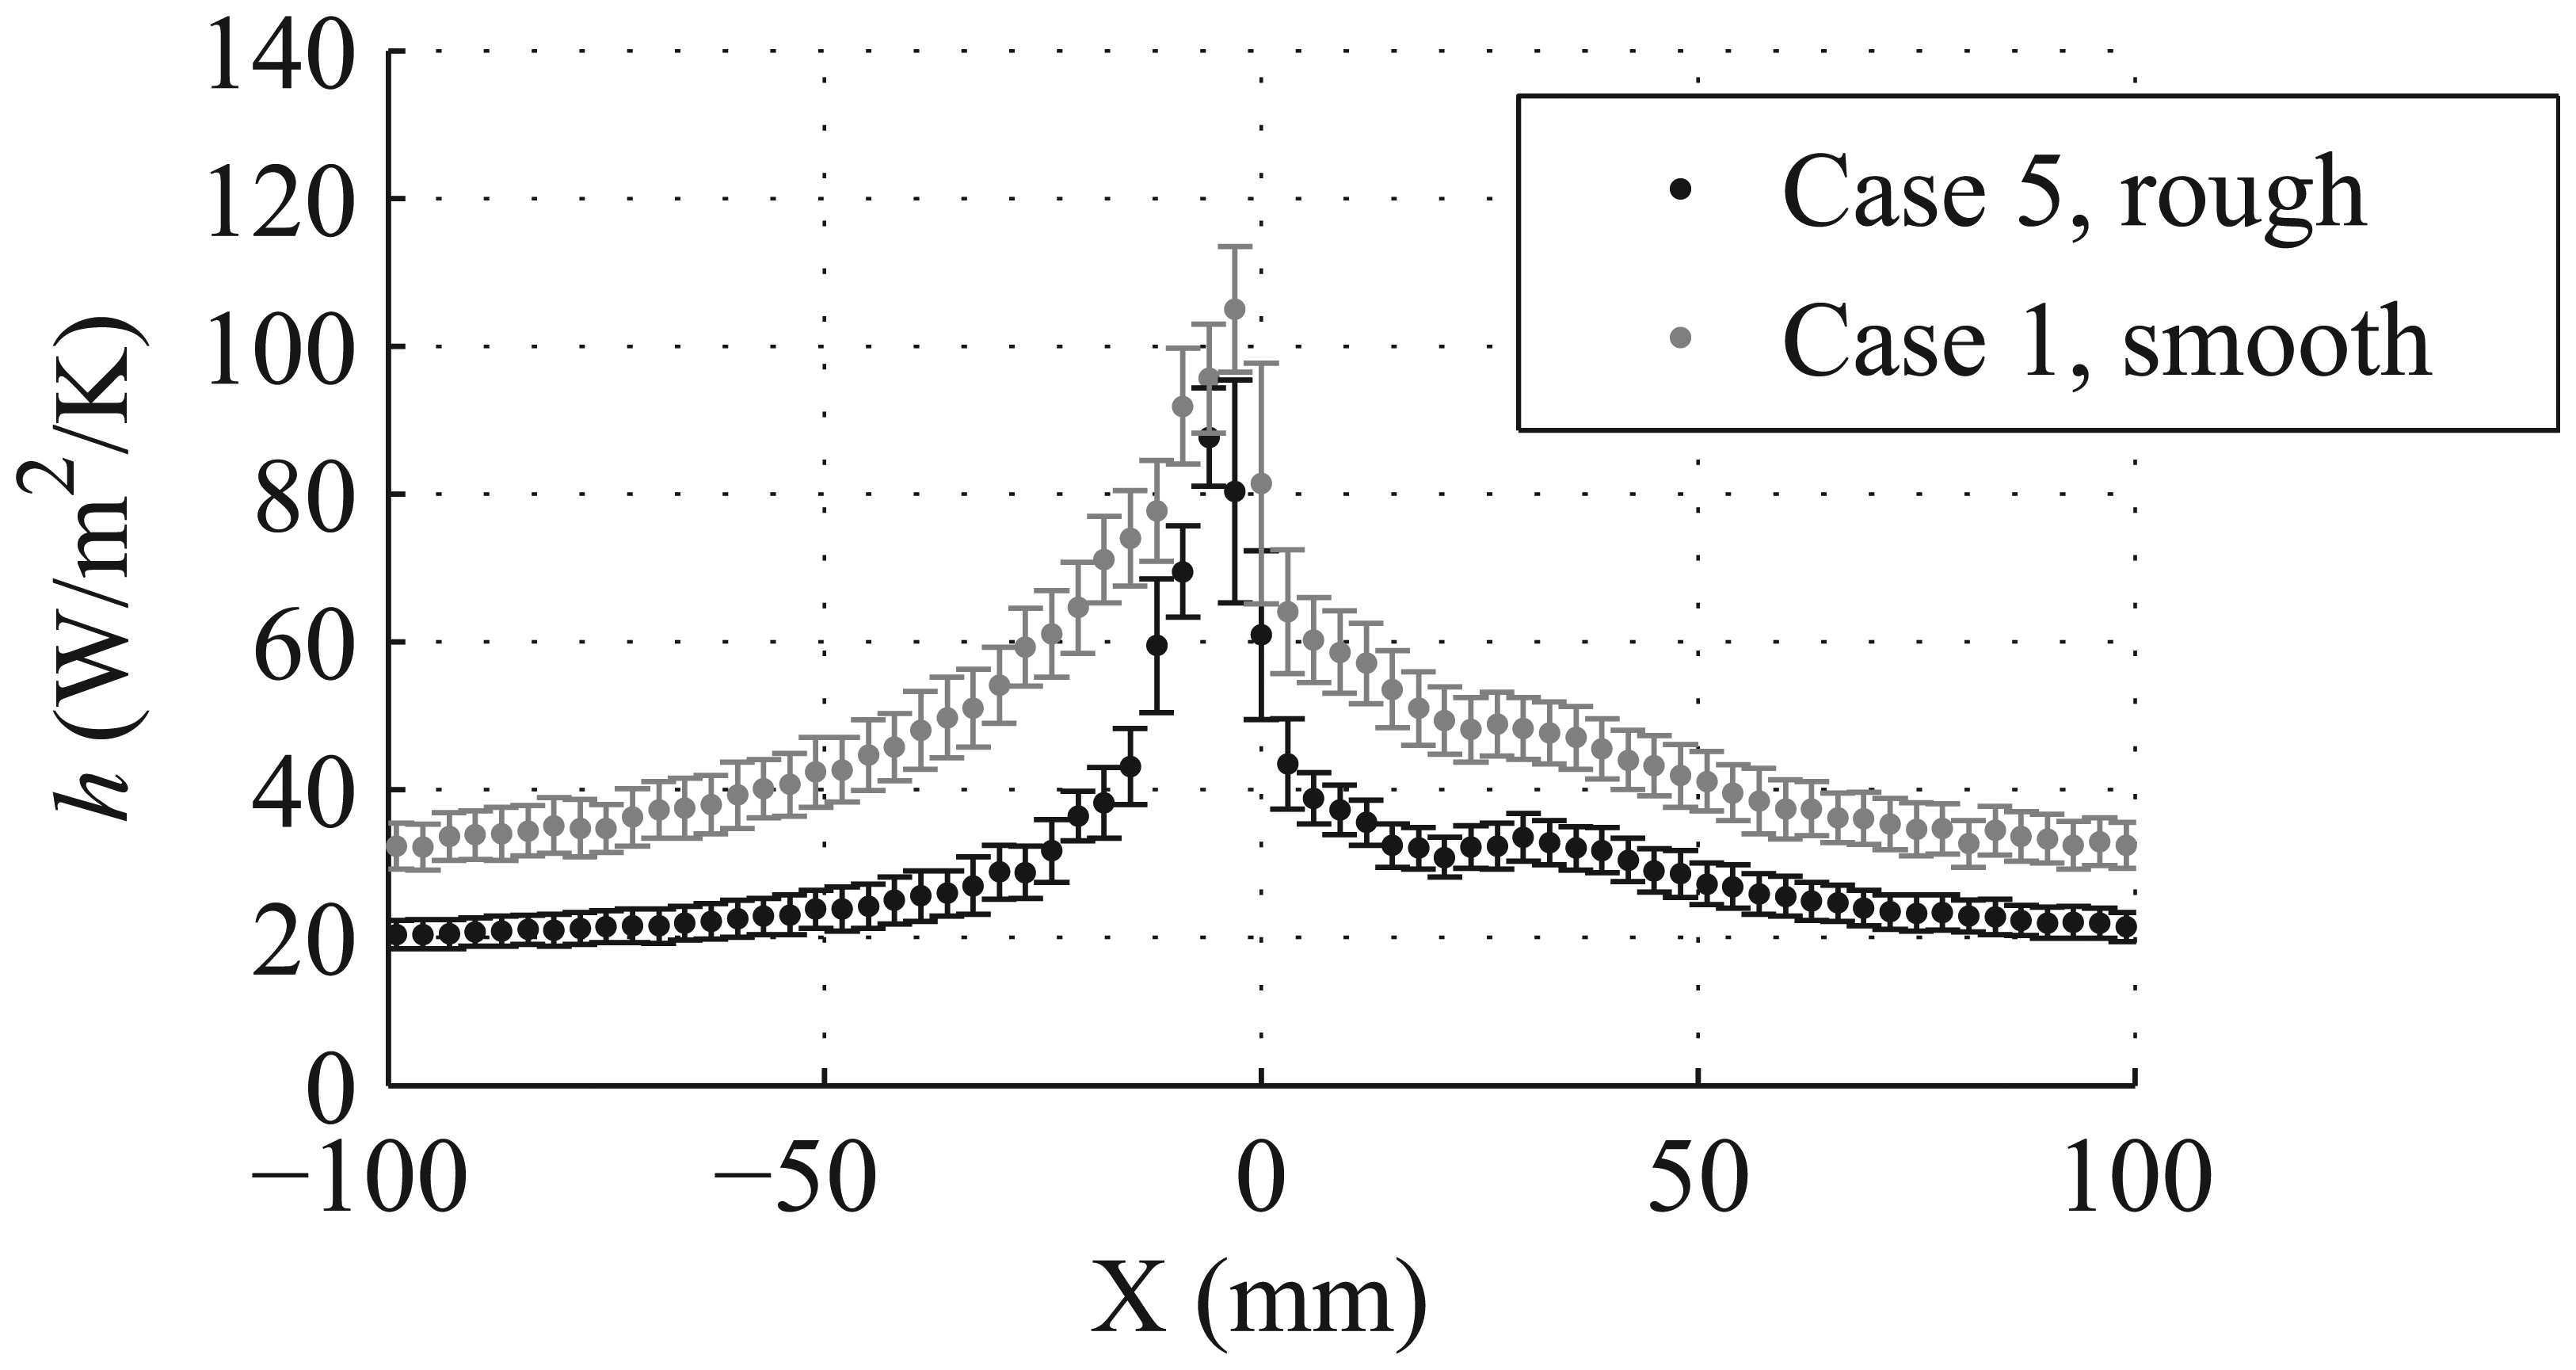
Effect of surface roughness on convection.
The distribution of convection acting on a vertical wall is found by analyzing the results of case 6. Figure 15 presents the results from case 6 in which both argon jets flow parallel to the substrate at a rate of 9 L/min. The jets flow parallel to the wall surface and are bisected by the top edge of the wall. The coefficient of convection is measured at three locations on the wall. The maximum value of
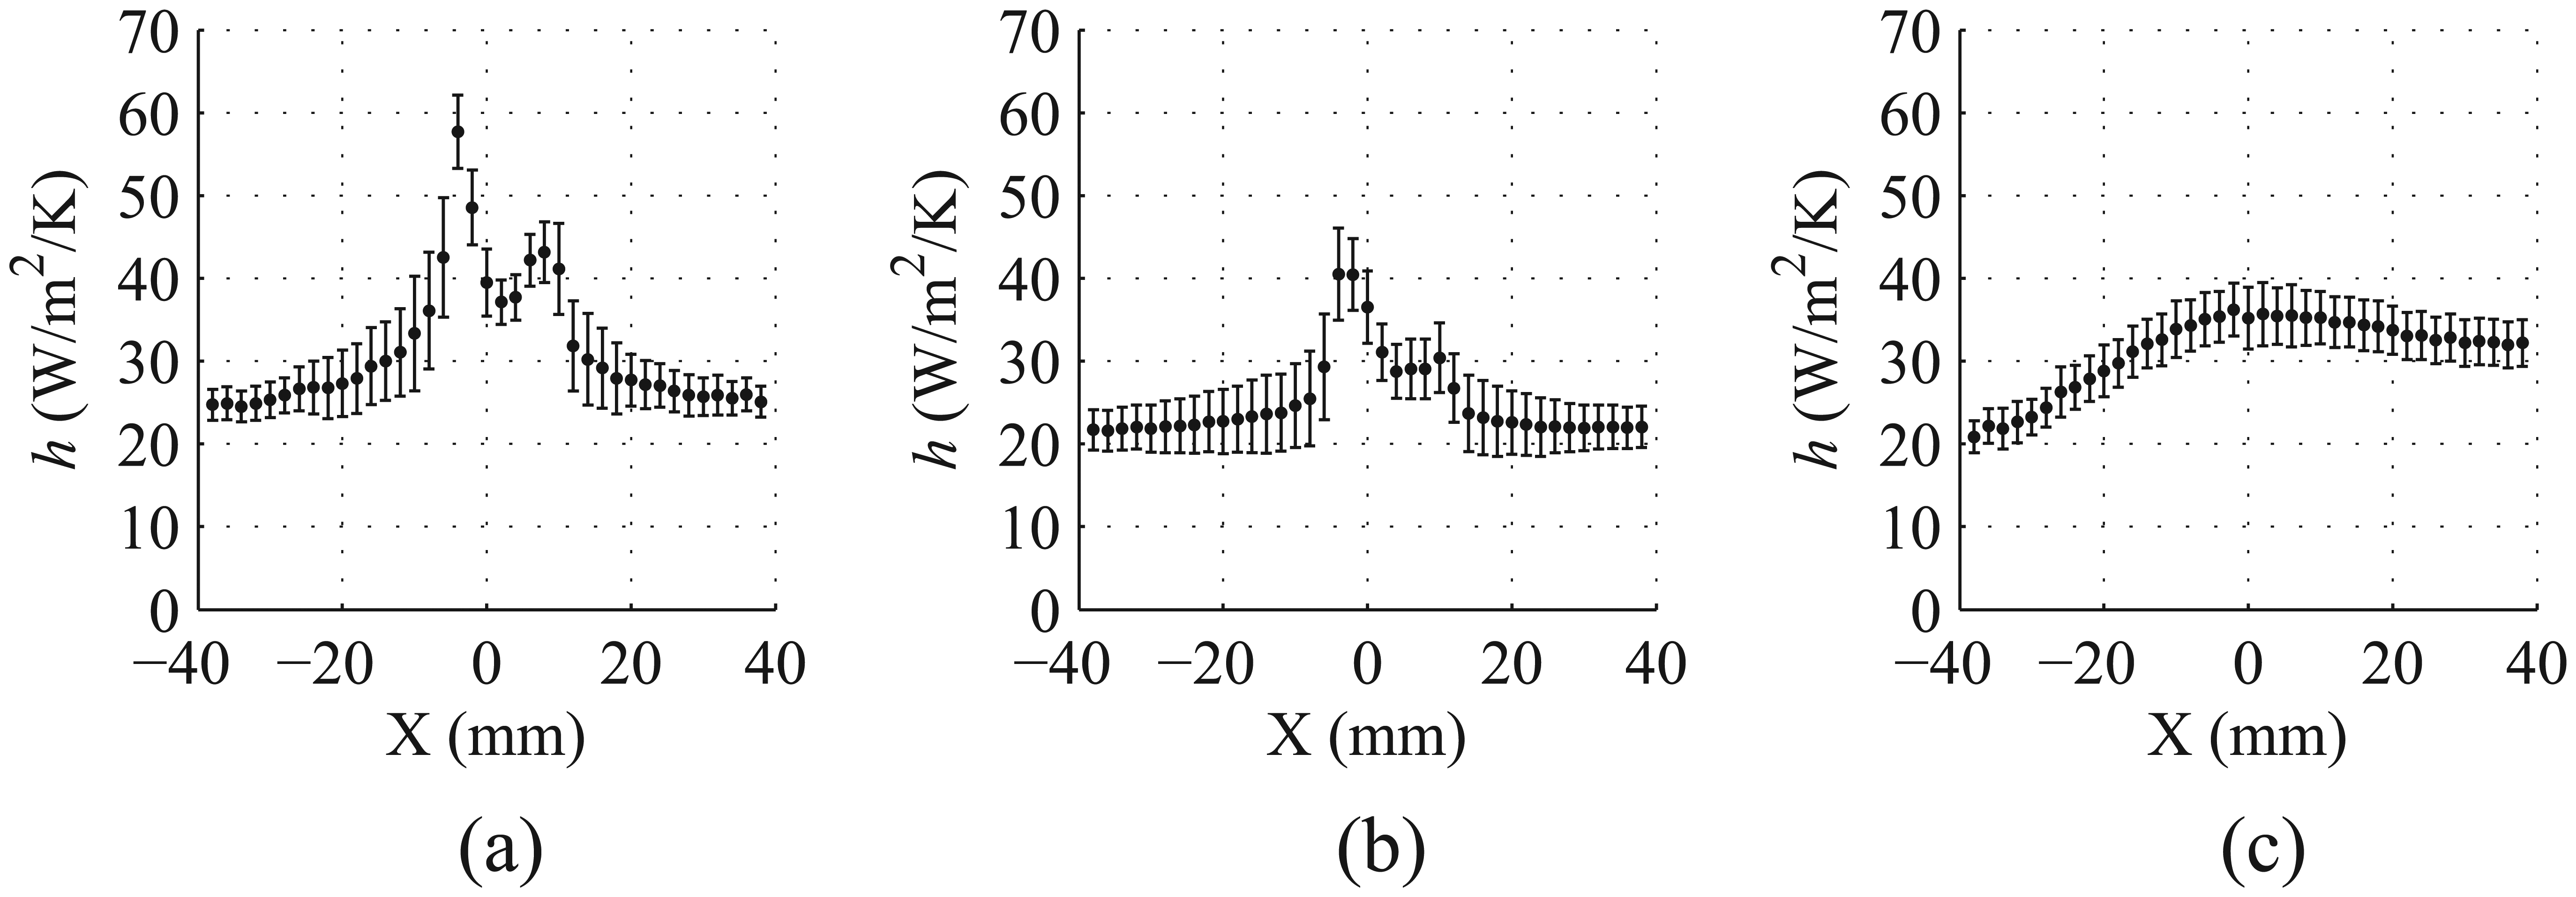
Convection acting on a vertical wall in case 6: (a) sensor 1, 0.8 mm below top edge; (b) sensor 2, 5.4 mm below top edge; and (c) sensor 3, 108.7 mm below top edge.
Figure 16 compares the distribution of
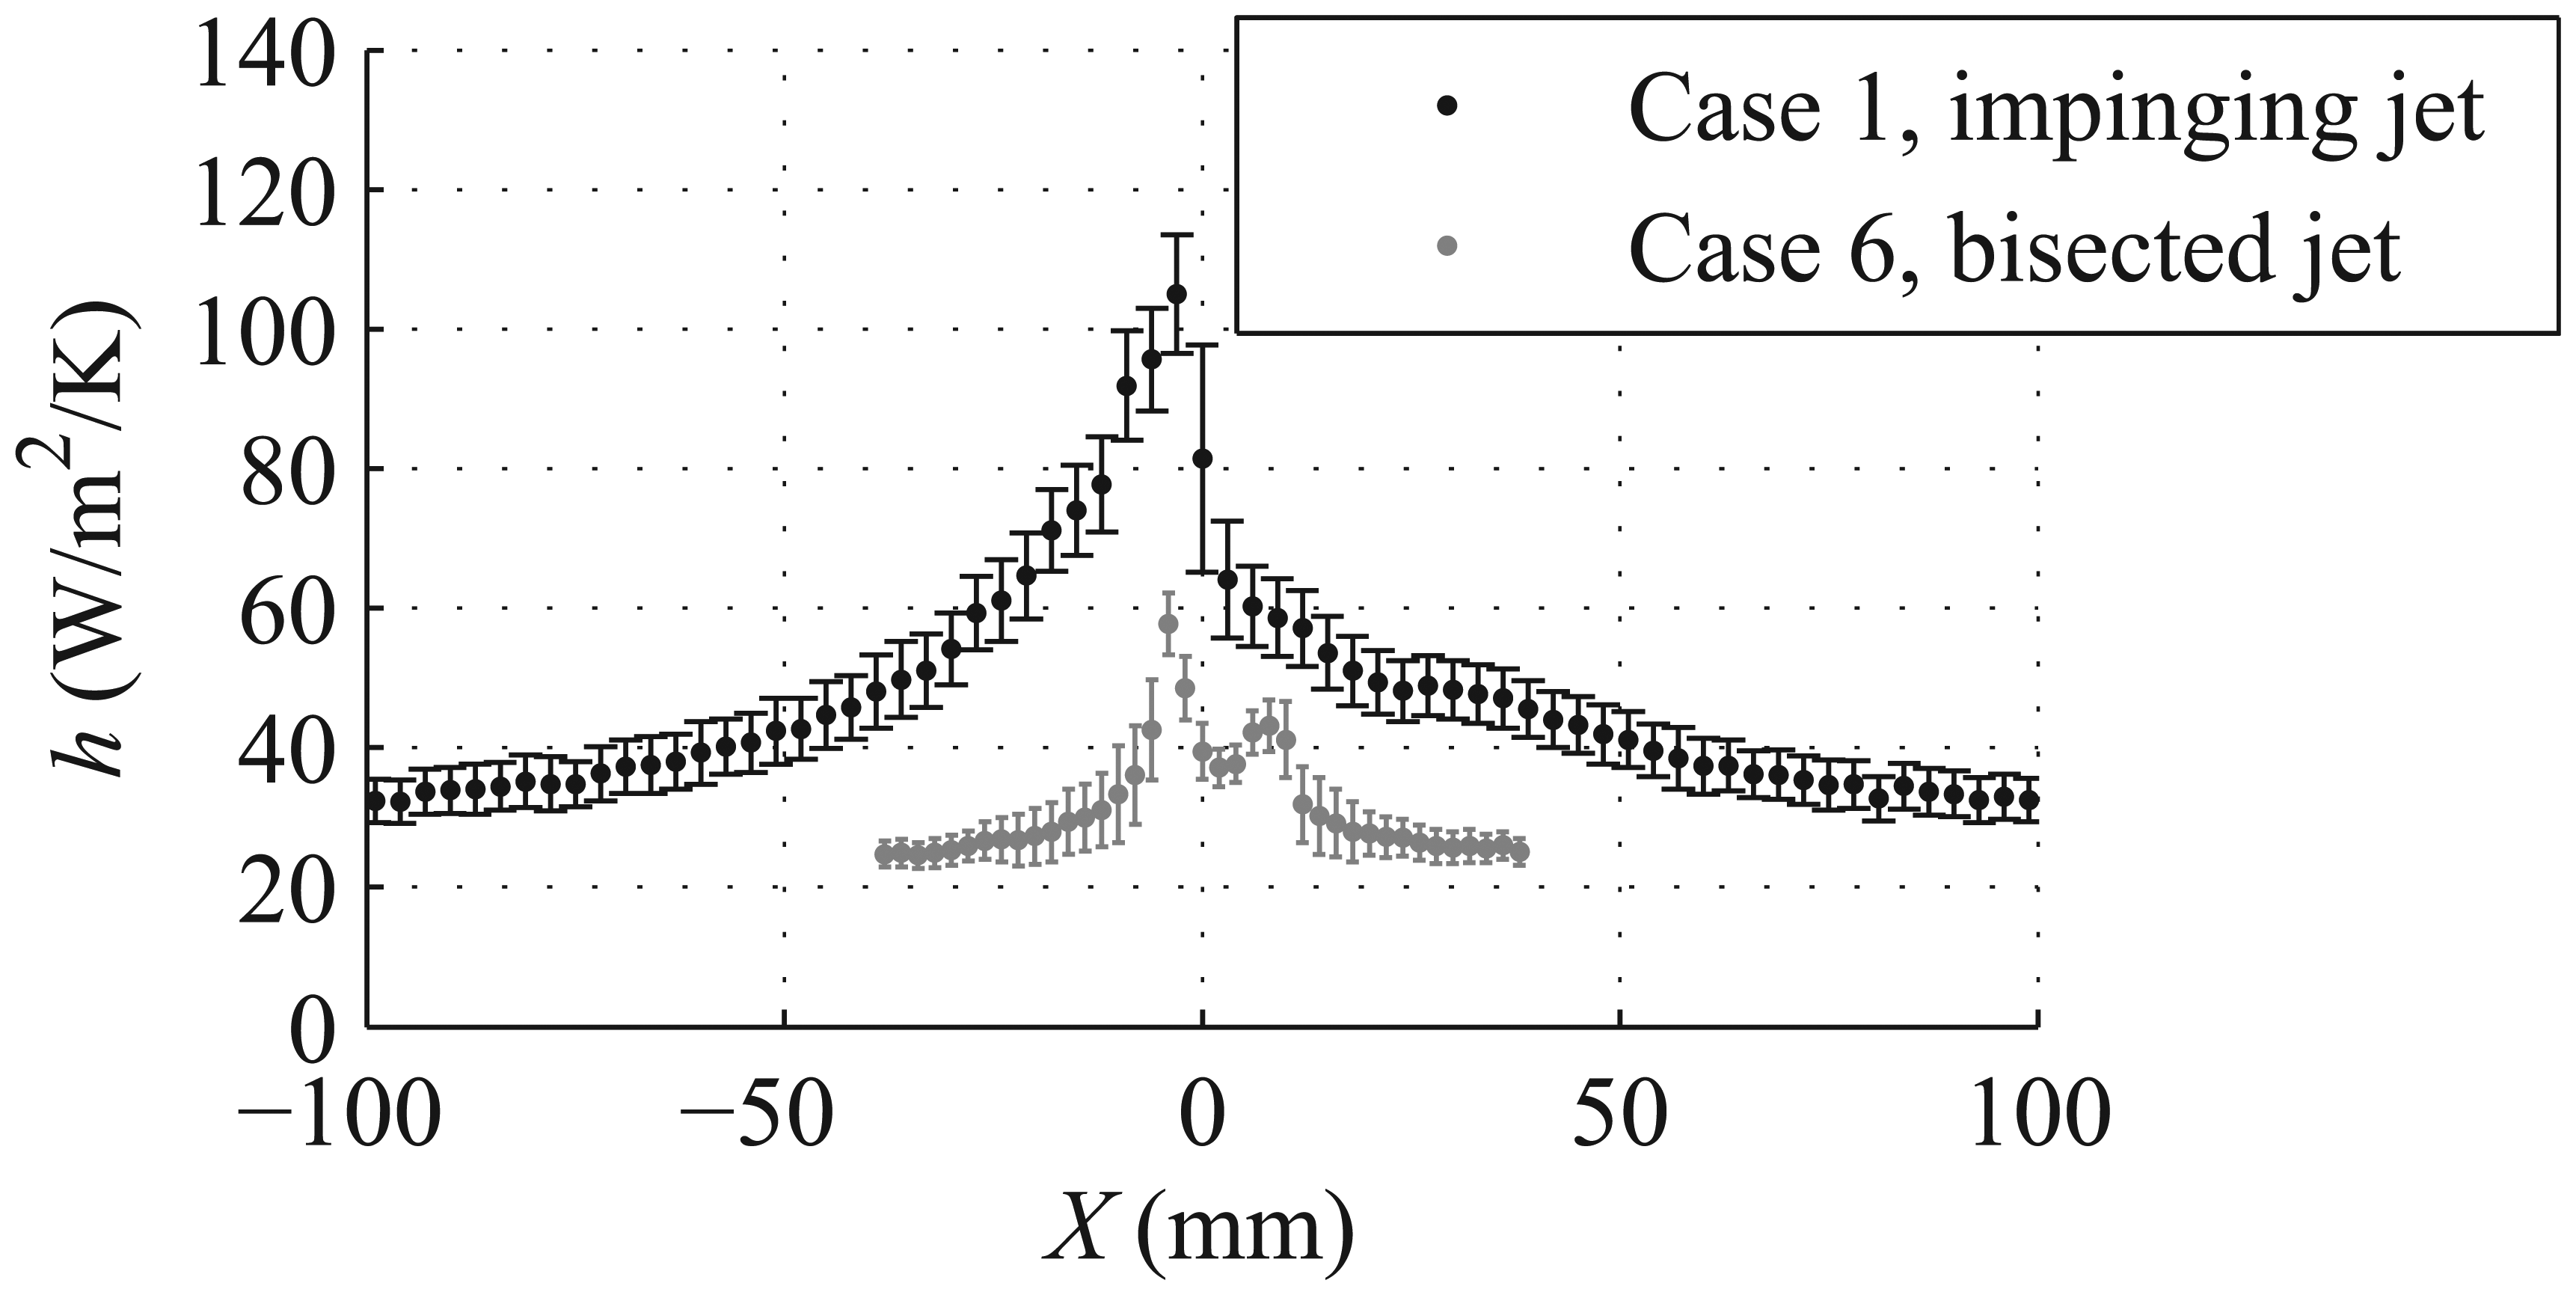
Comparison of the convection on a horizontal surface compared to the convection near the top edge of a vertical wall.
Conclusion
A method using hot-film constant voltage anemometry to measure the heat transfer from the sensor into the environment is developed to characterize the surface convection contribution from the shielding and powder delivery systems used in laser-based AM processes. Calibrations are performed, so that the coefficient of convection can be extracted from the heat transfer measurement. The distribution of the forced convection is mapped by incrementally taking measurements at different locations relative to the deposition head. By comparing its results to those obtained using a modified lumped capacitance measurement, the method is shown to be valid. The modified lumped capacitance measurement is also used to demonstrate that excluding powder during the hot-film anemometry measurement has little impact on the results.
The method is then demonstrated by characterizing the convection generated by a Precitec YC50 deposition head. It is found for this application that the distribution of convection is affected by a variety of factors:
Increasing the flow rate minimally affects the surface convection.
The surface orientation significantly affects the distribution of convection. The convection generated on a wall is more concentrated and has a lower magnitude than compared to the convection acting on a horizontal surface.
Convection is dependent upon the nozzle configuration. More convection is generated when the powder delivery flow is included in the jet, as would be used during a powder deposition, than when only the shielding jet is used, as would be used during a wire deposition.
A rough surface decreases the convection distribution.
These results are specific for the deposition head used in this study. The hot-film constant voltage anemometry method must be used to measure the convection generated by other deposition heads, since the design of other deposition heads could affect the gas flow and alter the convection distribution.
Footnotes
Declaration of conflicting interests
The author(s) declared no potential conflicts of interest with respect to the research, authorship, and/or publication of this article.
Funding
The author(s) disclosed receipt of the following financial support for the research and/or authorship of this article: J.C. Heigel is supported by the National Science Foundation under grant no. DGE1255832. This article is based upon work supported by the Office of Naval Research through the Naval Sea Systems Command under contract no. N00024-02-D-6604, delivery order no. 0611. Any opinions, findings, and conclusions or recommendations expressed in this article are those of the authors and do not necessarily reflect the views of the Office of Naval Research or the National Science Foundation.